The 5 V's of Big Data
Overview
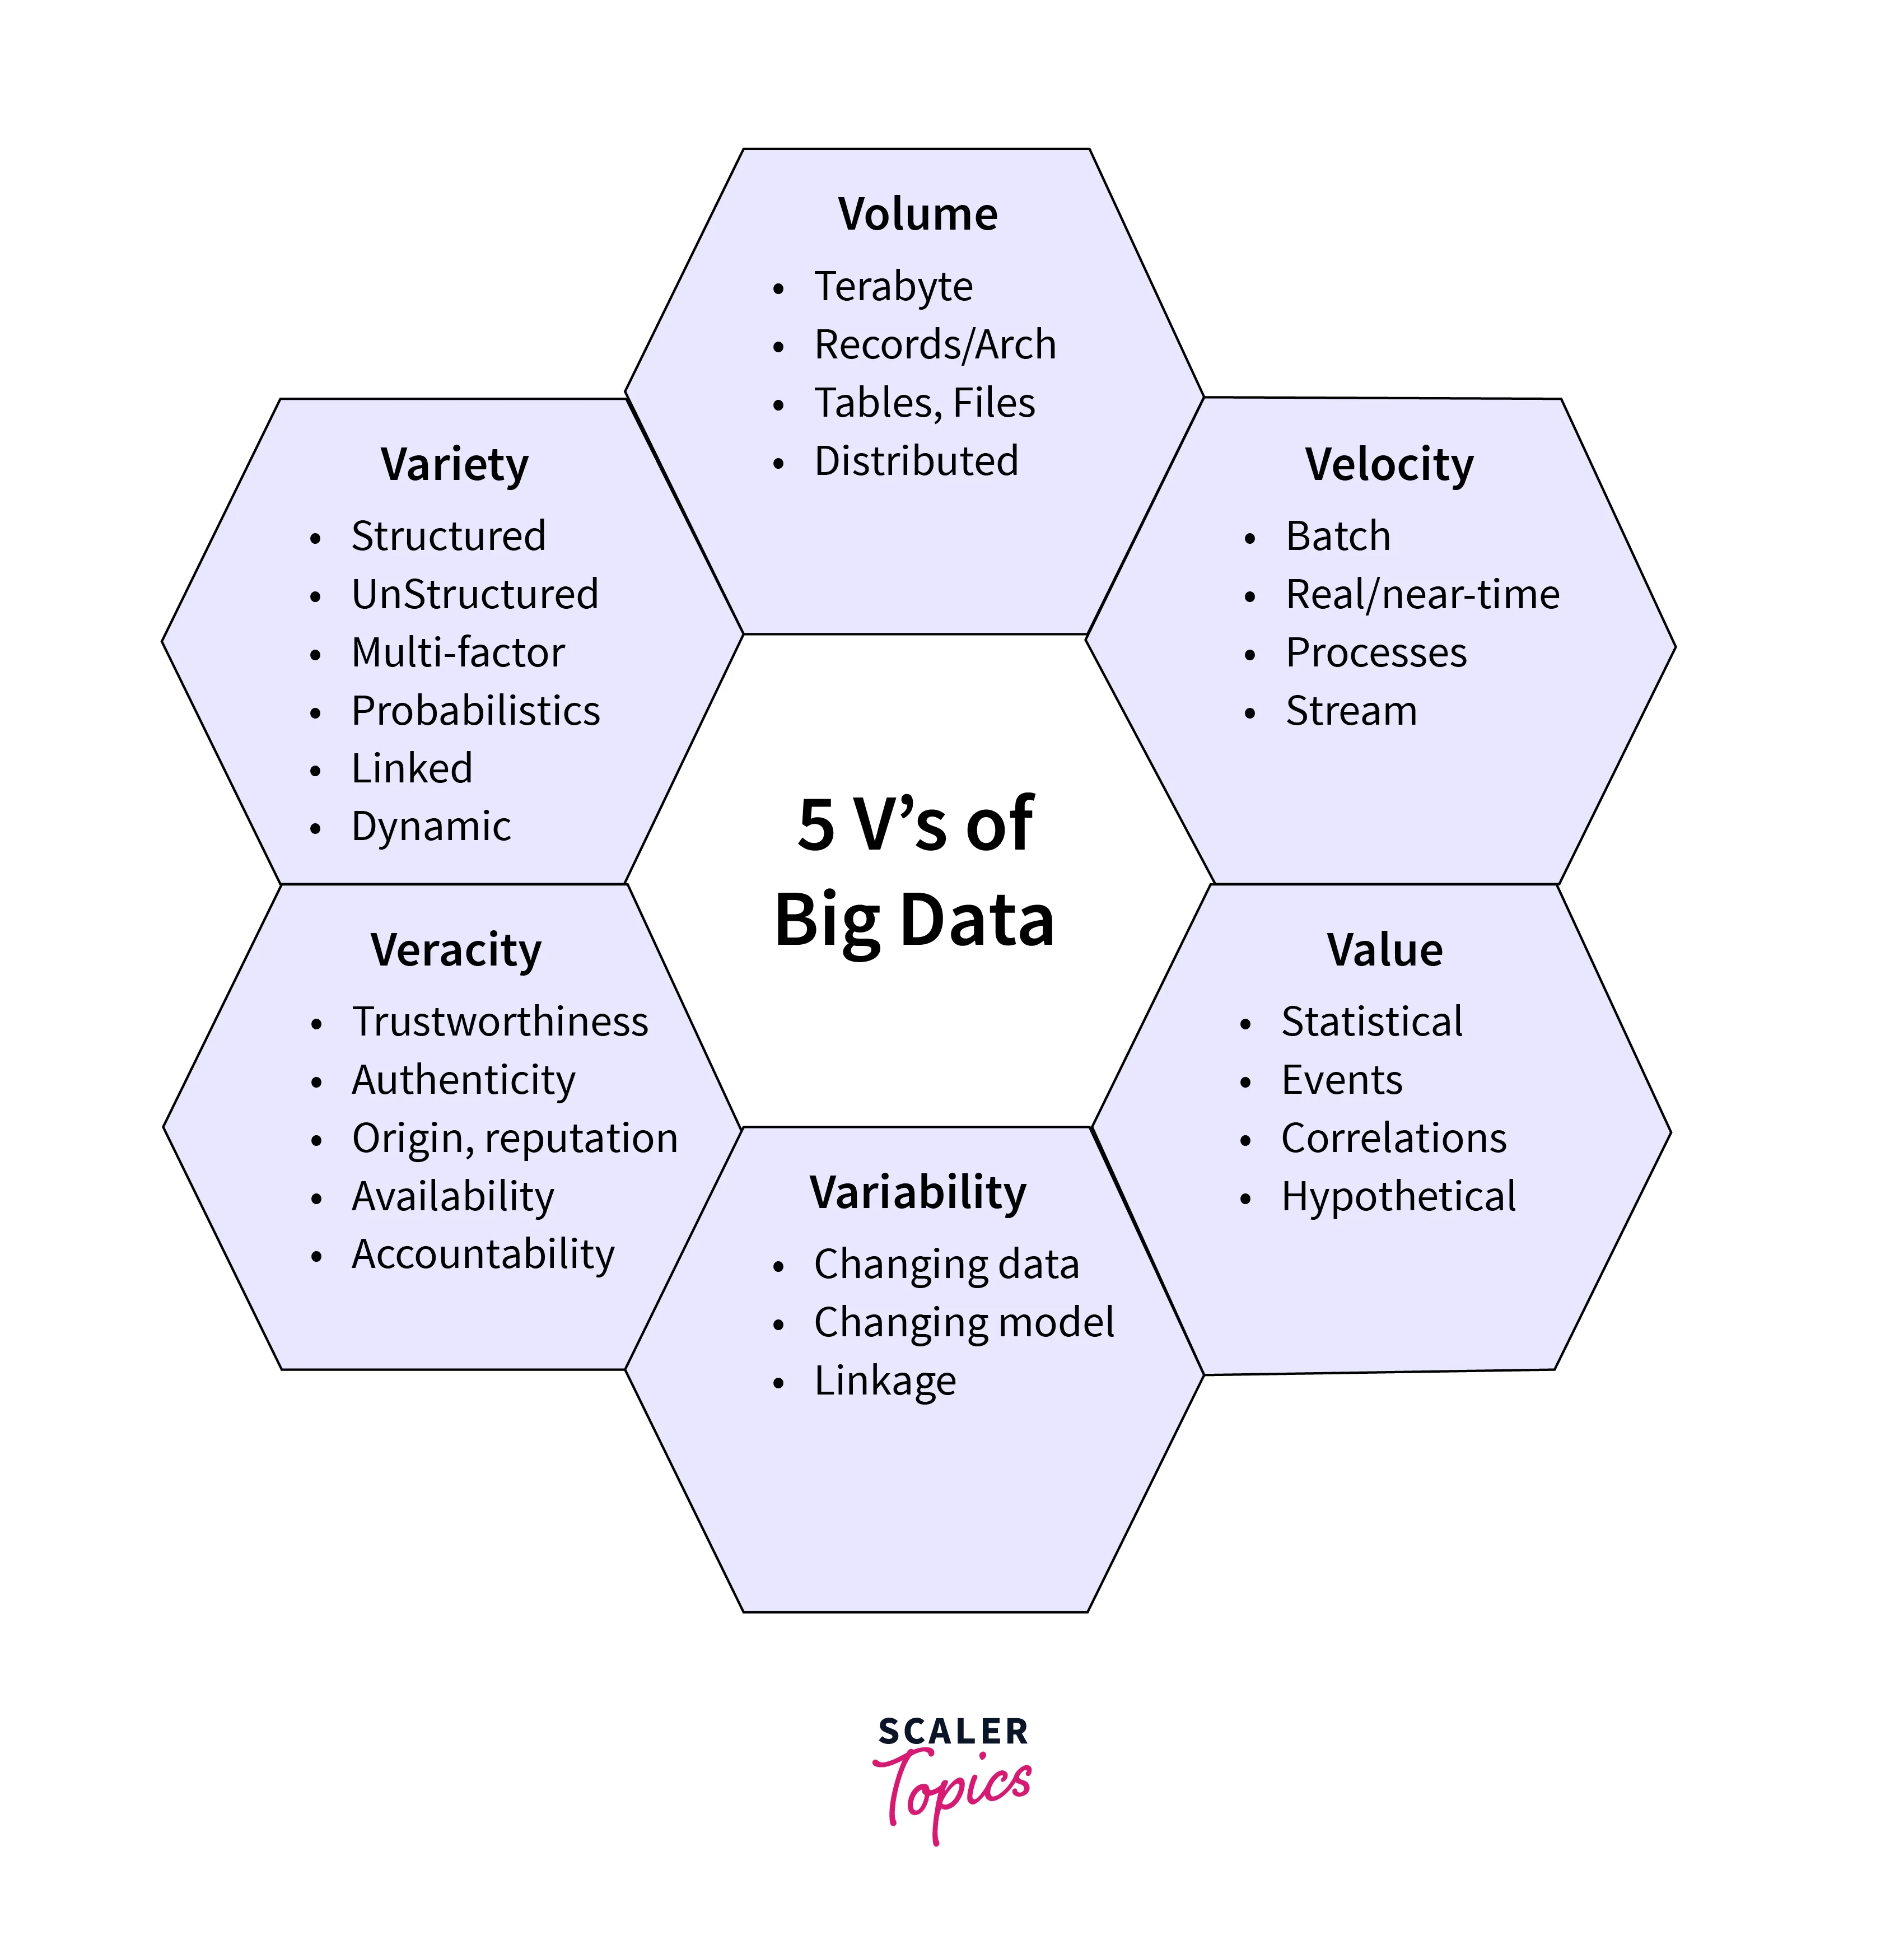
The 5 V's of Big Data can be used as a guide to understanding Big Data. Volume represents a vast amount of data, like an ocean of information. Velocity is the rate at which data is generated and processed, like a fast-flowing river. Variety captures the different forms of data, from numerical to textual. Veracity ensures the accuracy and reliability of the data, like a dependable friend. Value emphasizes that data should have significance and usefulness, like precious gems waiting to be unearthed.
What are the 5 V's of Big Data?
The 5 V's of Big Data are essential aspects that help us understand the challenges and opportunities of handling large amounts of data. These V's are Volume, Velocity, Variety, Veracity, and Value.

Here's what they mean:
-
Volume:
This refers to the amount of data generated every second. With the increase in digital interactions and devices, data accumulates quickly, creating the need for advanced storage and processing solutions.
-
Velocity:
This is about the speed at which data is generated, processed, and transformed into insights. Real-time data streams from social media and sensors require quick analysis to harness their potential.
-
Variety:
Big Data includes not only numbers but also text, images, videos, and more. Managing and making sense of this diverse data is a challenge. This variety can hold valuable insights but requires flexible tools to process effectively.
-
Veracity:
This refers to the reliability and accuracy of the data. Not all data is trustworthy; dealing with inaccuracies is crucial to making informed decisions.
-
Value:
The ultimate goal is to extract meaningful insights and Value from the data. This might involve uncovering trends, predicting outcomes, or improving decision-making.
Volume
Volume is one of the 5 V's of Big Data and refers to the vast quantity of data created and gathered from numerous sources such as social media, sensors, gadgets, and more. This information might be daunting, but it can yield significant insights if properly managed. As digital interactions rise, businesses and organizations need help storing, analyzing, and making sense of data.
Storage and processing resources must be scaled up to deal with the increased data load. Traditional databases frequently fail to manage this volume of data, prompting the development of novel alternatives such as distributed computing and cloud computing. Businesses may uncover patterns, trends, and consumer behavior by efficiently managing large amounts of data to guide strategic decisions.
Velocity
Velocity is the rate at which data is created, processed, and exchanged in real-time. Consider a river of information regularly replenished by sources such as social media updates, sensors, and online transactions.
The importance of velocity may be found in its influence on decision-making. Rapid data streams enable firms to exploit opportunities and respond to difficulties quickly. Consider monitoring social media comments before a product launch or following supply chain movements to make modifications in real time. Insights based on velocity guarantee you stay caught up.
Realizing the promise of velocity necessitates using strong tools and architecture to handle high-speed data. Technologies such as stream processing and real-time event processing are used to make sense of this data.
The message is clear: in the age of Big Data, being quick is just as important as having the data. So, embrace the velocity rhythm and allow your data journey to keep up with this growth.
Variety
Variety in Big Data refers to the diversity of data types and sources. It's like a jigsaw puzzle with varied shapes and sizes - structured, semi-structured, and unstructured data flow in from numerous sources such as social media, sensors, etc.
Emails, photos, tweets, and customer evaluations are all part of big data. Traditional databases struggle to manage this variety, but technologies such as NoSQL and Hadoop allow us to convert them into meaningful insights.
Specialized tools and algorithms are required to make sense of the heterogeneous information and translate it into meaningful insights. In a world where data is always evolving, embracing variation is critical to realizing the full potential of Big Data analytics.
Veracity
One of the critical 5 V's of Big Data, Veracity emphasizes the reliability and correctness of data.
Consider a puzzle in which each piece represents data. Each jigsaw component must be correct and fit exactly with the rest for the puzzle to make sense. Similarly, Veracity in Big Data assures that the data collected has no mistakes, inconsistencies, or misleading information.
Veracity assures quality rather than quantity. With the massive amount of data created daily, guaranteeing data accuracy becomes critical. Before reaching conclusions, resolve uncertainties, validate sources, and examine data quality.
Without Veracity, the other V's lose their significance. It is the compass that guides us through the vast sea of data, ensuring we navigate with confidence and arrive at reliable destinations.
Value
Value is the extraction of significant insights and utility from a massive sea of data. Adding Value to Big Data entails transforming raw data into usable information.
It is not enough to have data; you must also know what to do with it. This V assists firms in making educated decisions, identifying trends, and understanding client preferences.
What’s this about a 6th and 7th V?
We now know the 5 V's of Big Data: Volume, Velocity, Variety, Veracity, and Value. But have you heard of the sixth and seventh V? Let's get started!

Variability
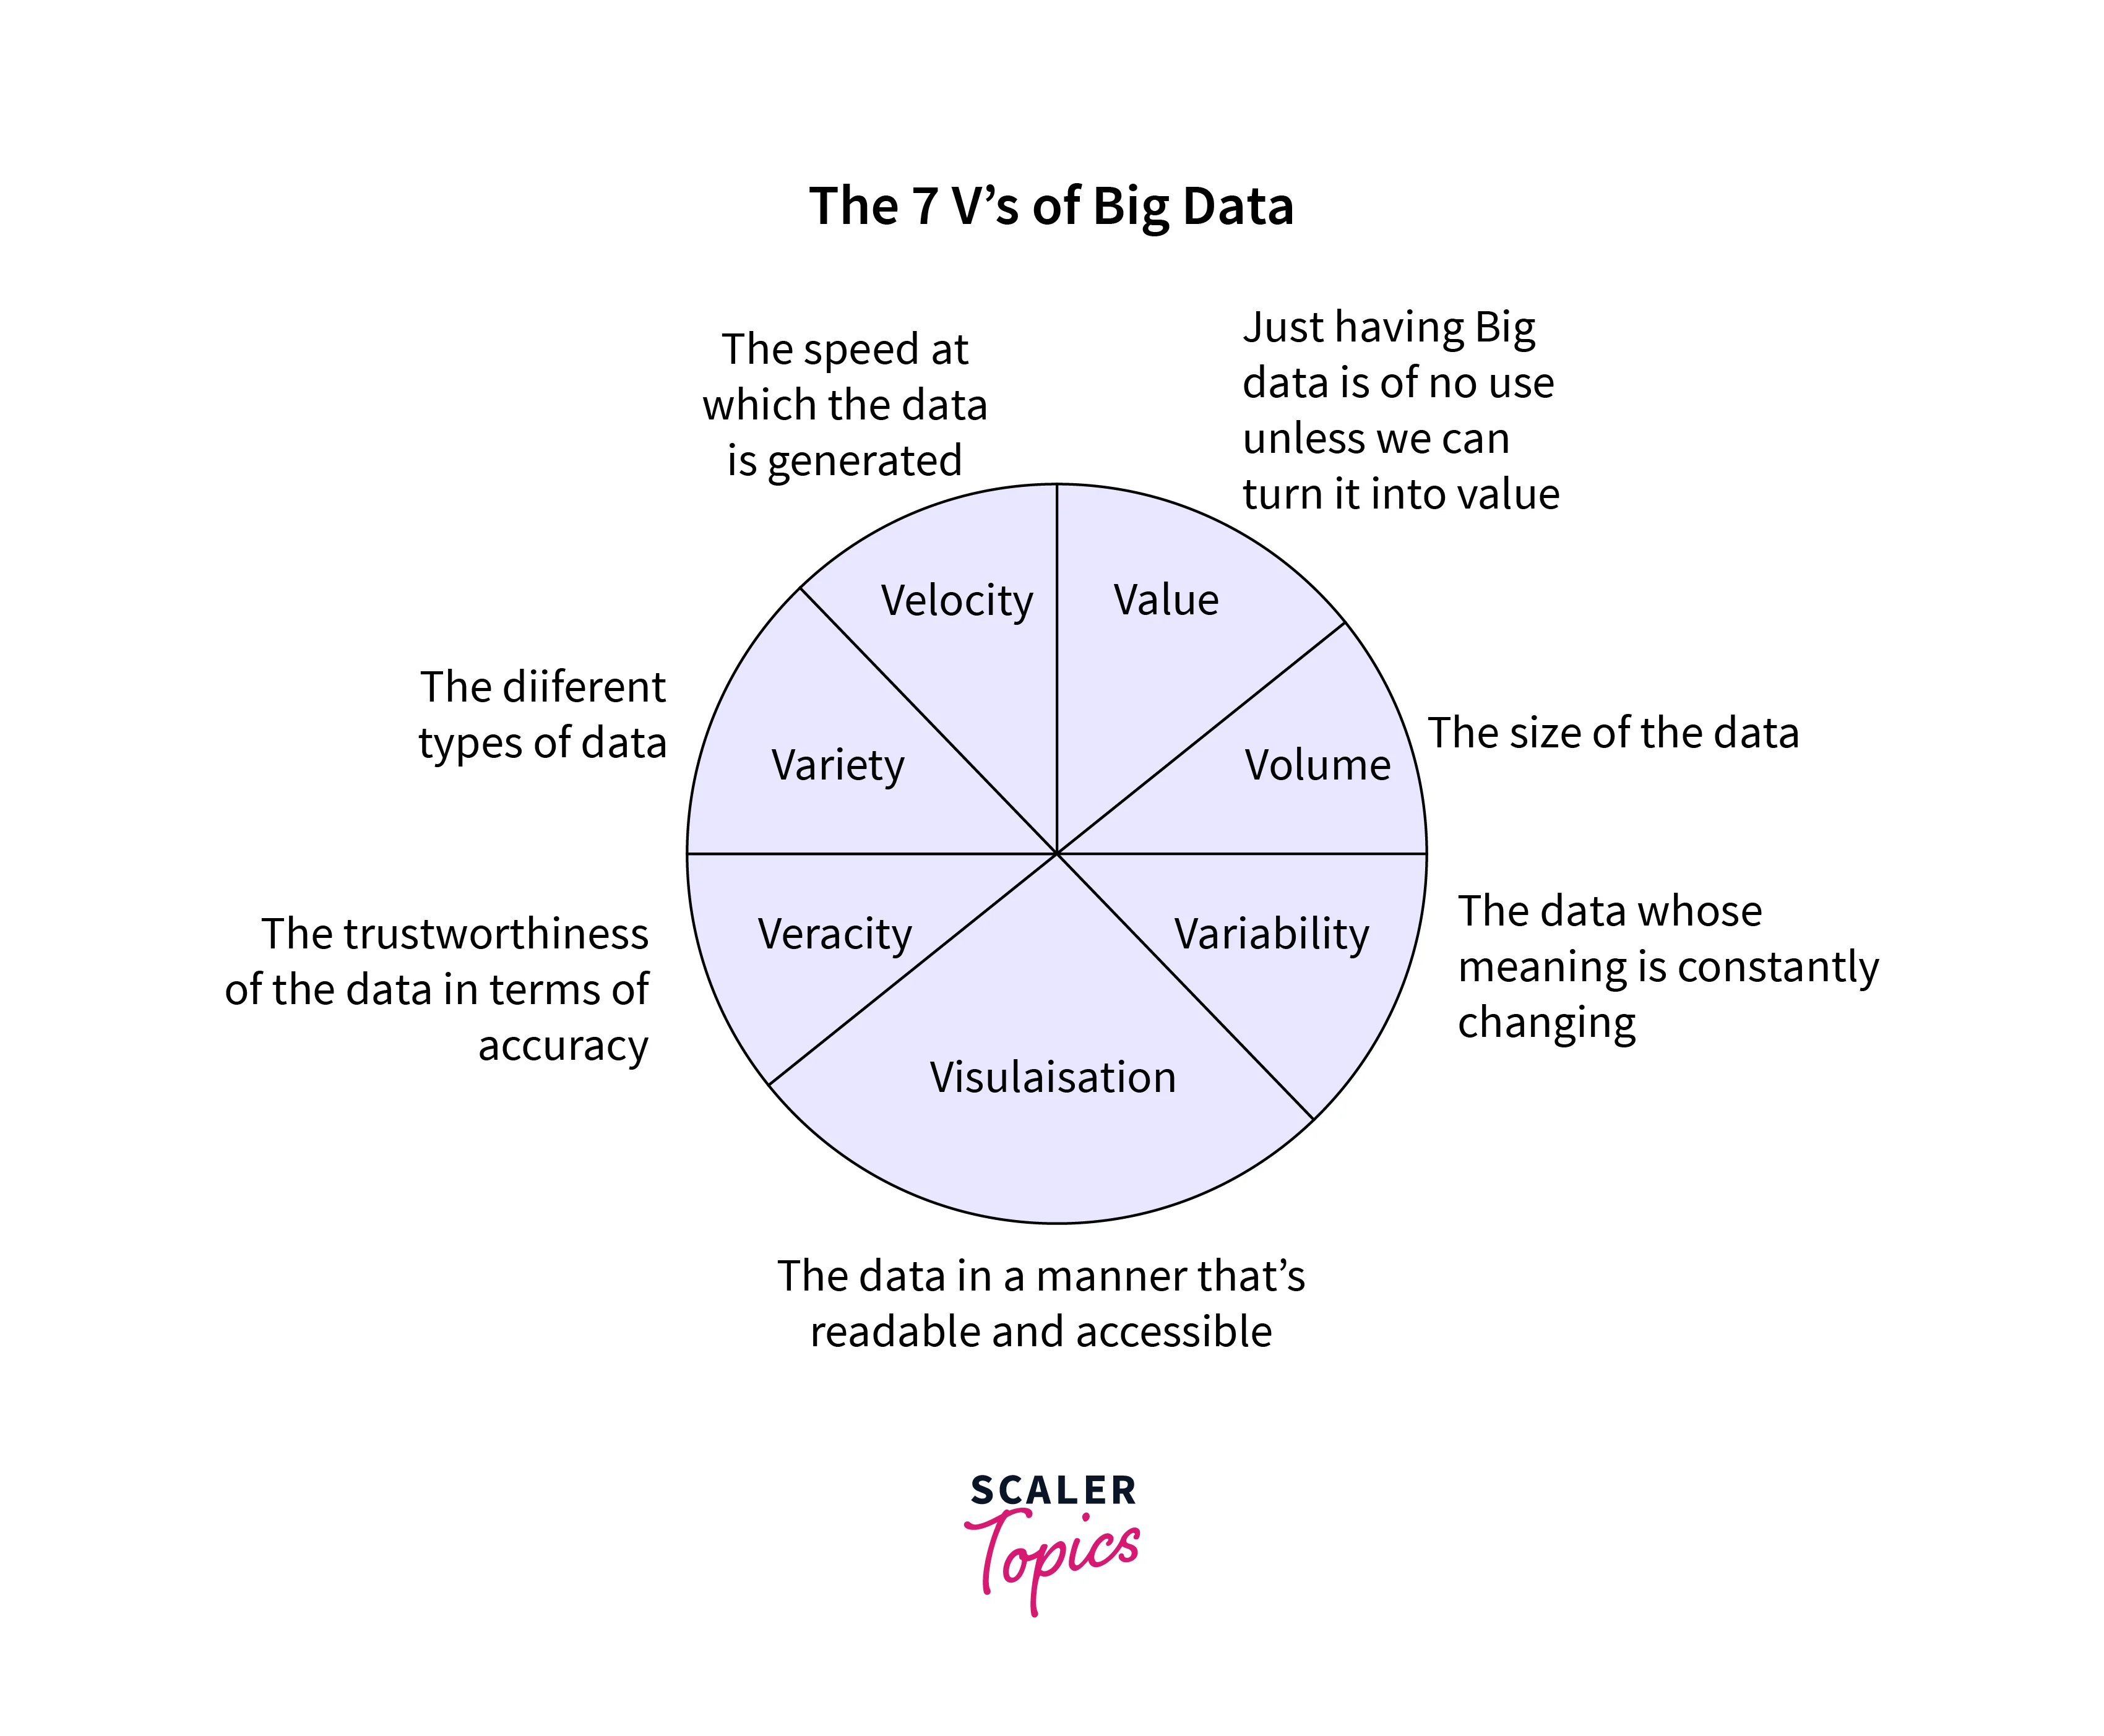
Variability, the sixth V, emphasizes data discrepancy across time. Data is only sometimes constant in our ever-changing digital ecosystem. Consider the latest social media trends or stock market swings. To make accurate forecasts and judgments, data scientists must consider the Variability in data.
Visualization
The seventh V, visualization, involves converting complicated data into visual representations such as graphs, charts, and infographics. Why is this so important? Because data visualization simplifies patterns and insights, allowing for improved communication and informed decision-making.
In a nutshell, Variability emphasizes data's ever-changing nature, whereas Visualisation reduces its complexity. Accepting these additional V's improves our capacity to extract Value from data. Remember the 6th and 7th V's the next time you crunch data - they could be the key to uncovering hidden gems in your datasets.
How would You Like to become a Data Engineer?
Is the world of data captivating to you? Take advantage of the opportunity to turn your interest in data engineering into a rewarding profession. You can lay the groundwork for data-driven insights as a data engineer.
Begin with learning programming languages such as Python and Java, and databases such as SQL and NoSQL. Knowledge of data warehousing and ETL procedures allows you to extract, transform, and load data easily. Work collaboratively with data scientists and analysts to contribute to the entire data lifecycle. As technology changes at a rapid pace, embrace continual learning. You may build a prosperous career as a skilled data engineer by honing your talents.
Conclusion
- The 5 V's of Big Data are five critical aspects that assist us in understanding the challenges and opportunities of dealing with big data.
- Volume, Velocity, Variety, Veracity, and Value are the 5 Vs of Big Data.
- Volume refers to the size of data generated every second.
- Velocity refers to the speed at which data is generated, processed, and transformed into insights.
- Variety includes the diversity in data types and sources such as text, images, videos, etc.
- Veracity refers to the reliability and accuracy of the data.
- Value is about deriving important information from the vast sea of raw data.
