Activity Diagram in UML
Unified Modelling Language (UML) diagram is a pictorial representation of a system, along with its workings, actions, roles and classes, to better visualize and document the system. One of the most important UML diagrams is the activity diagram.
Activity Diagram
Activity diagrams, simply put, are representations of flow control from one activity to another activity. The movement can be sequential, concurrent or branched. We describe how an activity occurs using activity diagrams.
The activity diagram captures the dynamic manner of the system. It shows the flow of messages from one activity to another.
But what is an activity? An activity is an operation performed by the system to achieve a particular goal. Activities need to be carried out by the system to accomplish a given task to provide a desired service.
Purpose of Activity Diagram
- To describe the flow of activities in the system.
- To show the succession from one activity to another.
- To show the different flow structures in the system (eg: concurrent, sequential, branched etc.).
Difference between activity diagram, flowchart and use-case diagram
While activity diagrams are used to show the behaviour of the system, flowcharts are used to show the step by step procedures taken by the system to approach a solution.
Take for example the example of a patient being admitted to a hospital. The patient will need to be diagnosed, examined, tested, treated, etc. before being discharged. A flowchart for the above description would be:

A simple step by step process that shows what happens from when the patient is admitted to when he is discharged.
Now an activity diagram for the same could be:
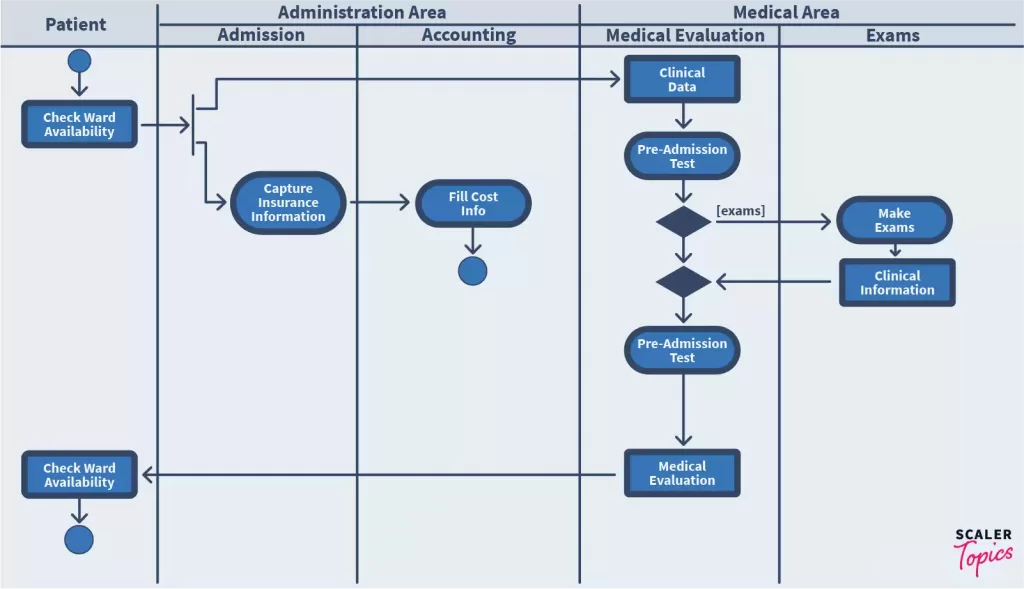
Now this diagram shows an in-detailed flow of what happens to the patient from being admitted to being discharged. The processes that take place in the administration area and the medical area are clearly demarcated by swimlanes, and the activities that take place are clearly shown pictorially using the components.
The figures in the activity diagram have intrinsic meaning, whereas those in the flowcharts don’t.
An additional difference is that activity diagrams help to understand the business process or workflow of the system, whereas flowcharts help design and analyze a problem.
Another diagram that is frequently compared with the activity diagram is the use case diagram. While the activity diagram focuses on the workflow of the system, use case diagram shows interaction between the user and the system.
Use case diagrams show the possible interactions between the user and the system, i.e. it shows what all possible things the user can do with the system, and how the system reacts to those inputs. The diagrams show the high level functionalities of the system.
Taking an example of the hospital staff that takes care of the administrative work, the use case diagram for it can be:
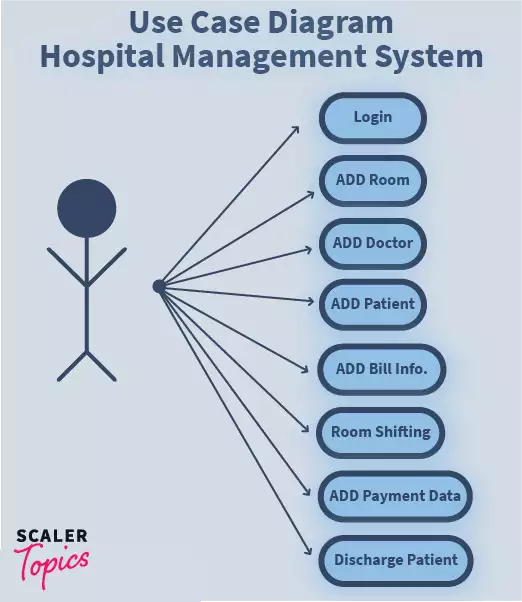
Use case diagrams simply show the different processes users can do with the system, and the list of users that can interact with the system. The use cases are represented by ellipses, and the users are represented as stick figures. These diagrams can show the developers and management how the system will be designed in a simplistic way.
The above diagram simply shows how the user, the hospital staff, can interact with the system.
Components of an Activity Diagram
The components of an activity diagram essentially control the workflow of the diagram. Think of components in the diagram as traffic objects like signals, road markings, zebra crossings and traffic cones. Each controls the way in which activities on the road are taking place to ensure smooth flow of traffic. Components in an activity diagram include:
i) Activities:
The classification of behaviour into actions is called activity. They are a network of nodes connected by edges. The edges show how the flow of execution occurs.
Nodes are of 3 types: action, control and object nodes. They represent action, control flow of activity and objects used inside the activity respectively.
Activities can be denoted as the following:

ii) Activity partition / swimlane:
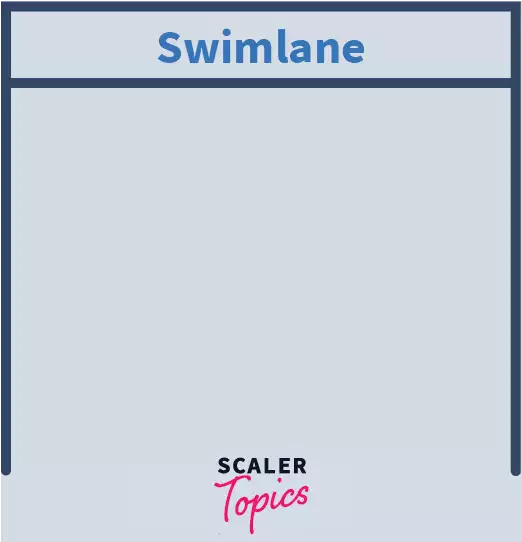
Swimlanes are used to group together related activities in one row or one column, depending on horizontal or vertical flow. Adding swimlanes helps in bringing comparable activities together.
For example in our hospital example that we’ve taken earlier, operations that are to be done by the patient, such as signing consent forms, and operations that are to be done by the doctor, such as the operation, can be split into two different swimlanes labelled ‘Patient’ and ‘Doctor’.
Swimlanes are represented as the following:
iii) Forks and Joins:
Forks and joins are used to enable concurrent flow inside activities.
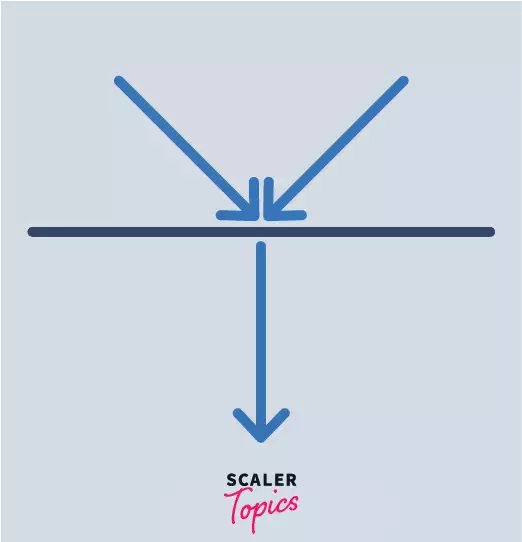
A fork has one incoming edge and multiple outgoing edges The incoming edge denotes information being received by the fork, and the multiple outgoing edges denote the information being copied that many times to form parallel processes.
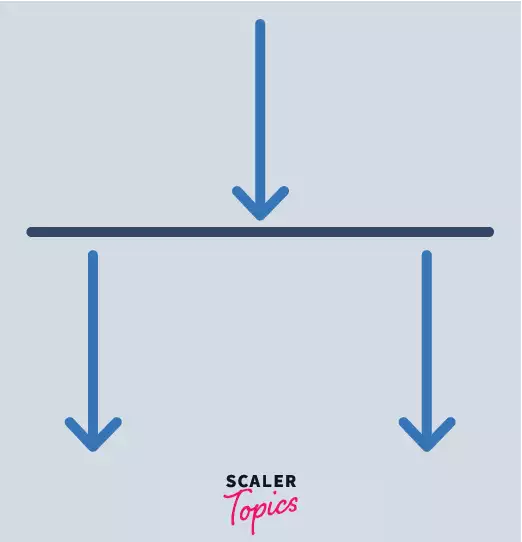
A join on the other hand, is the opposite of a fork. Multiple parallel edges combine to form one single edge. It essentially combines all the concurrent activities and re-introduces them to the flow with only one activity occurring. The join performs logical AND operation(∧) on all the incoming nodes to output a single node.
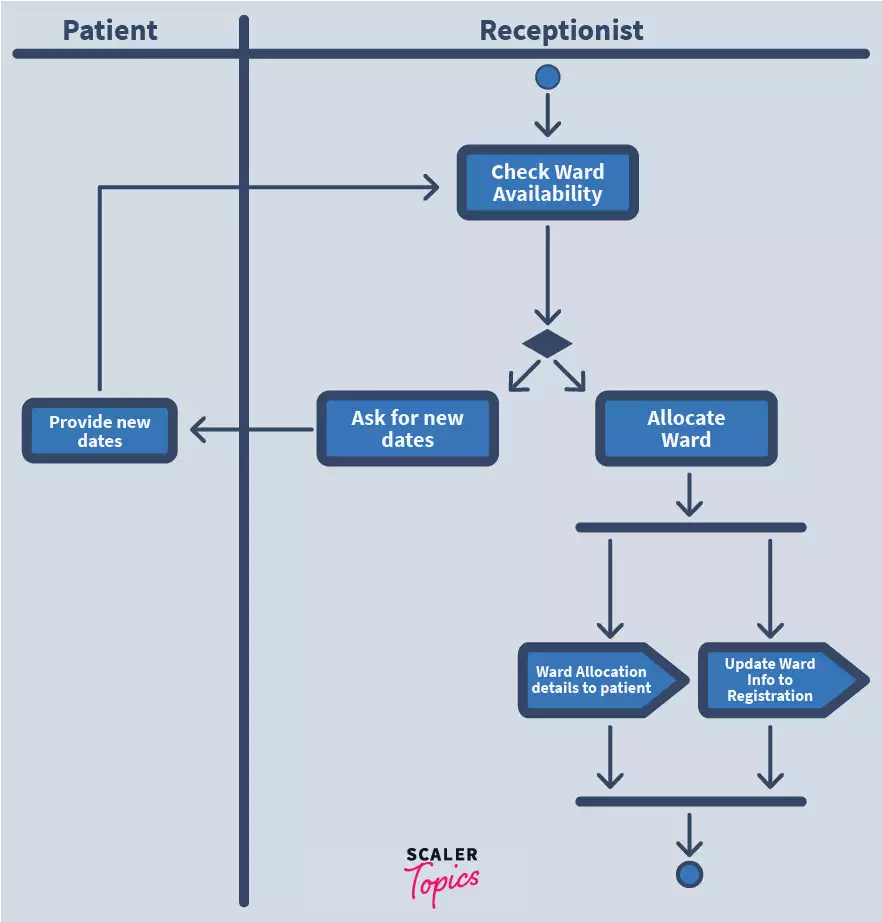
For example- a receptionist at the frontdesk may check for available wards and see if the patient can be admitted. Once the receptionist confirms that there are available wards in the hospital, he/she will then have to give the details of the ward to the patient and update the information related to the ward in the computer at the same time. This can be shown in an activity diagram as follows:
iv) Pins:
They’re used to manage the flow of execution of activities to prevent the diagram from getting too complicated. It is an object node that shows an input to or output from an action.
Both input and output pins have exactly one edge.

While components can be considered as elements of traffic control, the flow of activity cannot take place unless decisions are acted upon. This is where activity diagram notations come in.
Activity Diagram Notation
Activity diagram notations are symbols that have intrinsic value, i.e. these are symbols that have meanings on their own and don’t change them based on workflow. They are the main component of the activity diagram that indicate the activities which make up the modeled processes.
Some of the notations include:
i) Initial State:
The initial state shows the starting point of the diagram. It is represented by a circle filled in black, with an arrow pointing to the next action.

ii) Action State:
Action state represents actions that are performed by objects. It is pictorially denoted as a rectangle with rounded edges.

iii) Decision Box:
A decision box represents a decision to be made, with each decision leading to a different outcome. It is depicted as a diamond. The outgoing choices need to be labelled with a condition or boolean expression.

iv) Synchronization:
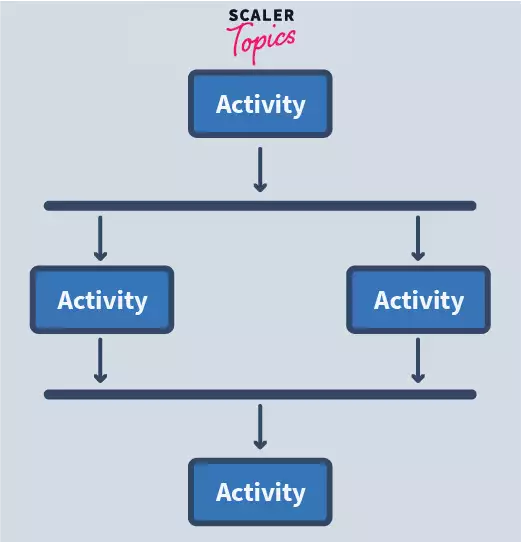
Forks and joins are the two synchronization techniques used in activity diagrams. They’re both represented by a thick horizontal line. They’re differentiated by the direction of the activity flow.
As mentioned above, a fork node splits one incoming node into multiple parallel nodes, and join nodes join multiple concurrent incoming nodes into one single output.
v) Final State:
The final state represents the end of the activity diagram. It is depicted by two concentric circles, with the inner one filled.

The difference between activity diagram components and notations are that the components are used to show the intermediary activities that are needed to reach the final state from the initial state, along with showing the constraints and conditions that need to be satisfied for activities to take place.
Activity notations on the other hand simply show the activities that are occurring at that particular point.
How to draw an activity diagram?
Activity diagrams differ for each system based on the activities that can/are to be done. While each activity diagram is different from another based on its components, a few points that are universal in all diagrams are worthy of being noted:
- All activity diagrams begin with that start point or initial state. For the viewer to visualise it easily, they’re usually drawn either at the top or to the top-left of the diagram.
- All activity diagrams need to end with at least one final state. The number of final states depend on the activities that are occurring in the system, but having at least one is mandatory.
- The decision that is to be taken in the decision box must be clearly stated, and must have all the options clearly mentioned next to their respective arrows.
- Activities to be done by different users or different situations need to be clearly demarcated using swimlanes. For example, activities done by the receptionist and patient are clearly demarcated in the diagram we saw above. This needs to be done even if it breaks the flow of the activities.
- Activities can be repeated using decision boxes and loops. This repetitive sequence can cut down on the number of activity symbols that need to be drawn.
With these points, we can see that all activity diagrams that are ever drawn follow a few basic rules. These rules help in keeping track of all the activities that are occurring in our system.
Usages of activity diagrams
Some of the most common usage of activity diagrams are:
- Model the workflow pictorially. As we can see in the hospital management system above, the structure of activities can be visualized at once, and traced out without having to refer to many different paragraphs at once. The entire system can be seen from a high level in one glance
- Depict the execution flow between various processes. Using activity diagram notations, we can see the flow of executions between various activities such as the system displaying the patient information to the receptionist verifying the patient info.
- Depict the dynamic behaviour of the system. Using conditions and flow control, we can show what the system does when an activity satisfies a certain condition.
Conclusion
Activity diagrams are a way to graphically depict the workflow of a system, along with its dynamic behaviours and various processes.
Activities are divided into multiple actions, each performing a task that leads to a desirable outcome. The activity diagrams provide a high level view of the entire system that models the working of the software. Swimlanes are used to group similar processes together, and forks and joins are used to show the concurrent activities of the software.
