Analysis of Covariance in R
Overview
ANCOVA in R, or Analysis of Covariance, is a powerful statistical method that combines aspects of analysis of variance (ANOVA) and regression analysis. It is employed to assess group mean differences while taking into account the influence of continuous covariates. ANCOVA is particularly valuable when researchers need to control for variables that might confound the interpretation of their results. This technique allows us to determine whether there are significant differences in the means of dependent variables among various groups, even when considering the potential impact of covariates.
Introduction
In the world of statistics and data analysis, we often come across situations where we want to compare groups, but things aren't as straightforward as they seem. This is where ANCOVA in R, or Analysis of Covariance, comes into play as a handy tool. What makes ANCOVA unique is its ability to consider the impact of continuous covariates.
A covariate is like a side player in your dataset. It's a variable that might be affecting your main analysis, and you want to control for its influence.
Imagine you're studying the effect of a new teaching method (our main variable of interest) on students' test scores. But you also know that students' prior knowledge (the covariate) could affect their scores. ANCOVA in R lets you examine the teaching method's impact while adjusting for students' prior knowledge.
ANCOVA Design and Assumptions in R
To truly harness the power of ANCOVA in R, we need to understand its design and the important assumptions it relies upon.
Design:
ANCOVA in R is your go-to tool when you have a categorical independent variable (often called a factor) and one or more continuous covariates. This design allows you to explore whether groups differ significantly in terms of a dependent variable while considering the influence of those covariates.
For instance, imagine you want to find out if different teaching methods (your factor) affect students' test scores (the dependent variable) while taking into account their previous knowledge (a continuous covariate).
Assumptions:
Now, let's talk about the assumptions. ANCOVA, like any statistical method, relies on some critical assumptions:
- Normality of Residuals: The residuals, which are the differences between the observed data and what your ANCOVA model predicts, should follow a normal distribution. This assumption ensures that your results are trustworthy.
- Homogeneity of Variances: The variances of the residuals should be roughly equal across all groups. When the variances differ significantly, it can affect the validity of your ANCOVA results.
- No Outliers: Outliers are data points that stand out from the rest. They can skew your results, so it's essential to identify and deal with them if they exist.
One-way ANCOVA in R
One-way ANCOVA in R is a statistical technique used in R to compare the means of a dependent variable across two or more groups while considering the influence of one or more continuous covariates. It combines elements of both analysis of variance (ANOVA) and regression analysis.
The key idea behind one-way ANCOVA in R is to determine whether there are significant differences in group means on a dependent variable, even after accounting for the impact of a covariate.
In one-way ANCOVA in R, you have:
- A categorical independent variable (often called a factor), representing the groups you want to compare.
- One or more continuous covariates, representing variables that might influence the dependent variable.
Data preparation
In this section, we prepare the data for our one-way ANCOVA analysis using the example dataset from the datarium package. The dataset contains information about anxiety levels before and after an exercise program among three different groups. We select relevant columns, rename them, and inspect a random row from each group to ensure proper data preparation.
Output:
Assumptions
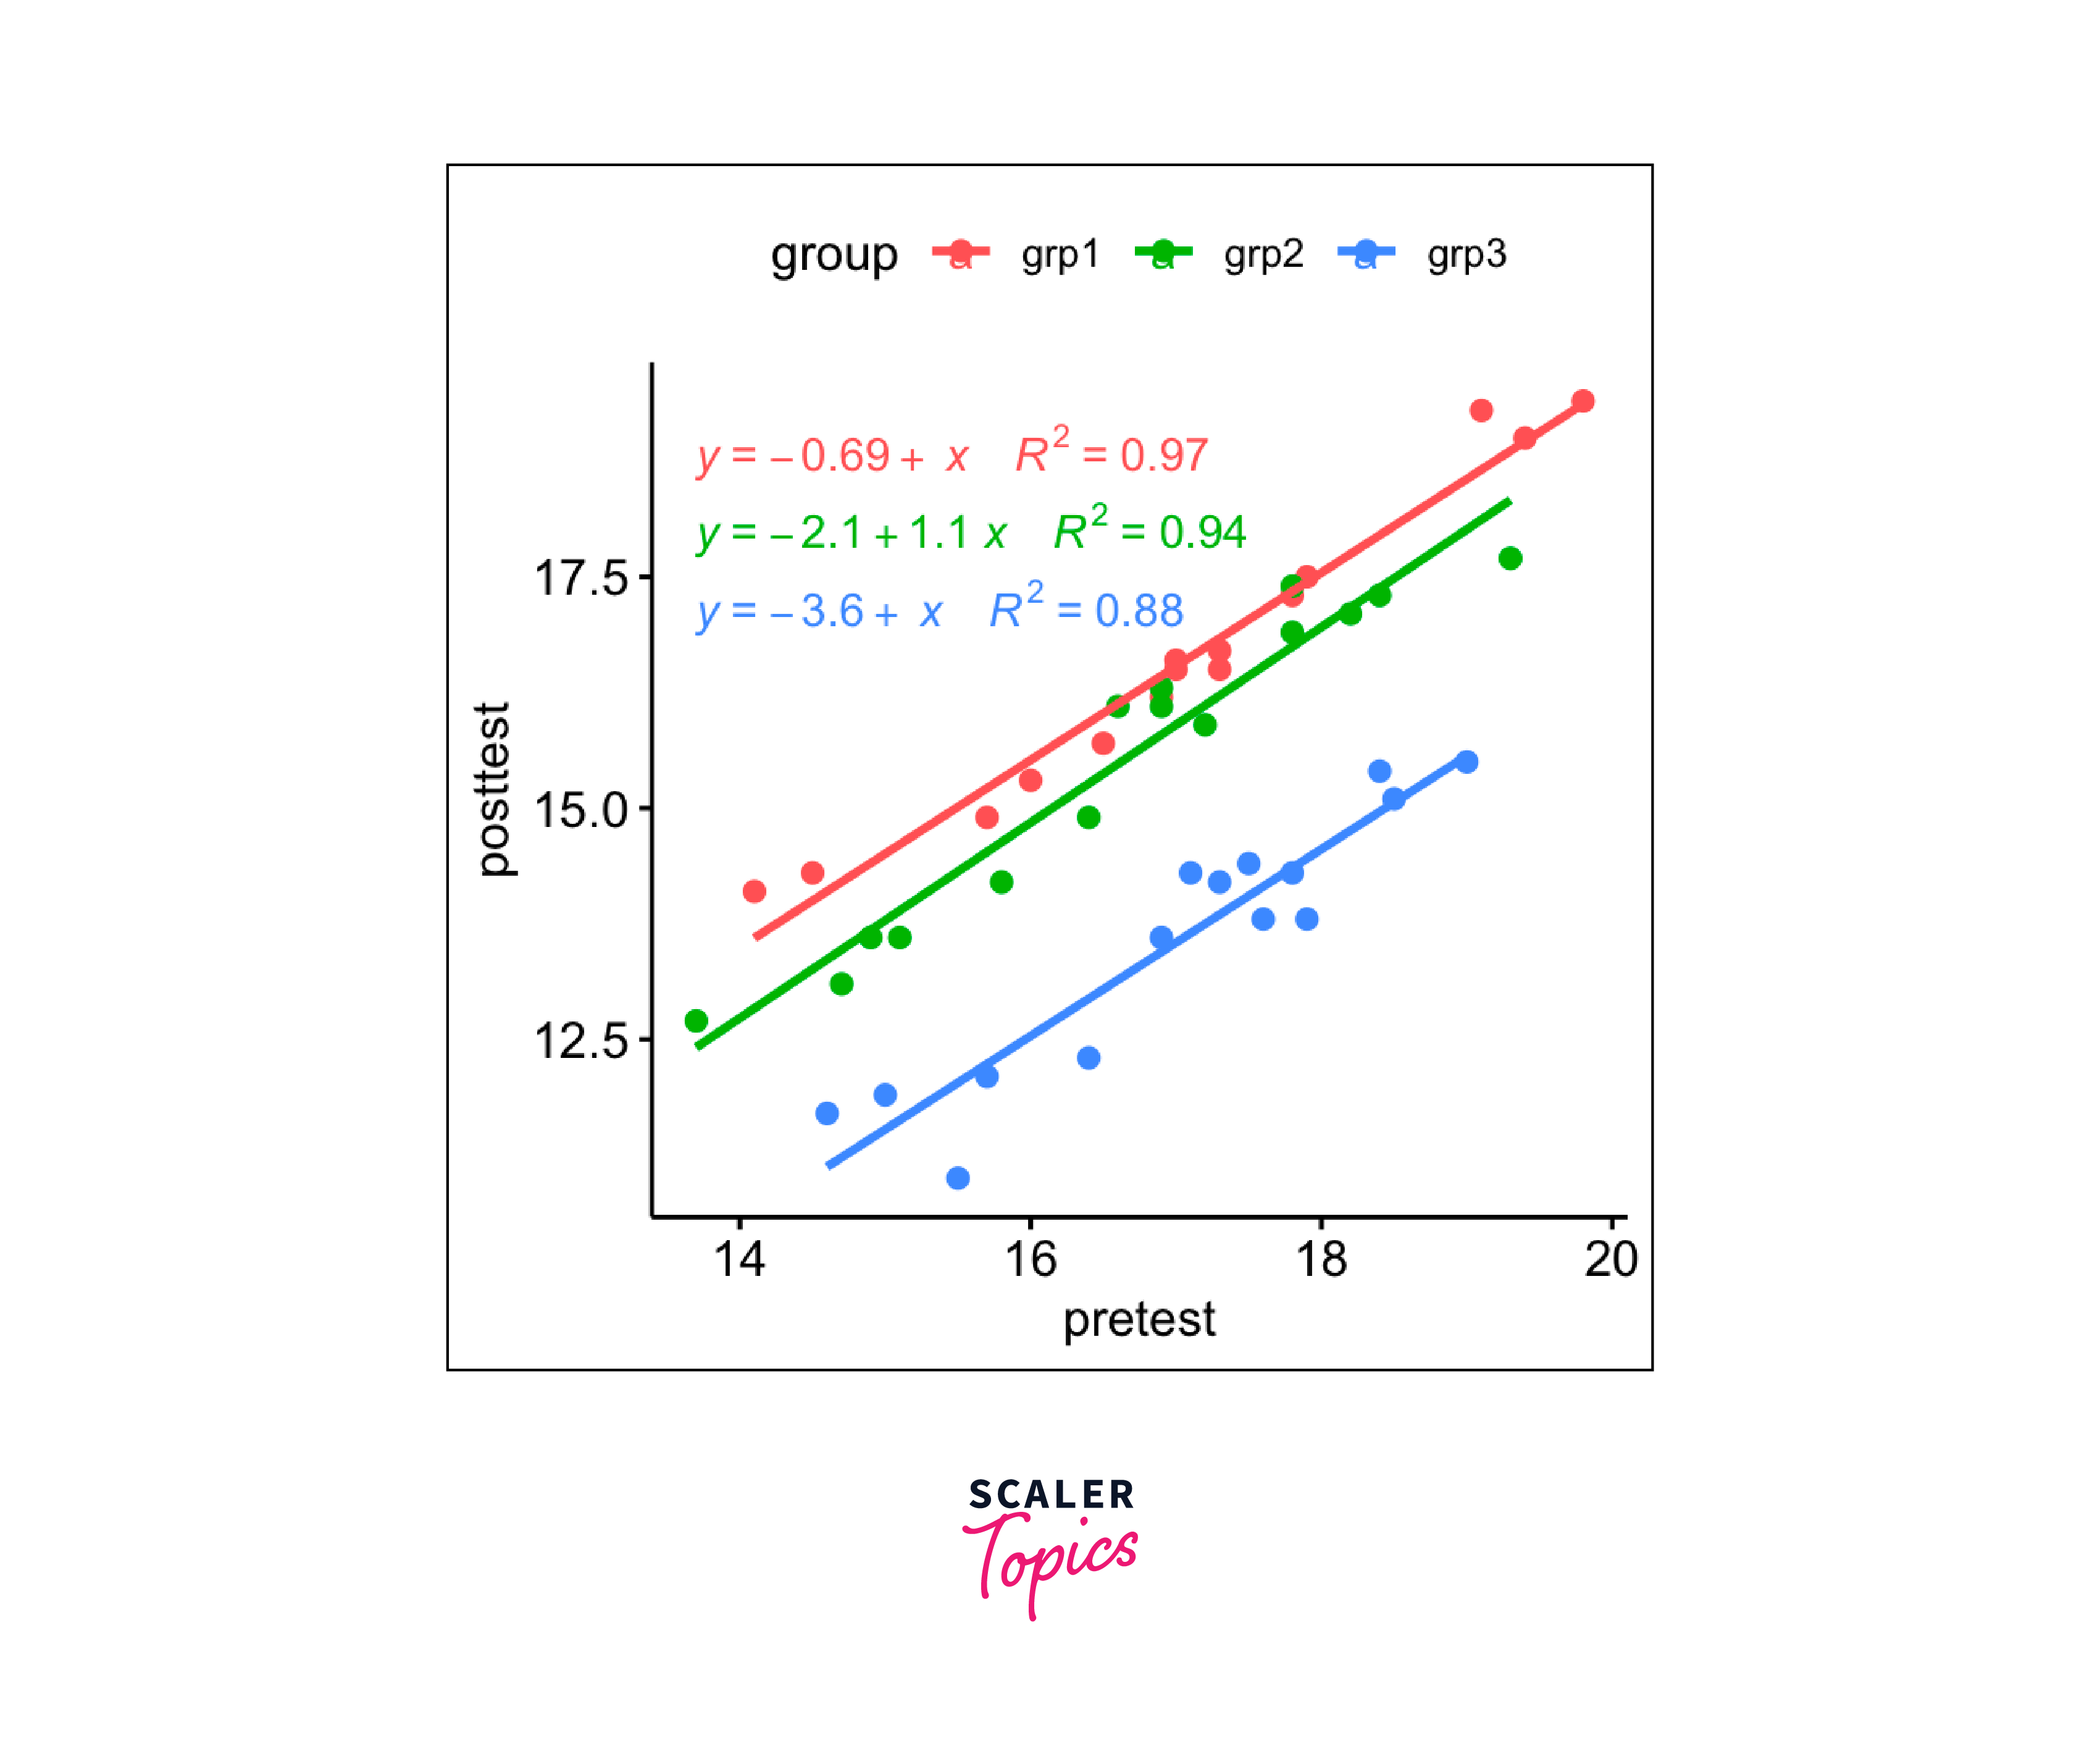
To check the linearity assumption, we create scatter plots between the covariate (pretest) and the outcome variable (posttest) for each group. We add regression lines, equations, and R-squared values to visualize the linear relationships.
Output:
Normality of residuals
Normality of residuals is checked using the Shapiro-Wilk test on the residuals obtained from the ANCOVA model. We'll name the resulting metrics as model.metrics, which contains valuable regression diagnostic information.
Output:
Output:
Homogeneity of variances
This assumption is verified using Levene's test.
Output:
Outliers
Detecting outliers involves scrutinizing the standardized residuals (or studentized residuals), where each residual is divided by its estimated standard error. These standardized residuals can be understood as measurements indicating how many standard errors a data point deviates from the regression line.
Output:
How to compute One-way ANCOVA?
The actual computation of the one-way ANCOVA in R is performed here, where the covariate (pretest) is controlled before entering the main variable of interest (group).
Output:
How to compute Post-hoc test in One-way ANCOVA?
Pairwise comparisons are performed to identify which groups are different, and the Bonferroni multiple testing correction is applied using the emmeans package.
Output:
Output:
Interpreting ANCOVA Results
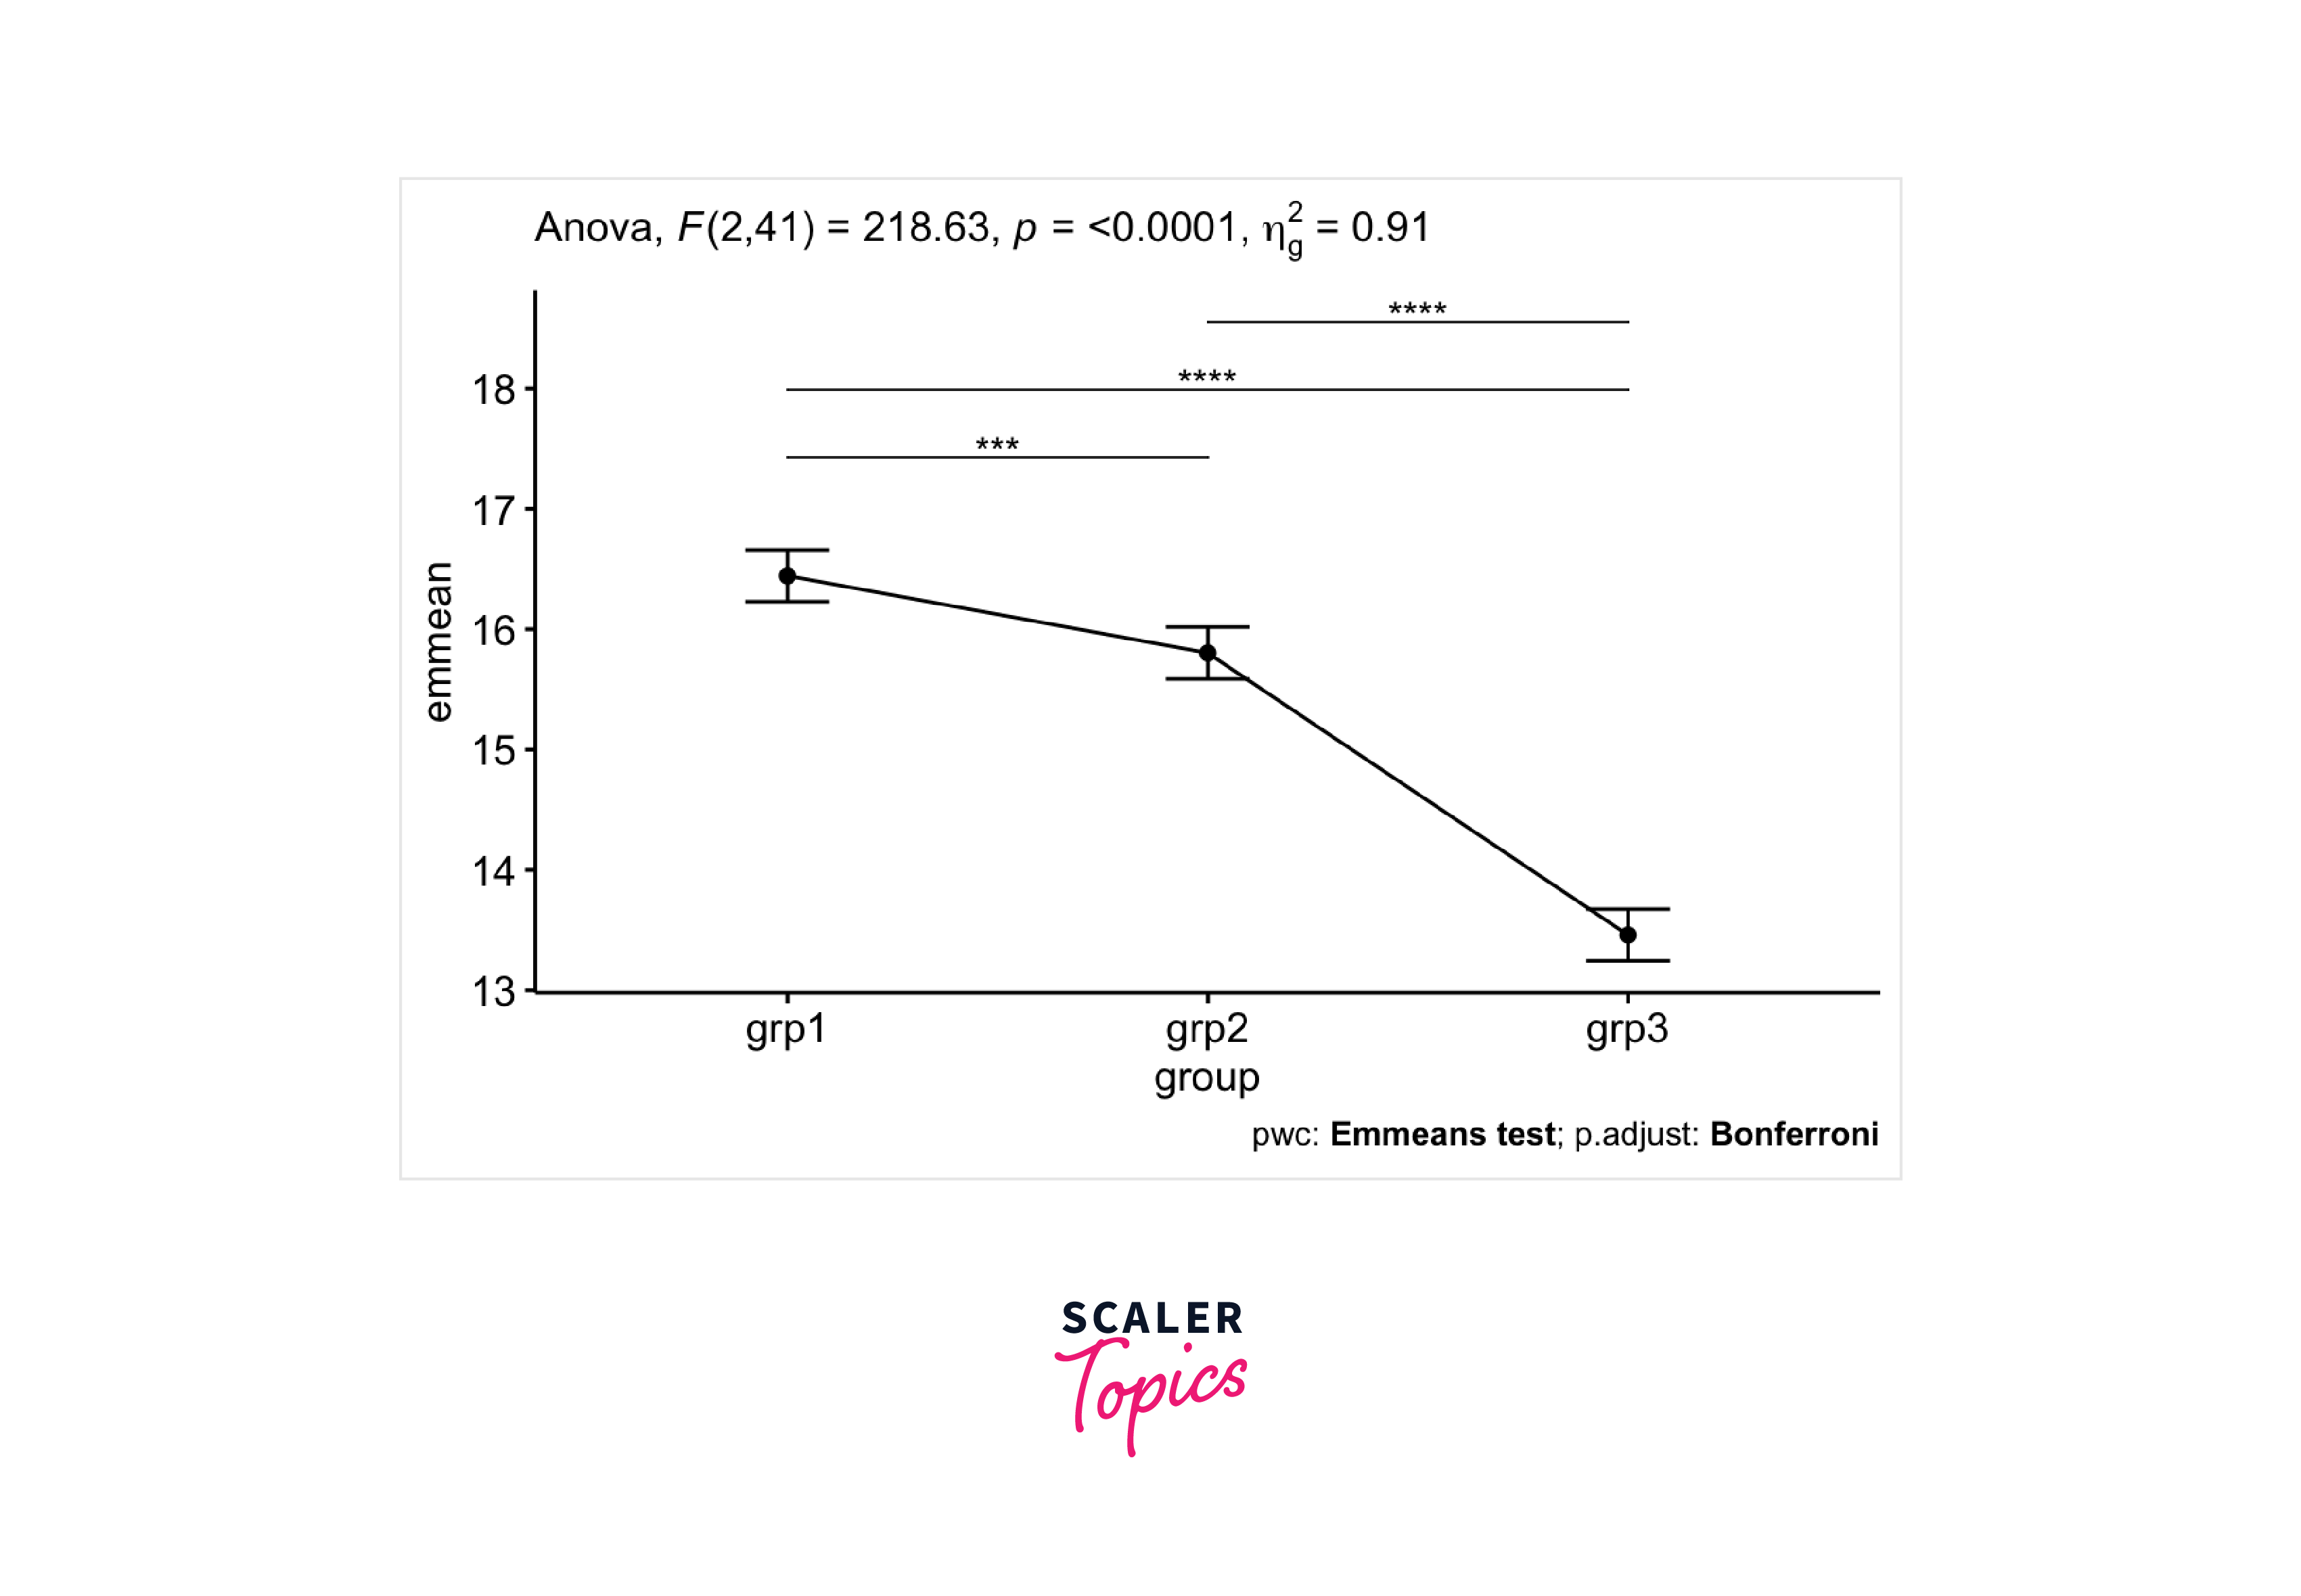
One-way ANCOVA was conducted to assess the impact of exercise programs on participants' anxiety scores while accounting for their initial anxiety levels. Following the adjustment for pre-test anxiety scores, a statistically significant discrepancy was observed in post-test anxiety scores among the groups, as evidenced by an F-statistic of 218.63 with p-value less than 0.0001.
Subsequently, a post hoc analysis was executed with Bonferroni correction. It revealed that the mean anxiety score in grp1 (16.4 +/- 0.15) was significantly higher than in grp2 (15.8 +/- 0.12) and grp3 (13.5 +/_ 0.11), with p-value less than 0.001.
Output:
Two-way ANCOVA
Two-way ANCOVA in R is a statistical technique used to assess the impact of two categorical grouping variables on a continuous outcome variable while considering the influence of one or more covariates. In this analysis, we simultaneously examine how two independent categorical factors, often referred to as factors or grouping variables, affect a dependent variable, while also controlling for the effects of covariates.
It extends the standard ANOVA in R by incorporating covariates, allowing researchers to investigate the main effects of each grouping variable, their interaction, and the influence of covariates on the outcome.
Data preparation
In this section, we will use the stress dataset available in the datarium package to perform a Two-way ANCOVA in R. The goal is to evaluate the effects of treatment and exercise on stress reduction scores while controlling for age as a covariate.
Output:
Assumptions
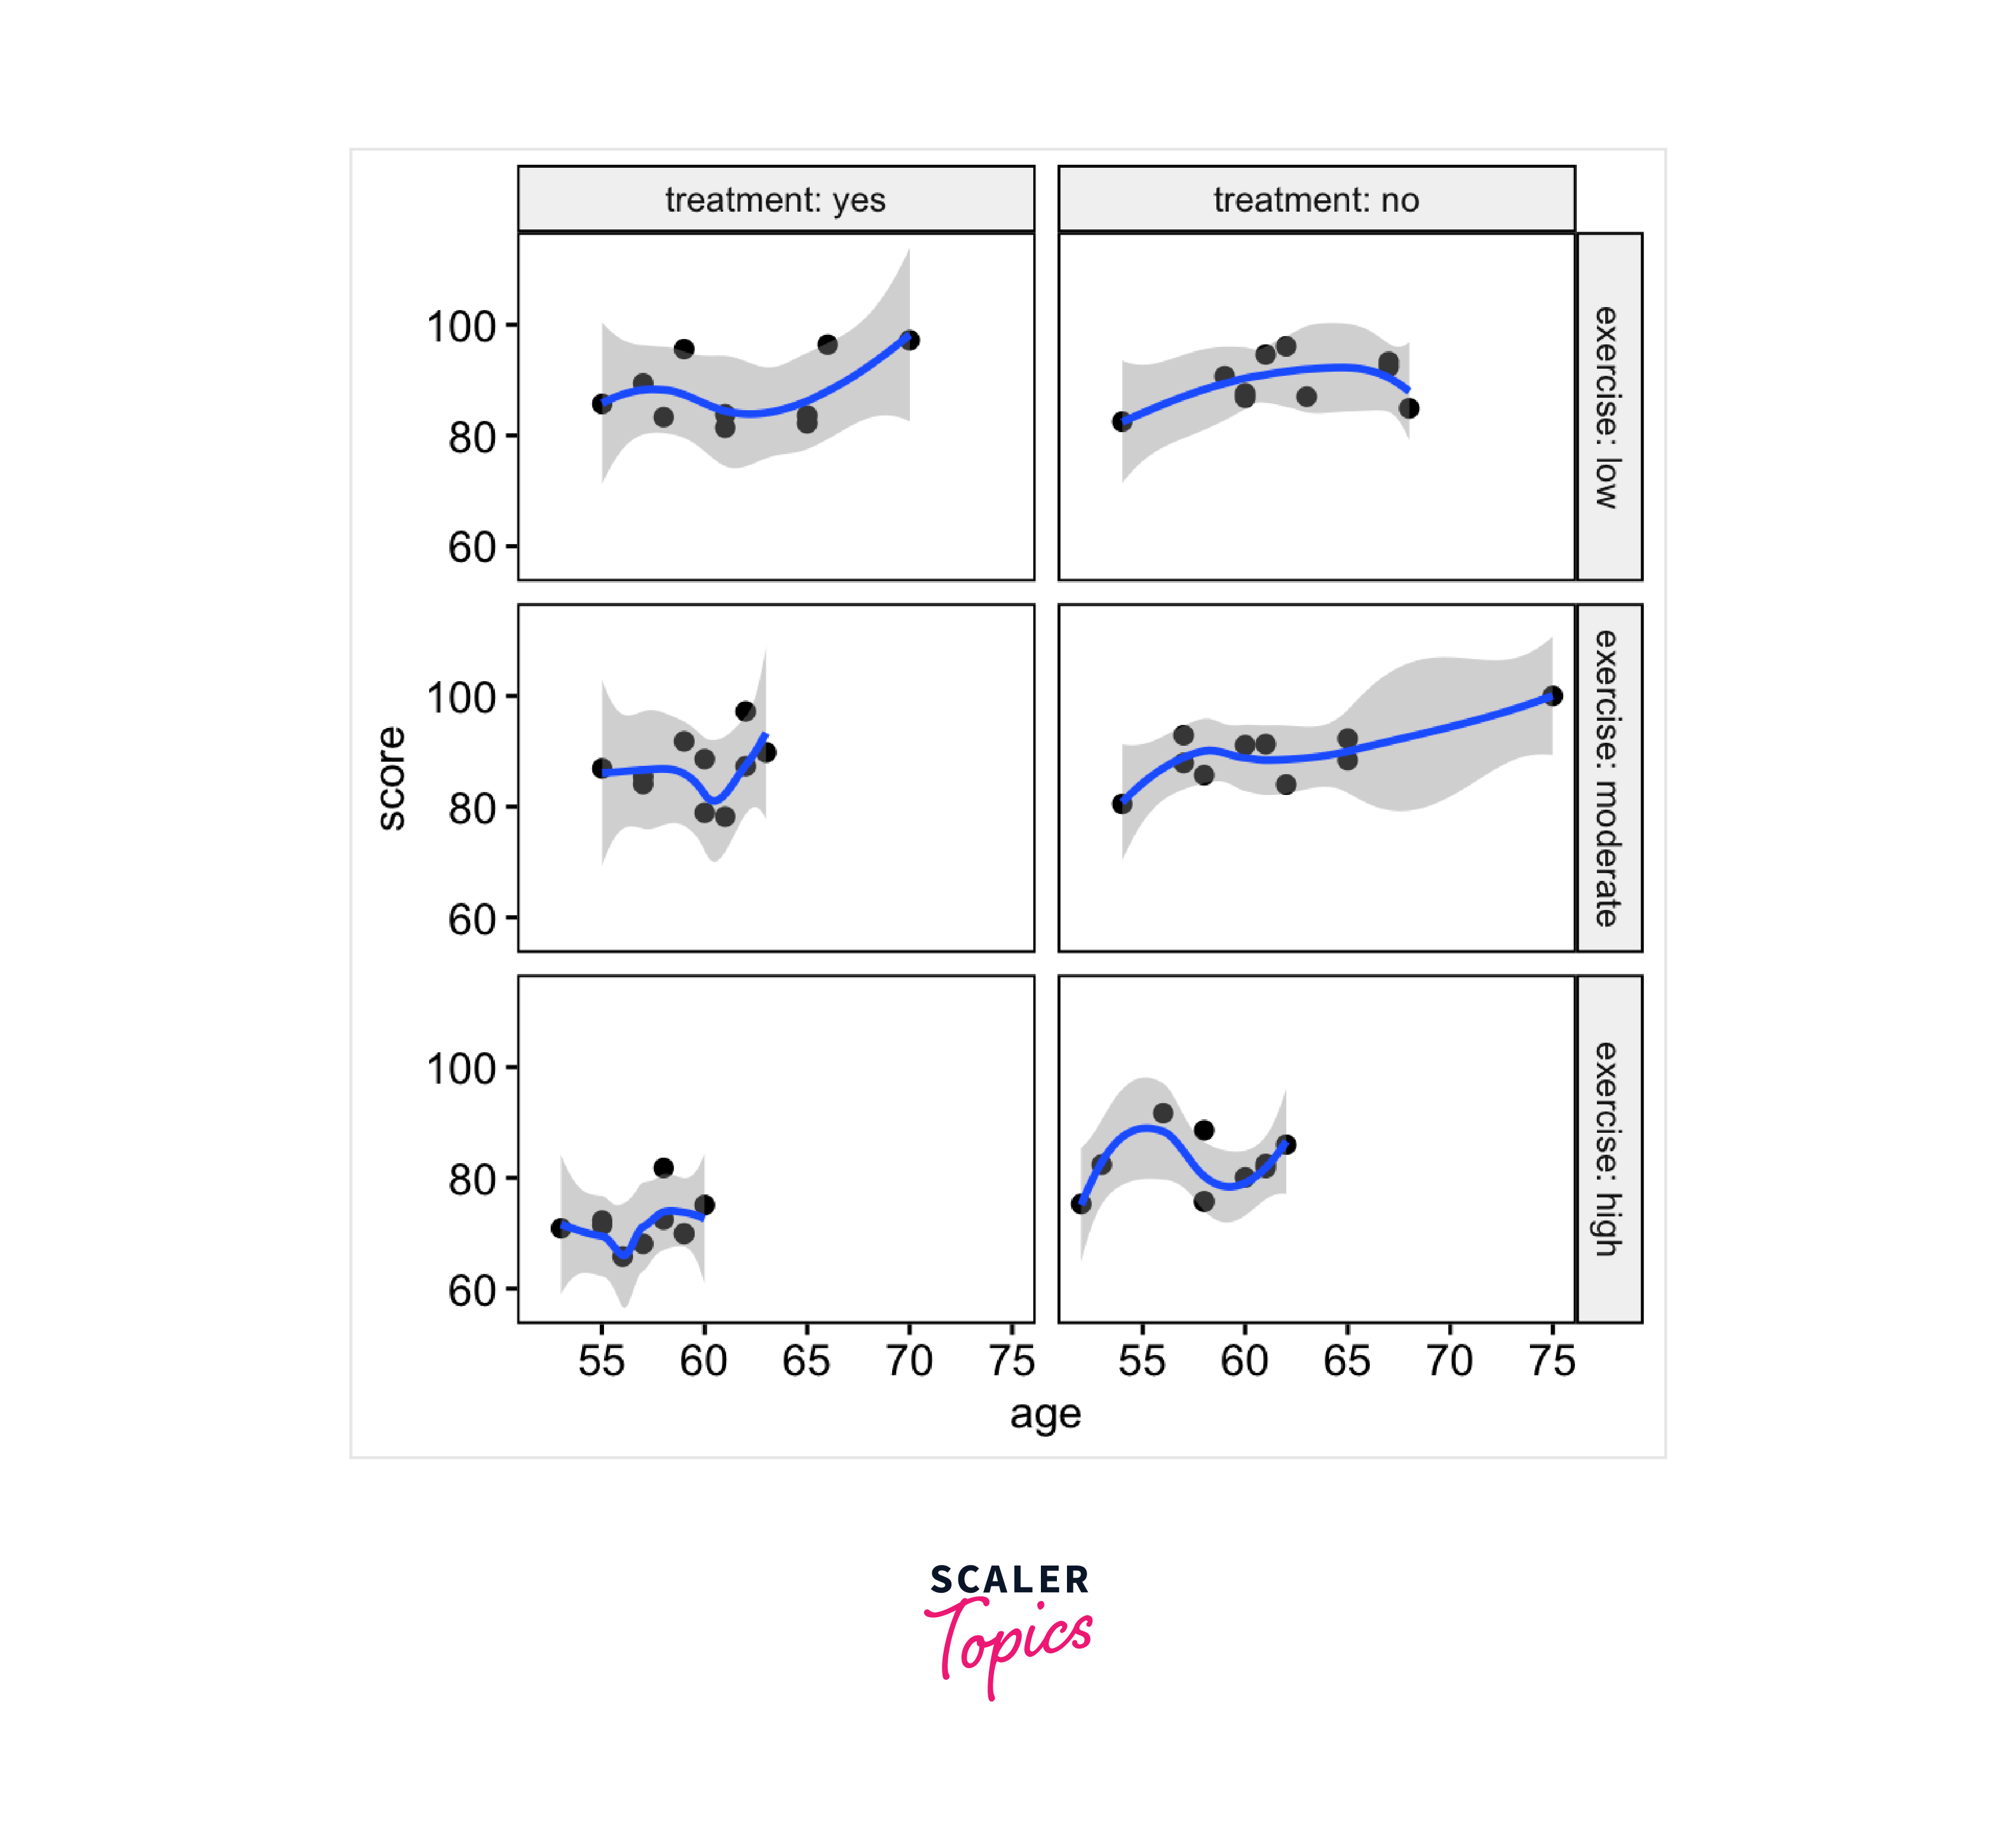
- Linearity Assumption: Check for linearity by creating scatter plots between the covariate (age) and the outcome variable (score) for each combination of the grouping variables (treatment and exercise).
Output:
- Homogeneity of Regression Slopes: Verify that there is no significant interaction between the covariate (age) and the grouping variables (treatment and exercise).
Output:
- Normality of Residuals: Check the normality of residuals using the Shapiro-Wilk test. Ensure that the residuals follow a normal distribution.
Output:
- Outliers: Identify potential outliers by examining standardized residuals. Observations with standardized residuals greater than 3 in absolute value may be considered outliers.
Output:
How to compute Two-way ANCOVA?
Compute a Two-way ANCOVA in R by fitting a linear model with the covariate (age) and the two categorical grouping variables (treatment and exercise).
Output:
How to compute Post-hoc test in Two-way ANCOVA?
Perform post-hoc tests to assess the simple main effects of treatment and exercise at different levels. Use the emmeans_test function with Bonferroni correction for multiple comparisons.
**Post-hoc test for treatment: **
Output:
Post-hoc test for exercise:
Output:
Interpreting ANCOVA Results
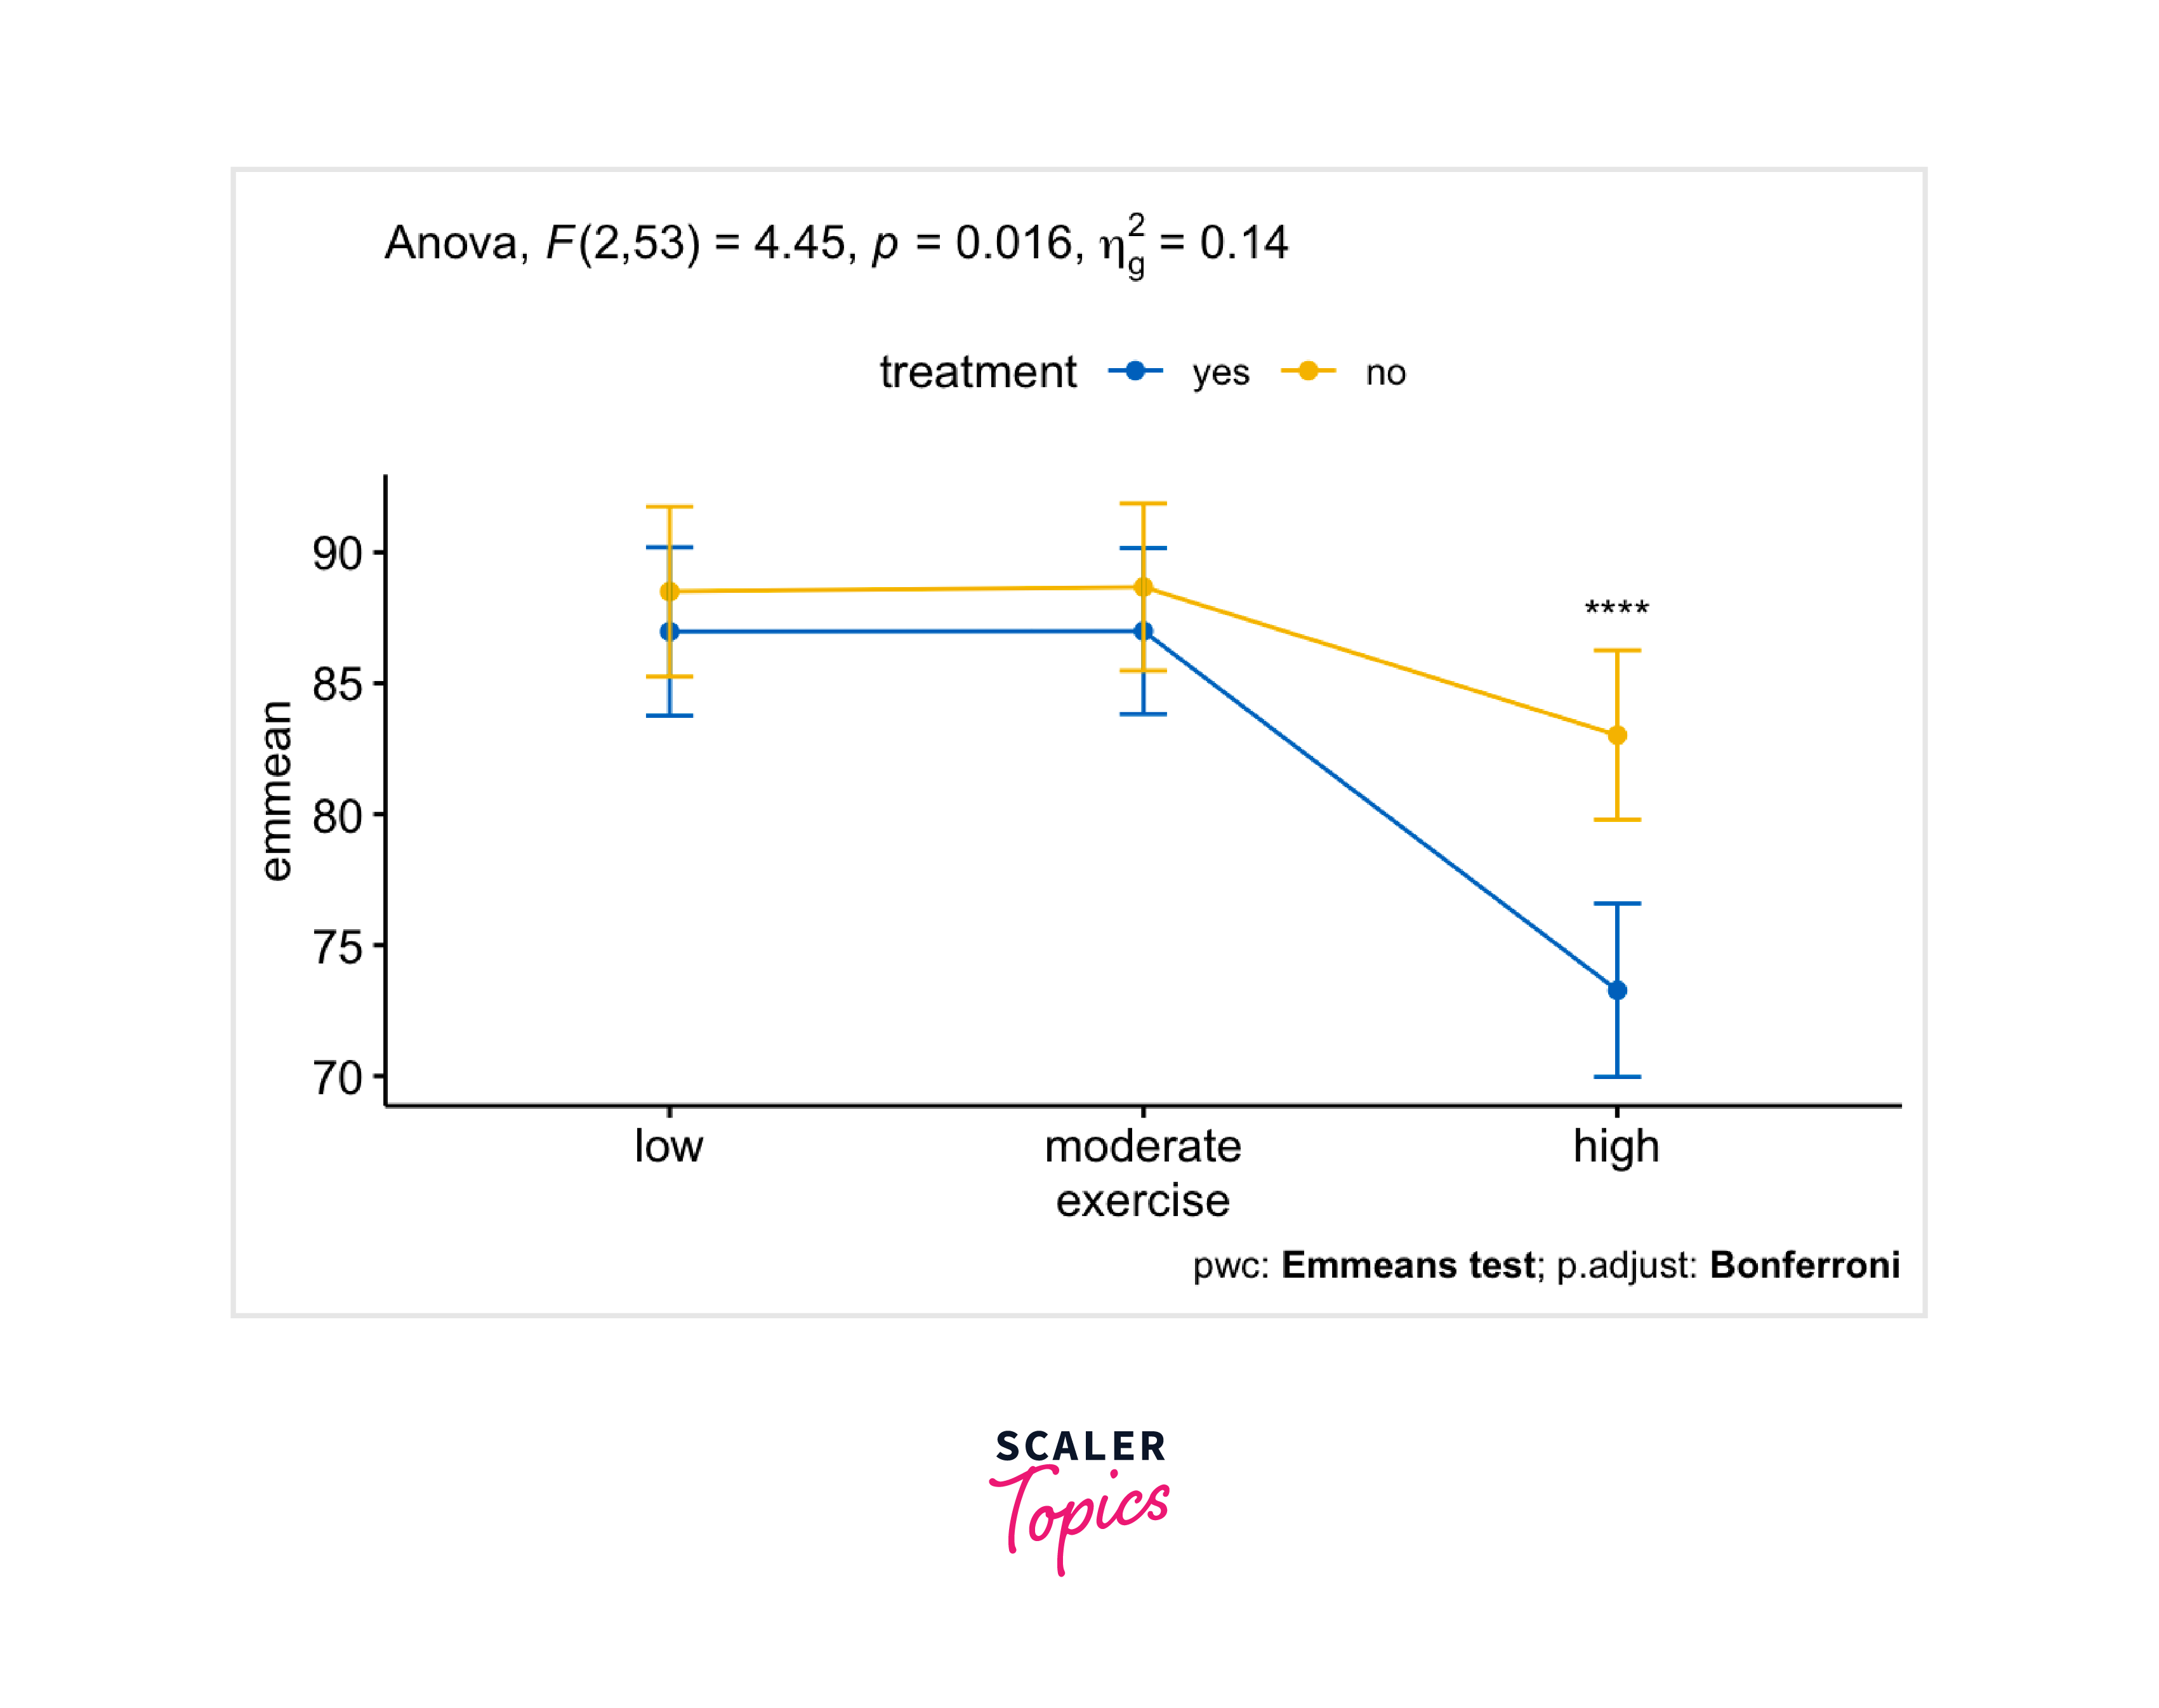
A two-way ANCOVA analysis was carried out in R to assess the impact of both treatment and exercise on stress reduction, with age as a covariate. The results revealed a statistically significant interaction between treatment and exercise regarding score concentration (F(2, 53) = 4.45, p = 0.016).
Regarding the simple main effect of treatment, statistical significance was found in the high-intensity exercise group (p = 0.00046), while it was not observed in the low-intensity exercise group (p = 0.52) or the moderate-intensity exercise group (p = 0.53).
In terms of the simple main effect of exercise, statistical significance was detected in the treatment=yes group (p < 0.0001), whereas it was not evident in the treatment=no group (p = 0.031).
Create a line plot:
Output:
ANCOVA Analysis
Implementing ANCOVA using the lm() Function
The lm() function is typically used for linear regression, but it can be adapted for ANCOVA by including both categorical IV and continuous covariates in the model.
Here's an example of how to perform ANCOVA analysis using a dataset in R:
Output:
Approach:
- We loaded the dplyr library for data manipulation.
- We created a dummy dataset with 50 students (student_id) divided into two groups based on the teaching method they received (teaching_method), either "A" or "B."
- The students have pre-test scores (pre_test) and post-test scores (post_test). We generated these scores randomly for demonstration purposes.
- We then used the lm() function to fit the ANCOVA model. Here, we regressed post_test on teaching_method (categorical factor) and pre_test (continuous covariate).
- Finally, we checked the summary of the ANCOVA model using summary(model) to examine the significance of the teaching method and the covariate in explaining the variation in post-test scores.
Comparing Two Models
Here's a brief comparison of One-Way ANOVA and Two-Way ANOVA:
| Aspect | One-Way ANOVA | Two-Way ANOVA |
|---|---|---|
| Number of Factors | Involves a single categorical predictor. | Involves two categorical predictors (factors). |
| Purpose | Used to compare means of three or more groups based on a single factor. | Used to assess the impact of two factors (main effects) and their interaction on a continuous outcome variable. |
| Example | Comparing test scores among students in different grades (e.g., Grade A, Grade B, Grade C). | Examining the effects of both exercise and treatment on stress reduction scores while controlling for age. |
| Design | Simple experimental design with one factor. | More complex experimental design with two factors. |
| Output | Provides F-statistic, p-value, and effect size measures (e.g., eta-squared). | Provides multiple F-statistics for main effects and interaction, p-values, and effect size measures. |
| Interpretation | Assesses whether means of groups are significantly different from each other. | Examines the main effects of each factor and their interaction, if significant. |
| Assumptions | Assumes homogeneity of variances and independence of observations. | Same assumptions as One-Way ANOVA, plus assumes no significant interaction between factors. |
| Post-Hoc Tests | Common post-hoc tests include Tukey's HSD, Bonferroni, or LSD tests. | Similar post-hoc tests can be applied to assess specific group differences for each factor. |
Conclusion
- ANCOVA in R is a powerful statistical technique used to examine the impact of one or more categorical factors on a continuous outcome variable while controlling for the influence of one or more covariates.
- ANCOVA in R extends the capabilities of ANOVA by allowing researchers to account for covariates, reducing error variance, and enhancing the precision of statistical tests.
- The key steps in conducting ANCOVA include data preparation, assumptions checking (linearity, homogeneity of regression slopes, normality of residuals, and homogeneity of variances), and performing the analysis, followed by post-hoc tests if necessary.
- Interpreting ANCOVA results involves assessing the significance of main effects and interactions between factors while considering the impact of covariates. Post-hoc tests help identify specific group differences.