Debugging Android Apps
Overview
Debugging Android applications is essential for developers to identify and fix issues. Android Studio offers tools like debugger, logcat, and Android Profiler to simplify the process. Enabling USB debugging and connecting devices to a computer is necessary. Breakpoints, logging, and logging are essential techniques. Tools like Layout Inspector and Network Profiler help handle exceptions and crash reports.
Android Profiler and LeakCanary help with memory leaks and performance issues. Optimizing resource usage and testing on real devices enhances the debugging process.
Introduction
Debugging Android applications is the process of finding and correcting software faults. When debugging Android apps, developers use tools to identify and fix issues. Debugging Android apps is important because it helps developers ensure that the app is working properly. Android Studio is a popular tool for debugging Android apps. When debugging Android apps, developers can use breakpoints to pause the code and inspect the variables. Debugging Android apps can be time-consuming, but it's essential to ensure that the app is working properly.
Debugging Tools in Android Studio
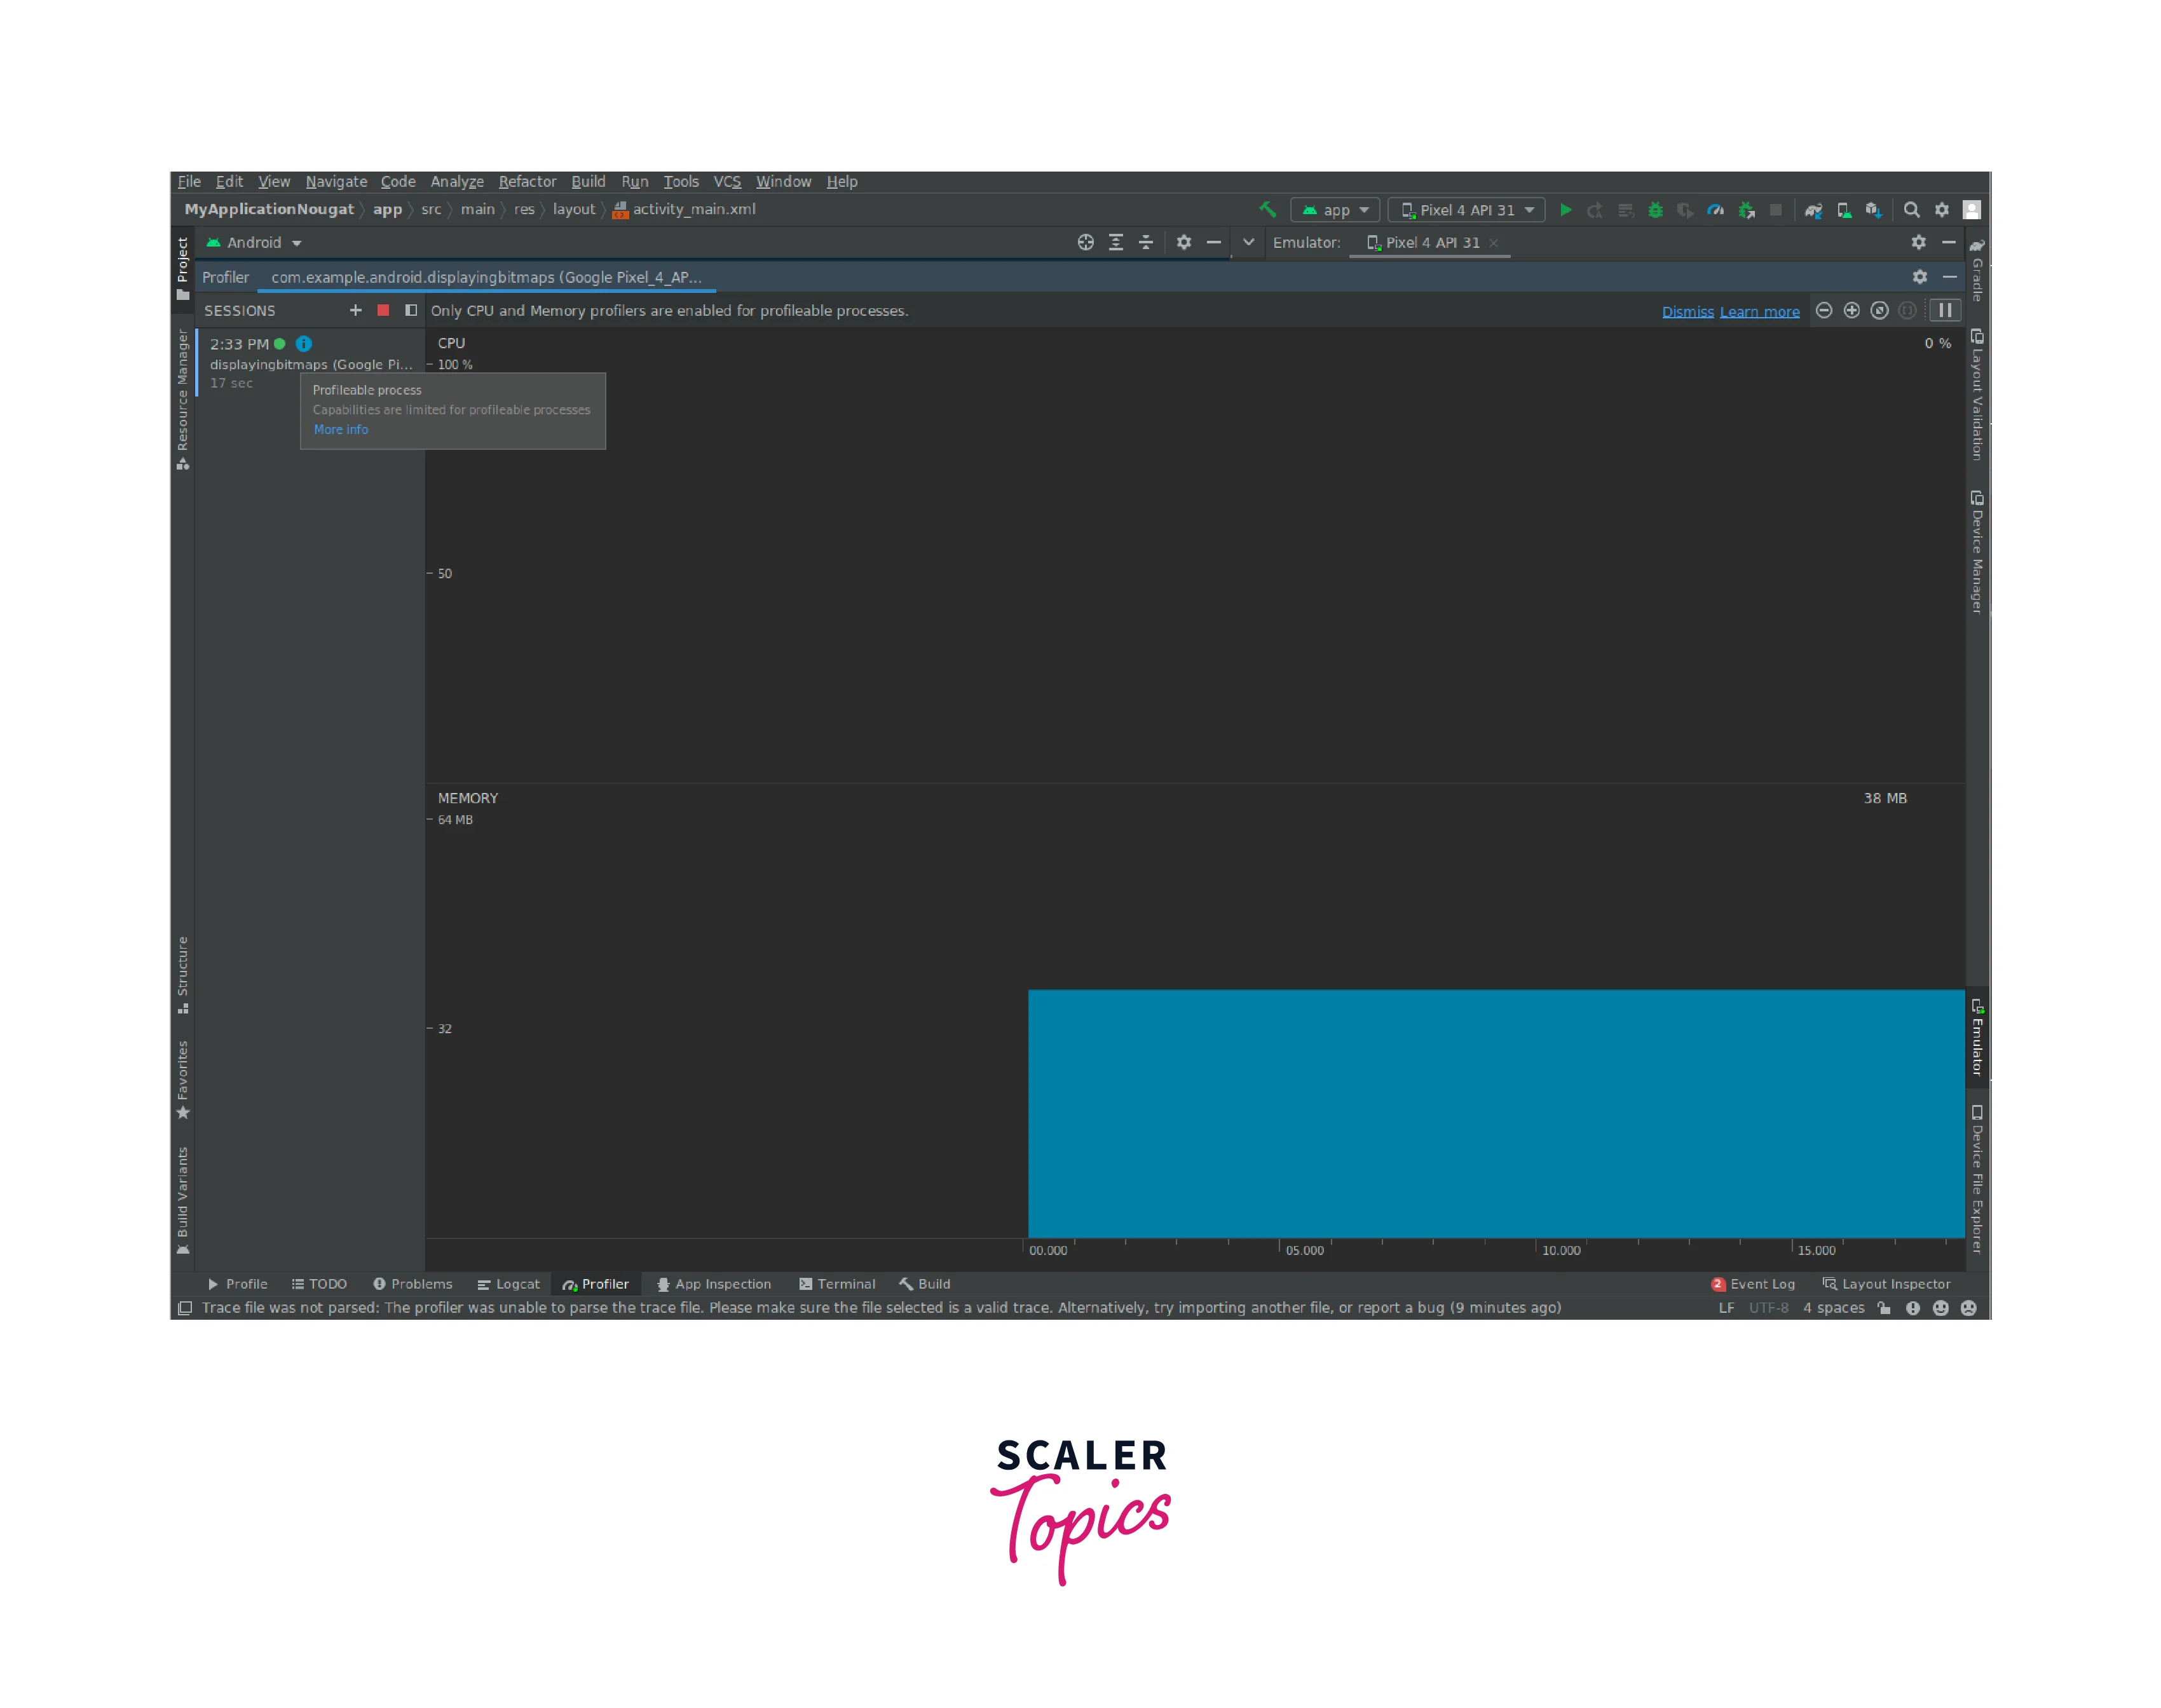
Debugging Android apps is a crucial process for developers to identify and fix issues in their apps. Android Studio provides several debugging tools to make this process easier. The debugger tool allows developers to pause the code and inspect variables, while logcat provides real-time logs of the app's behavior. Developers can use the Android Profiler to monitor the app's CPU, memory, and network usage. These debugging tools in Android Studio are essential for identifying and fixing issues in Android apps. By using these tools, developers can ensure that their apps are working properly.
Setting Up Debugging Environment
Here are the steps to set up a debugging environment in Android Studio:
-
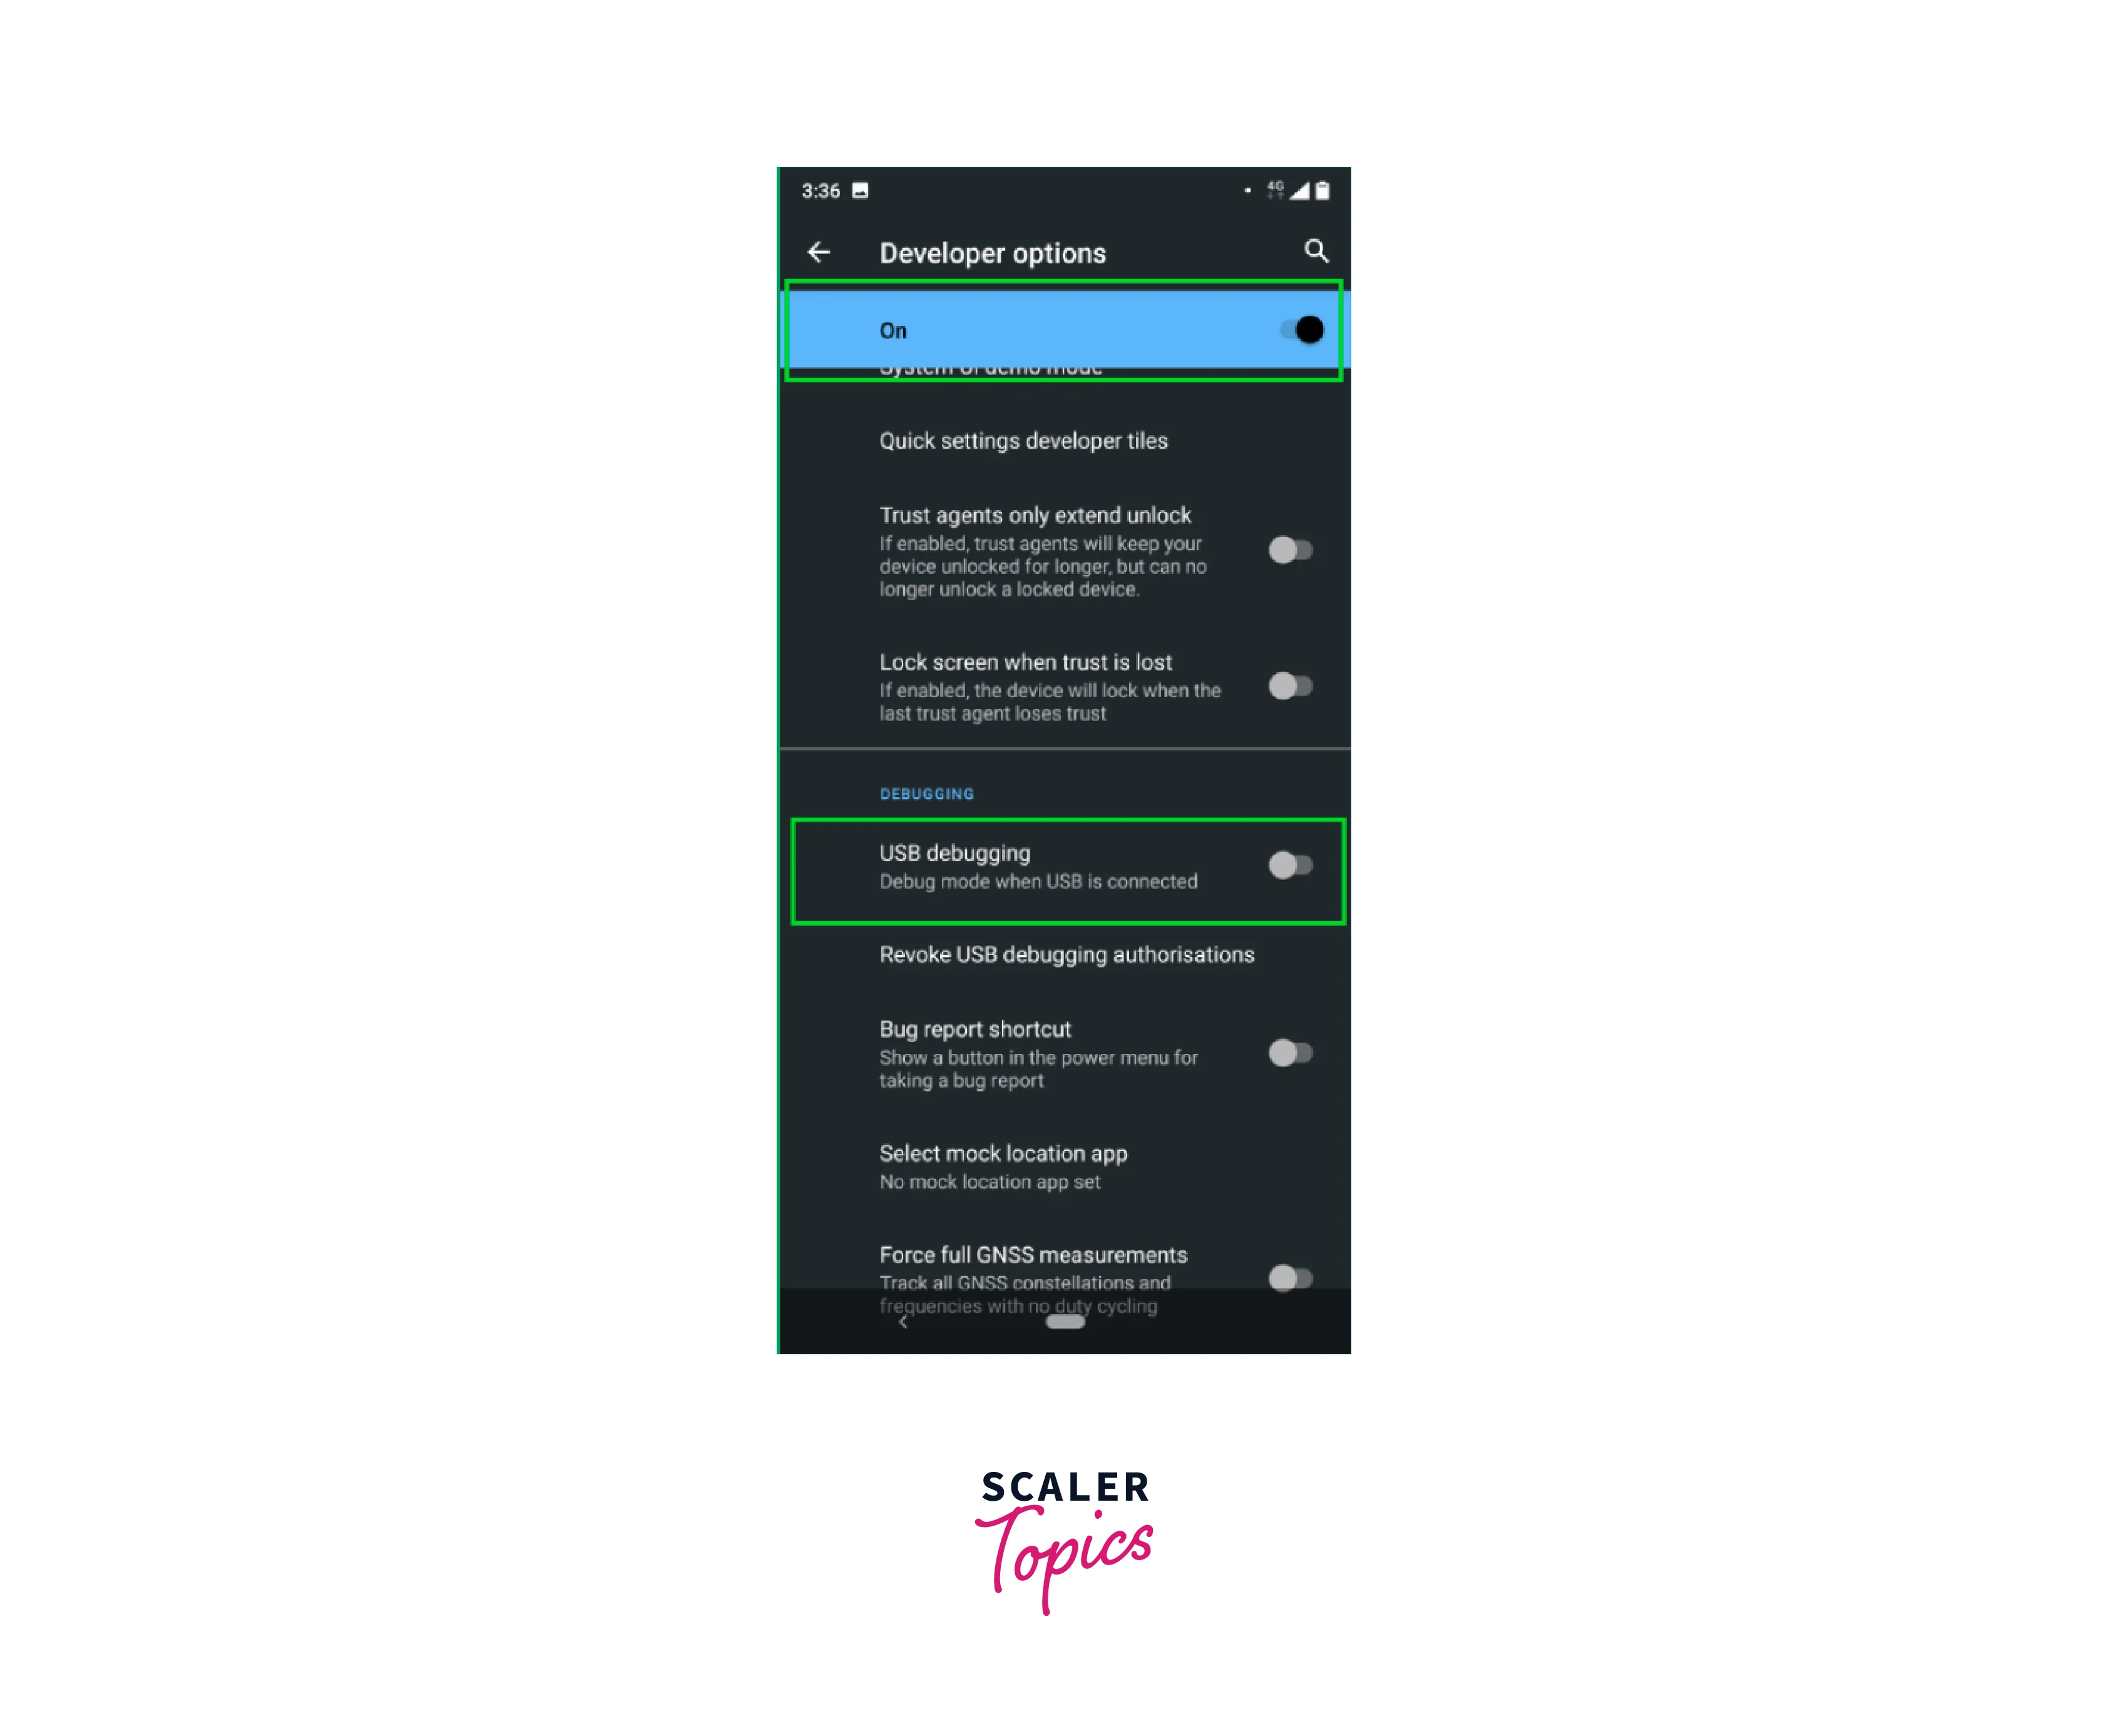
Enable USB debugging on your Android device. This can be found in the Developer options in your device's settings.
-
Connect your device to your computer using a USB cable.
-
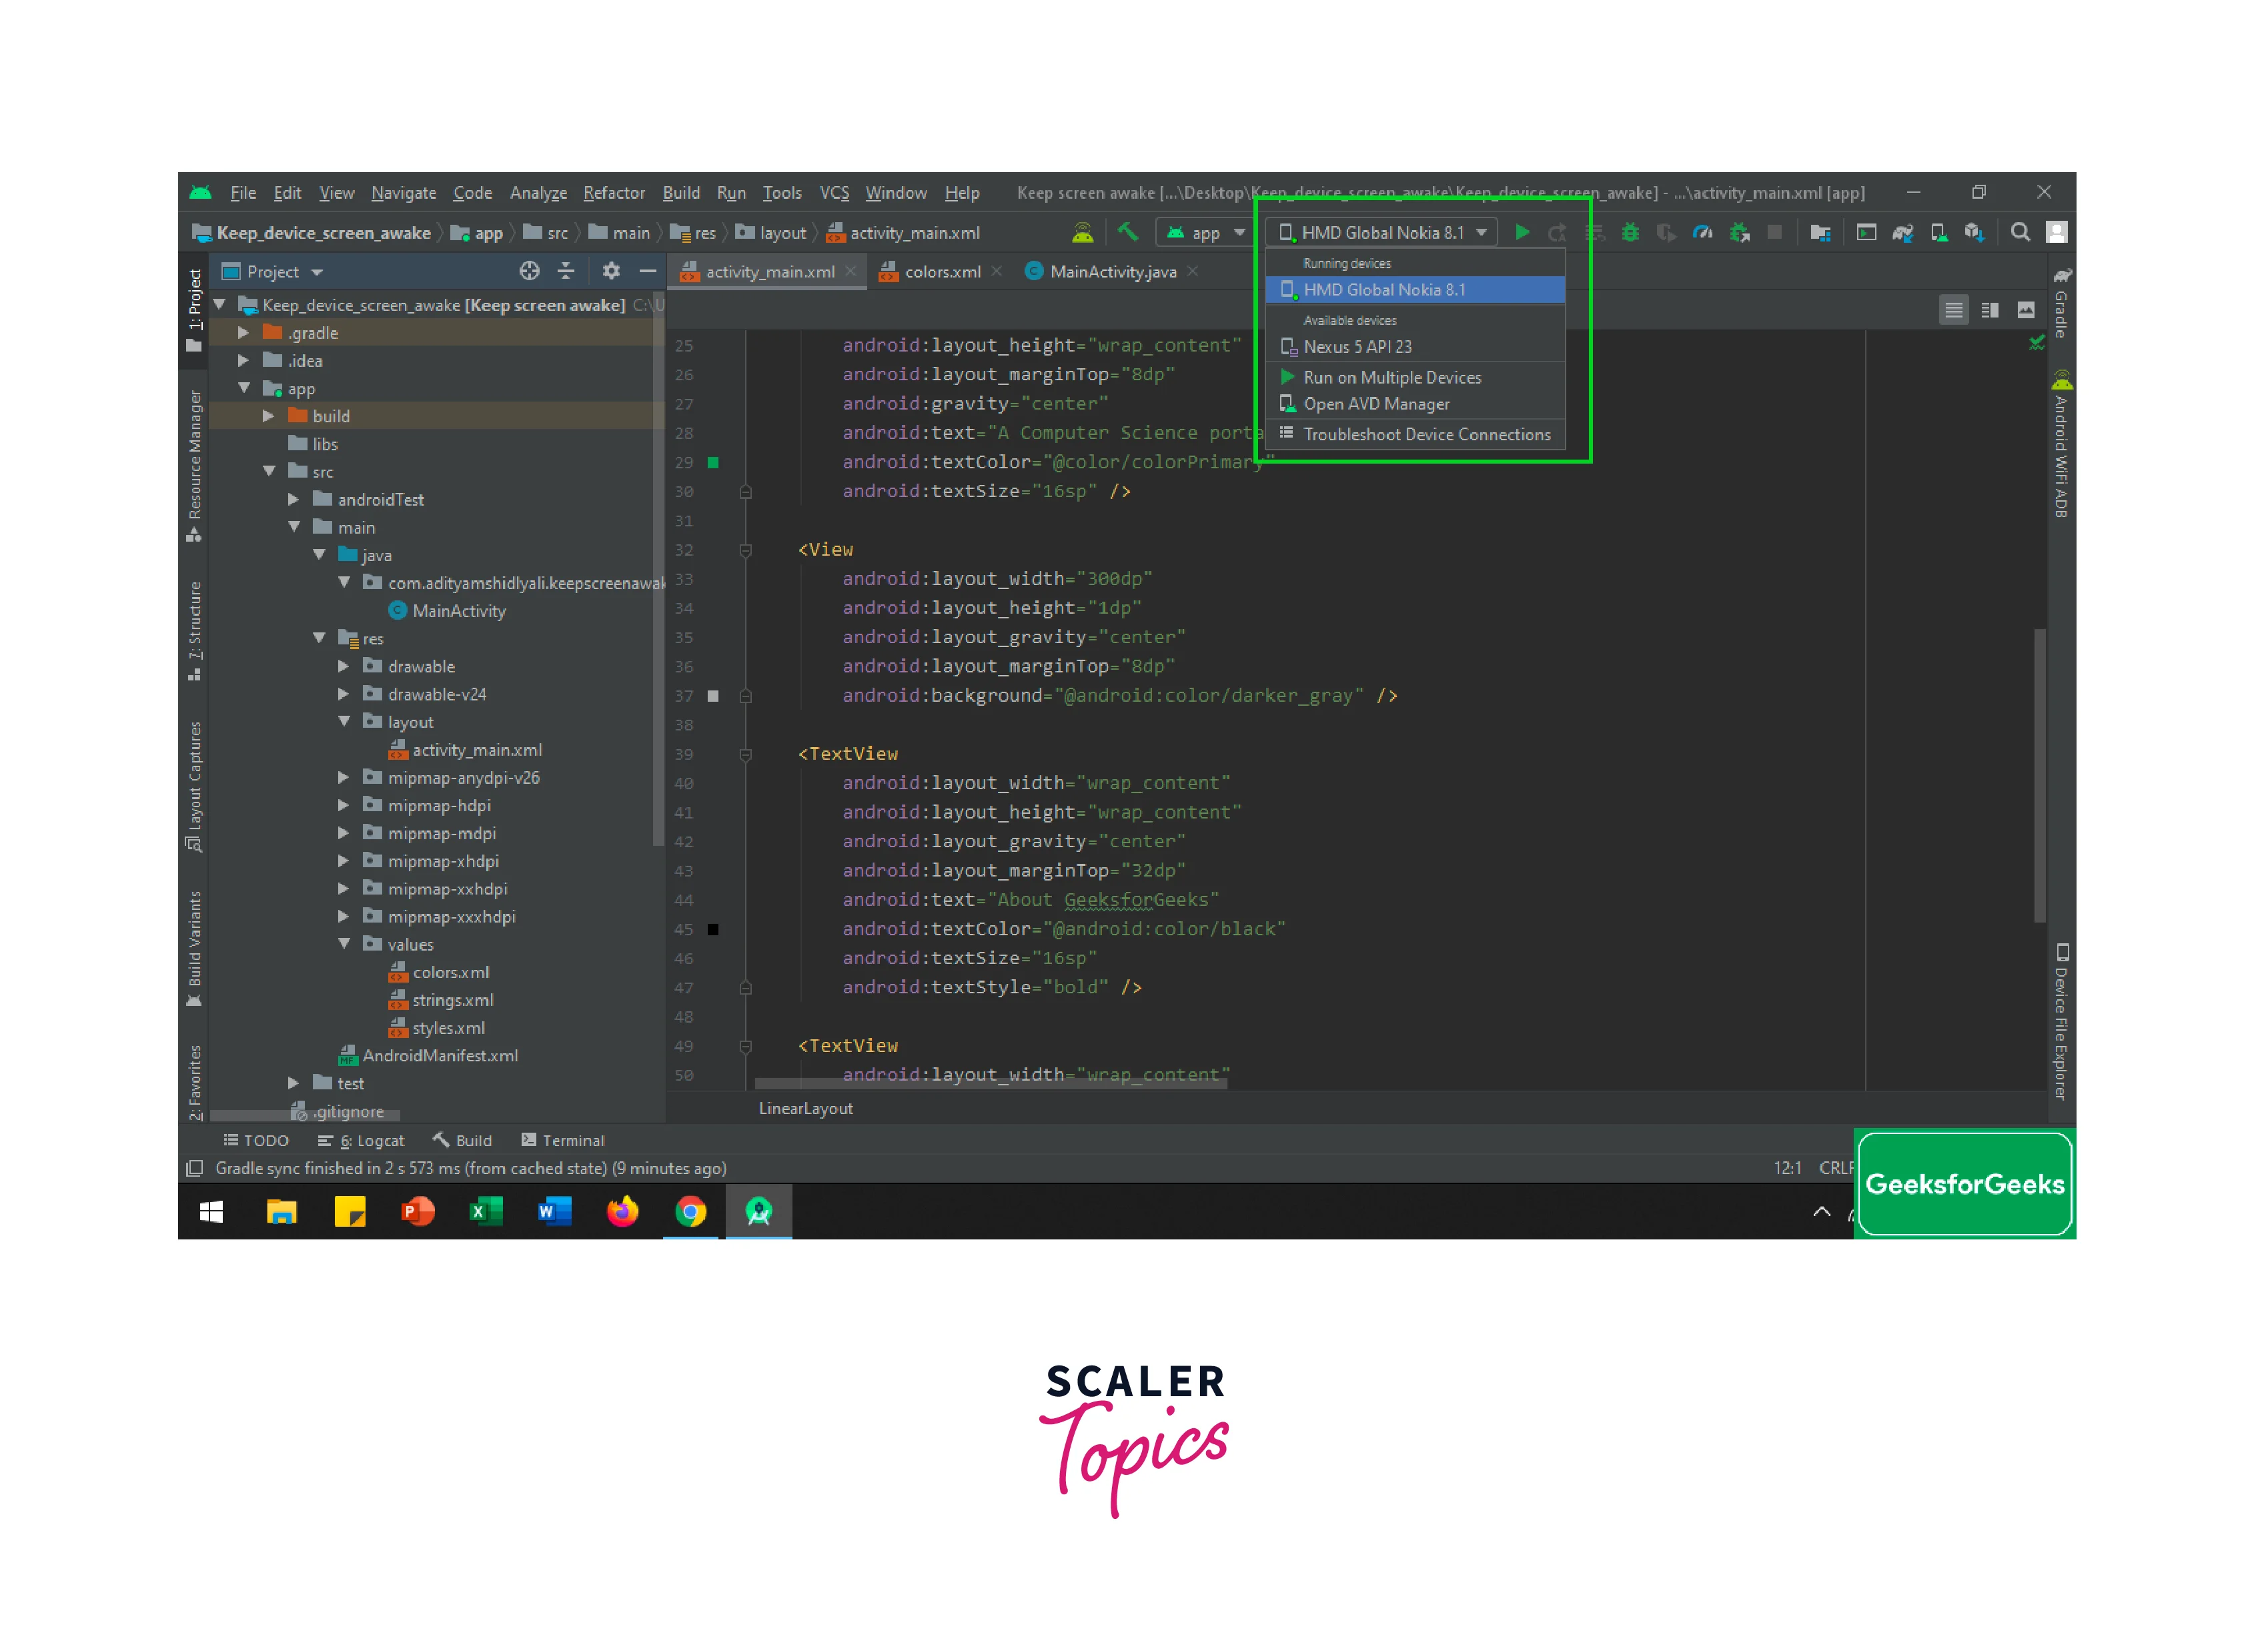
In Android Studio, open the project you want to debug.
-
Click on the "Run" button in the toolbar to launch your app on your device.
-
Once your app is running on your device, you can use Android Studio's debugging tools to identify and fix issues in your app.
-
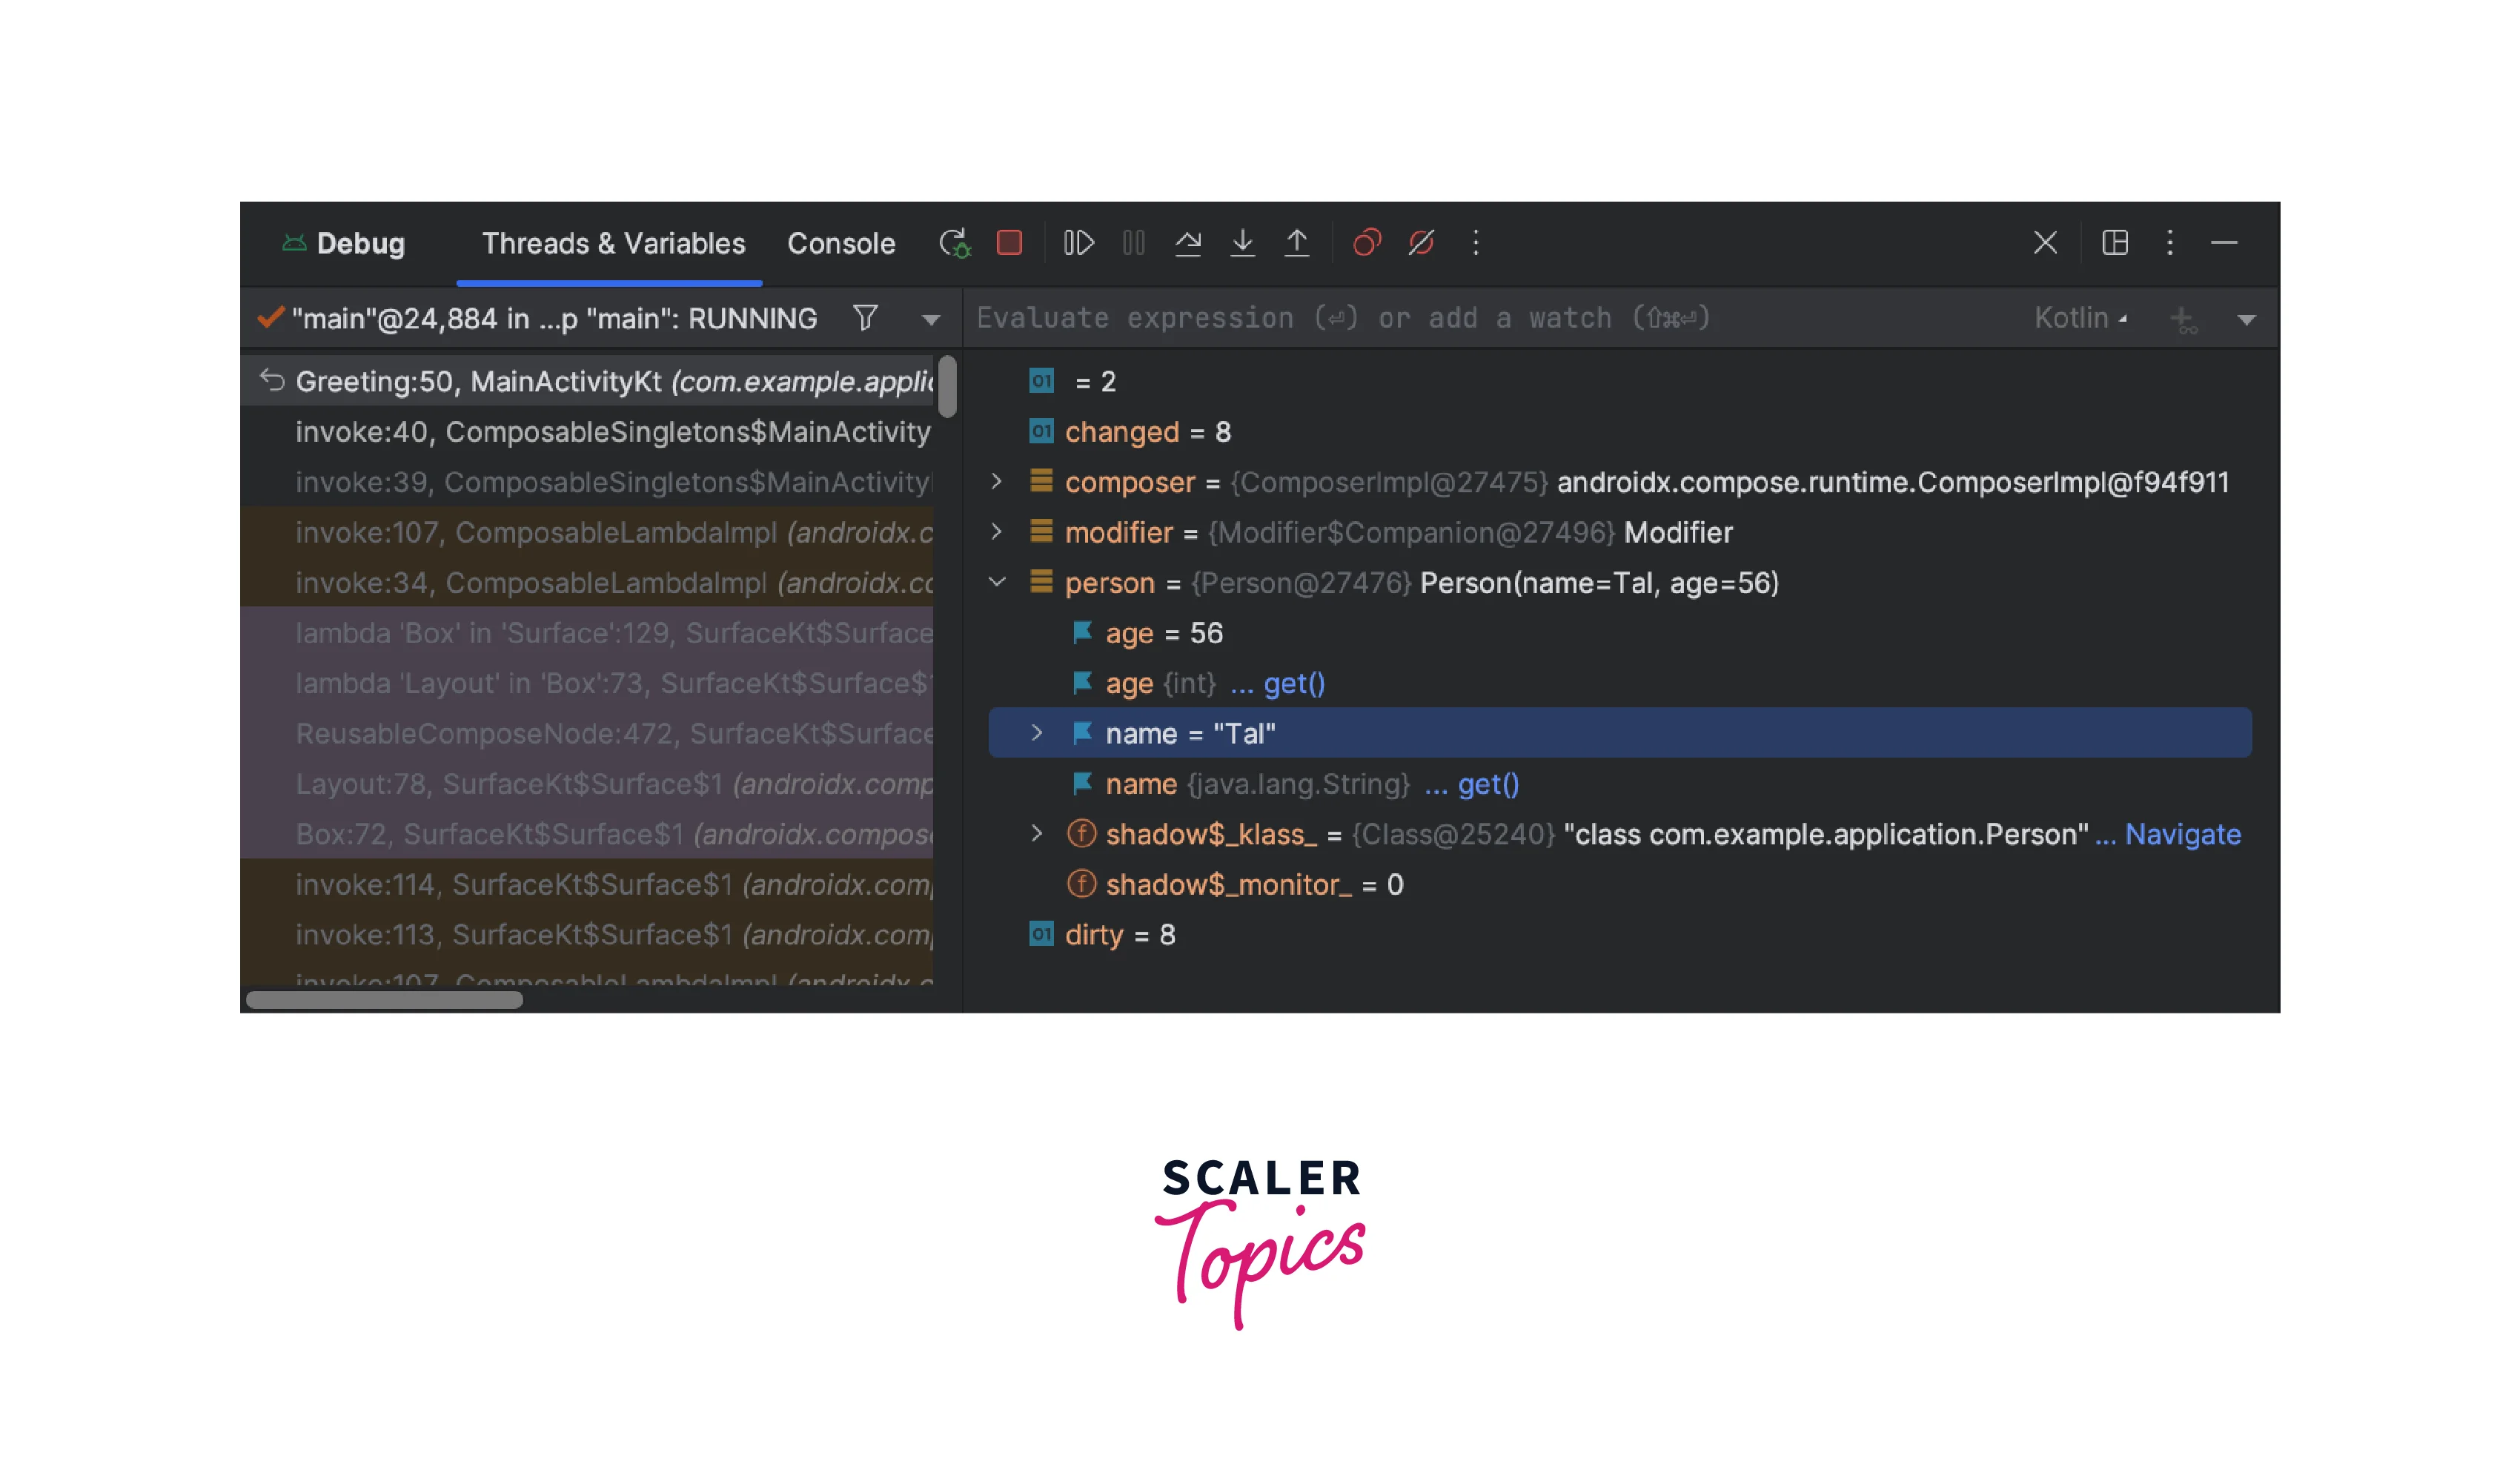
To use the debugger, set breakpoints in your code by clicking on the left-hand side of the code editor.
-
Run your app in debug mode by clicking on the "Debug" button in the toolbar.
-
When your app reaches a breakpoint, it will pause and you can inspect the variables and state of your app.
-
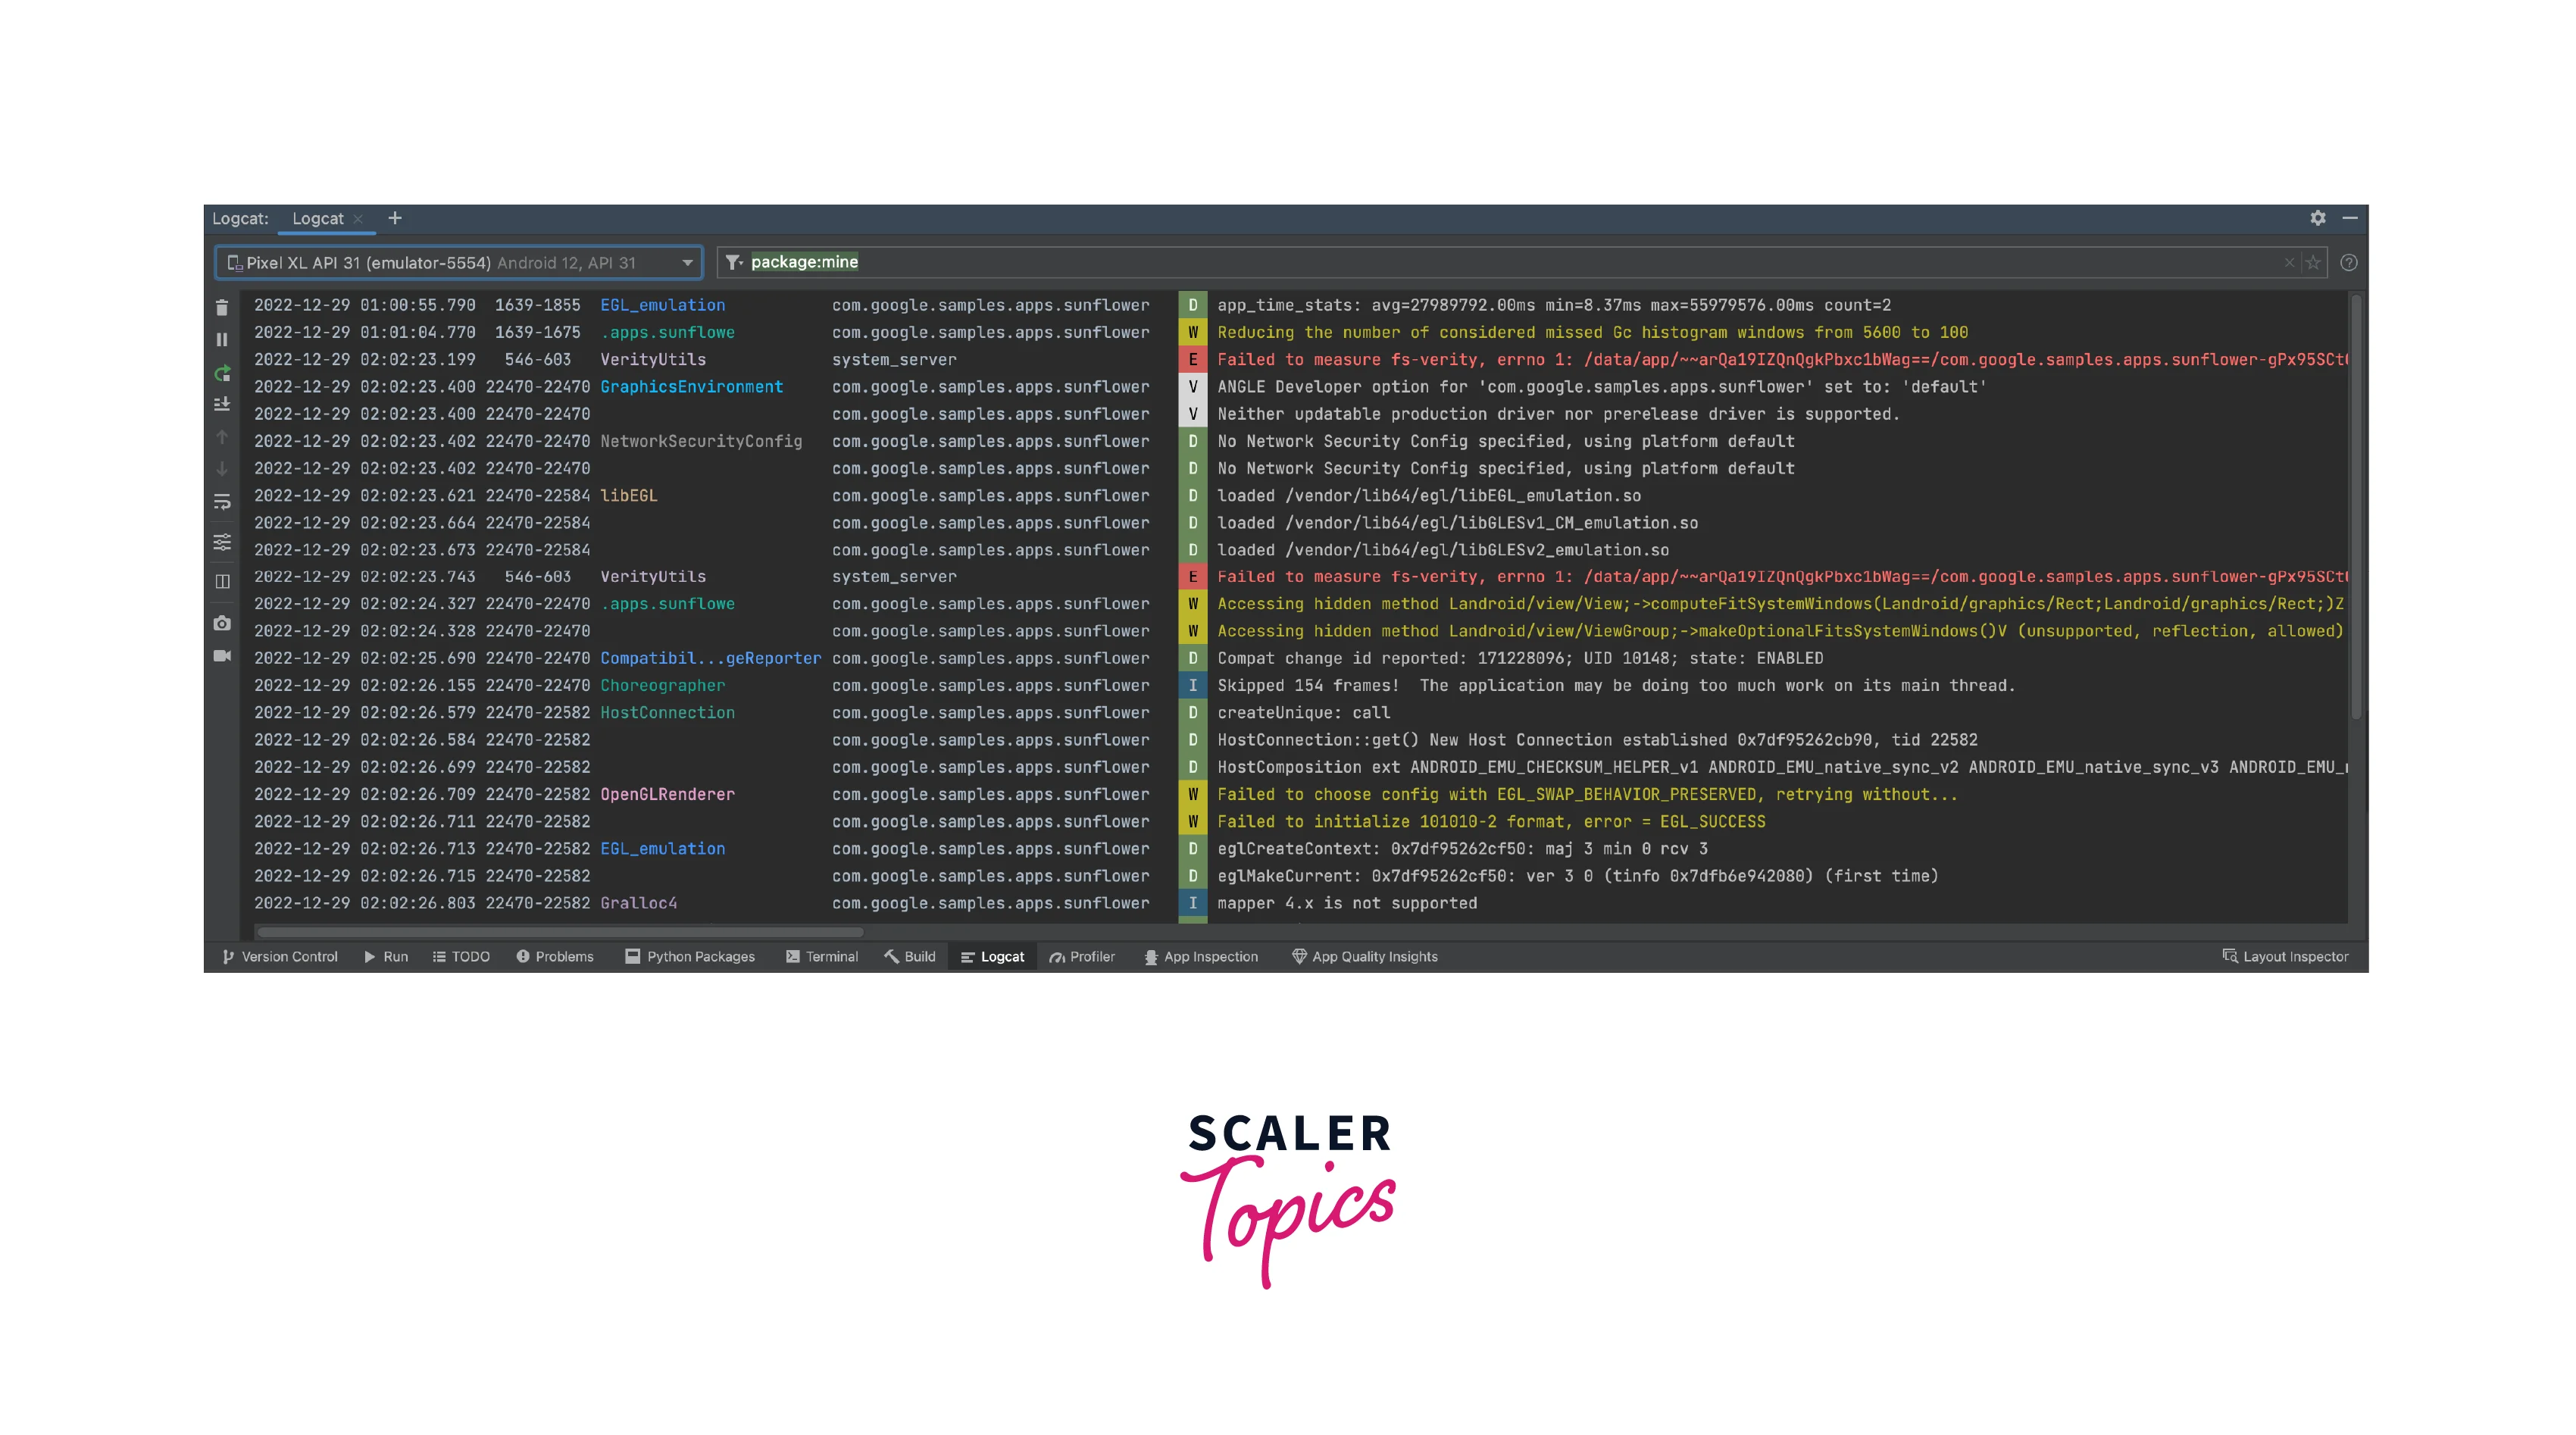
Use logcat to view real-time logs of your app's behavior.
-
Use the Android Profiler to monitor your app's CPU, memory, and network usage.
Breakpoints and Stepping Through Code
Setting Breakpoints in Android Studio
Setting breakpoints in Android Studio is an essential part of debugging your app. Here are the steps to set breakpoints in Android Studio:
- Open the file that you want to debug.
- Click on the left-hand side of the code editor to set a breakpoint on a specific line of code.
- Run your app in debug mode by clicking on the "Debug" button in the toolbar.
- When your app reaches the breakpoint, it will pause and you can inspect the variables and state of your app.
By following these steps, you can set breakpoints in Android Studio and use them to pause your app's execution at a specific point in your code. This allows you to inspect the variables and state of your app and identify and fix issues.
Stepping Through Code Execution for Analysis and Troubleshooting
Here are the 5 steps to step through code execution in Android Studio:
- Set a breakpoint on the line of code where you want to start stepping through execution.
- Run your app in debug mode by clicking on the "Debug" button in the toolbar.
- When your app reaches the breakpoint, it will pause and you can inspect the variables and state of your app.
- Click on the "Step Over" button in the toolbar to execute the next line of code.
- Use the "Step Into", "Step Out", and "Resume Program" buttons to navigate through your code and continue executing your app.
By following these 5 steps, you can use Android Studio's debugging tools to step through code execution and identify and fix issues in your app.
Inspecting Variables and Expressions
When debugging your app, inspecting variables and expressions is essential for identifying and fixing issues. In Android Studio, set a breakpoint on the line of code you want to inspect, run your app in debug mode, and the "Variables" window will display all variables and their values at the current point in your code. You can also evaluate expressions in the "Evaluate Expression" field. By inspecting variables and expressions in Android Studio, you can use its debugging tools to identify and fix issues in your app.
Logging and Logcat
Logging is an essential tool for debugging your Android app. You can use the Log class in Android Studio to print messages to the Logcat console, which displays system messages, errors, and other debugging information. By logging messages at different points in your code, you can trace the execution of your app and identify issues. You can also use filters in Logcat to display messages from specific parts of your app or messages with specific tags. By logging in to Android Studio, you can make the debugging process more efficient and effective.
Debugging User Interface Issues and Network Communications
When debugging your Android app, you can use tools such as the Layout Inspector and the View Hierarchy to identify and fix user interface issues. The Layout Inspector displays a 3D view of your app's layout, allowing you to inspect individual views and adjust the layout as needed. The View Hierarchy shows the structure of your app's user interface, allowing you to see how views are nested and how they interact with each other. For network communication debugging, you can use the Network Profiler to monitor network activity, identify issues, and optimize performance. By using these tools in Android Studio, you can debug UI issues and network communications more efficiently.
Handling Exceptions and Crash Reports
To handle exceptions in Android, use try-catch blocks to catch and handle exceptions, and use the Log class to log error messages. To handle crash reports, integrate a crash reporting tool like Firebase Crashlytics or Bugsnag into your app to automatically log and report crashes.
Capturing and Analyzing Exceptions in Android Apps
Capturing and analyzing exceptions in Android apps is essential for identifying and fixing issues. You can use the try-catch block and the Exception class to handle exceptions and log error messages. By logging error messages at different points in your code, you can trace the execution of your app and identify issues. You can also use tools such as Crashlytics and Firebase Crashlytics to capture and analyze exceptions in your app. These tools provide detailed crash reports and analytics, allowing you to quickly identify and fix issues. By capturing and analyzing exceptions in your Android app, you can improve the stability and reliability of your app.
Utilizing Crash Reporting Tools for Error Analysis
Android Studio provides several tools for capturing and analyzing exceptions in your Android app. You can use the try-catch block and the Exception class to handle exceptions and log error messages. Android Studio also includes the Logcat console, which displays system messages, errors, and other debugging information. You can use filters in Logcat to display messages from specific parts of your app or messages with specific tags. Additionally, Android Studio supports integration with crash reporting tools such as Crashlytics and Firebase Crashlytics. These tools provide detailed crash reports and analytics, allowing you to quickly identify and fix issues. By using these tools in Android Studio, you can improve the stability and reliability of your app.
Debugging Memory Leaks and Performance Issues
To debug memory leaks in Android, use the Android Profiler to monitor memory usage and identify memory leaks, and use the LeakCanary library to automatically detect and report memory leaks. To debug performance issues, use the Android Profiler to monitor CPU usage, network activity, and other performance metrics, and optimize your app's code and resources accordingly.
Identifying and Resolving Memory Leaks
Memory leaks can cause Android apps to consume more and more memory over time, leading to reduced performance and stability. To identify and resolve memory leaks, you can use tools such as the Android Profiler in Android Studio, which provides a Memory Profiler to monitor memory usage in real time and analyze memory allocation. Techniques such as releasing objects when they are no longer needed, avoiding static references to objects, and using weak references can help resolve memory leaks. Tools such as LeakCanary can also automatically detect and report memory leaks in your app. By identifying and resolving memory leaks, you can improve the performance and stability of your Android app.
Profiling App Performance and Optimizing Resource Usage
- Profiling app performance and optimizing resource usage is crucial for enhancing user experience on Android devices.
- Android Profiler in Android Studio offers CPU, Memory, and Network Profilers to monitor and analyze app performance.
- Identifying performance bottlenecks and optimizing resource usage can be achieved through tools like Android Profiler.
- Techniques like data caching, efficient data structures, and minimizing CPU, memory, and network usage aid in resource optimization.
- Android Performance Tuner automates performance optimization for various devices, ensuring an optimal user experience.
Debugging Tips and Best Practices
Debugging is an essential part of the app development process. Here are some tips and best practices to help you debug your Android app:
-
Use logs:
Use the Log class to log messages and errors in your app. This will help you identify issues and track down bugs. -
Use breakpoints:
Set breakpoints in your code to pause the app's execution and inspect the current state of the app. This can help you identify issues with variables, objects, and methods. -
Use the Android Profiler:
Use the Android Profiler to monitor and analyze the app's performance, memory usage, and network activity. This can help you identify performance bottlenecks and memory leaks. -
Use the debugger:
Use the debugger in Android Studio to step through your code and inspect the current state of the app. This can help you identify issues with variables, objects, and methods. -
Test on real devices:
Test your app on real devices to identify issues that may not be present in the emulator. -
Use a crash reporting tool:
A crash reporting tool like Firebase Crashlytics or Bugsnag can help you track down issues that cause your app to crash. These tools provide detailed crash reports that include stack traces, device information, and other useful data. -
Use the Android Device Monitor:
The Android Device Monitor is a tool that allows you to monitor and profile your app’s performance, memory usage, and network activity. It also allows you to take screenshots and screen recordings of your app. -
Use the hierarchy viewer:
The hierarchy viewer is a tool that allows you to inspect the layout hierarchy of your app’s user interface. This can help you identify issues with layout performance and rendering.
Conclusion
- Utilizing the Android Device Monitor and Android Profiler in Android Studio provides additional insights into app performance, memory usage, and CPU profiling during debugging.
- Remote debugging is a valuable technique that allows developers to debug apps running on physical devices or emulators connected to a different computer, aiding in troubleshooting real-world scenarios.
- Android Studio's built-in debugger offers advanced features like step-by-step execution, conditional breakpoints, and watch expressions, enabling developers to deeply analyze code behavior and track down complex bugs.
- Using the Android Debug Bridge (ADB) commands in conjunction with Android Studio enhances the debugging process by allowing developers to interact with devices, install/uninstall apps, and access device logs.
- Test-driven development (TDD) and writing unit tests can play a significant role in debugging by enabling developers to catch issues early in the development process and maintain code stability throughout app iterations.
