Graph is a collection of edges and vertices that help us visualize various problems in a graphical way.
Scope of the Article
- In this article we shall see the applications of graphs in data structures
- We shall try to discuss various real-life applications that graph helps us to solve
- We shall not be discussing the code for these real-life applications in this article.
Takeaways
Graphs help us visualize complex problems in a simpler way by visualizing entities as vertices and the relationships they carry as edges.
Introduction to Graph in Data Structure
In this article, we learned the basics of graphs and how to implement them. Let us recollect the important points.
A graph is a non-linear data structure that can be defined as a set of V vertices and E edges where the edges connect two vertices in a directed or undirected fashion.
Applications of Graph Data Structure
Graphs can be used in problems where there are multiple ways to travel from vertex A to vertex B.
A Very Popular Example is the Travelling Salesman Problem (TSP).
Consider a set of cities and the distances between them. We need to find the shortest possible route such that a salesman starts from one city and comes back to the same city without visiting any city twice.
We can use graphs to visualize this problem as a city is a vertex and the distance between them is an edge essentially.
We can see a variation of this problem being used in Google Maps.
Assume you have to go from city A to E.
There are 3 routes to do so as can be seen from the diagram below.
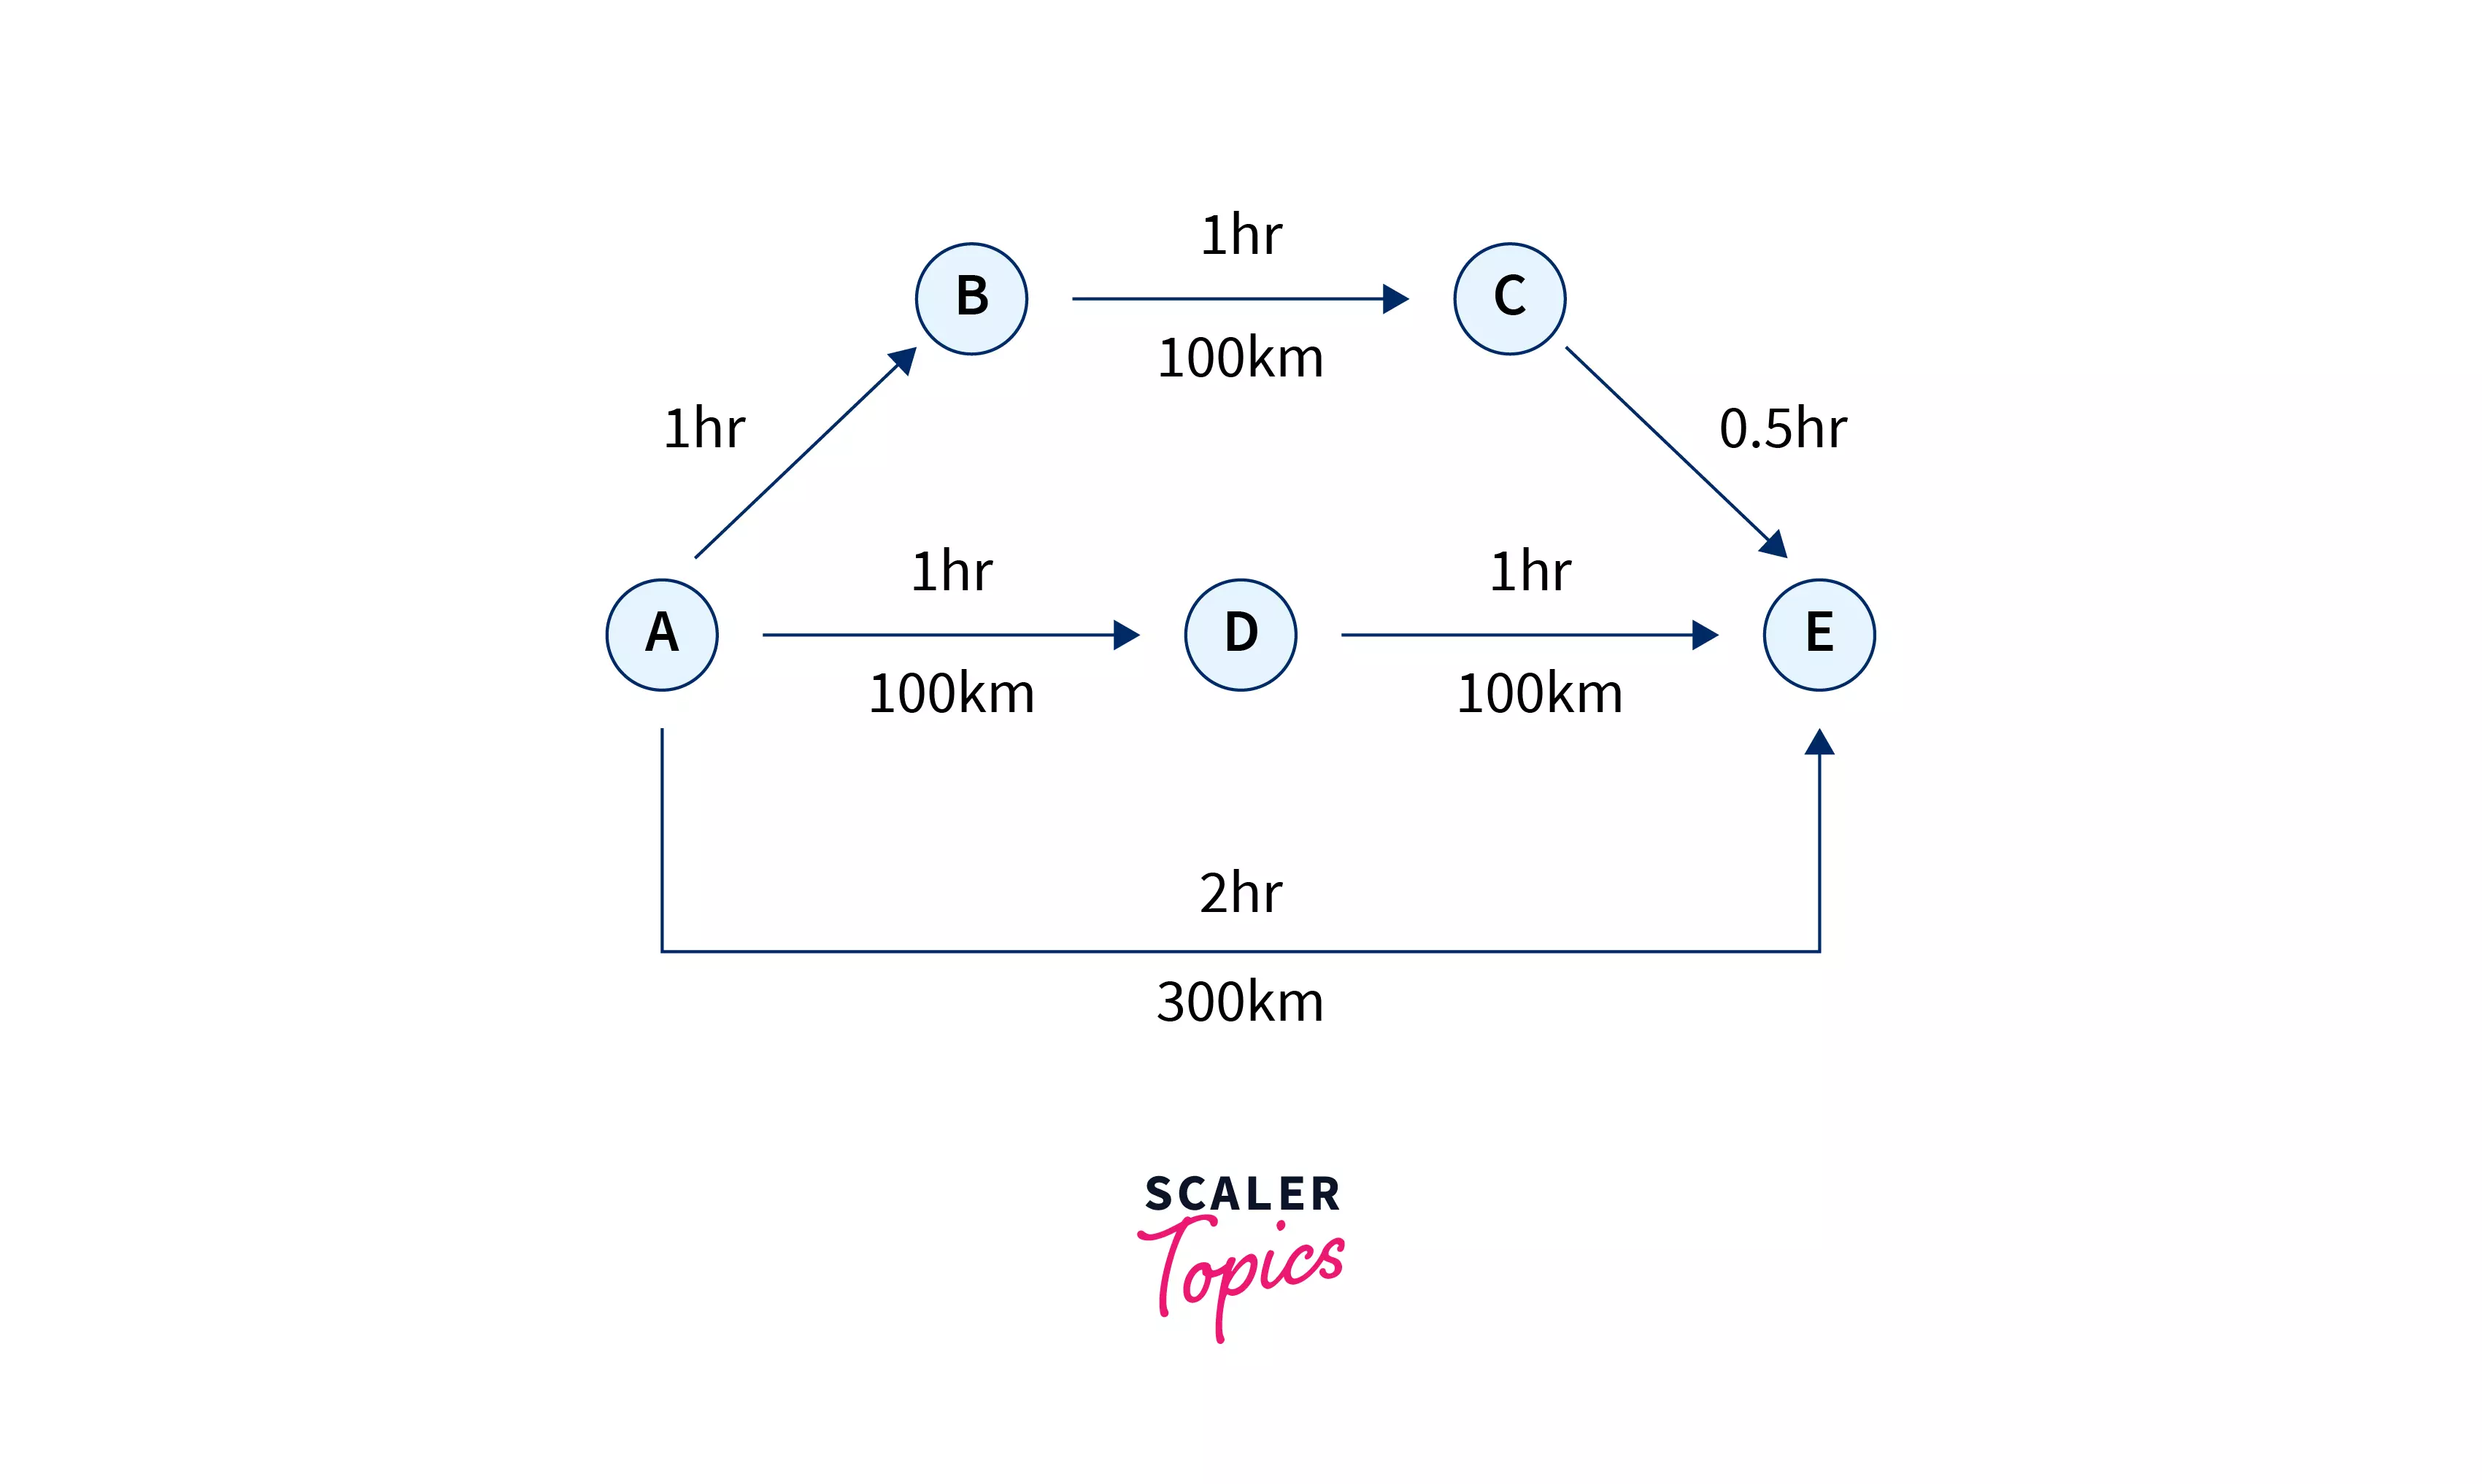
Route 1 goes through two cities B and CRoute 2 goes through only one city DRoute 3 is an expressway and directly goes to E
Now this problem can be modelled as a graph. We can visualize the cities as vertices and the roads as edges. Each edge has two attributes associated: distance and time. Hence we need to account for both in the cost calculation, as Google maps try to optimize the time as well as the distance.
Since the cost is directly proportional to the time and distance, the cost of travel is time * distance.
Thus cost of route 1 = (1 + 1 + 0.5) * (100 + 100 + 50) = 625
cost of route 2 = (2 + 1) * (100 + 100) = 600
cost of route 3 = 2 * 300 = 600
Thus Google Maps will suggest us either route 2 or route 3.
The above logic in data structures and algorithms is called a Breadth-First Search. By visualizing such traversal problems as a graph data structure we can run algorithms like BFS to solve complicated problems.
One More Real-life Example of Graphs We See on Facebook or LinkedIn
Have you ever wondered how Facebook knows how a person is your mutual friend, or how LinkedIn know if some connection is a 2nd or 3rd connection?
Facebook and LinkedIn models their users as a graph where every vertex is a user profile and the edge between two people is the fact that they are friends with each other or follow each other.
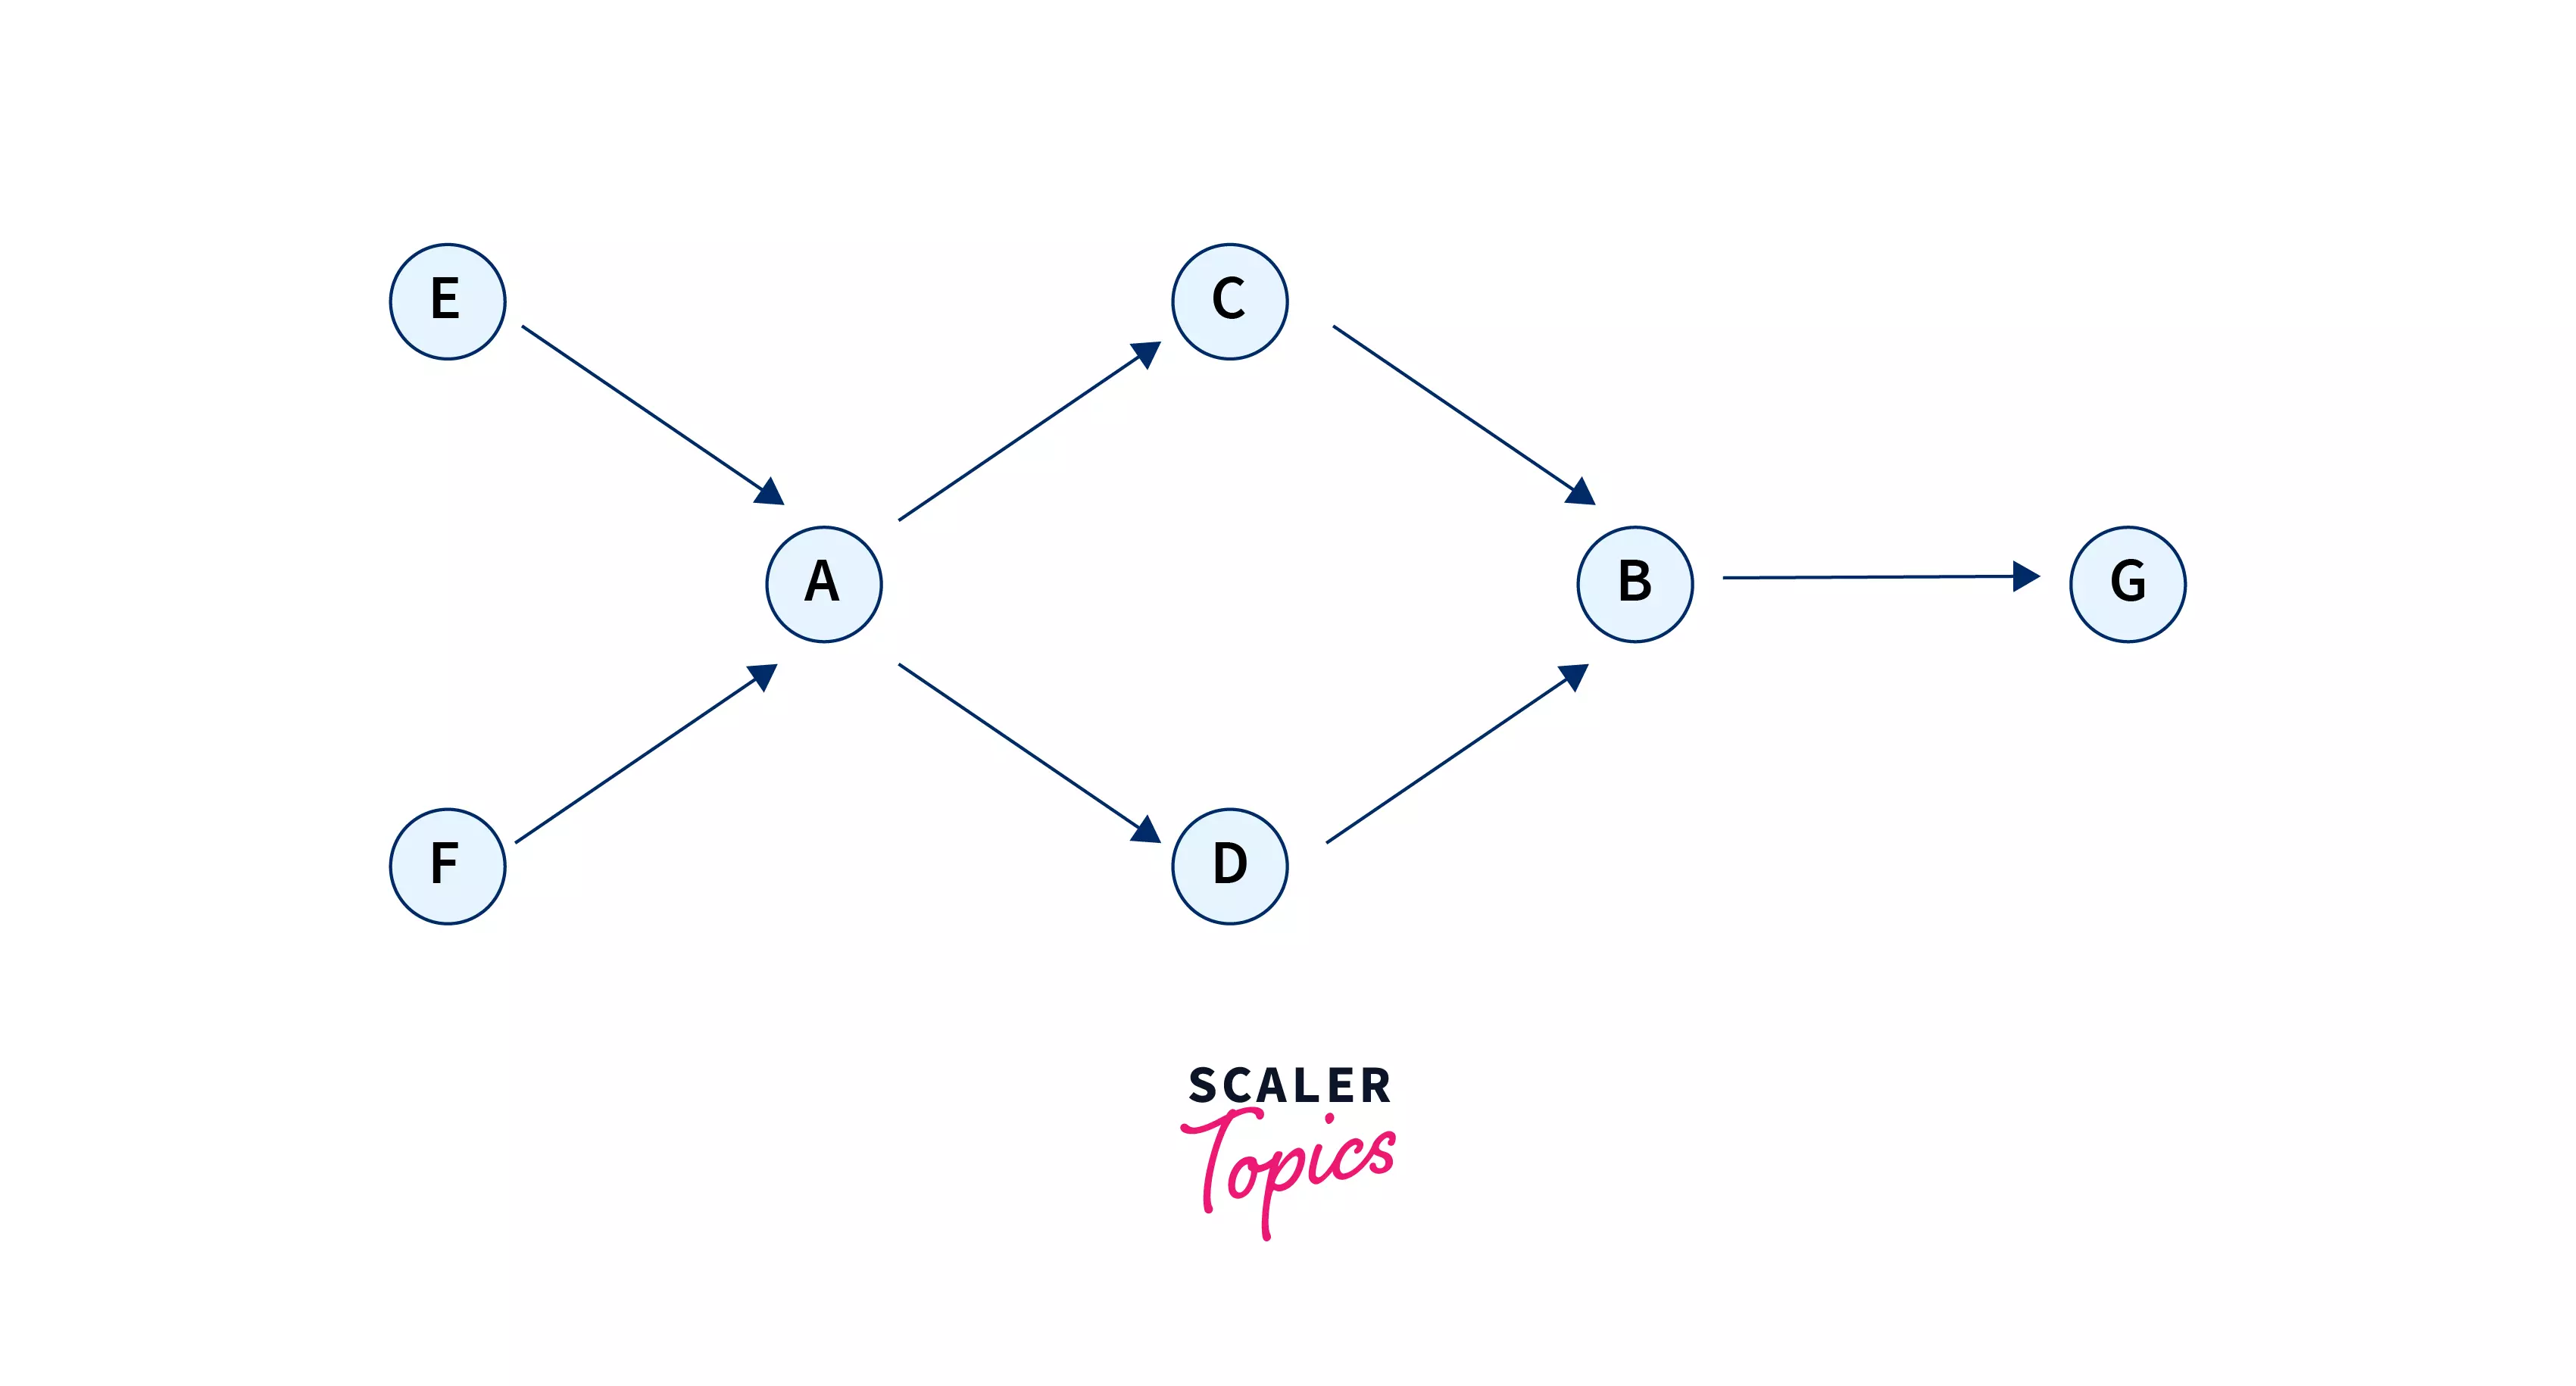
Consider two people A and B on Facebook who have several friends. We can build a graph of their relationships.
Now if Facebook finds all the immediate friends of A, by going through all the immediately adjacent vertices of A, we shall get the set {E,C,D,F}
Similarly, the set of adjacent vertices of B would be {C,D,G}
If we take an intersection of the above two sets, we shall get the set of mutual friends viz. {C,D}
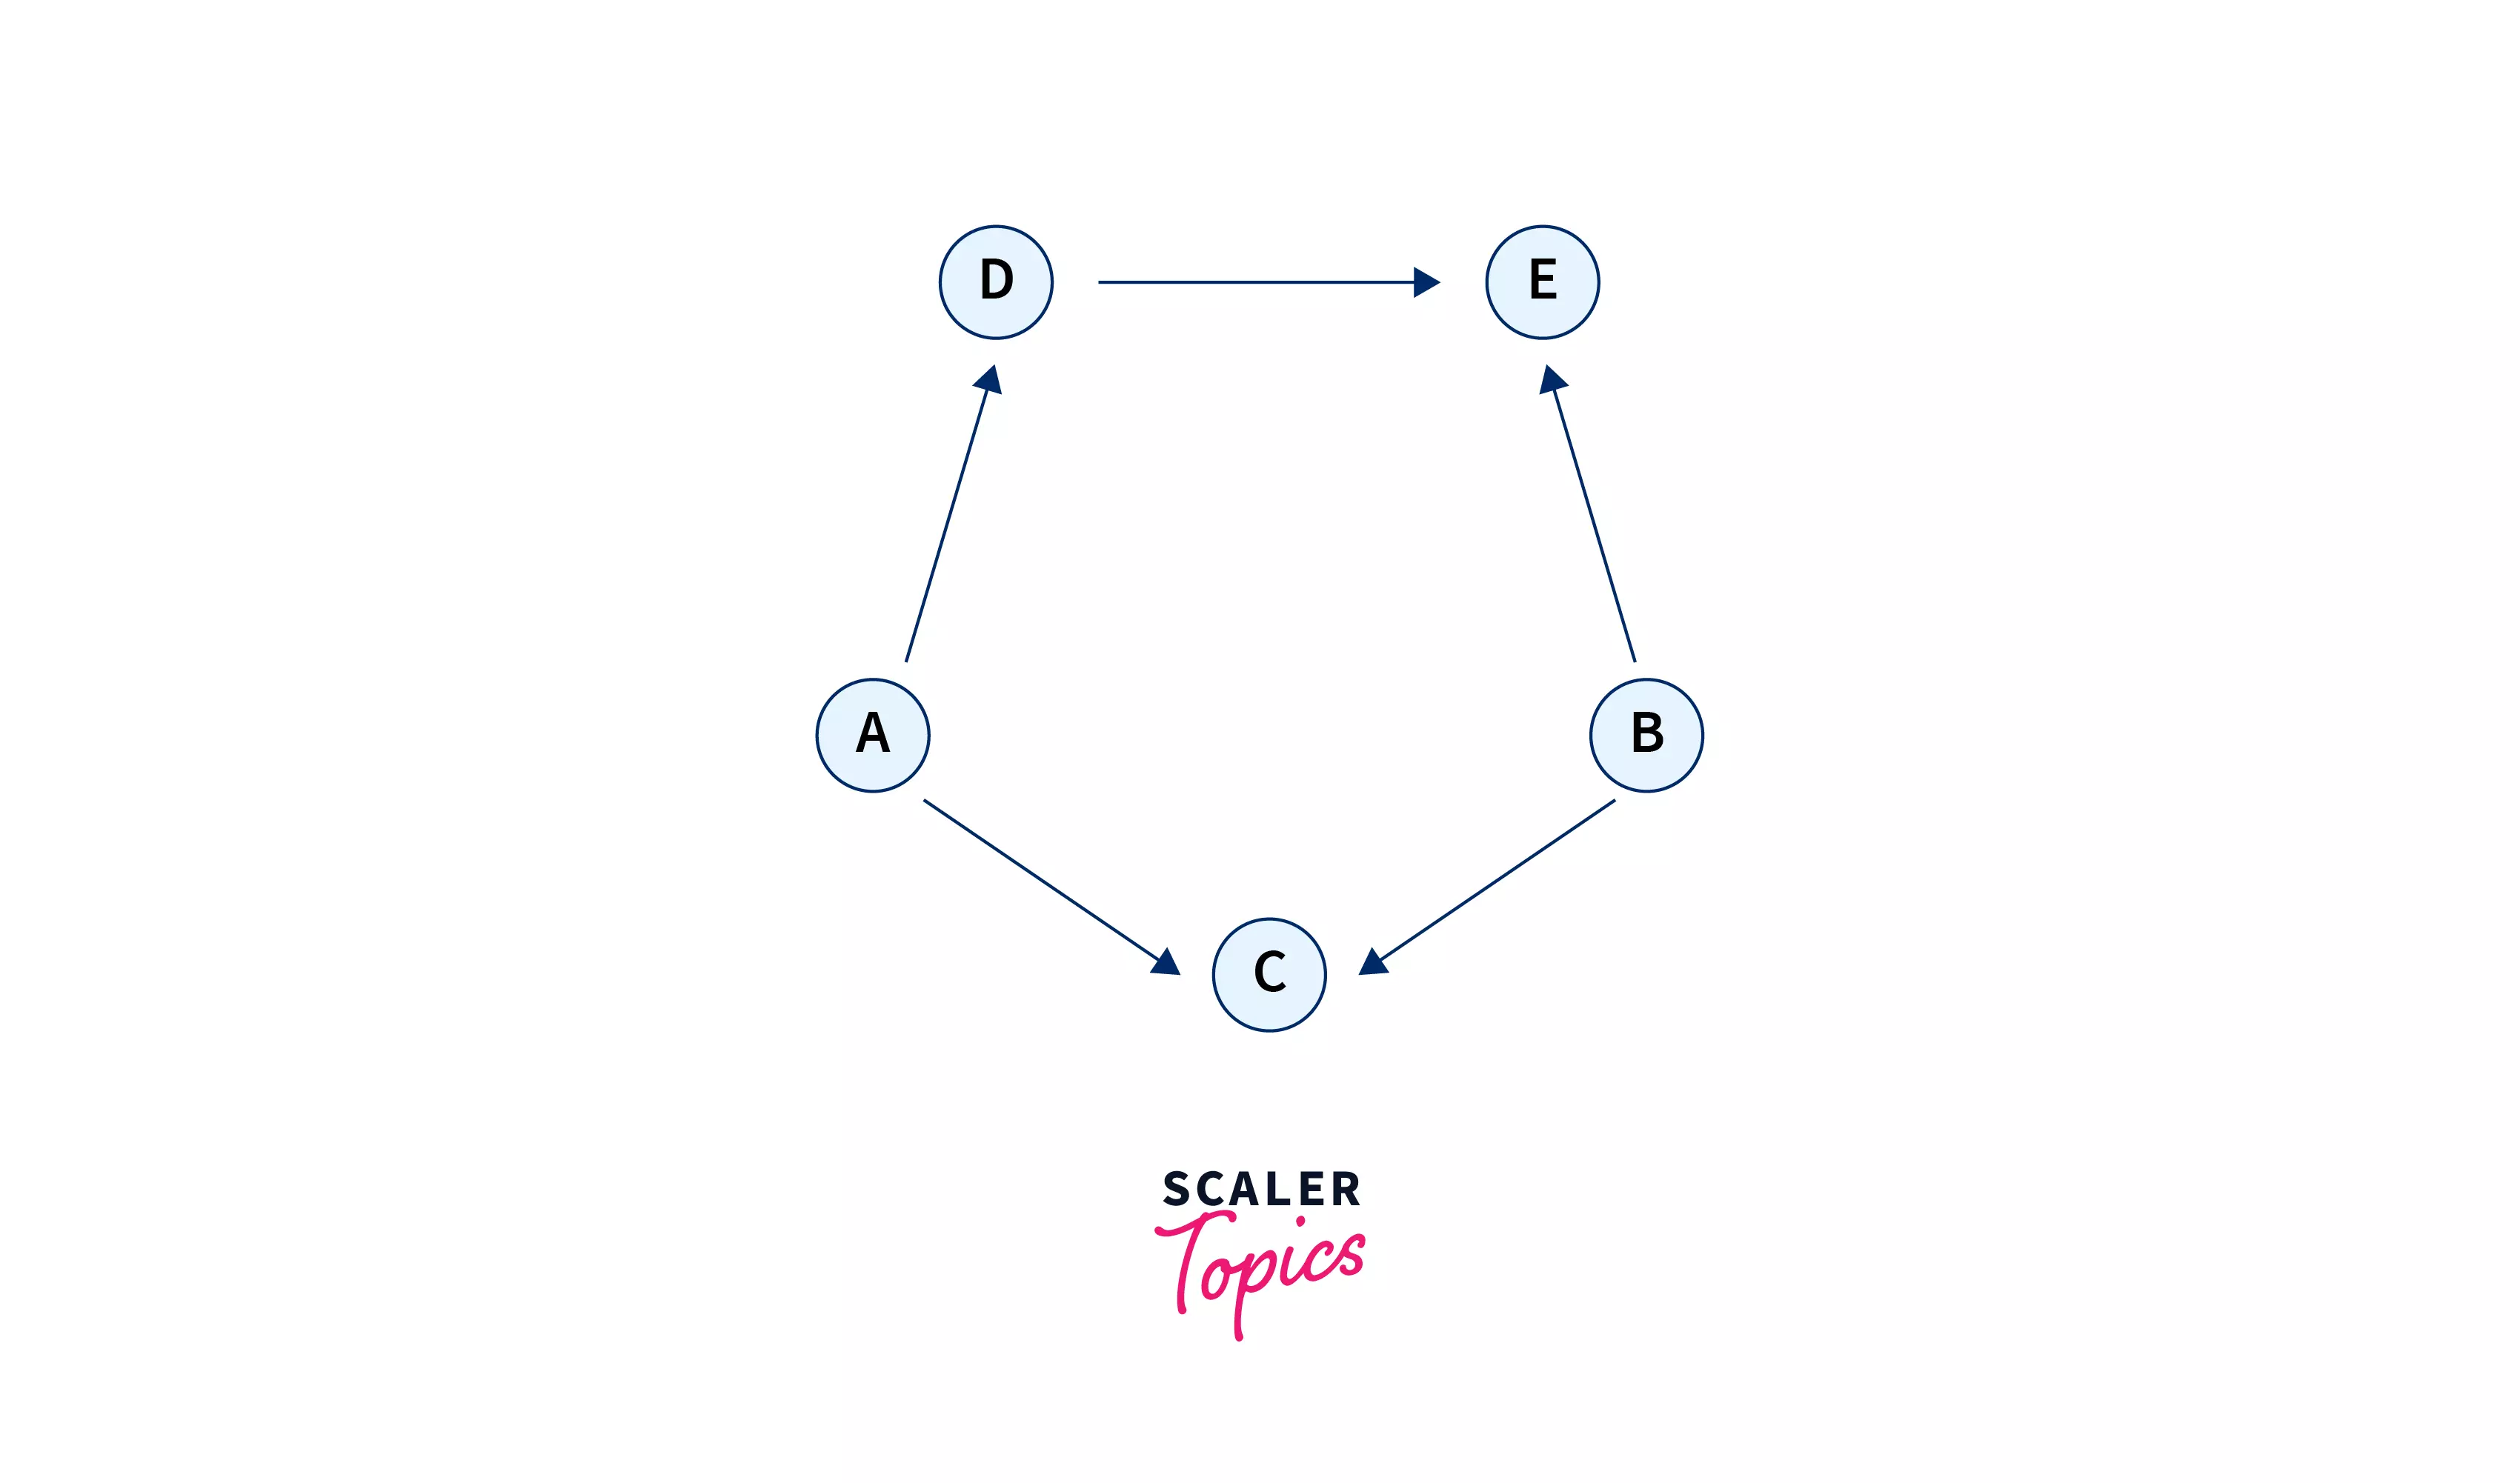
LinkedIn takes it one level higher by telling you how much distance one user has from the other. Assume a graph of users as follows.
We can see that users A and B are connected to each other in two ways.
In graphs, we call two vertices connected if there exists a path between the two.
LinkedIn computes all the possible paths between two users and reports the length of the shortest path as the degree of connection between two users.
Google Uses Graphs to Build a Knowledge Base
There are millions of articles on the internet, be it about famous people, food, animals, cities, or history. Every article is centred around an object, the object could be a person, an animal, some food item or a country. We can visualize these objects as a vertex in a graph. The relationship between them can be thought of as an edge in the graph.
For example, Albert Einstein was born in Germany. This fact can be broken down into two vertices, Einstein and Germany. Einstein being born in Germany is a relationship, essentially an edge between Einstein and Germany.
Google crawls through almost all public internet links and tries to build a knowledge graph of all the information out there on the Internet.
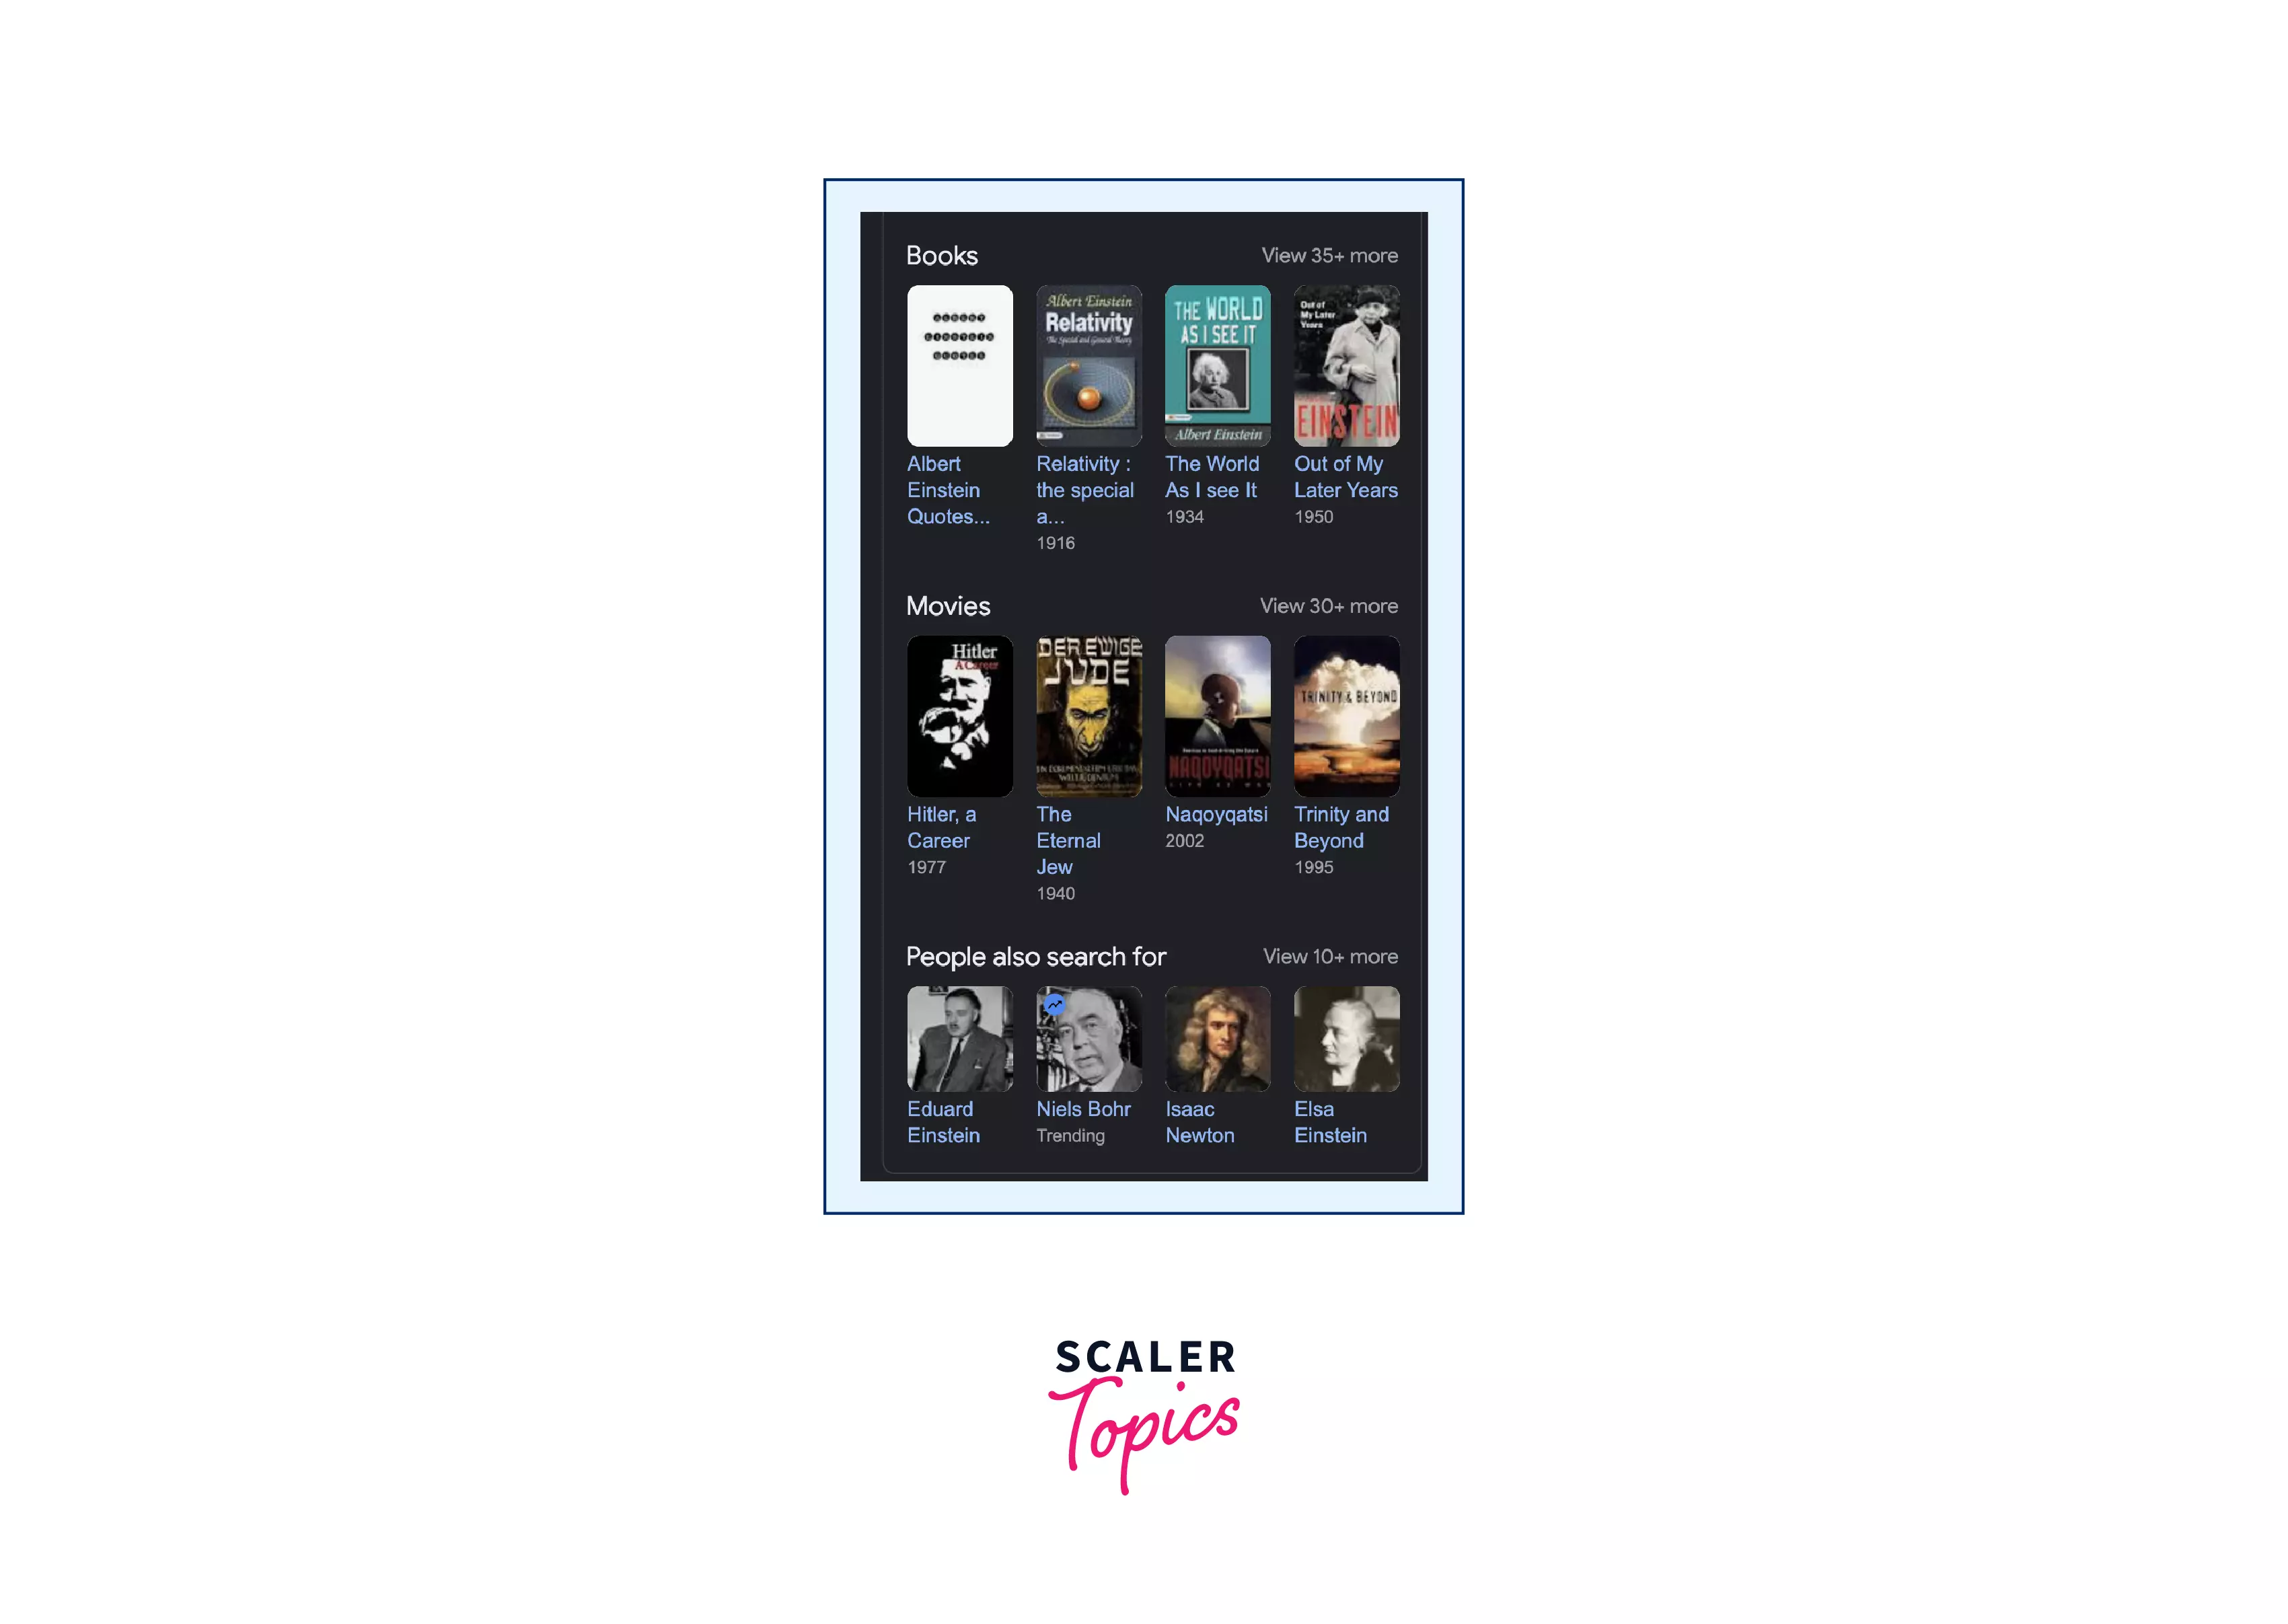
Google then uses this graph to show relevant information when a user searches for a keyword on Google search.
For example, this is what you see when you search Einstein’s name. There is a plethora of information that Google has understood is connected to Einstein due to their knowledge graphs!
Conclusion
- Graphs are
non-linear data structuresthat are essentially a set of edges and vertices Google Mapsuses graphs to find the optimum distance between two placesFacebookused graphs to find out all your mutual friends you have with a direct friendLinkedInreports the degree of connection between two users using graphs.