Time Series Forecasting Methods- Auto Regressive
Overview
Predicting future trends and patterns of data is the focus of time series forecasting, a crucial field of data analytics. Time series forecasting can be done using a variety of techniques, one of which is the Auto Regressive (AR) model. The study of time series data and the projection of future values have both shown the value of the Autoregressive model. The Autoregressive model and how to use Excel to fit an ARIMA model to a time series are covered in this article.
Pre-requisistes
To understand the concepts discussed in this article - readers should have
- A basic understanding of statistics and time series analysis.
- It would also be helpful to have some knowledge of Excel and data analysis tools.
What is an Autoregressive Model?
An Autoregressive model is a statistical model used for time series forecasting. The model assumes that the value of a variable at a given time is dependent on its previous values. In other words, the current value of a variable is a function of its past values. The auto regressive model is particularly useful in predicting future values of a variable based on its past behavior.
Autoregressive Model Explained
In an Autoregressive model, the variable being modeled is referred to as the dependent variable or endogenous variable, while the past values of the same variable are referred to as the independent or explanatory variables. The number of past values used in the model is called the order of the model, denoted as p.
For example, an AR(1) model uses only the most recent past value of the variable to predict the next value, while an AR(2) model uses the two most recent past values of the variable to make the prediction.
Formula
The formula for an auto regressive model of order p is as follows:
Where:
- Yt is the current value of the time series
- c is a constant, φi are the coefficients
- Yt-i are the past values of the time series
- εt is the error term.
Fit an ARIMA Model to a Time Series in Excel
ARIMA (Autoregressive Integrated Moving Average) is a widely used time series forecasting model. It combines the AR(Auto Regressive) and MA(Moving Average) models and can handle data with trends and seasonality.
Dataset to Fit an ARIMA Model to a Time Series
First, you need a dataset to fit an ARIMA model. The dataset should have a time series variable and other relevant variables.
We will be using the dataset from here.
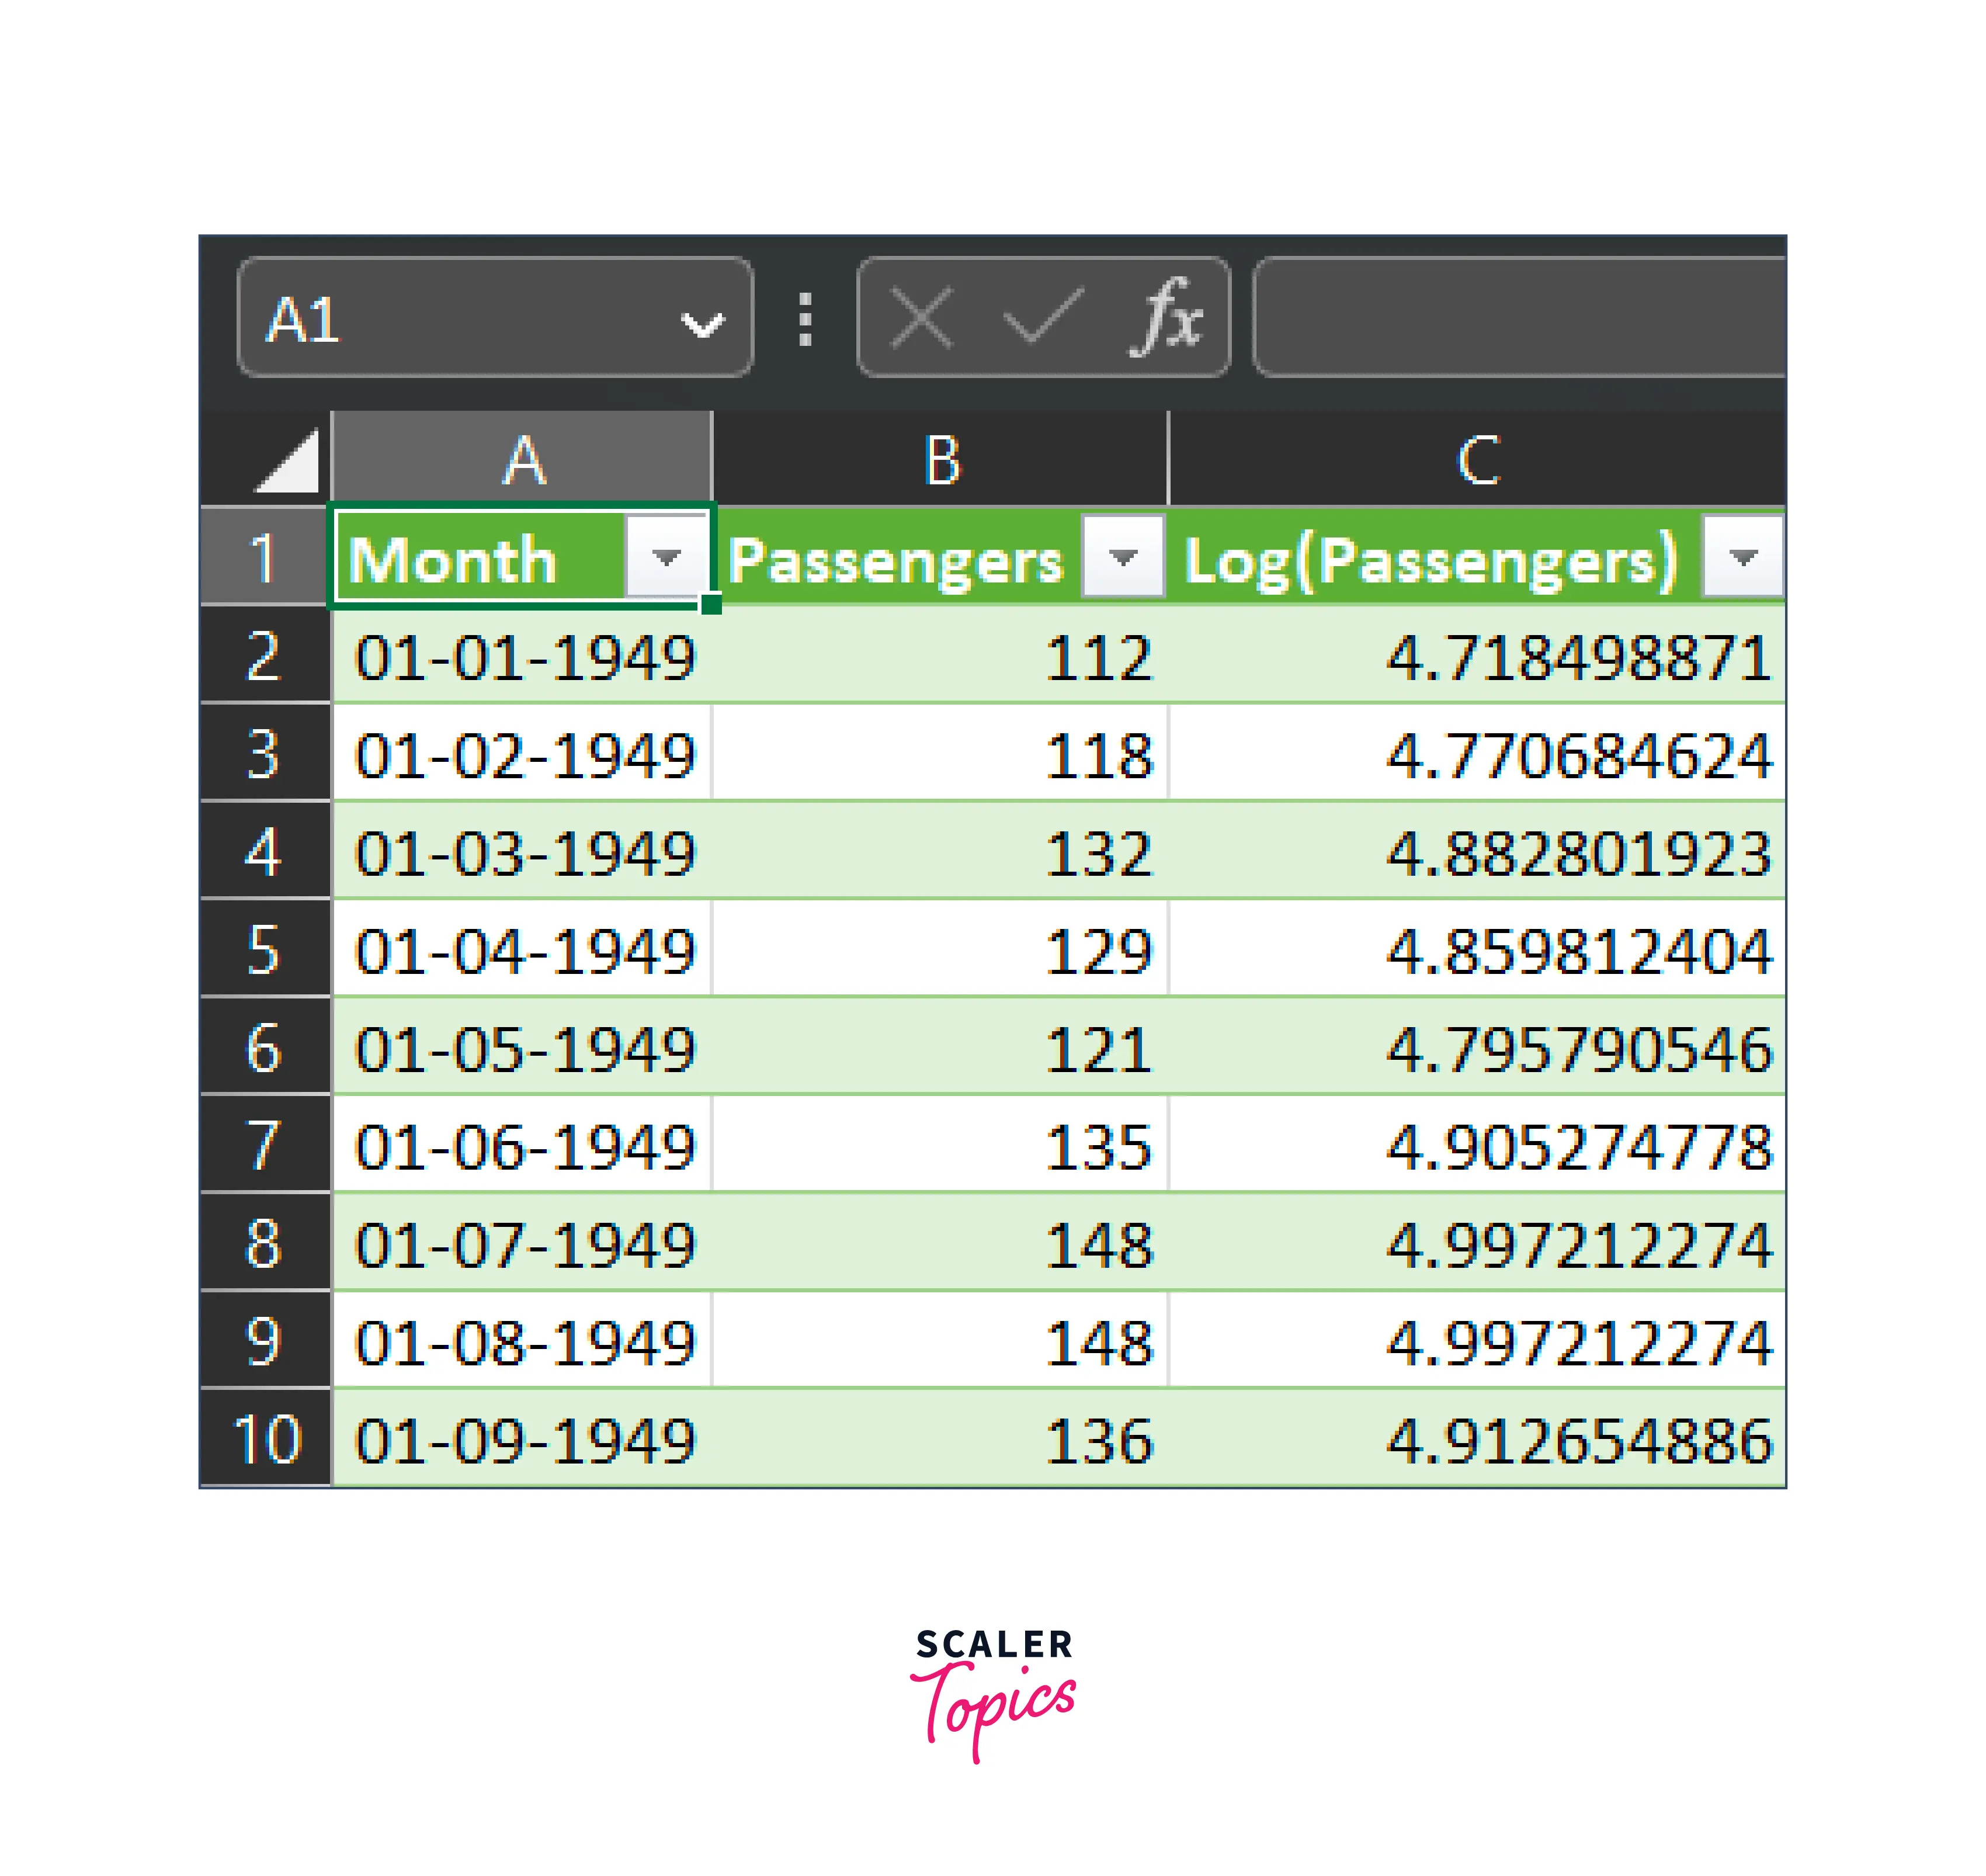
Setting Up the Fitting of an ARIMA Model to a Time Series
Here is a step-by-step guide to fitting an ARIMA model to a time series in Excel:
-
Load your time series data into Excel. Make sure that the data is in a column and that each row represents a single period.
-
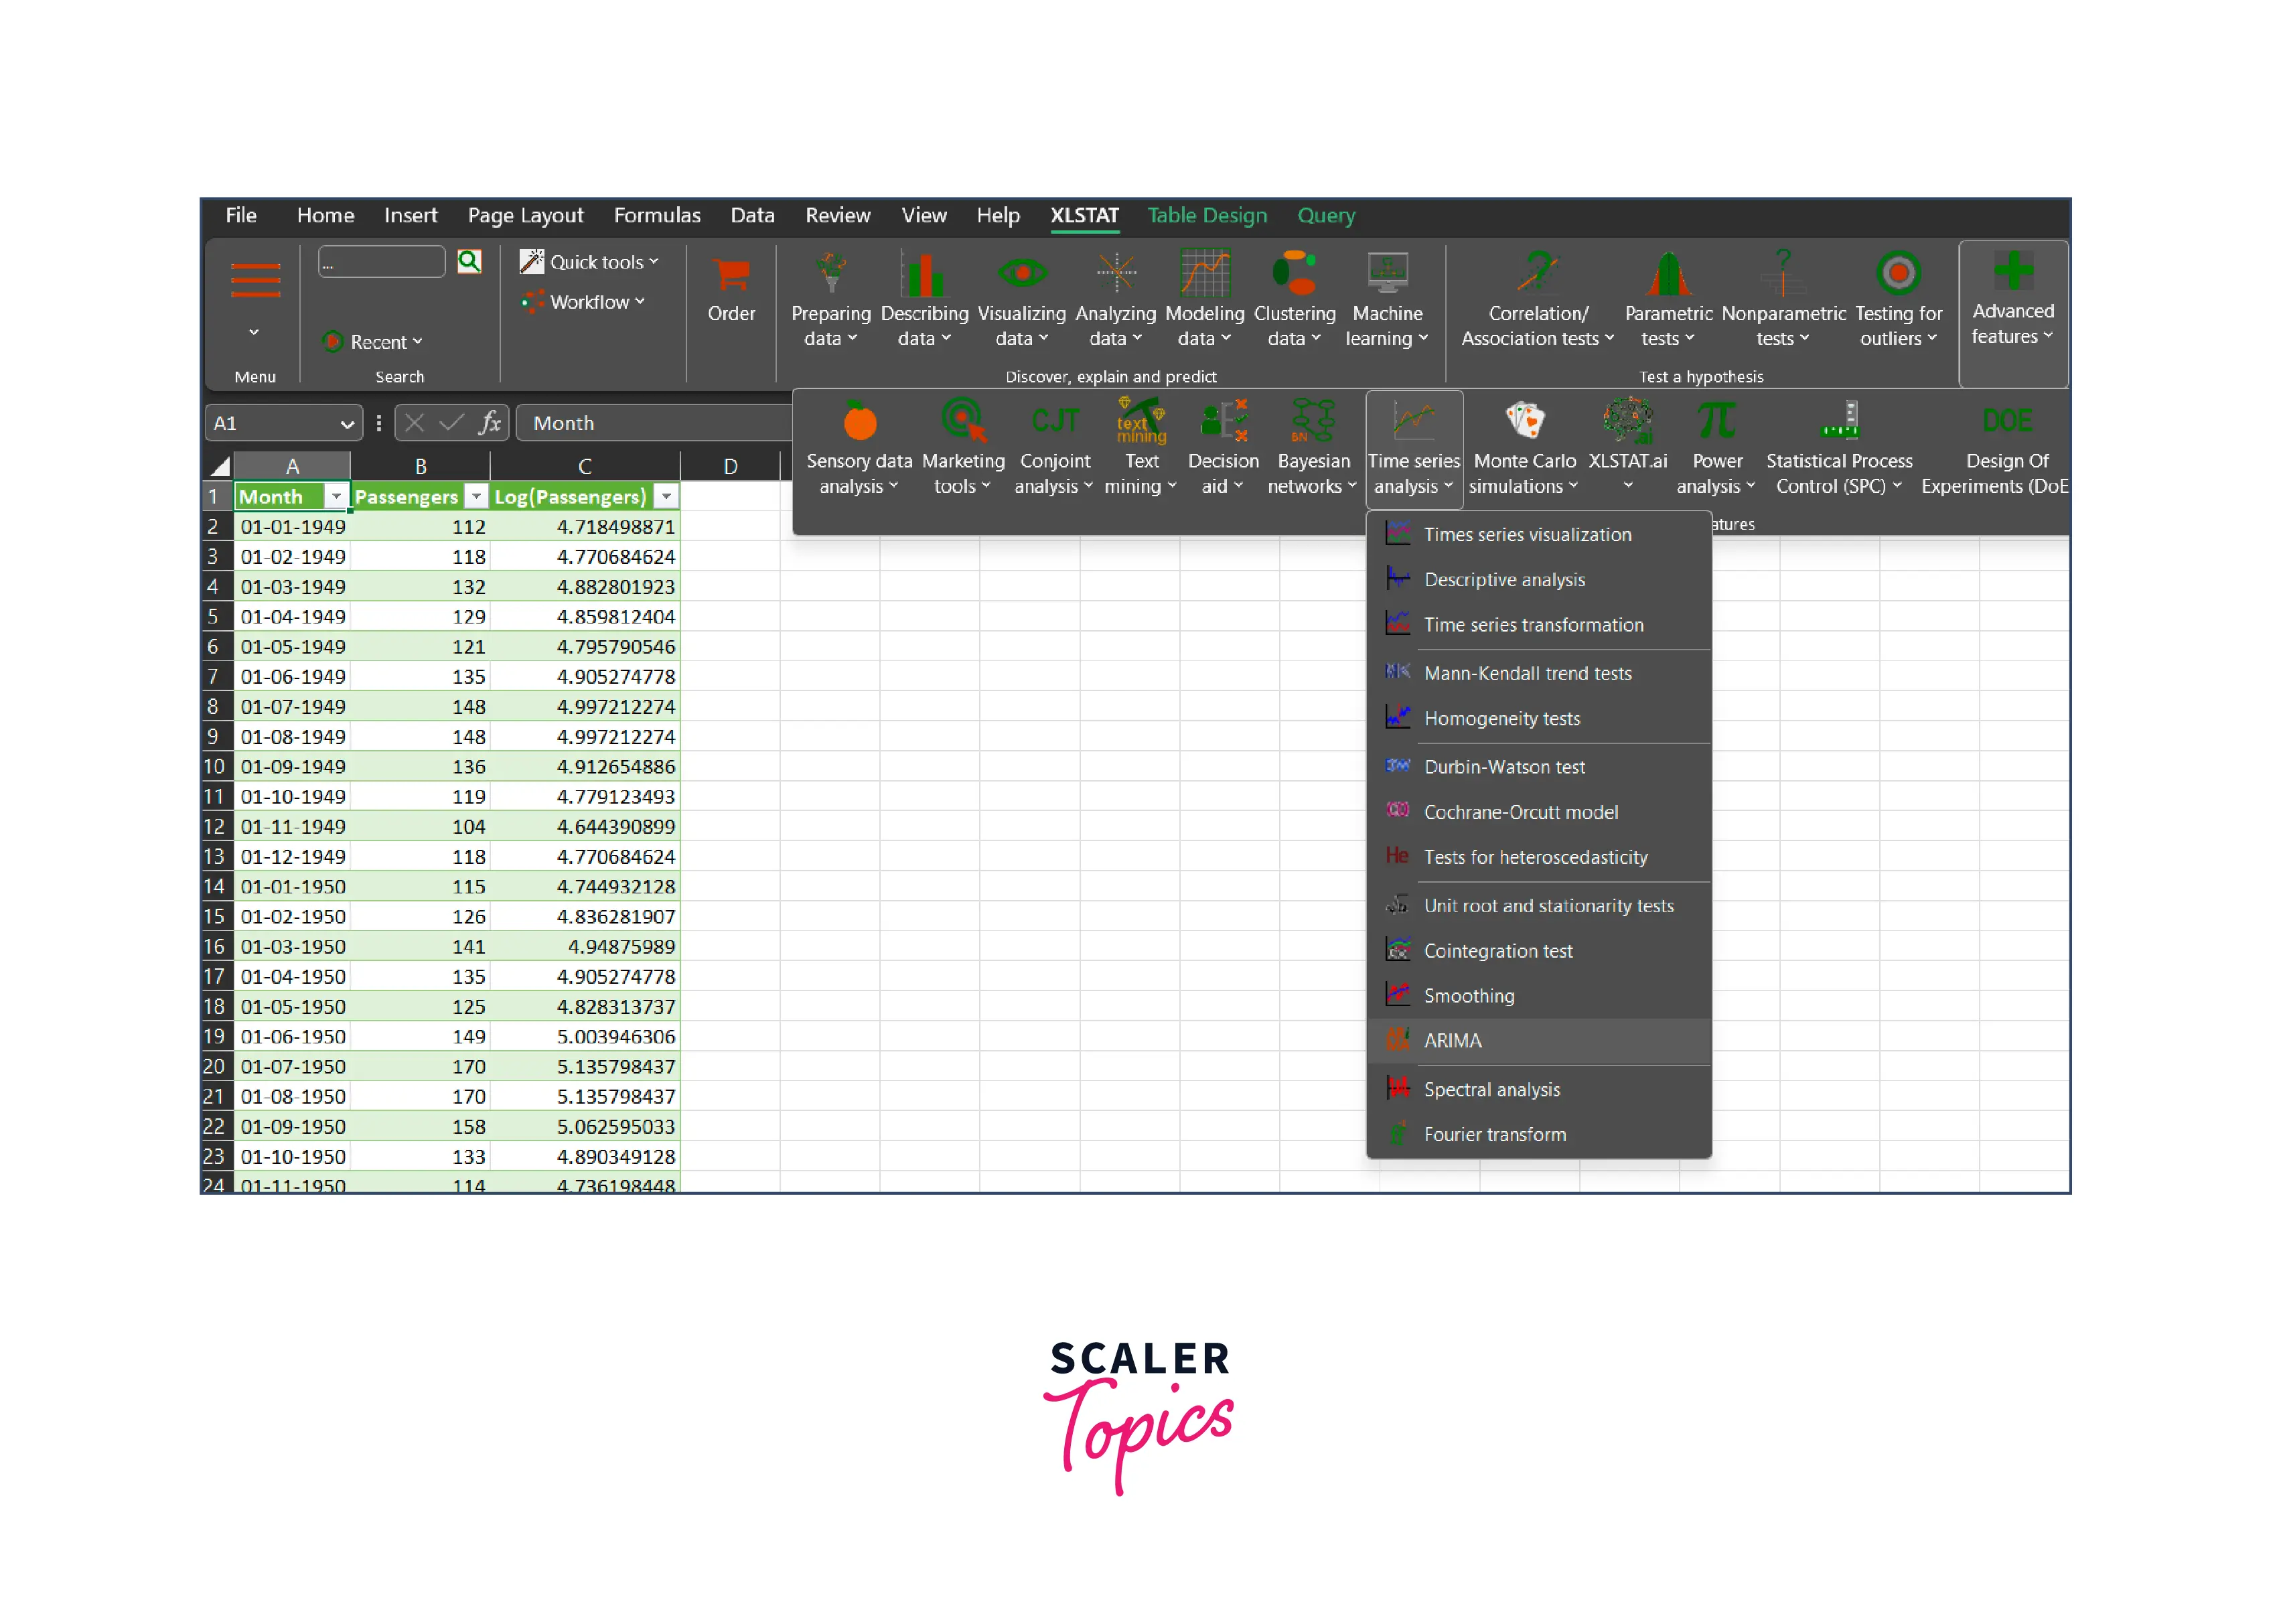
Launch XLSTAT and navigate to the Time Series Analysis section. Select the ARIMA command.
-
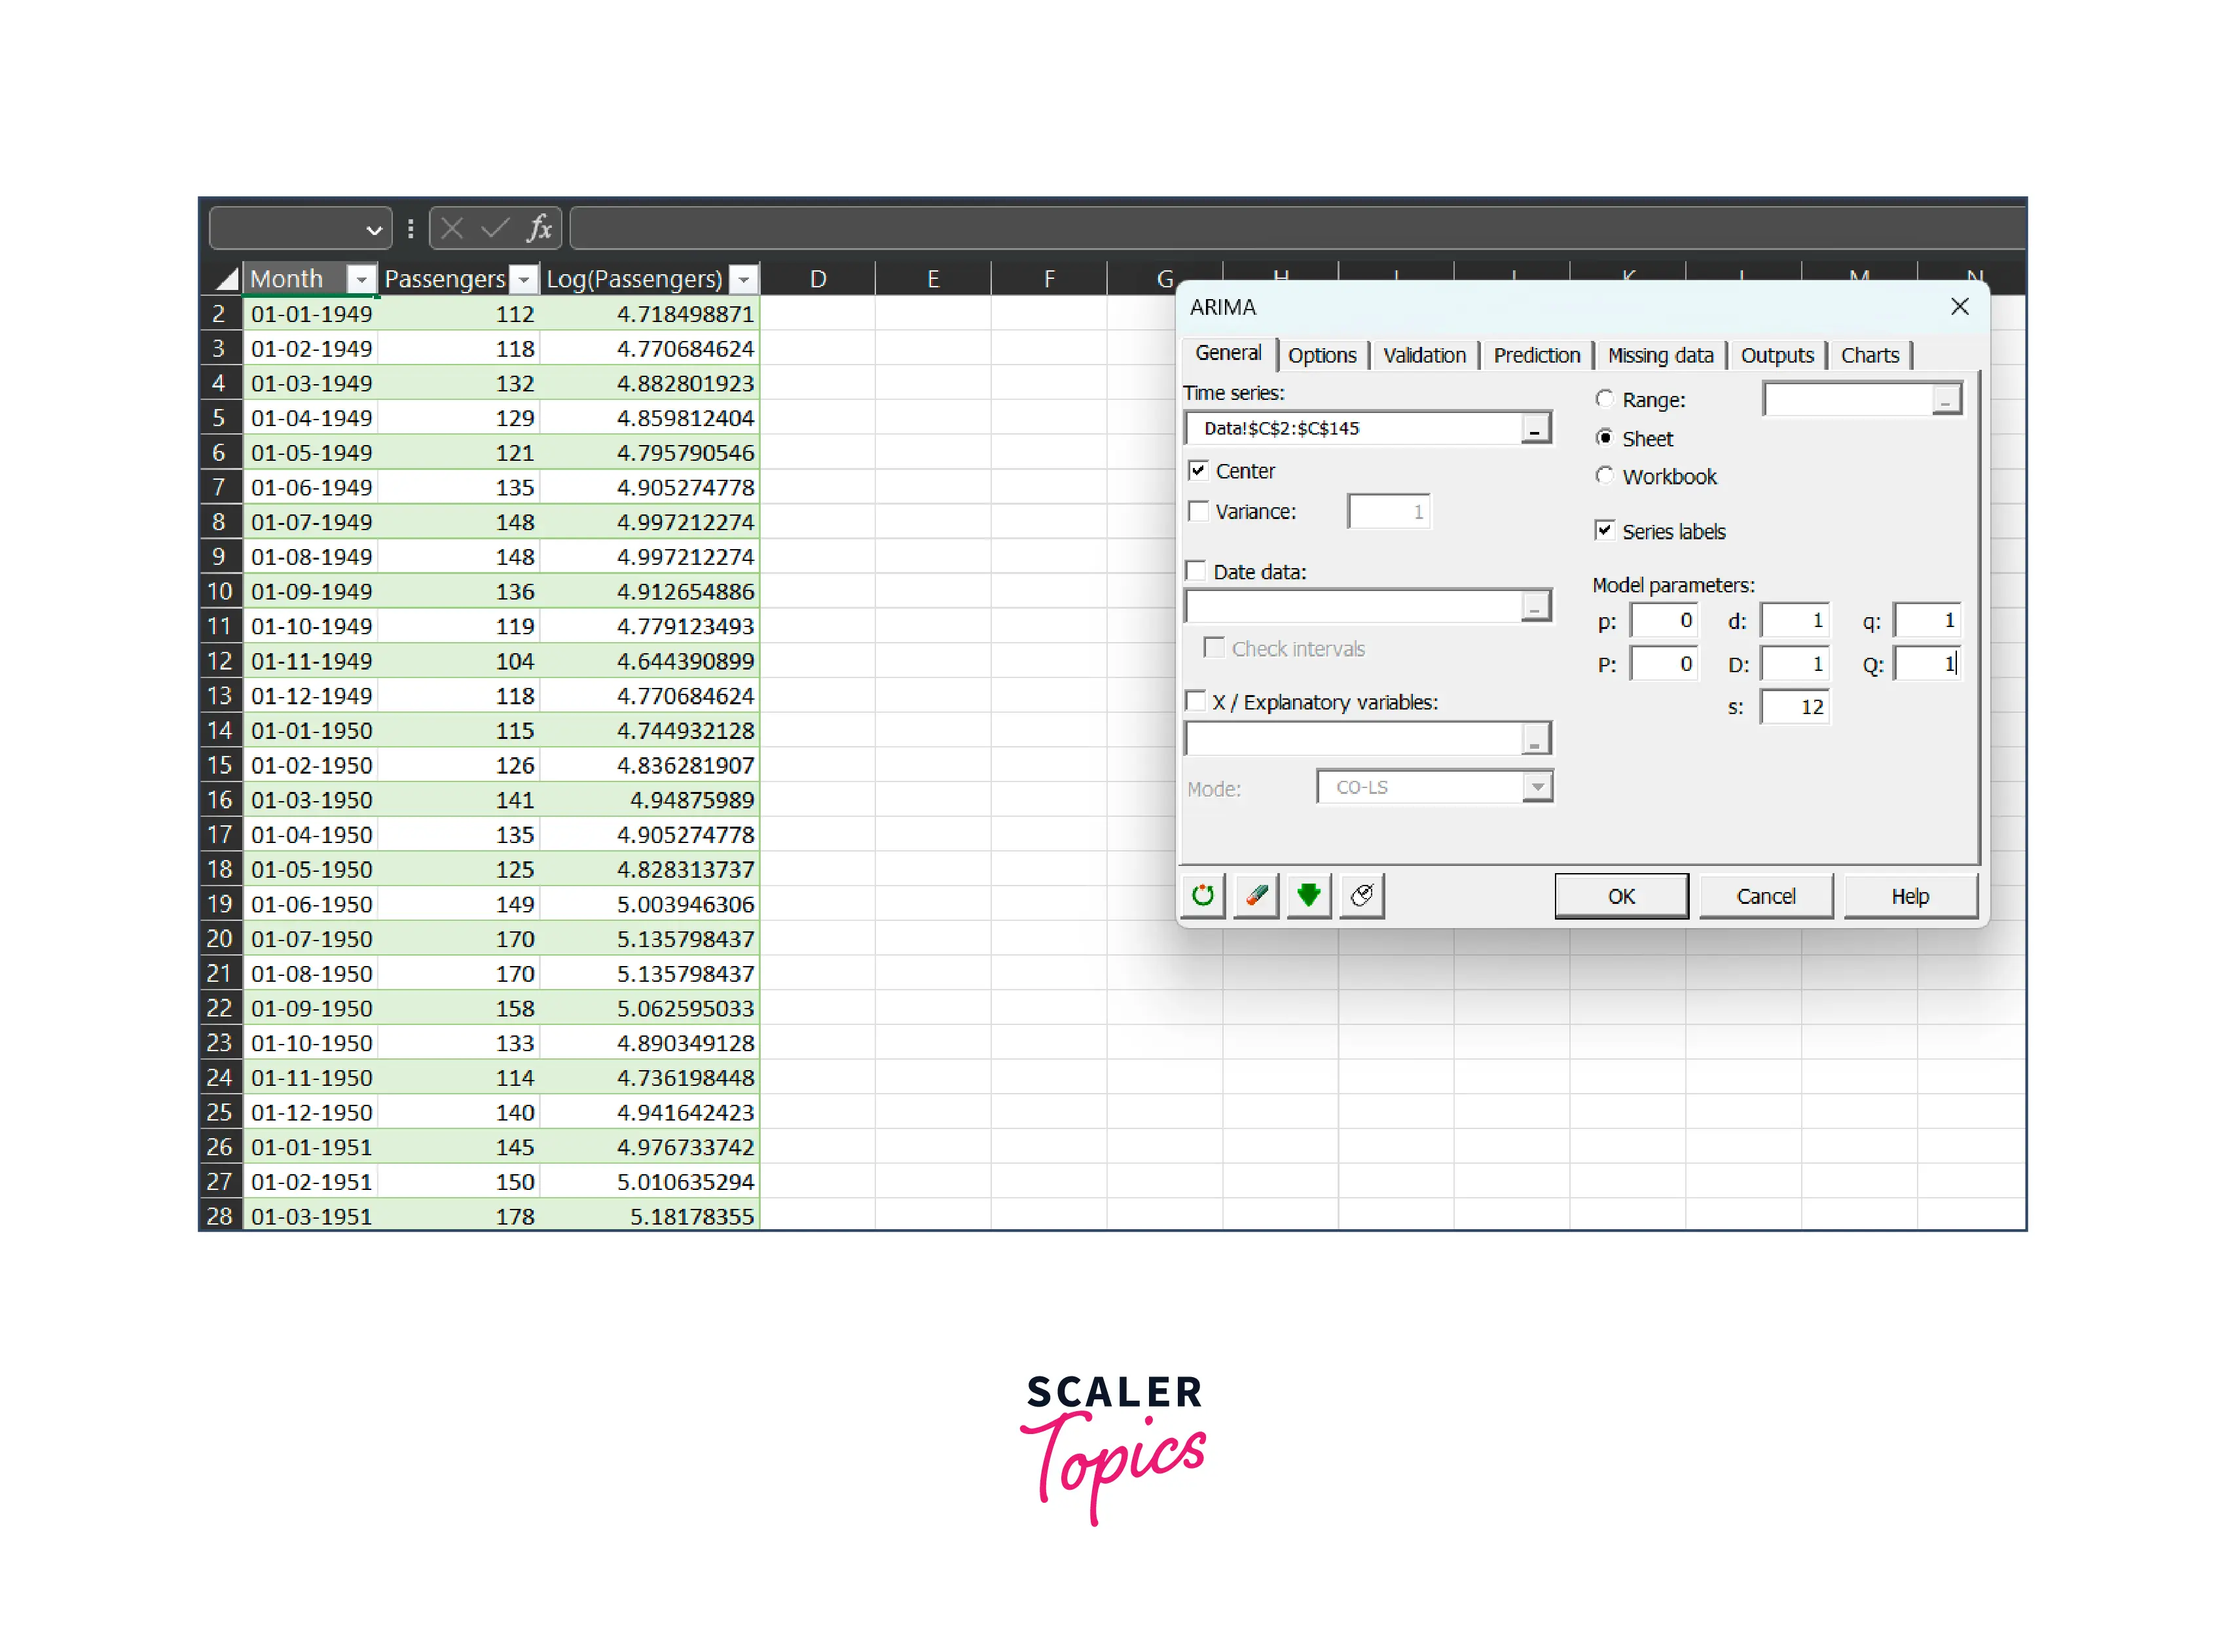
In the Times series field of the ARIMA dialog box that appears, select the Log(Passengers) data from your Excel sheet.
-
Enable the Center option to have XLSTAT automatically center the series before optimizing the ARIMA model.
-
Specify the (p,d,q)(P, D, Q)s orders for your ARIMA model and set the period of the series to 12 to account for yearly cycles.
-
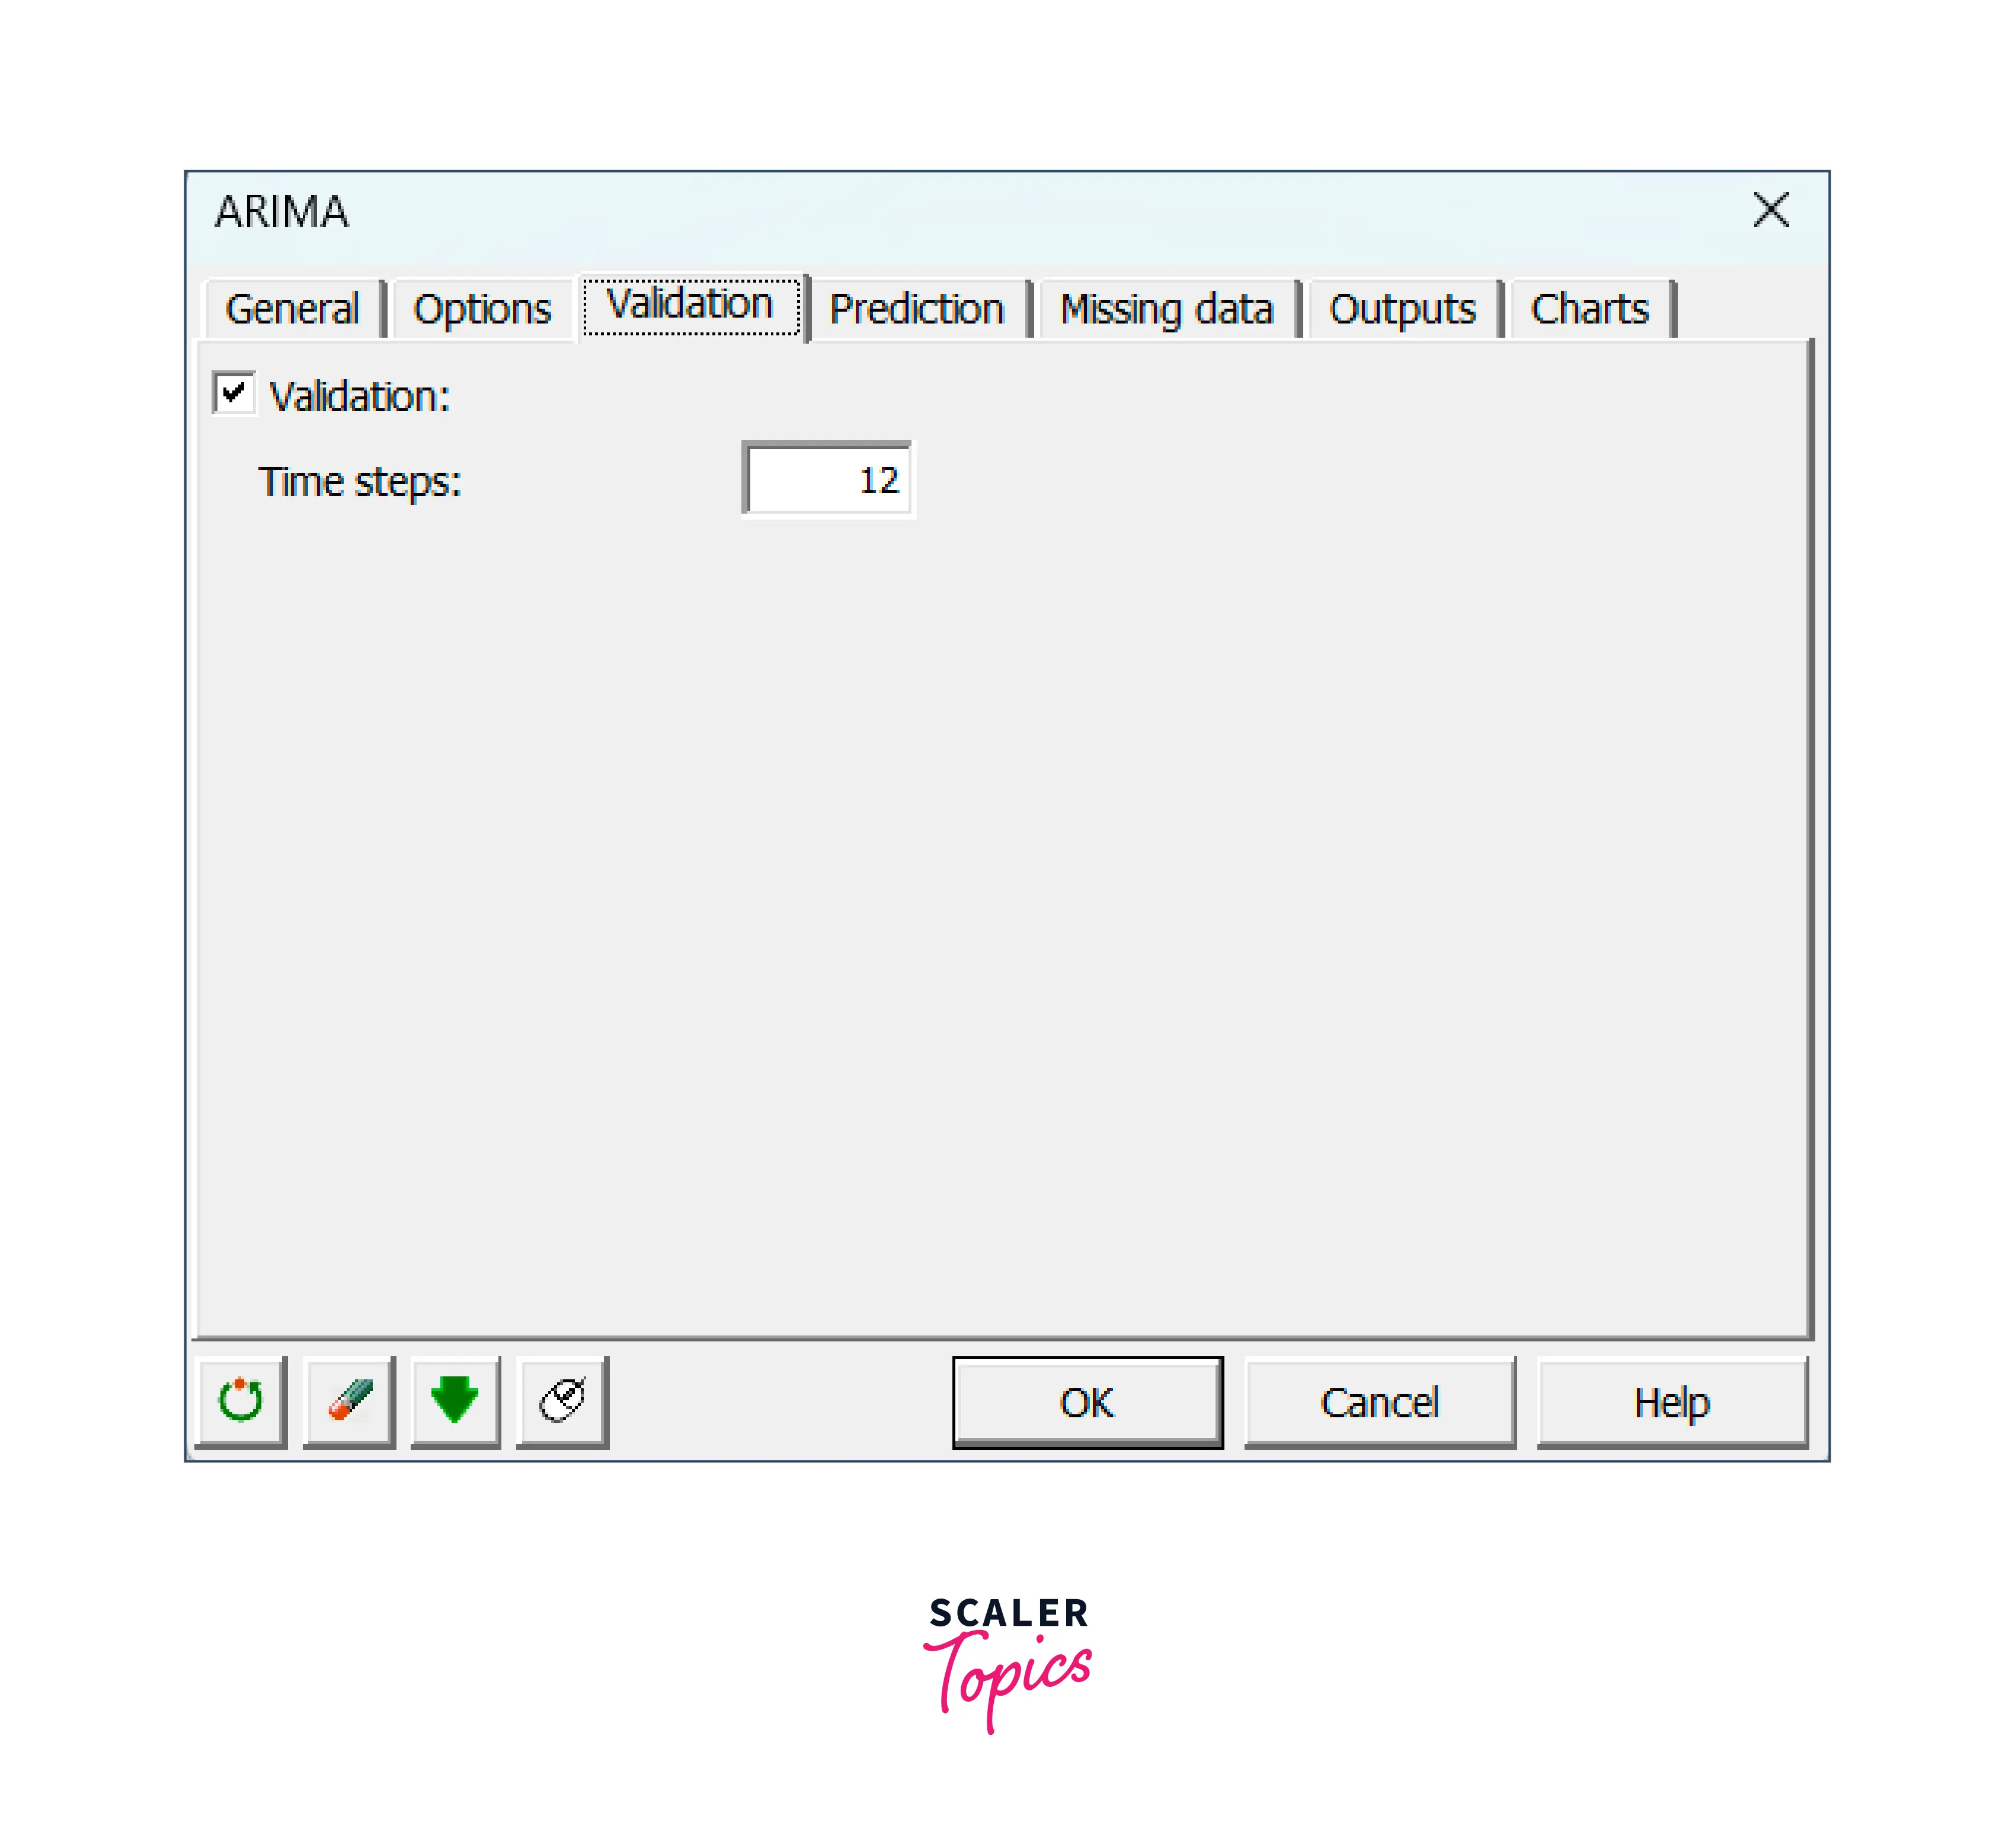
In the validation tab, enter 12 to exclude the last 12 values from model fitting and use them only for validation purposes.
-
Click OK to begin computations.
Interpreting the Results of an ARIMA Model Fitting to a Time Series
- When you fit an ARIMA model to a time series in Excel, you get a set of coefficients that represent the relationship between the past and future values of the time series.
- The output of the ARIMA model fitting in Excel provides you with information about the quality of the model fit.
- This information includes the standard errors, t-statistics, and p-values for the coefficients.
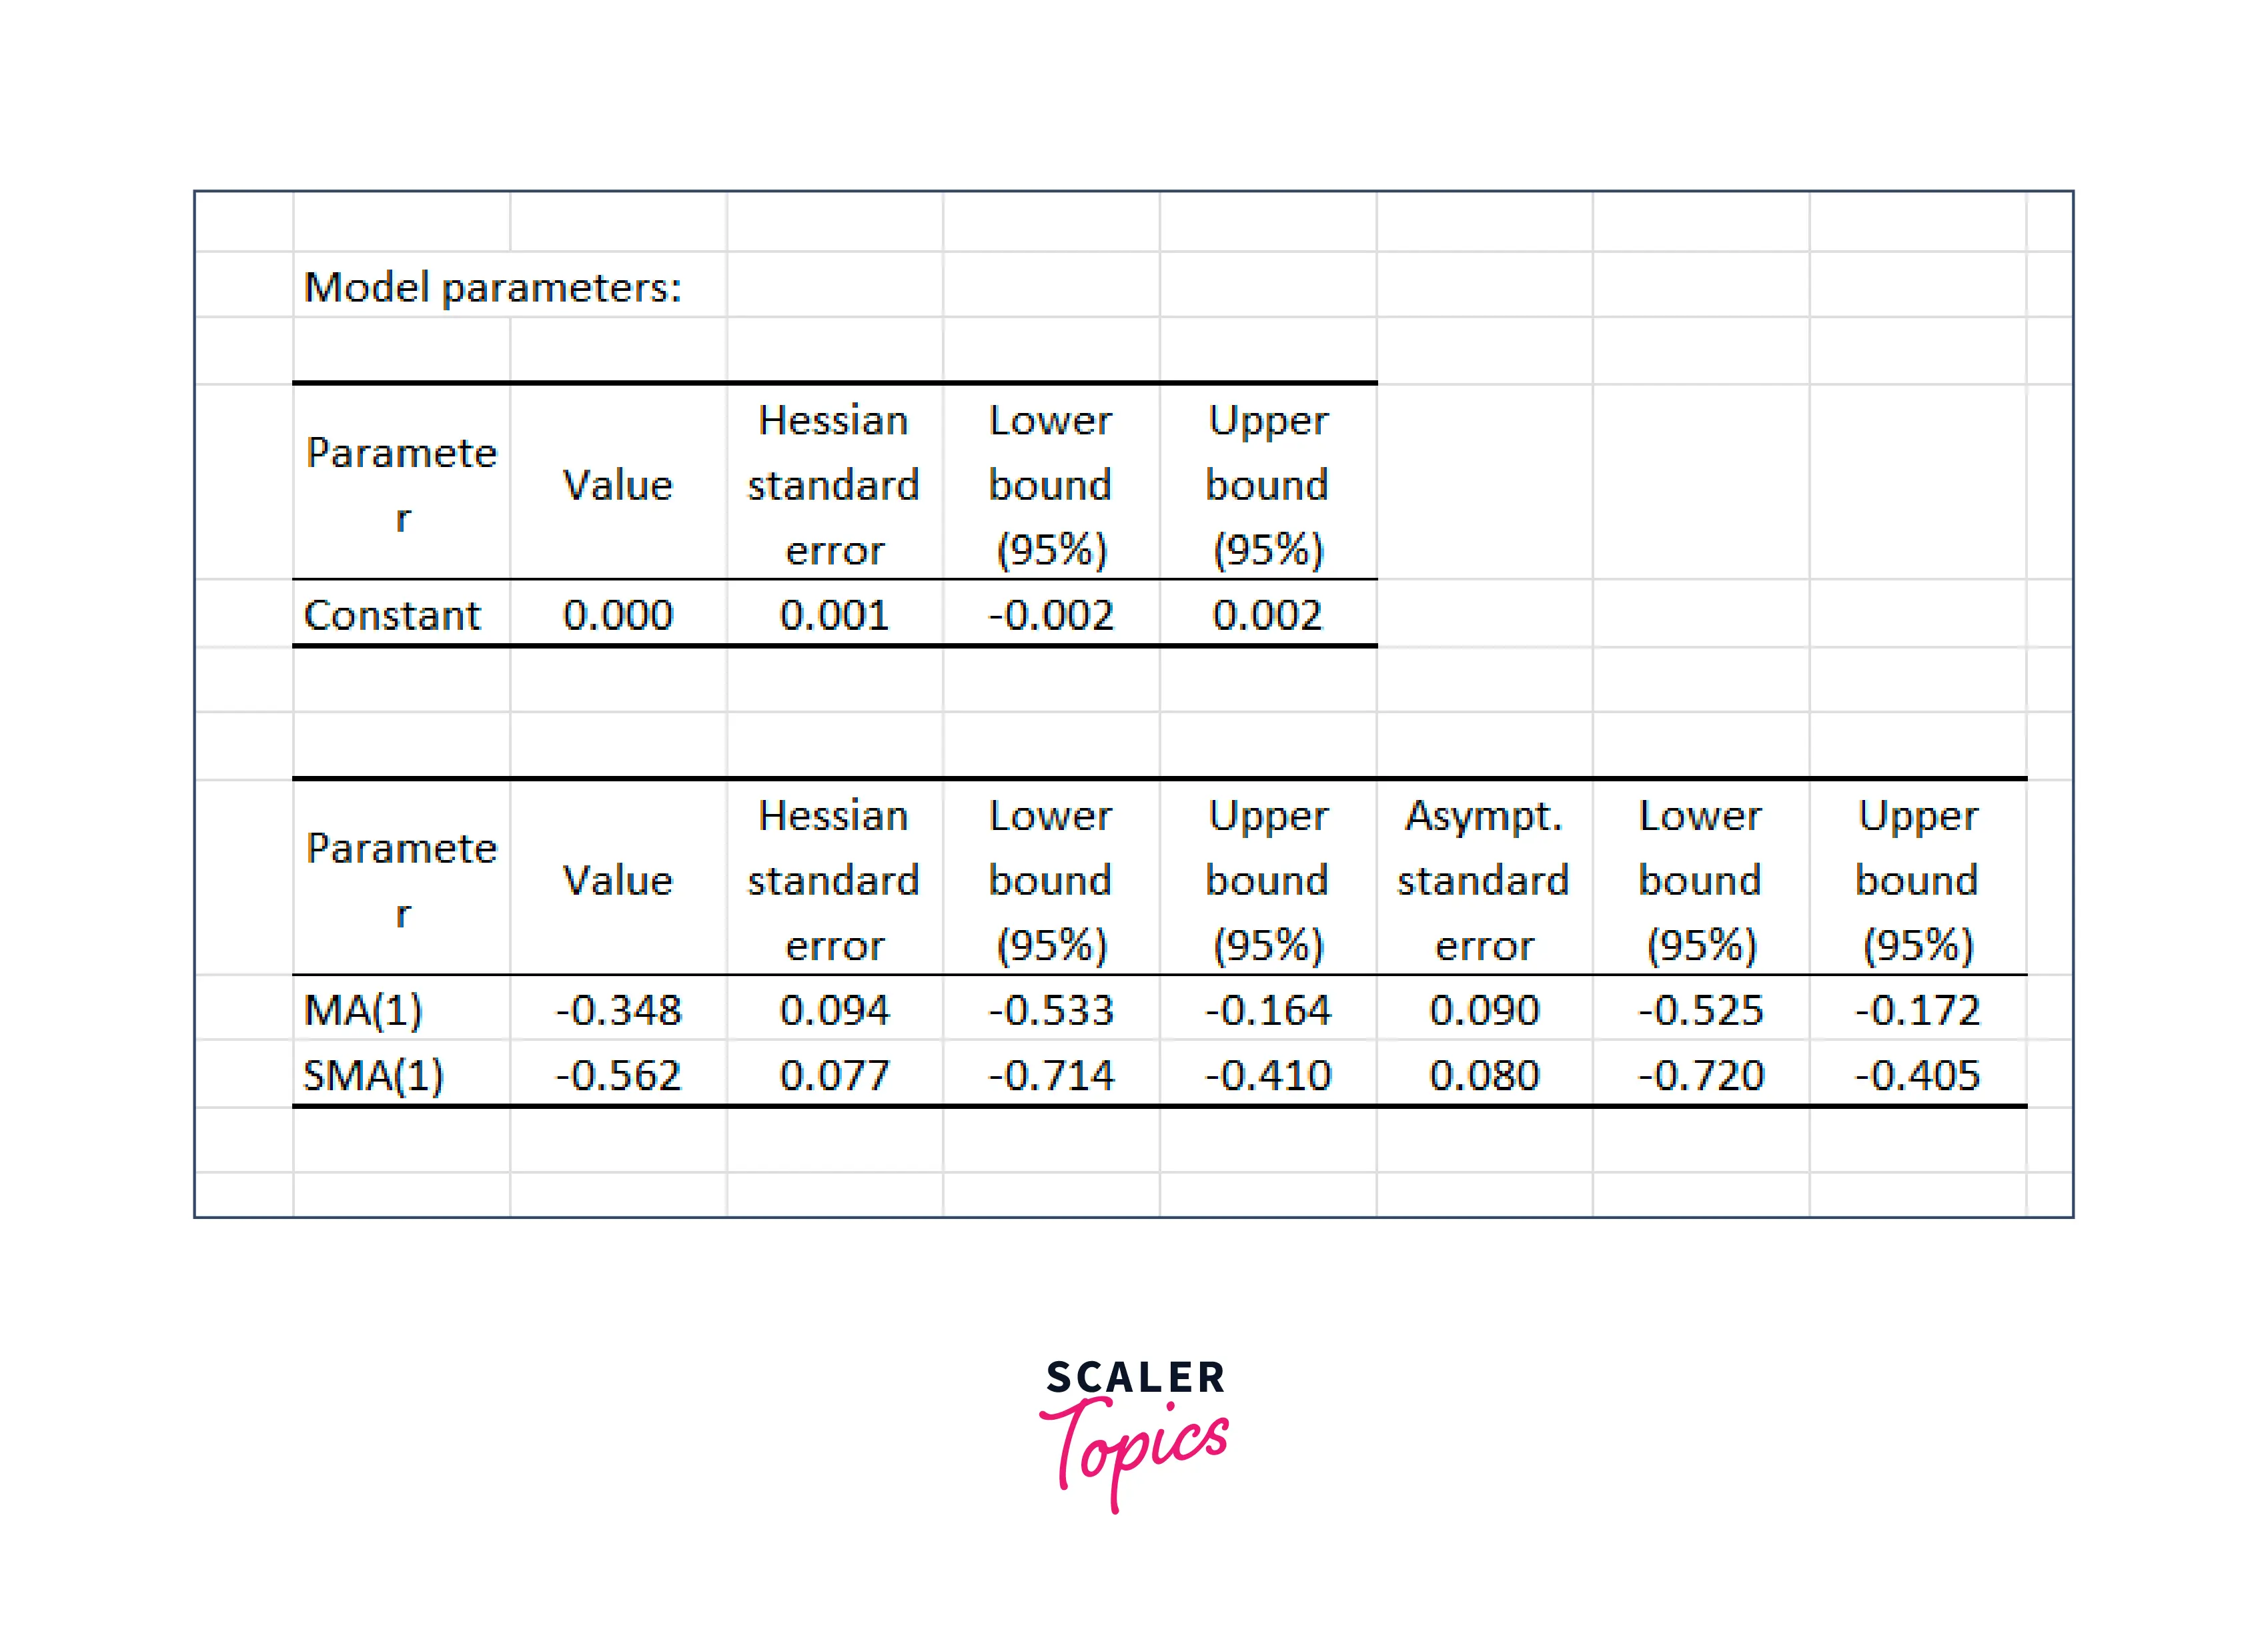
- These values help you understand how well the model can predict the behavior of the time series.
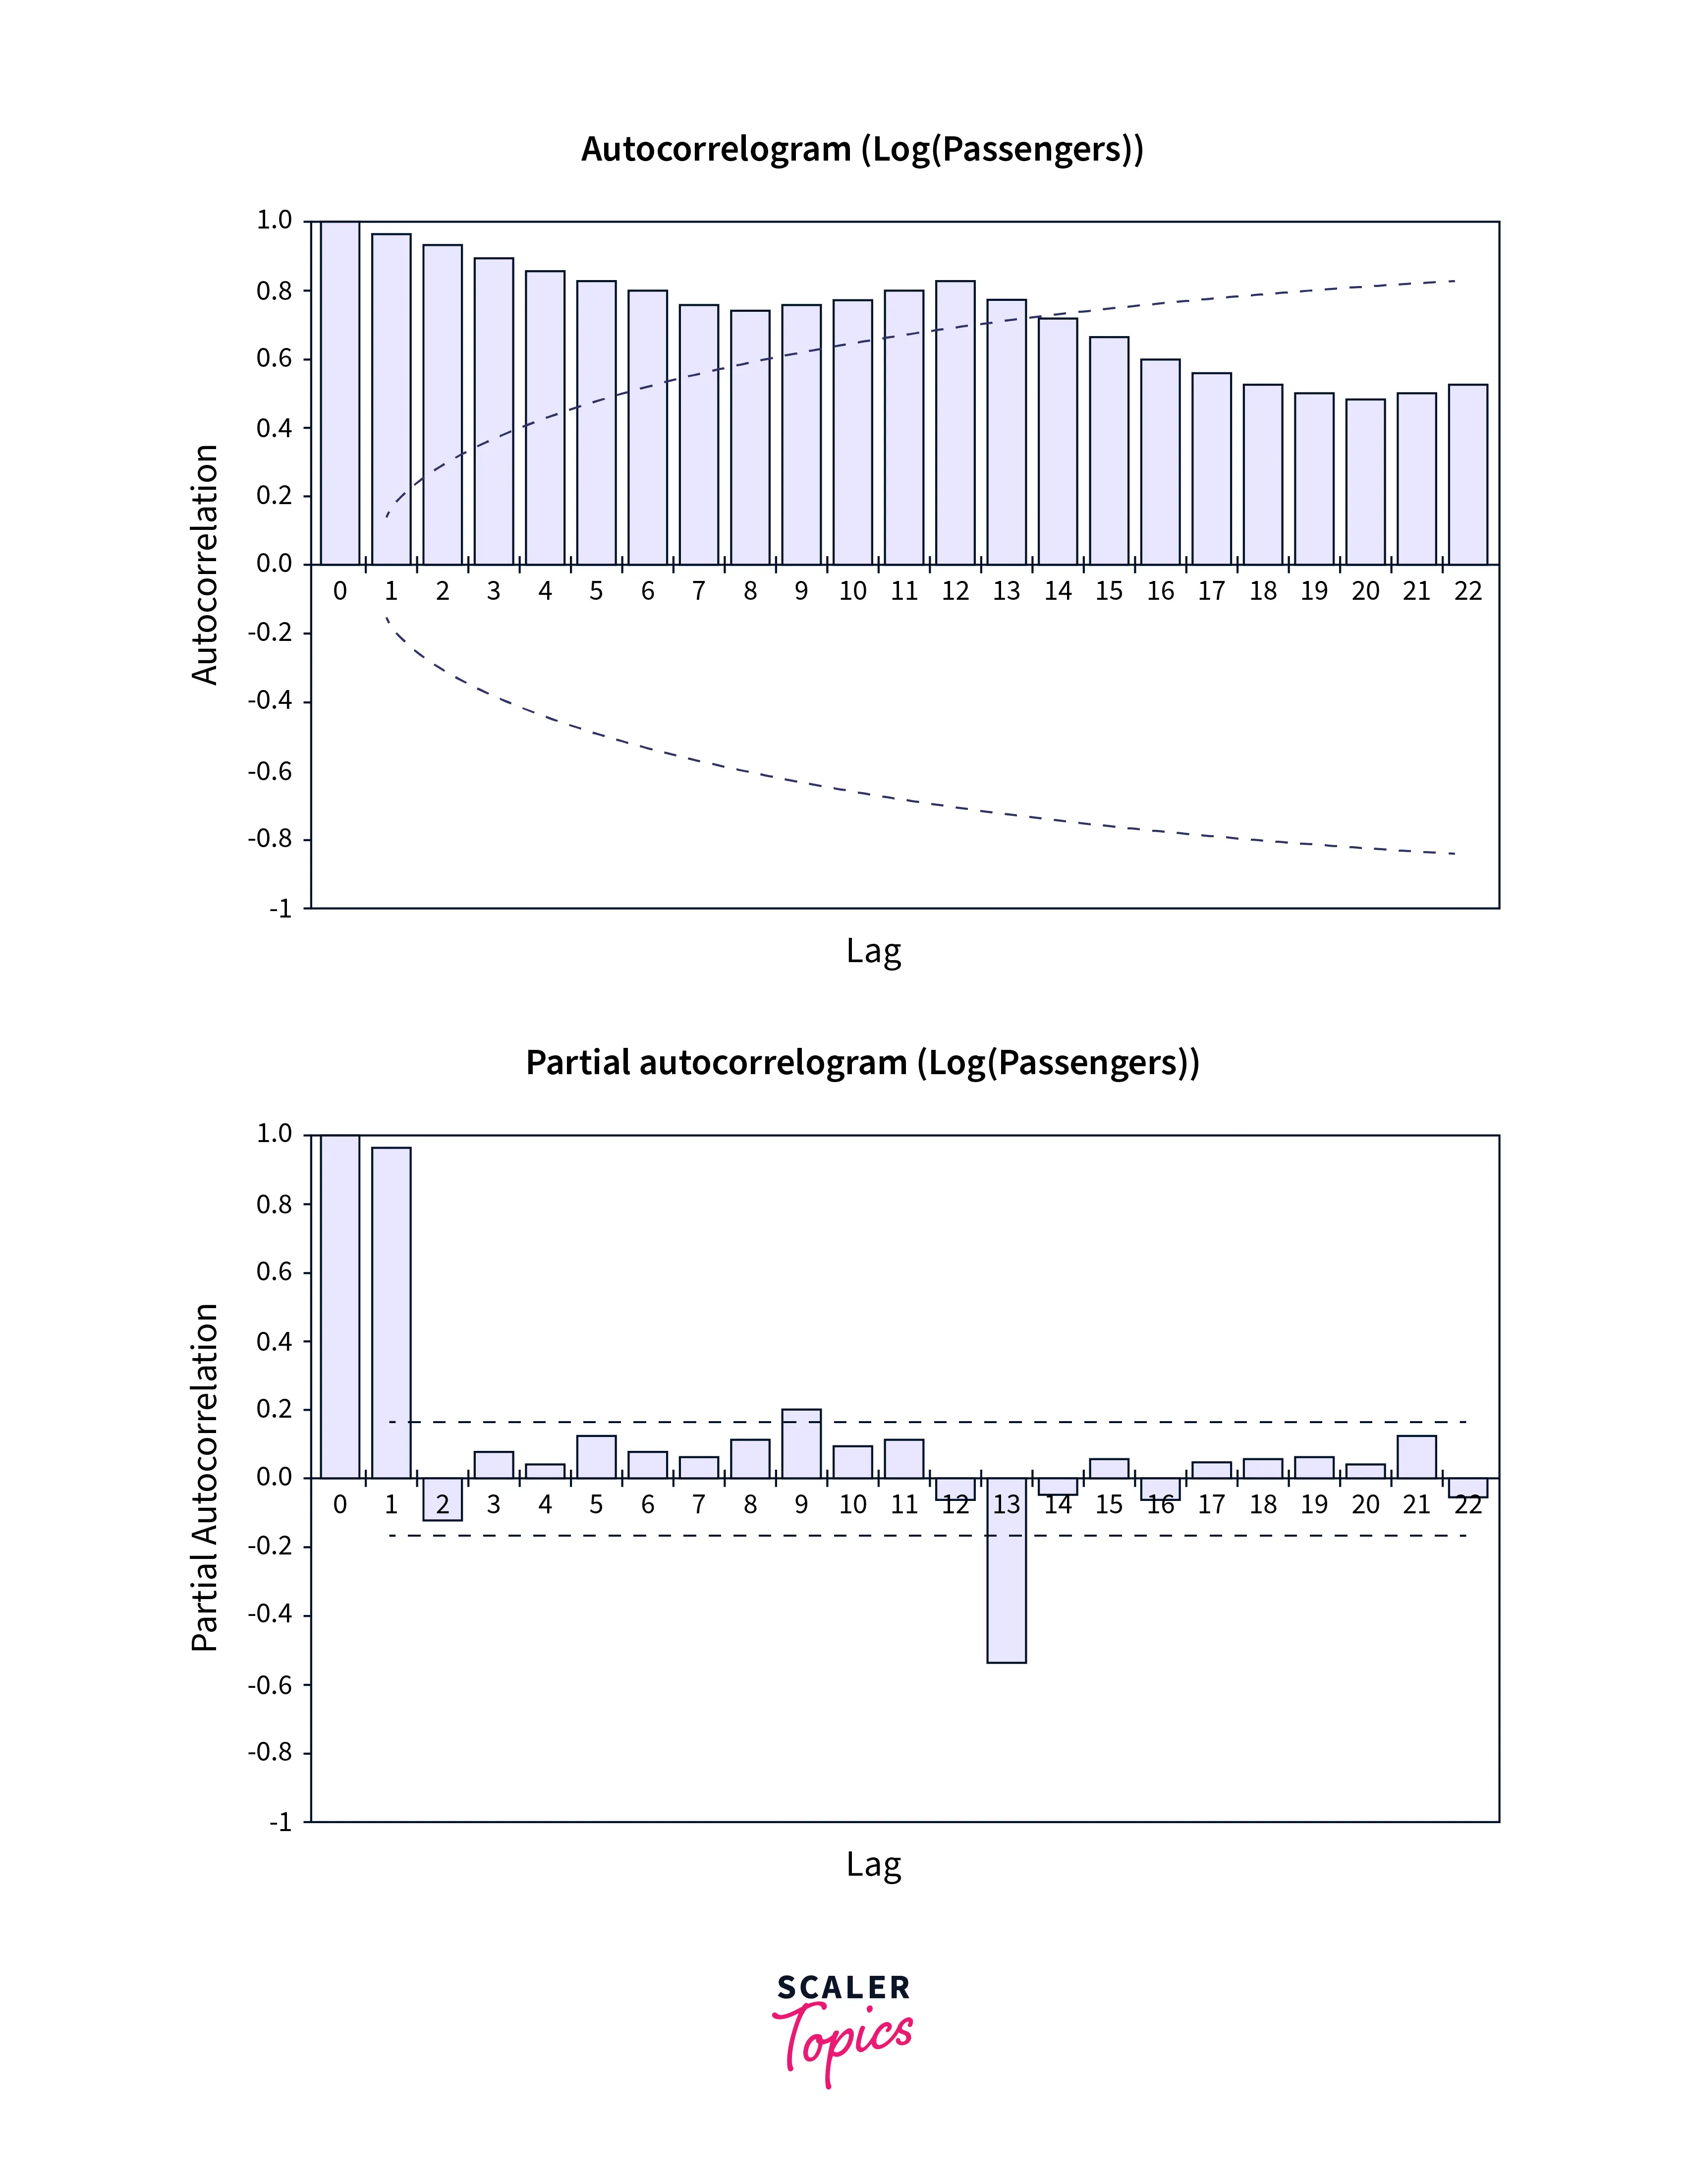
- A strong correlation between the time series and its lagged values indicates that the time series is predictable and that the ARIMA model is a good fit for the data.
Forecasting Using an ARMA Model
- An Auto Regressive Moving Average (ARMA) model is a time series model that combines the Autoregressive (AR) and Moving Average (MA) models. It is similar to the ARIMA model, but it does not handle data with trends and seasonality.
- The ARMA model is helpful when the time series data has various patterns that the model can identify but does not show any trend or seasonality. For instance, an ARMA model may be preferable to an ARIMA model if a time series exhibits patterns like cycles or erratic variations.
- Just like with an ARIMA model, you must first fit the ARMA model to the time series data to predict future values. The ARMA model's coefficients can then be used to forecast future values after the model has been fitted.
Autoregressive Model vs Moving Average
- The Autoregressive (AR) and Moving Average (MA) models are used to predict future values of a time series, but their methods for doing so are different.
- The MA model has based on the premise that the present value of the time series is a function of historical forecast mistakes, whereas the AR model is based on the assumption that the time series' current value is a function of its past values. This is a significant distinction between the two models.
Conclusion
- This article provides an overview of Autoregressive (AR) models and their applications in time series forecasting.
- It covers topics such as the formula for an AR model, how to fit an ARIMA model in Excel, forecasting using an ARMA model, and the difference between an autoregressive model and a moving average model.
- Additionally, it provides a guide to implementing ARIMA in Excel.
