Amazon CloudWatch Logs
Overview
Logs are an essential component in the lifecycle of software development and testing. In AWS, customers can use multiple AWS resources to develop, build, and deploy an application across servers. Developers will use the logs to gather details. Those details will be used for further code improvement, troubleshooting bugs, feature updates, feature rollbacks, etc. Amazon CloudWatch log service is used to collect, store, and analyze the logs generated by the application and AWS services.
What is Amazon CloudWatch Log?
Amazon CloudWatch log is the feature associated with the Amazon Cloudwatch services which are used for monitoring and the metrics repository. Using CloudWatch logs, customers can ingest their application logs, AWS service logs, and system logs into CloudWatch. Those logs are stored in a single place where customers can search, visualize, and analyze the error logs or any random pattern. Customers can also use filters to list specific data and archive the logs for future analysis.
Features of CloudWatch Logs
Query the Log Data
- The Amazon CloudWatch console includes a feature called CloudWatch logs insights.
- It helps customers search interactively and analyze their log data stored in Amazon CloudWatch logs.
- CloudWatch log insights are the purpose-built query language, which means it is designed to perform certain tasks efficiently. In our case, it is used to execute simple queries and powerful commands.
Log Route53 DNS Queries
- Route 53 is the AWS-managed DNS service. So by default, it is highly available and scalable.
- We can store the traffic received from the Route53 Domain in the AWS CloudWatch logs.
- Here, cloudWatch logs store the below-mentioned public DNS details, which will be later used for analyzing purposes.
- Domain or subdomain that was requested
- Date and time of the request
- DNS record type (such as A or AAAA)
- Route 53 edge location that responded to the DNS query
- DNS response code, such as NoError or ServFail
Archive Log Data
- CloudWatch logs storage is highly durable. So customers can also use CloudWatch logs to archive their old logs. Whenever the logs are needed, they can be retrieved easily from the Amazon CloudWatch console.
- Additionally, Amazon CloudWatch logs can also be exported to the Amazon S3 service, which is highly available, reliable, and scalable.
Log Retention
- Amazon CloudWatch provides flexibility in choosing the retention of the logs stored in the Amazon CloudWatch Log Group.
- By default, all the logs stored or ingested will have the retention type " Never Expire".
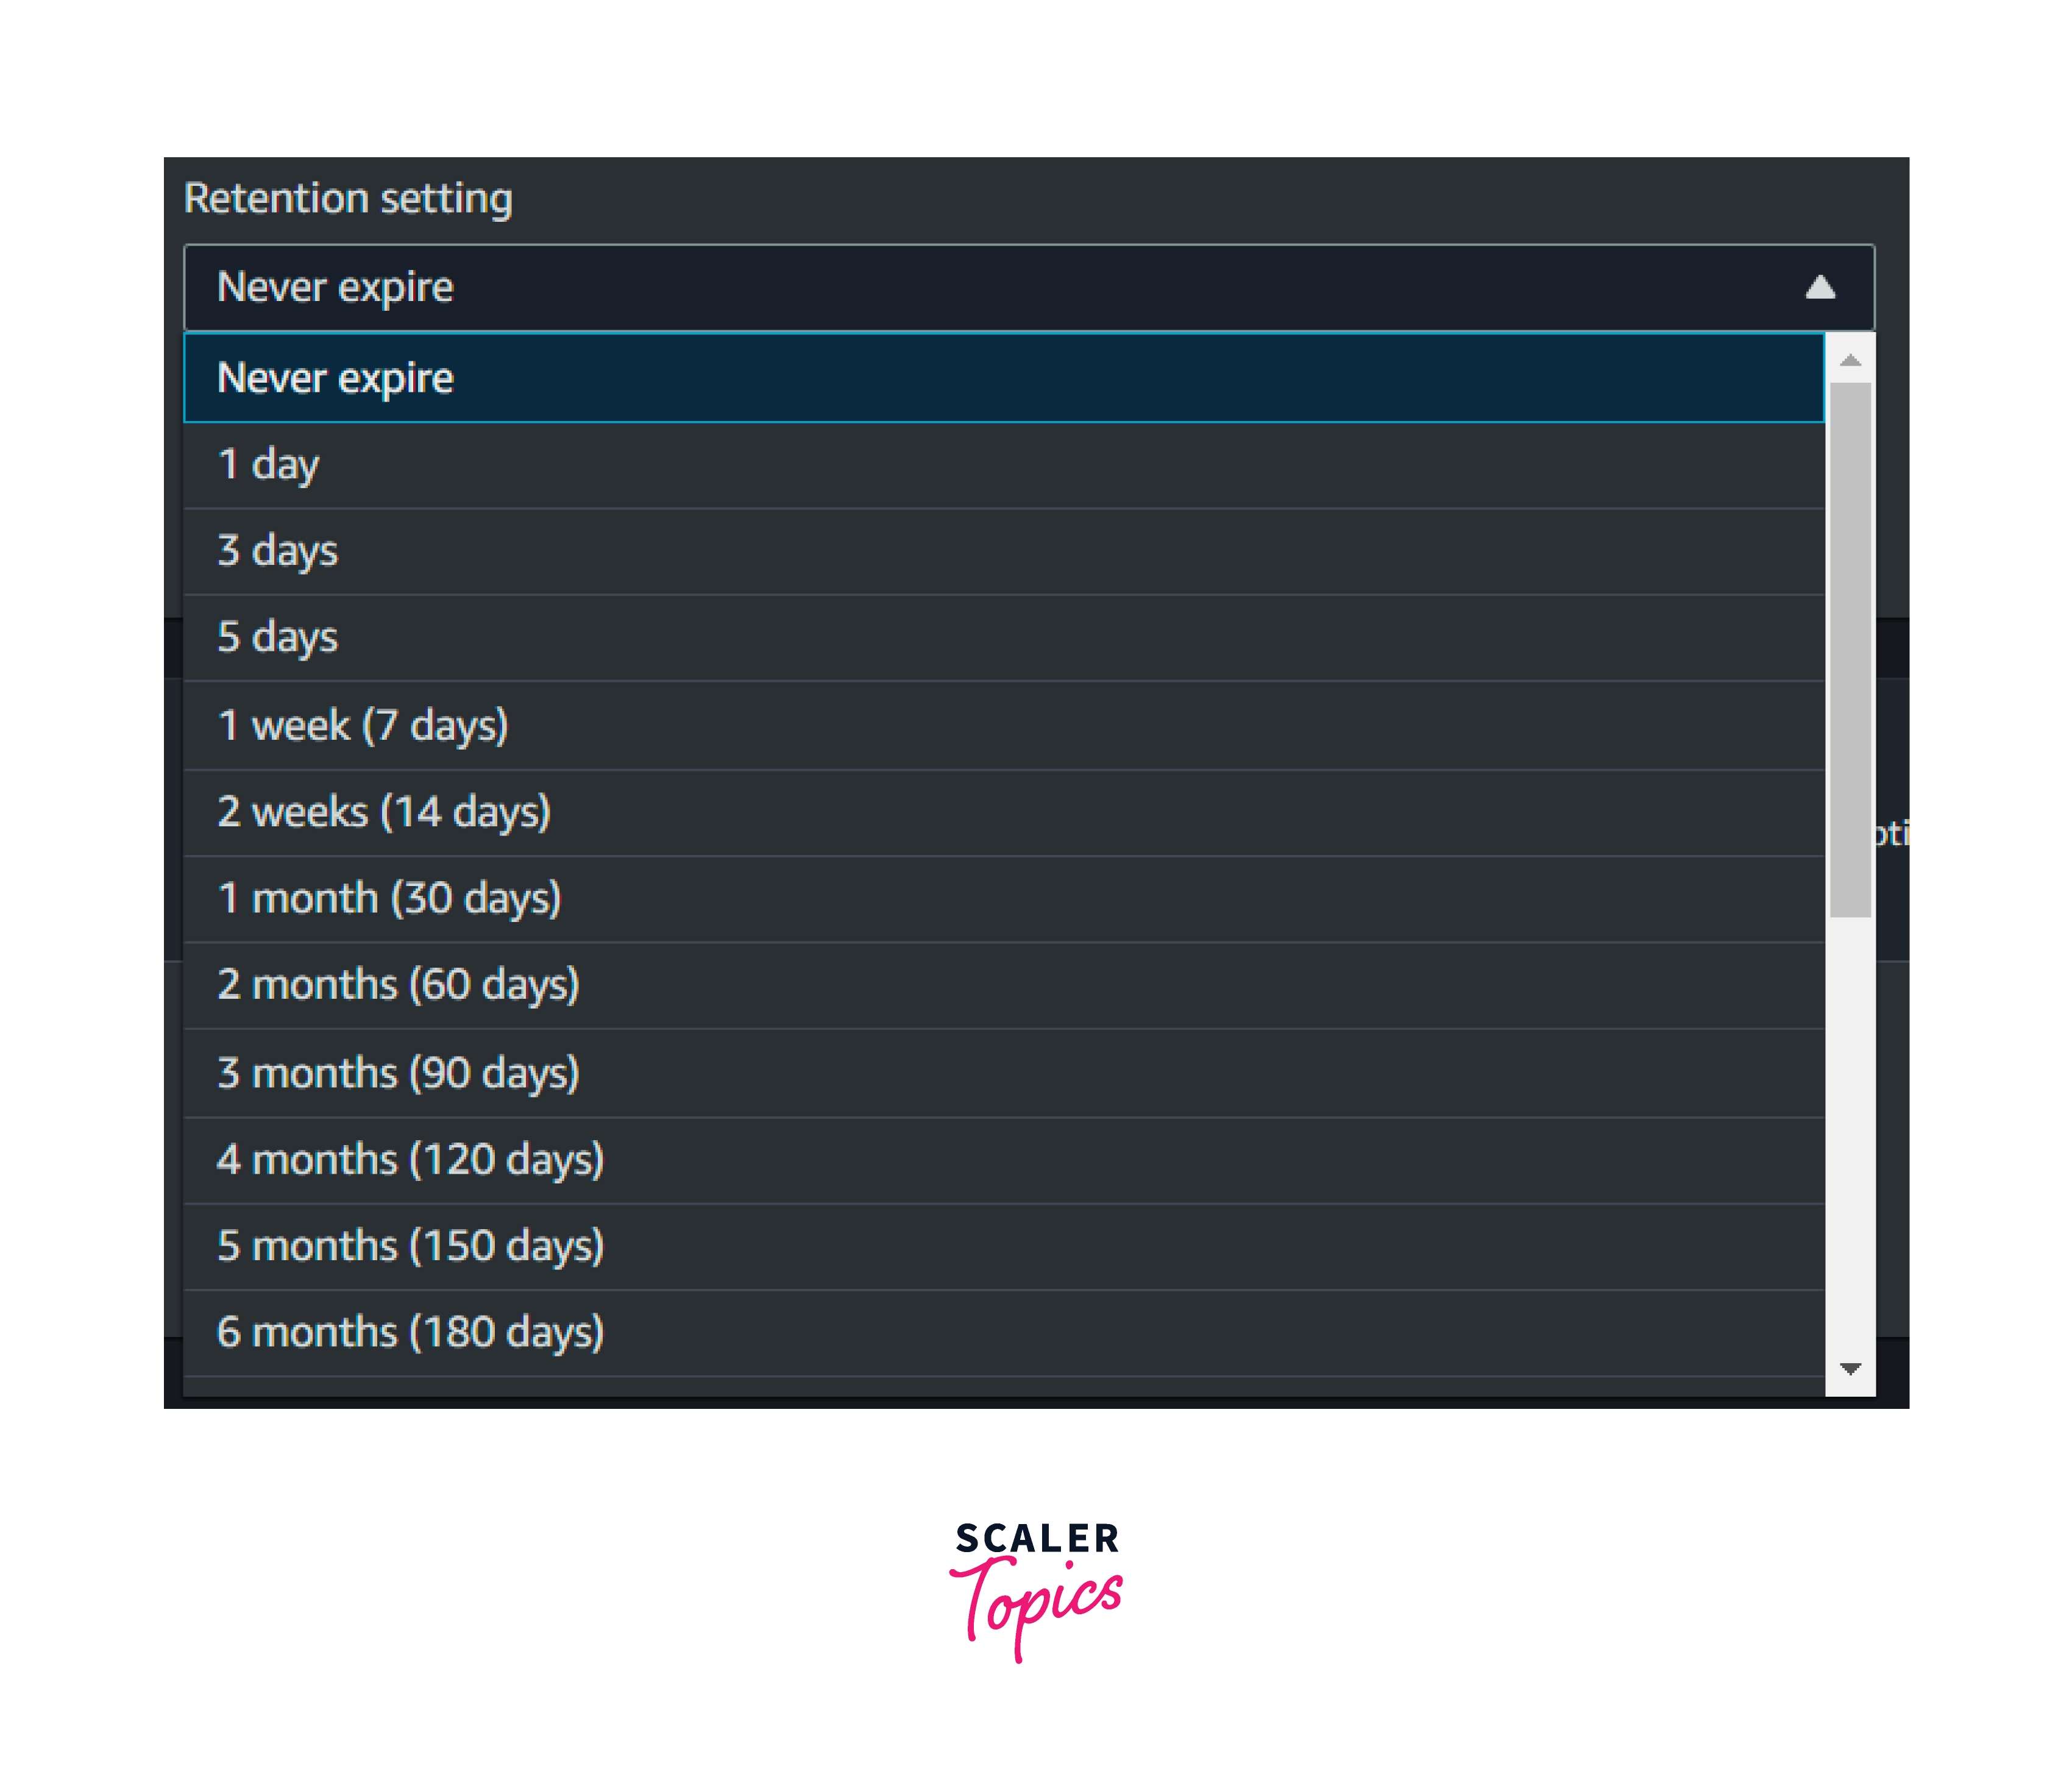
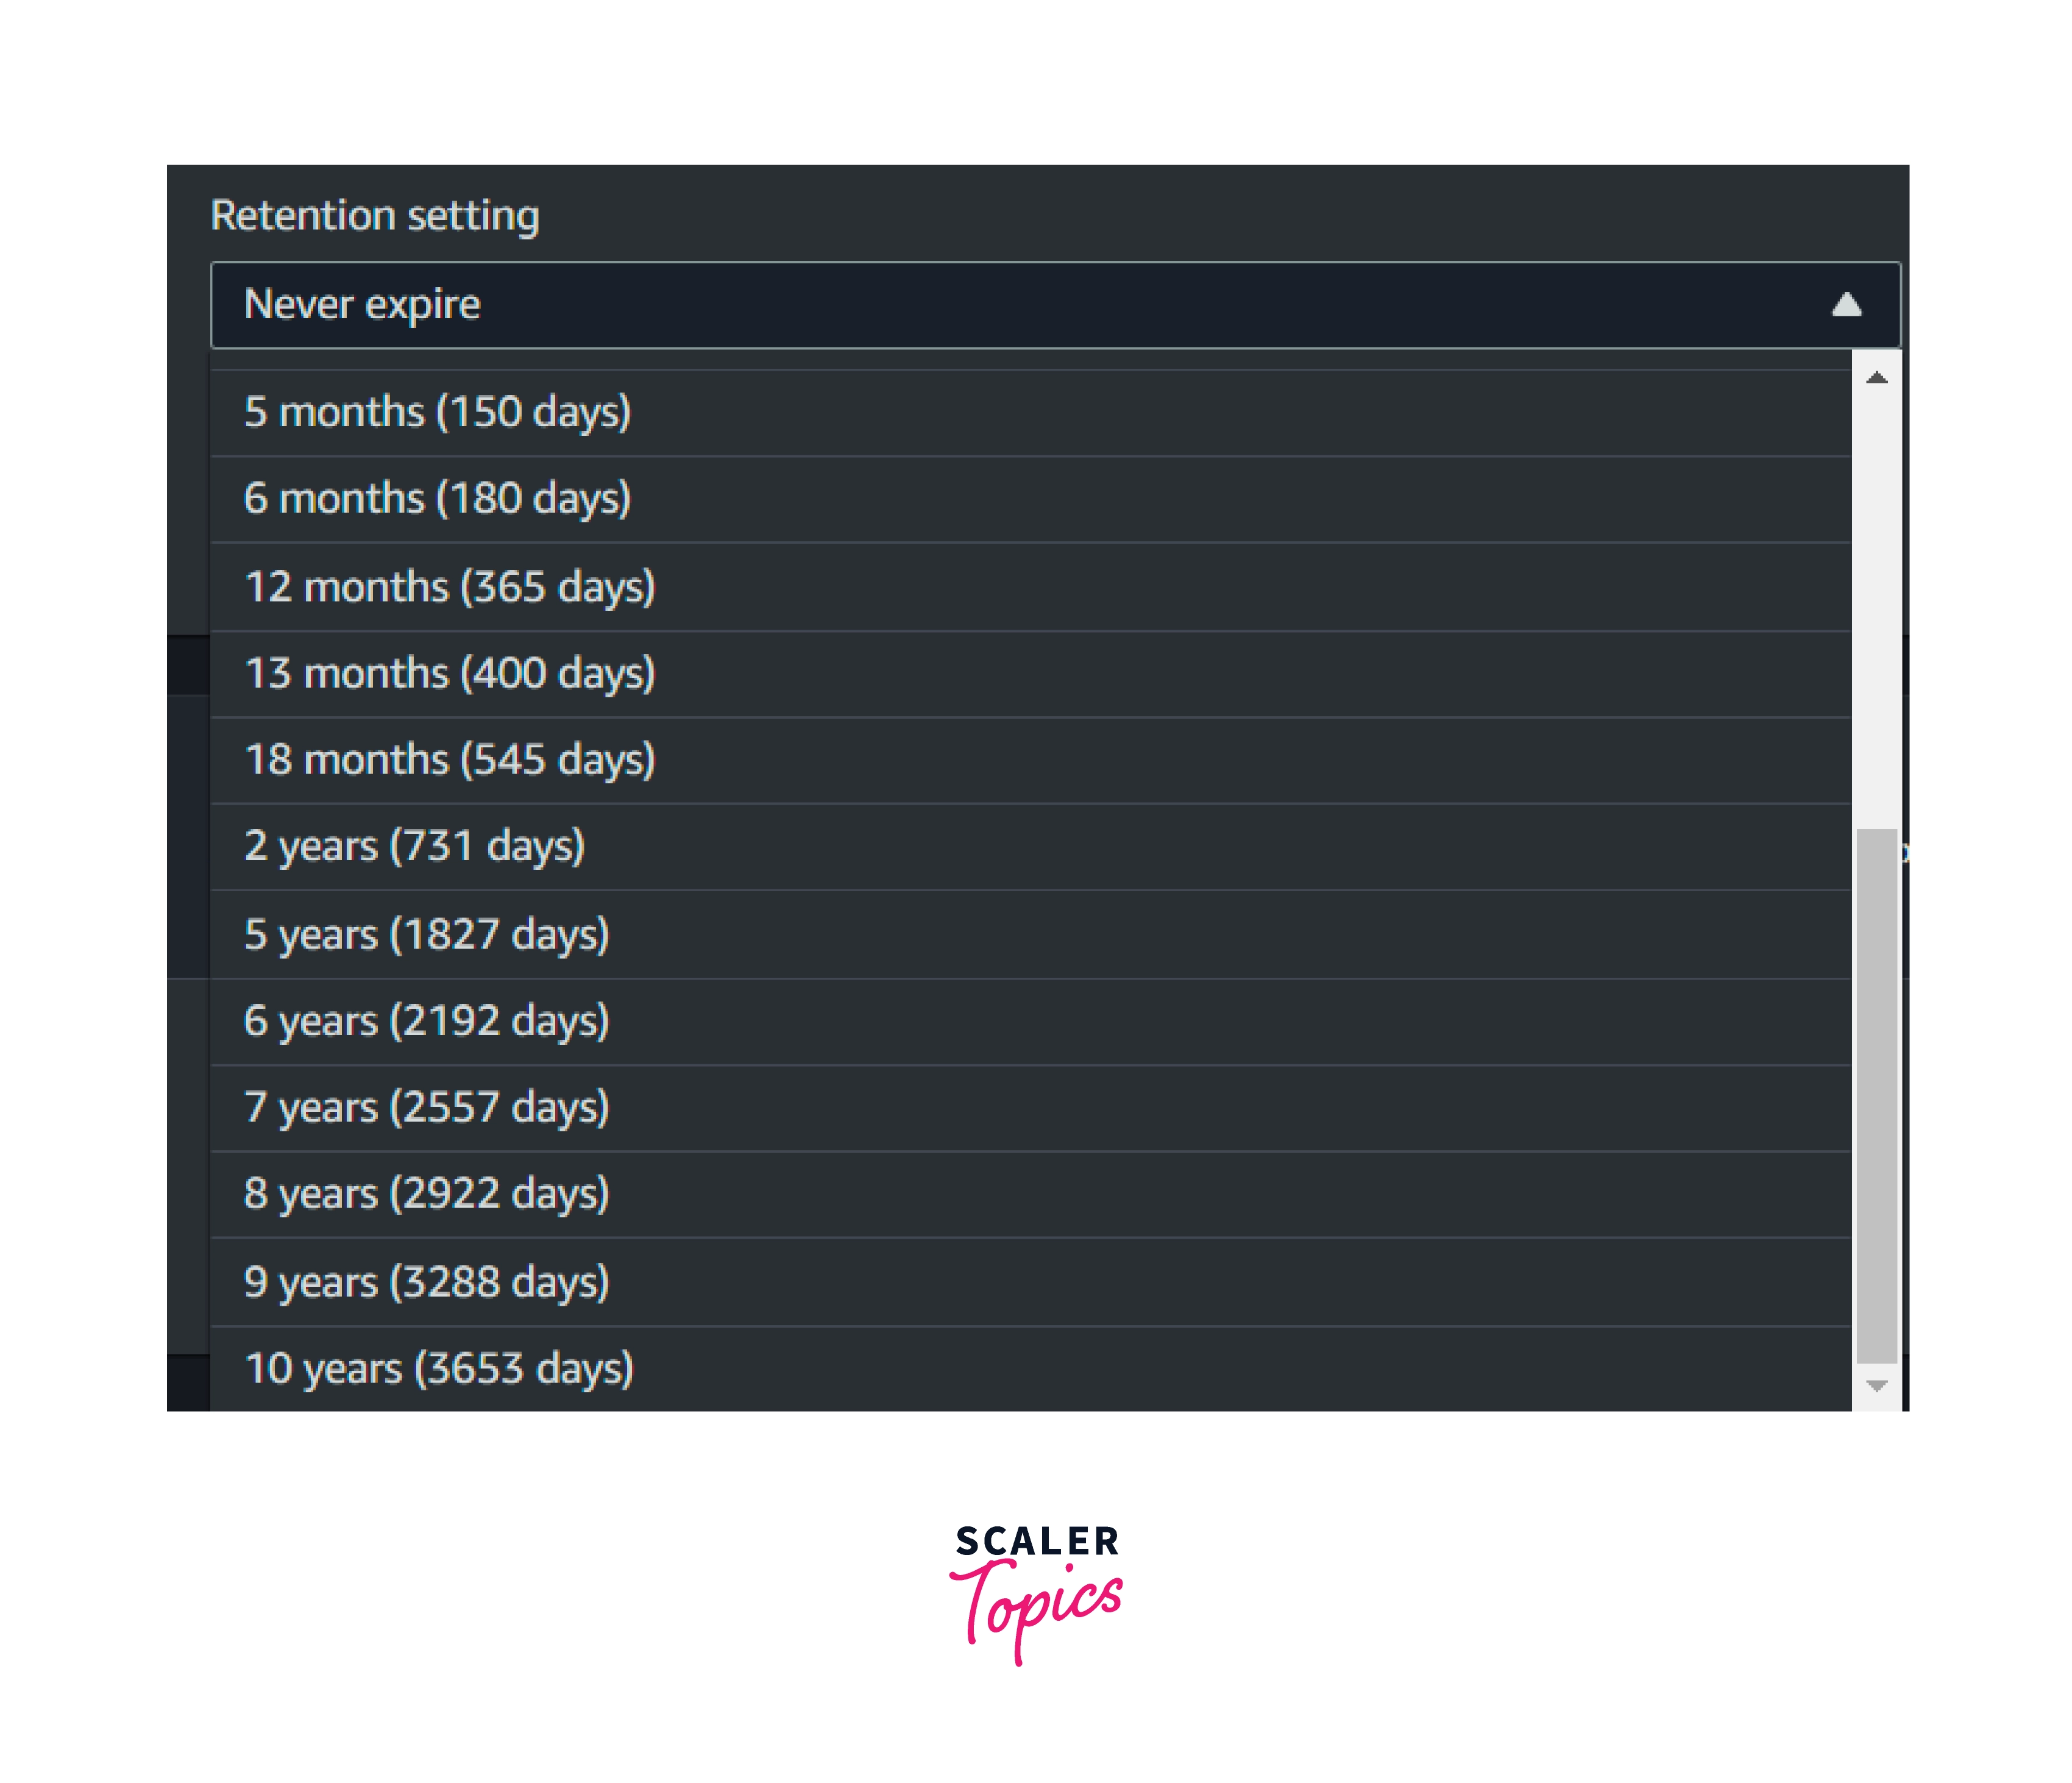
- Customers can change the retention period from 1 day to 10 years as per their requirements.
- Below mentioned retention is provided by Amazon CloudWatch logs
Monitor AWS CloudTrail Logged Events
- CloudWatch logs for CloudTrail trails can be enabled by customers.
- Once it is enabled, they can use the event filter to trigger an alarm whenever a certain event happens or an API call is invoked in their AWS account.
- Examples of events include security group rule creation, security group deletion, detaching the security group from the EC2 instances, etc.
CloudWatch Logs Concepts
The below-mentioned terminologies are essential to understanding the concepts of CloudWatch logs.
Log Events
- Log events are records of activity performed by AWS resources such as AWS Lambda, EC2 applications, ECS containers, and so on.
- For example, If an IAM user invokes an AWS Lambda function, the lambda event and output logs will be generated and stored in CloudWatch logs.
Log Streams
- If a sequential event from the same sources is recorded, then it is considered a log stream.
- For example, the customer installed the CloudWatch agent in their EC2 instances and configured the log groups, such as Apache access logs, of a specific EC2 instance.
- All the events registering in the Apache access logs will be ingested into the Amazon CloudWatch log group over some time.
Log Groups
- The log group is the group of log streams that share the same resource or AWS service.
- Retention settings, monitoring settings, and export data settings are applicable only at the log group level.
Metric Filters
- Metric filters are used to filter the data from the ingested CloudWatch logs.
- Once they filter it, they can use the filtered event value and transform it into a data point in the CloudWatch metrics.
- Metric filters will be applied at the log group and log stream levels.
Retention Settings
- The retention setting determines how long the log events are available in the log group.
- Once the retention period is over, the log events from the log groups will be deleted.
- Customers can have a flexible choice in choosing the retention of AWS CloudWatch logs.
CloudWatch Logs Configuration Parameters
There are three parameters required to create a CloudWatch log group.
They are
Name: Name of the log group Retention Setting: A retention time should be selected. KMS ARN: This is optional. The customer can use the KMS key to encrypt the logs.
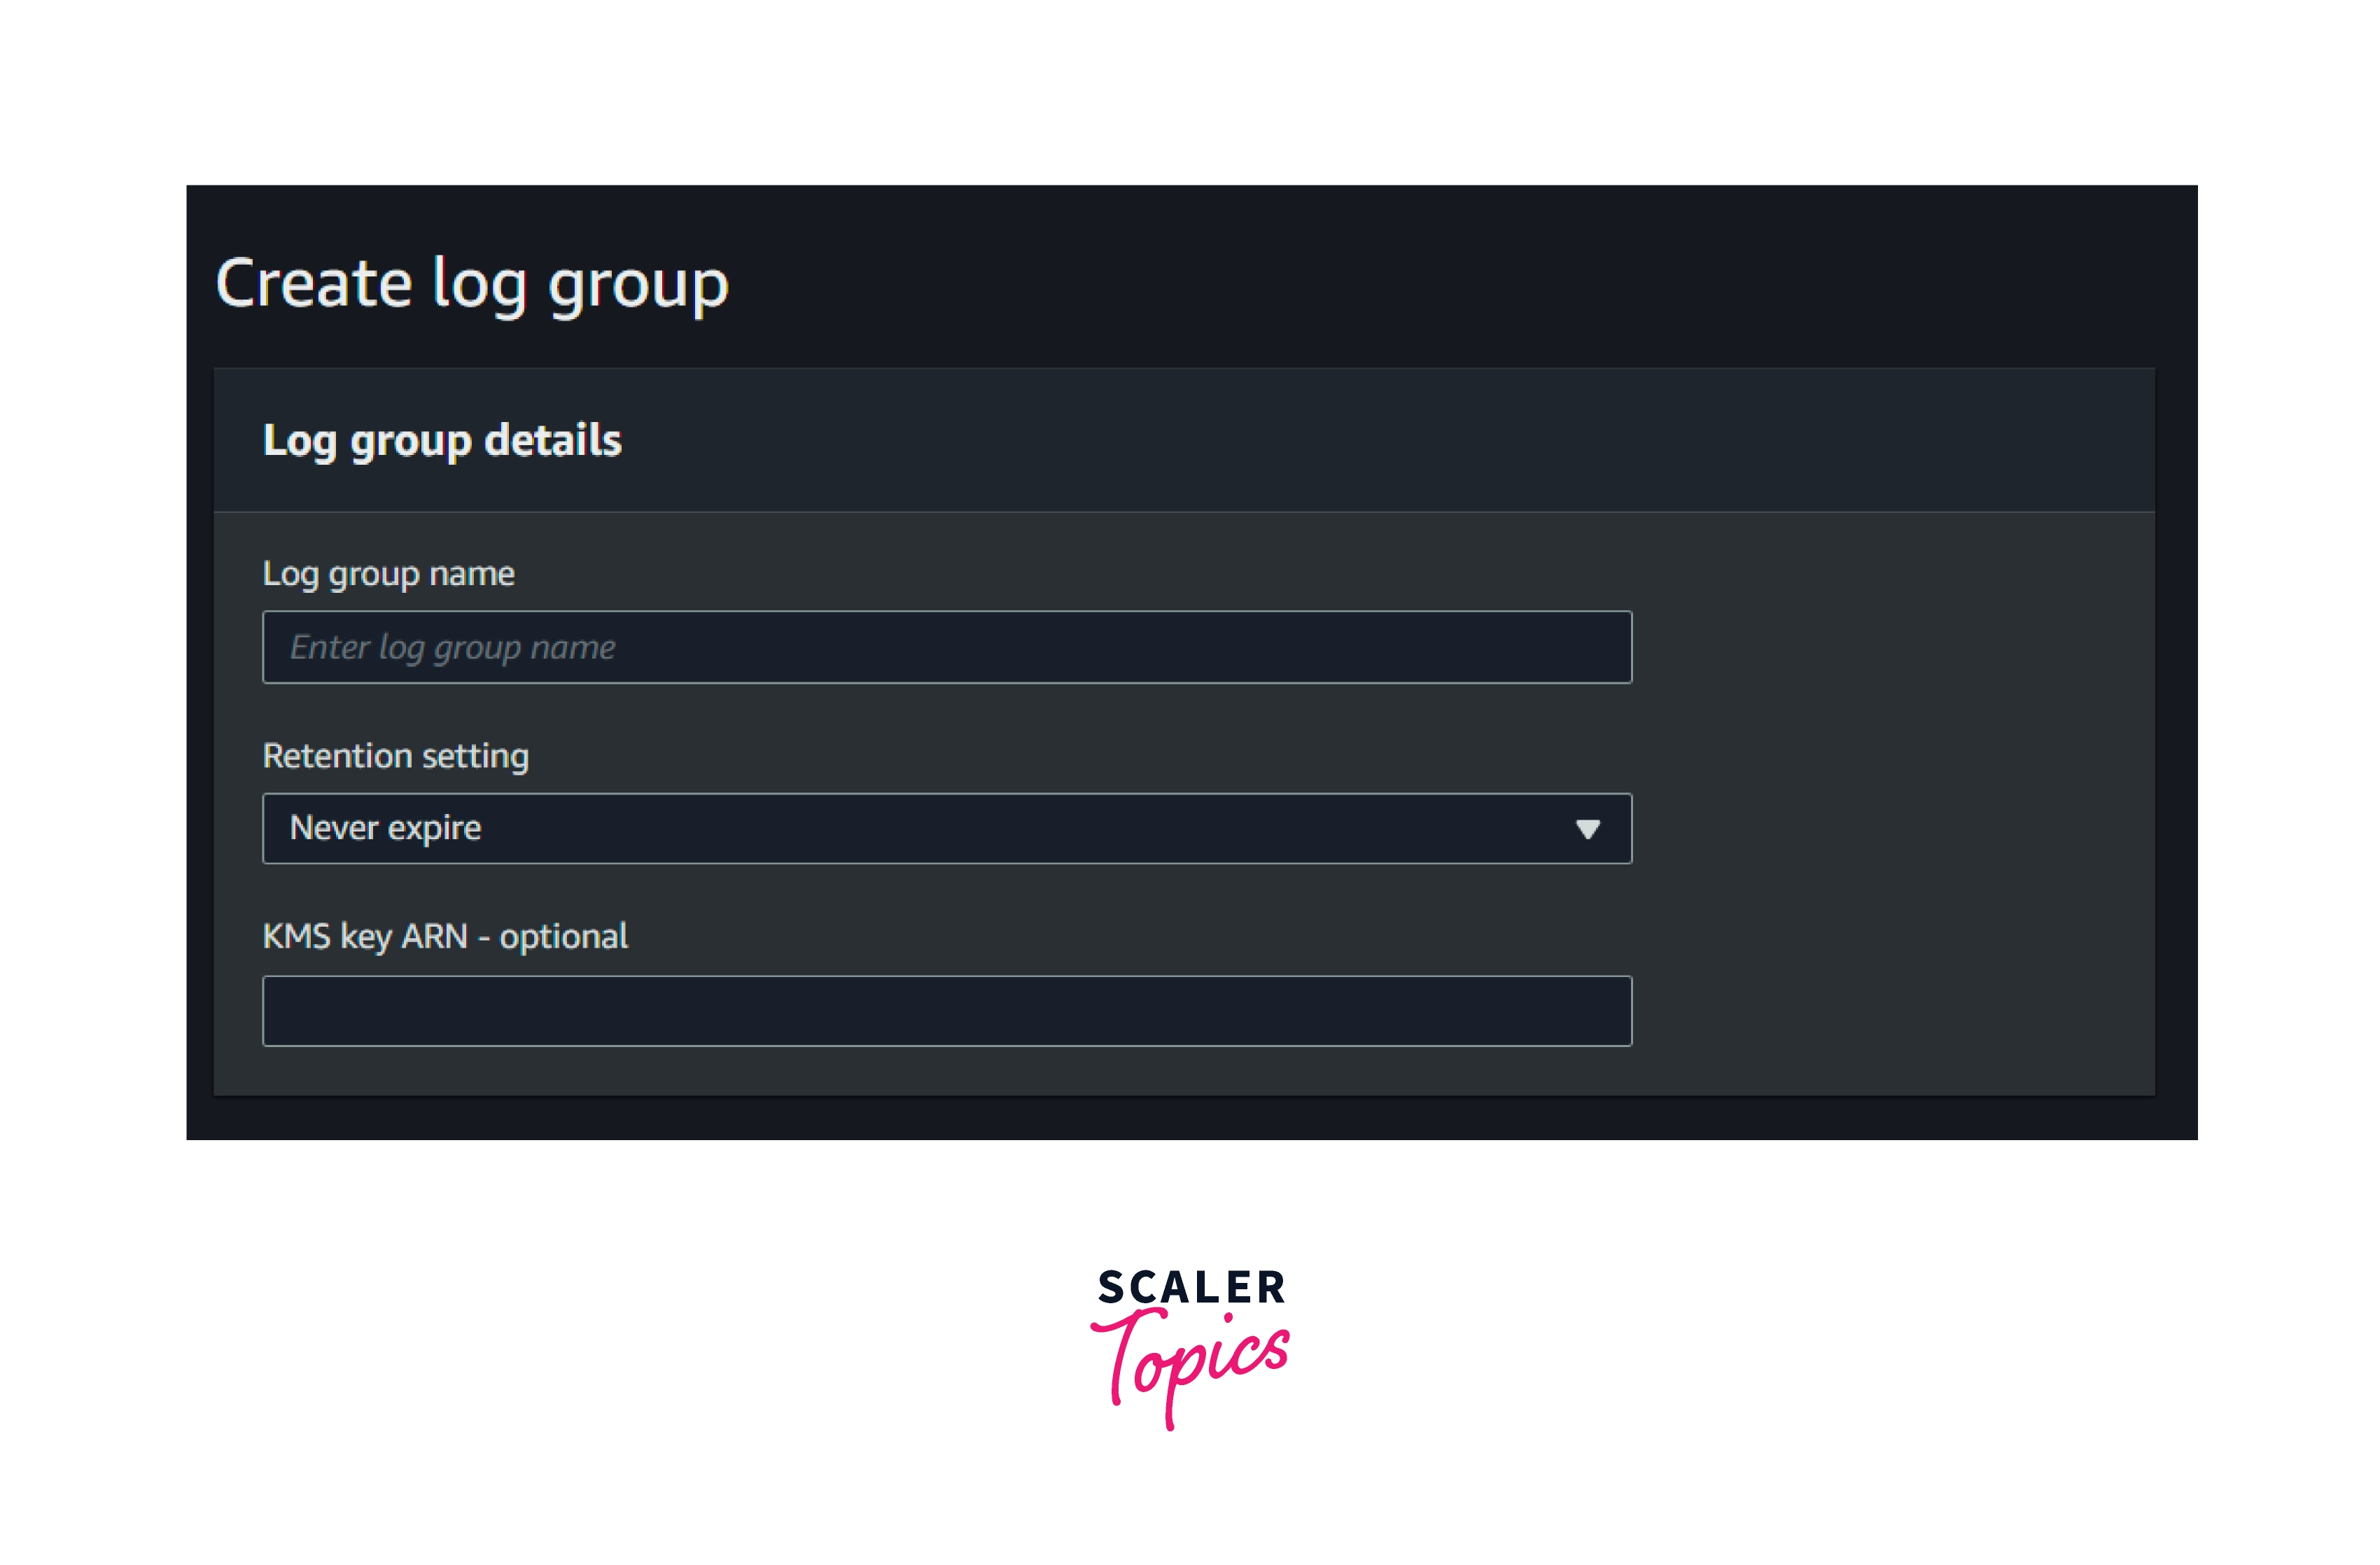
Note: The log group name and KMS ARN cannot be changed or modified once they are created.
CloudWatch Logs Use Cases
Real-Time Processing of Log Data with Subscriptions
- Customers can use the log group configuration to stream the data to the AWS OpenSearch service in near real-time.
- Data ingestion in the log group will be managed by AWS. The data will be ingested regardless of large compute resources once we properly configure the Amazon CloudWatch agent.
Searching and Filtering
- Metric filters are used to filter the log data based on the metrics. The customer can use the default metrics or they can create their custom metrics and filter the data from the logs.
- These metrics filters can be used to create CloudWatch alarms as well.
- Searching the log with a specific keyword or phrase of value is possible through the Amazon CloudWatch log group console.
When and How to Search with AWS CloudWatch Logs?
Step 1: Go to the Amazon CloudWatch log groups and select any one of the log groups.
Step 2: Select the log streams.

Step 3: In the search bar, enter any value for the search. If the log streams contain those values, it will filter them and show them to us.
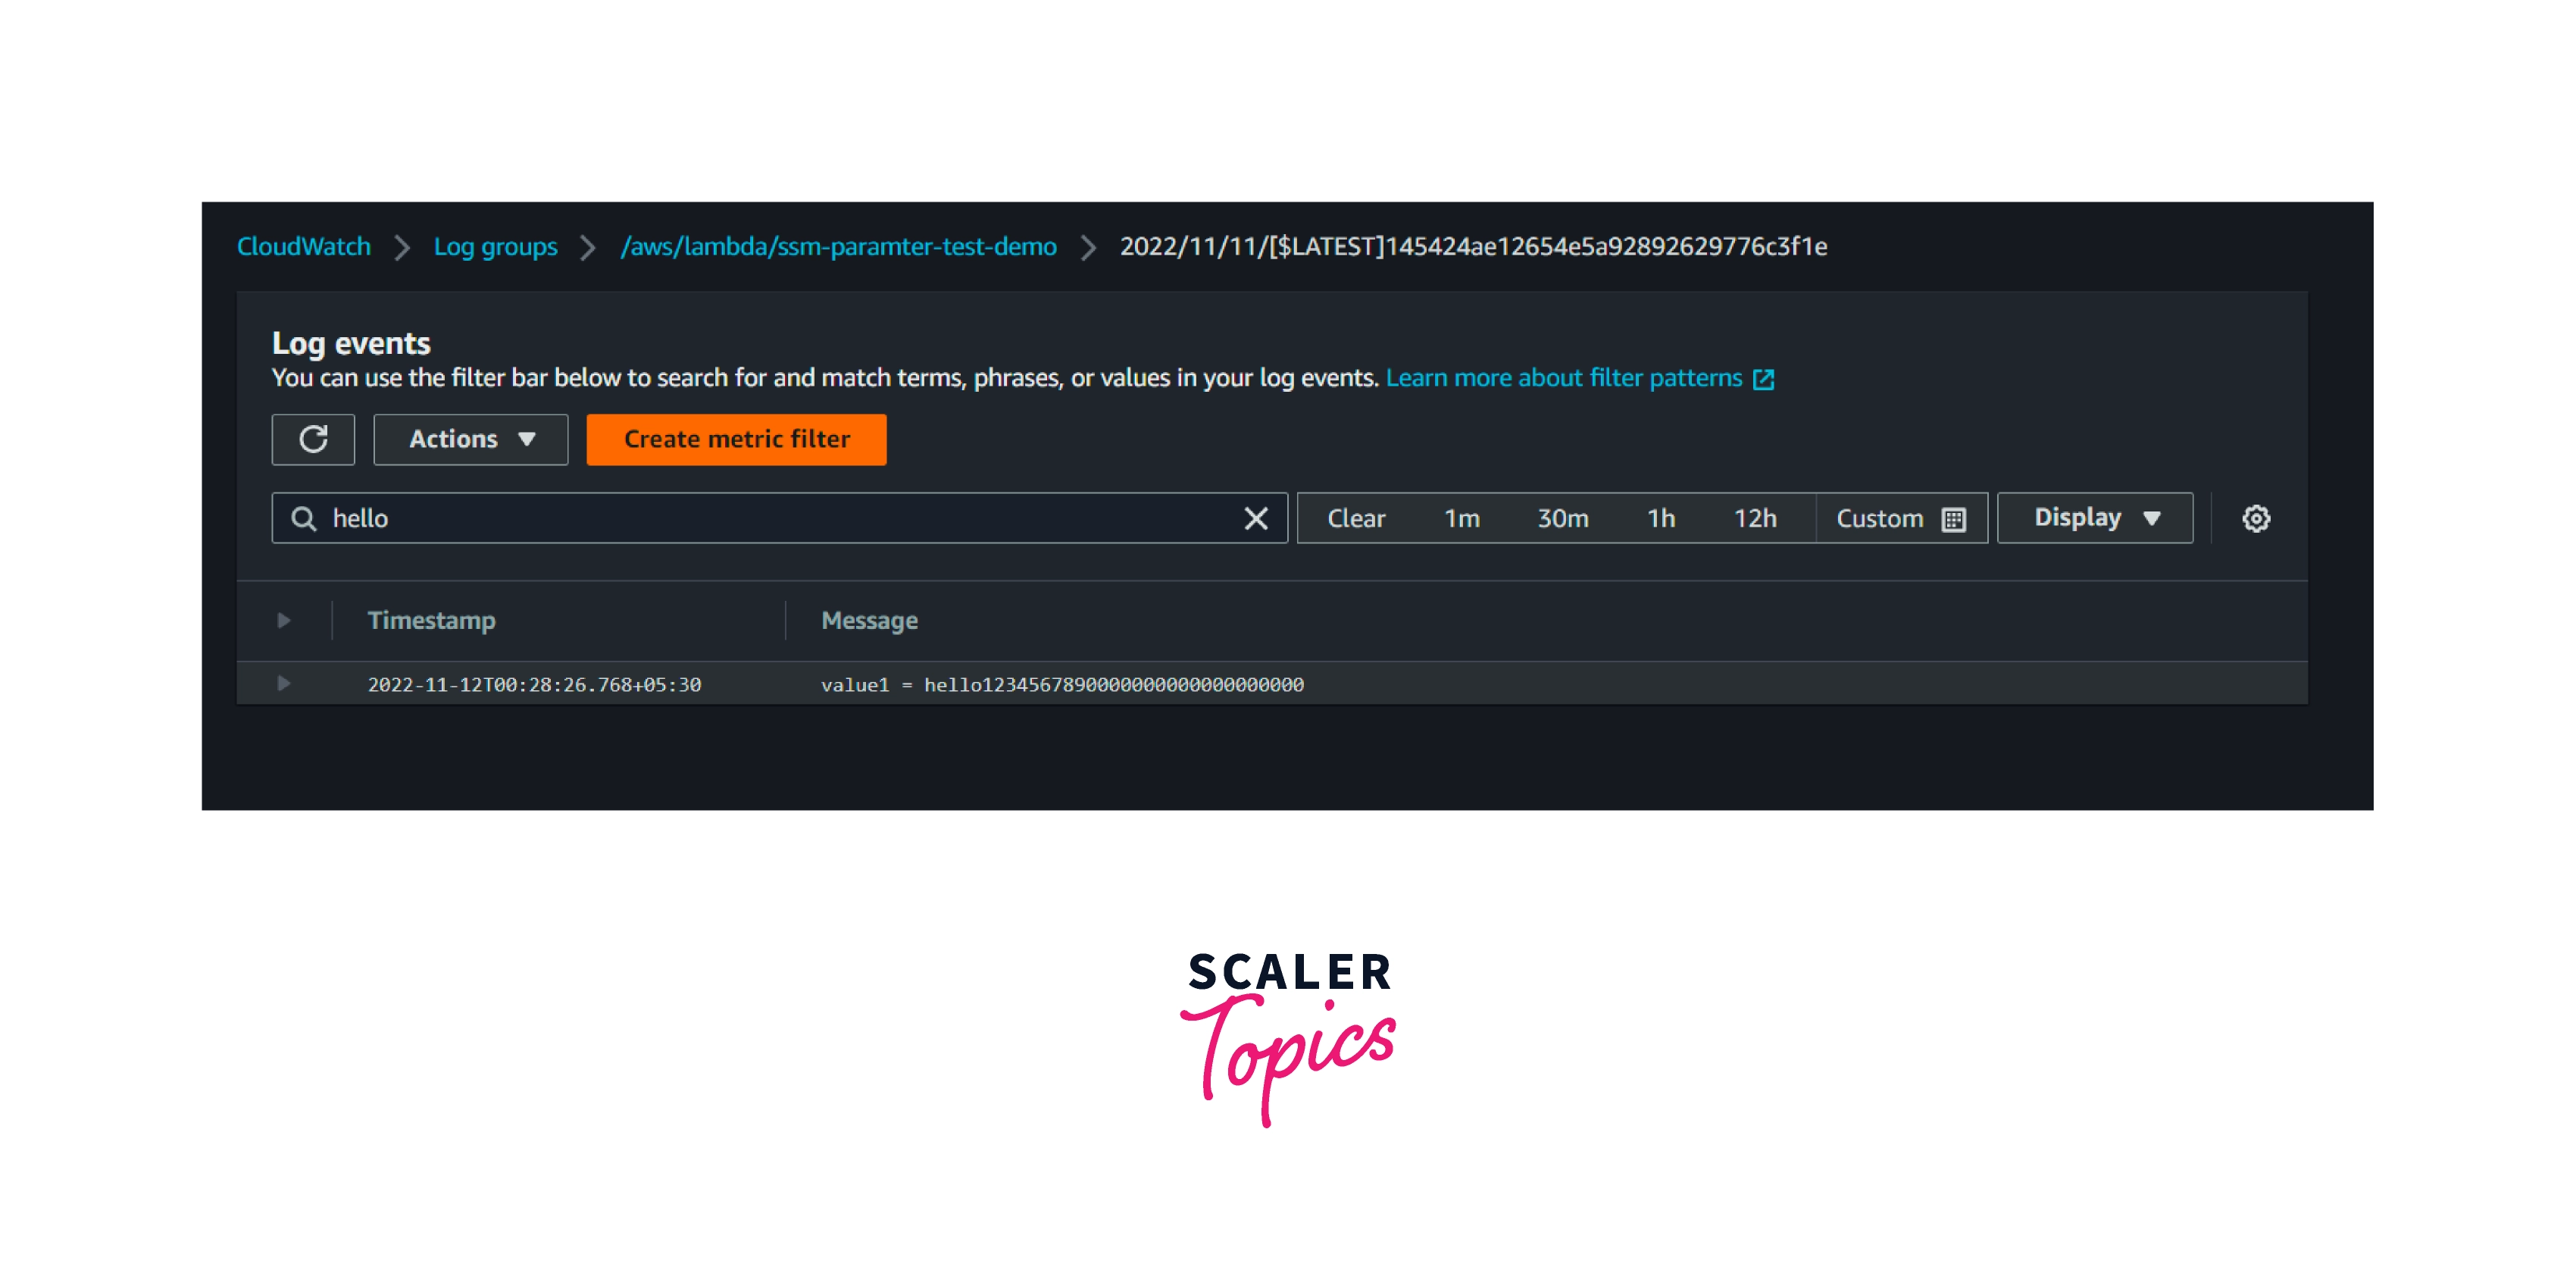
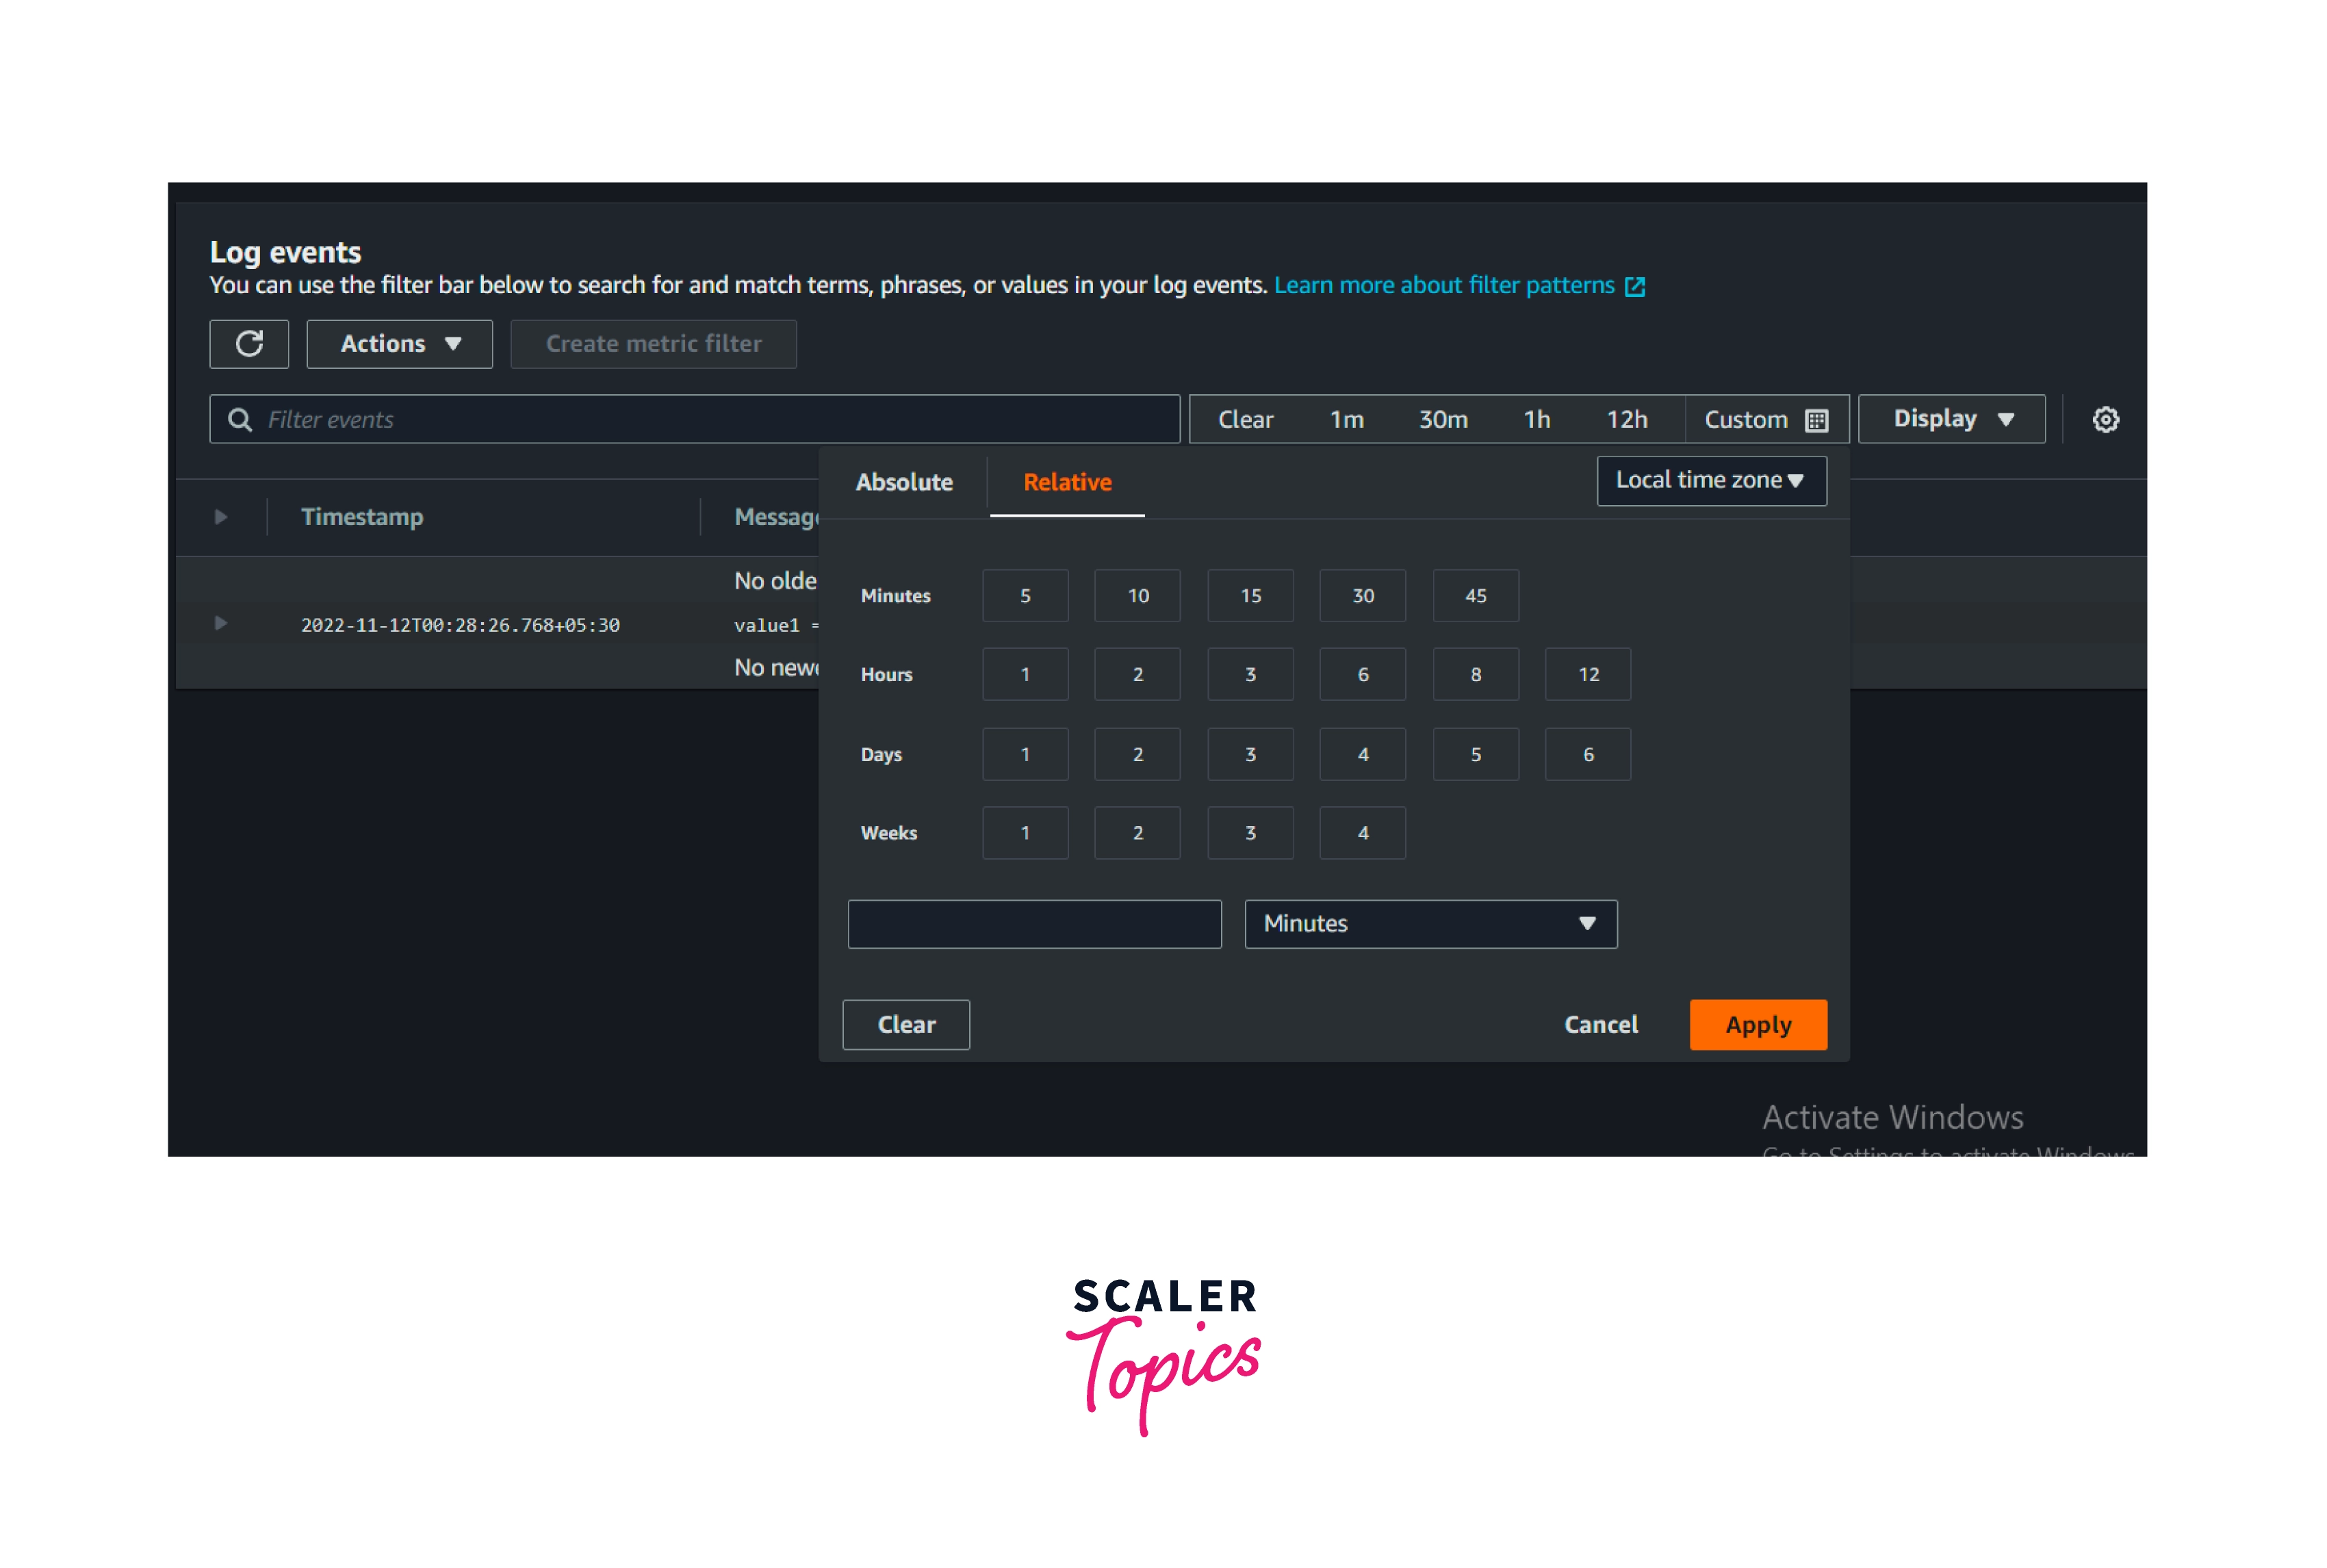
Step 4: Select the preferred time, either relative or absolute, to search for a particular event log at a particular time. It will display all the logs during the selected time frame. Additionally, customers can filter it further by using values that were mentioned in the earlier step.
Getting Started with CloudWatch Logs
The AWS CloudFormation template is used to provision resources by using JSON or YAML.
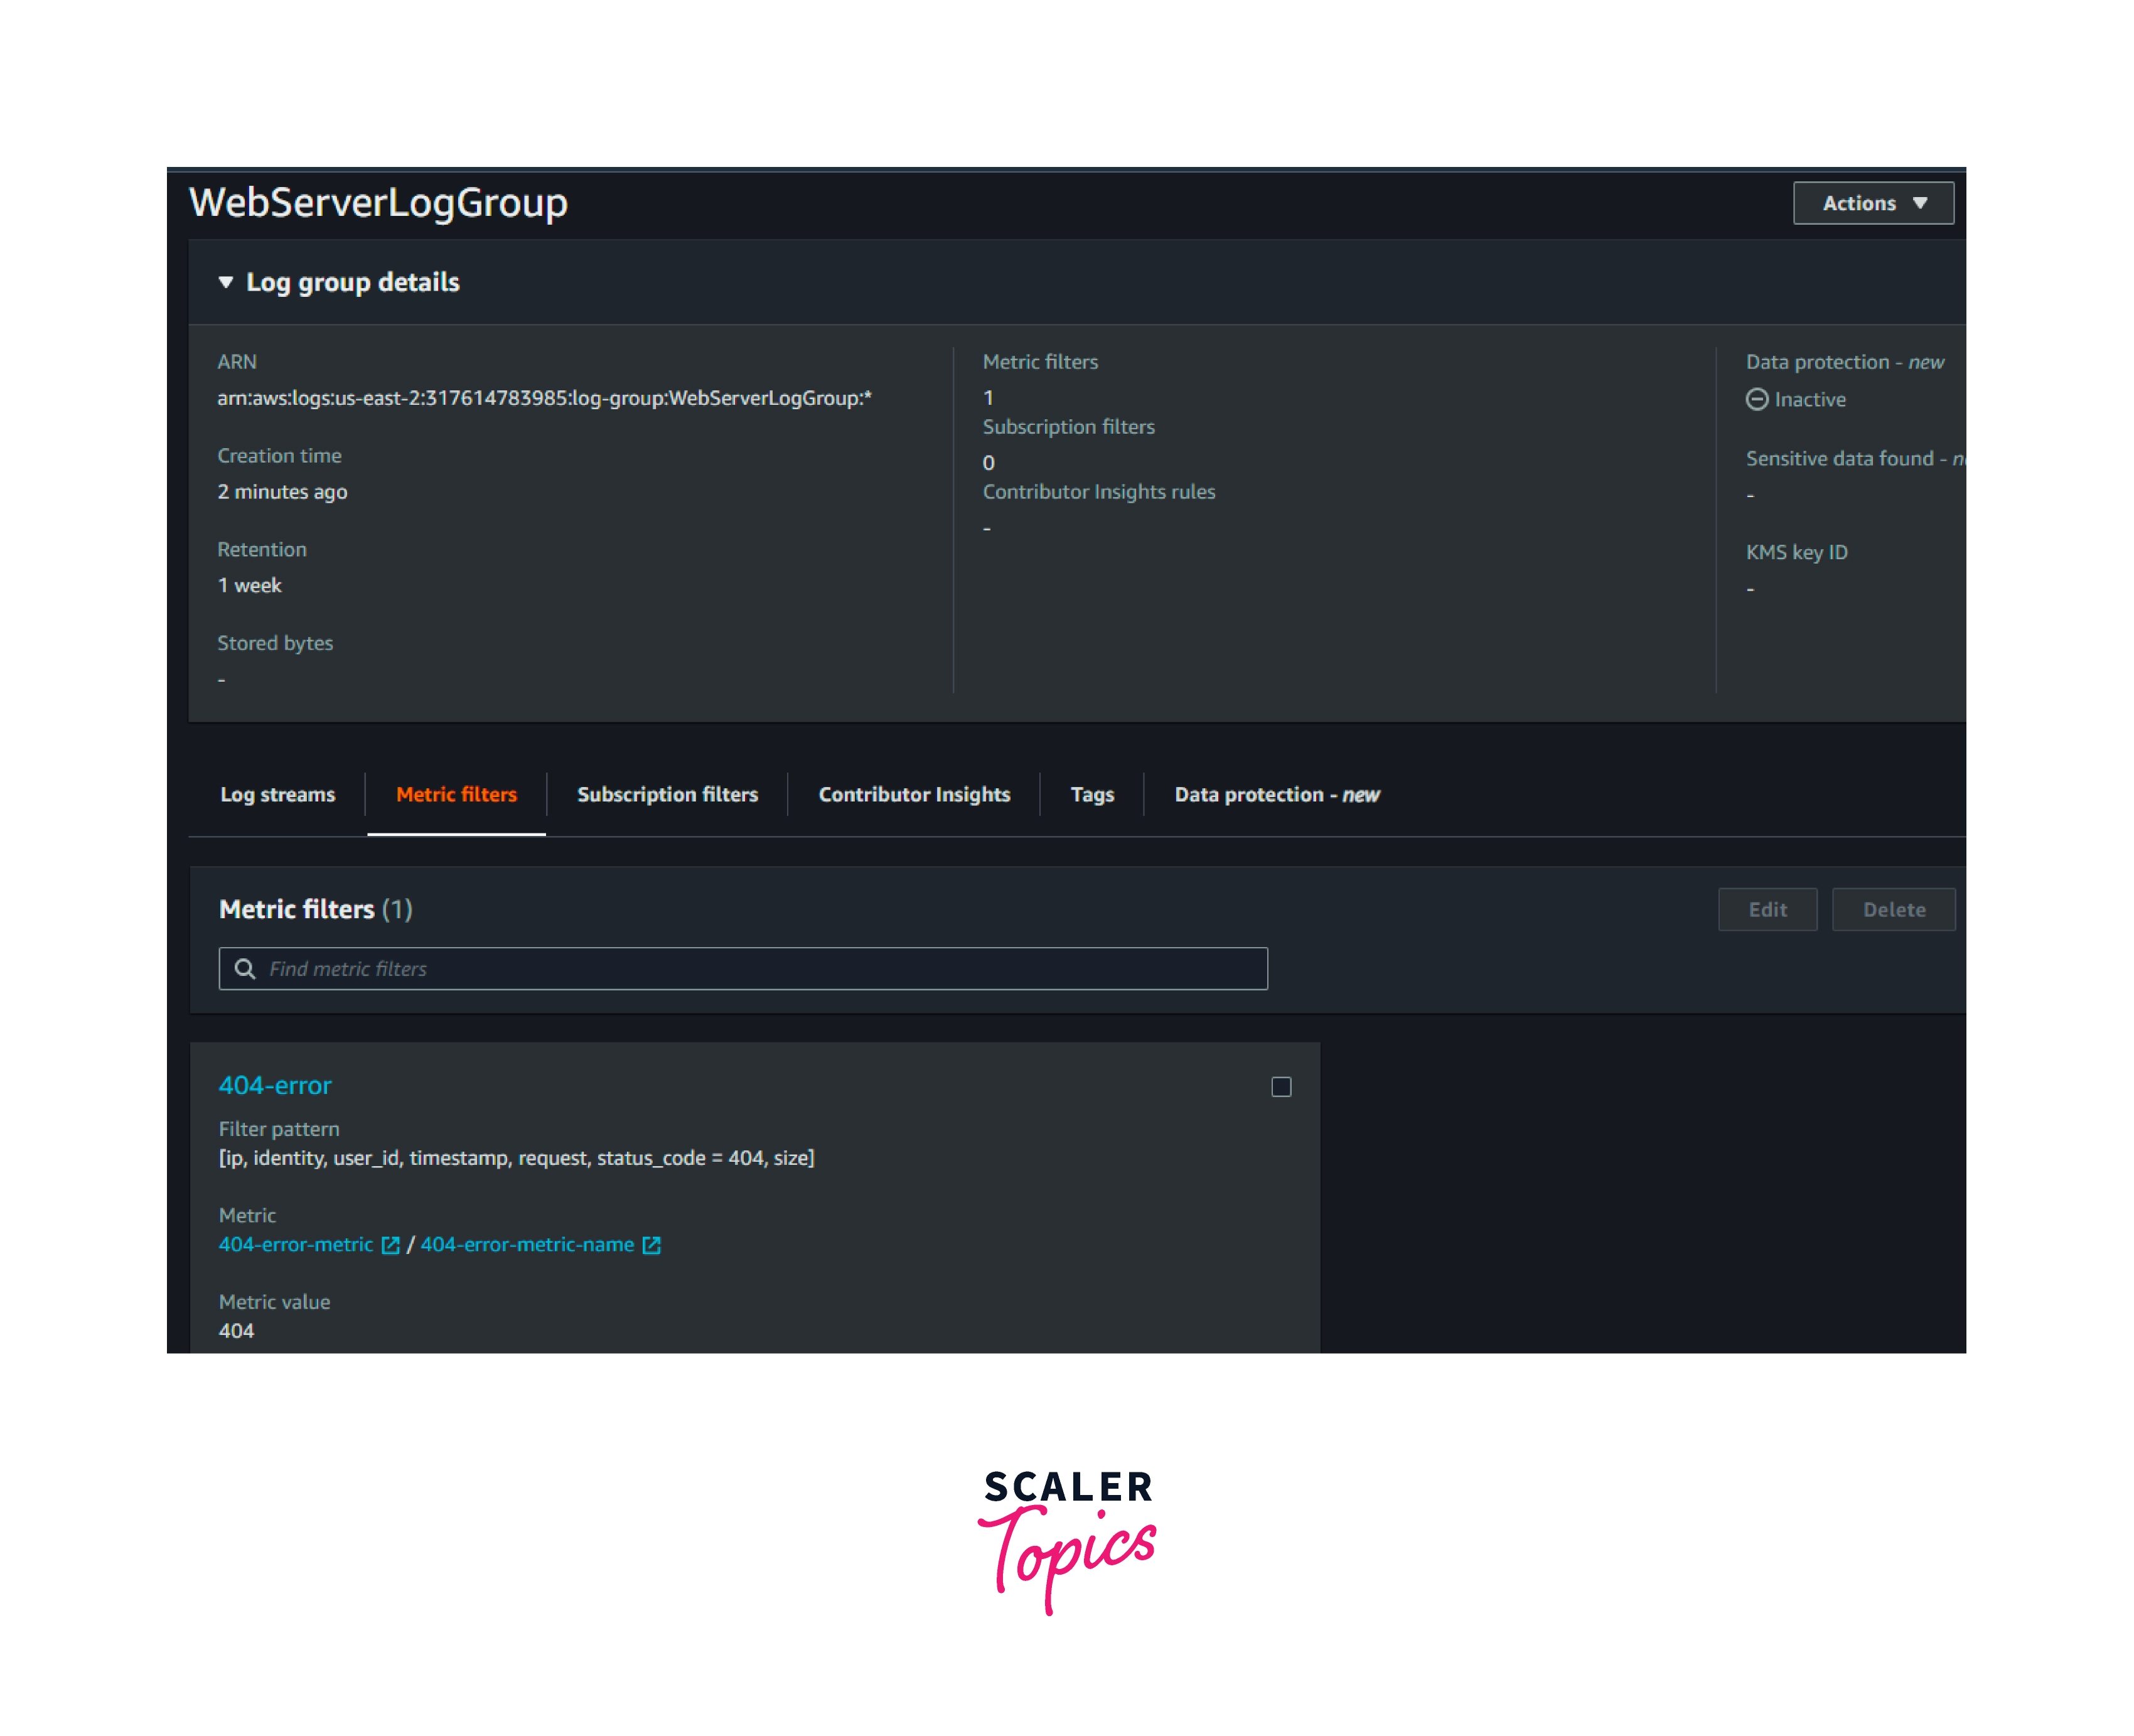
The below template will create a log group with seven retention days. Whenever a 404 error event occurs, that event will be stored in the log group named WebServerLogGroup
Save the above data in a file named `log-group-creation.json.
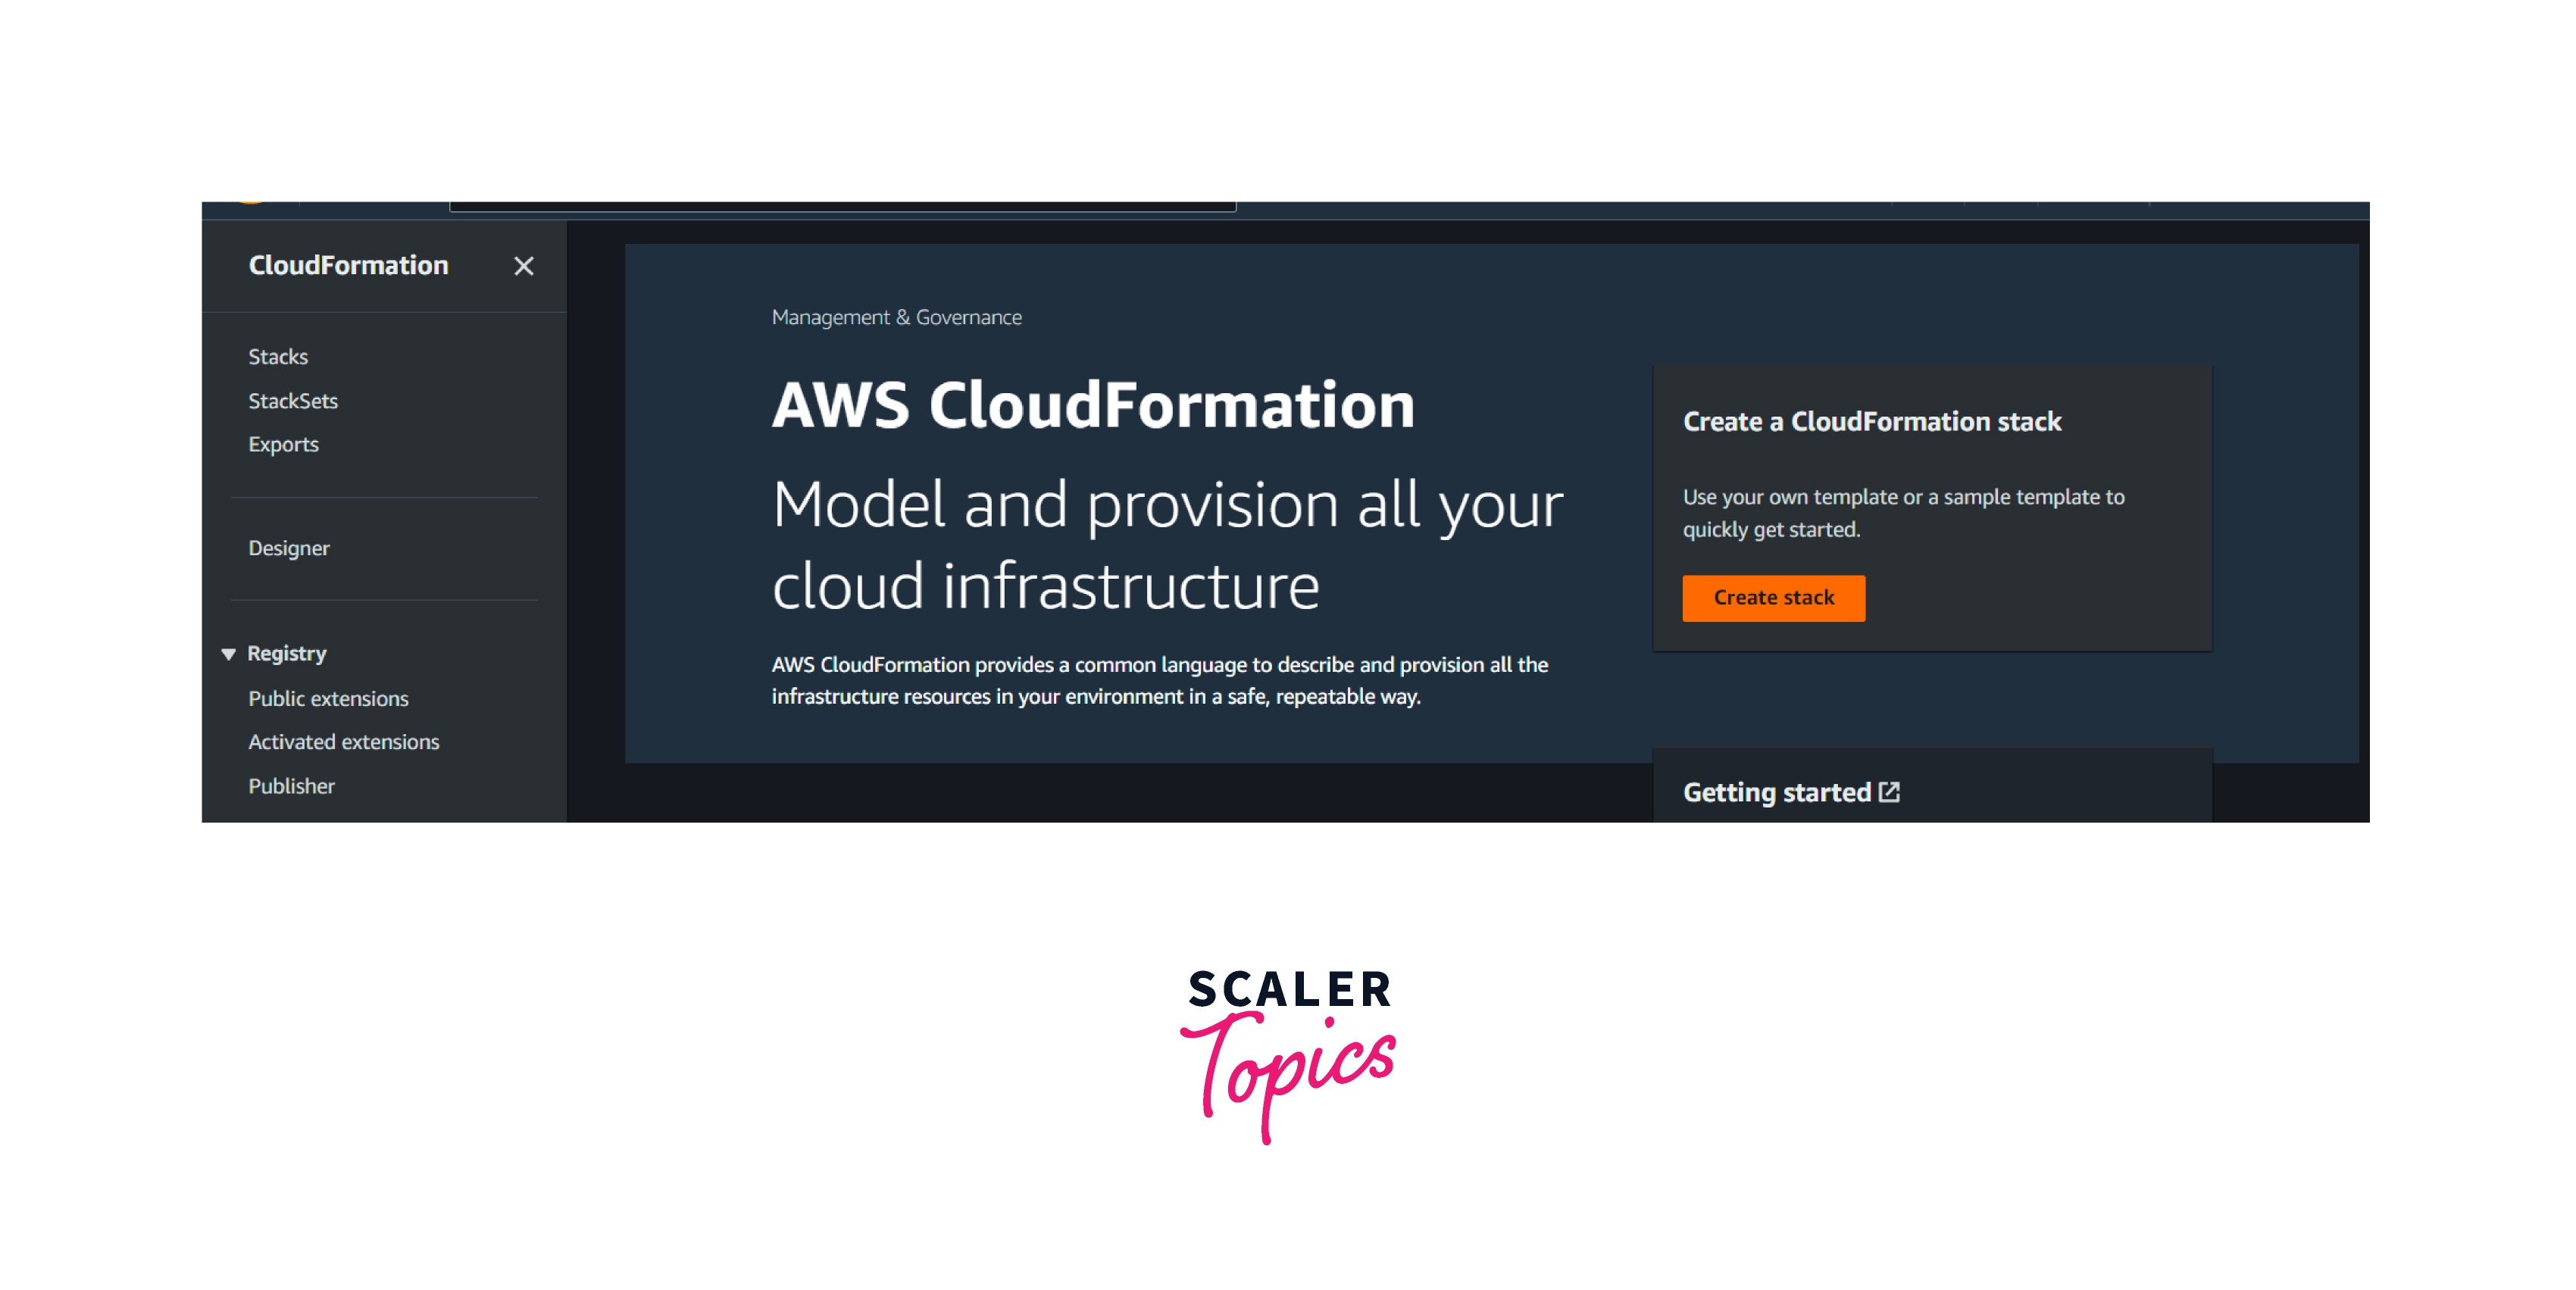
Step 1: Go to the AWS Cloudformation console.
Step 2: Select Stack in the left navigation pane and click the Create Stack button.
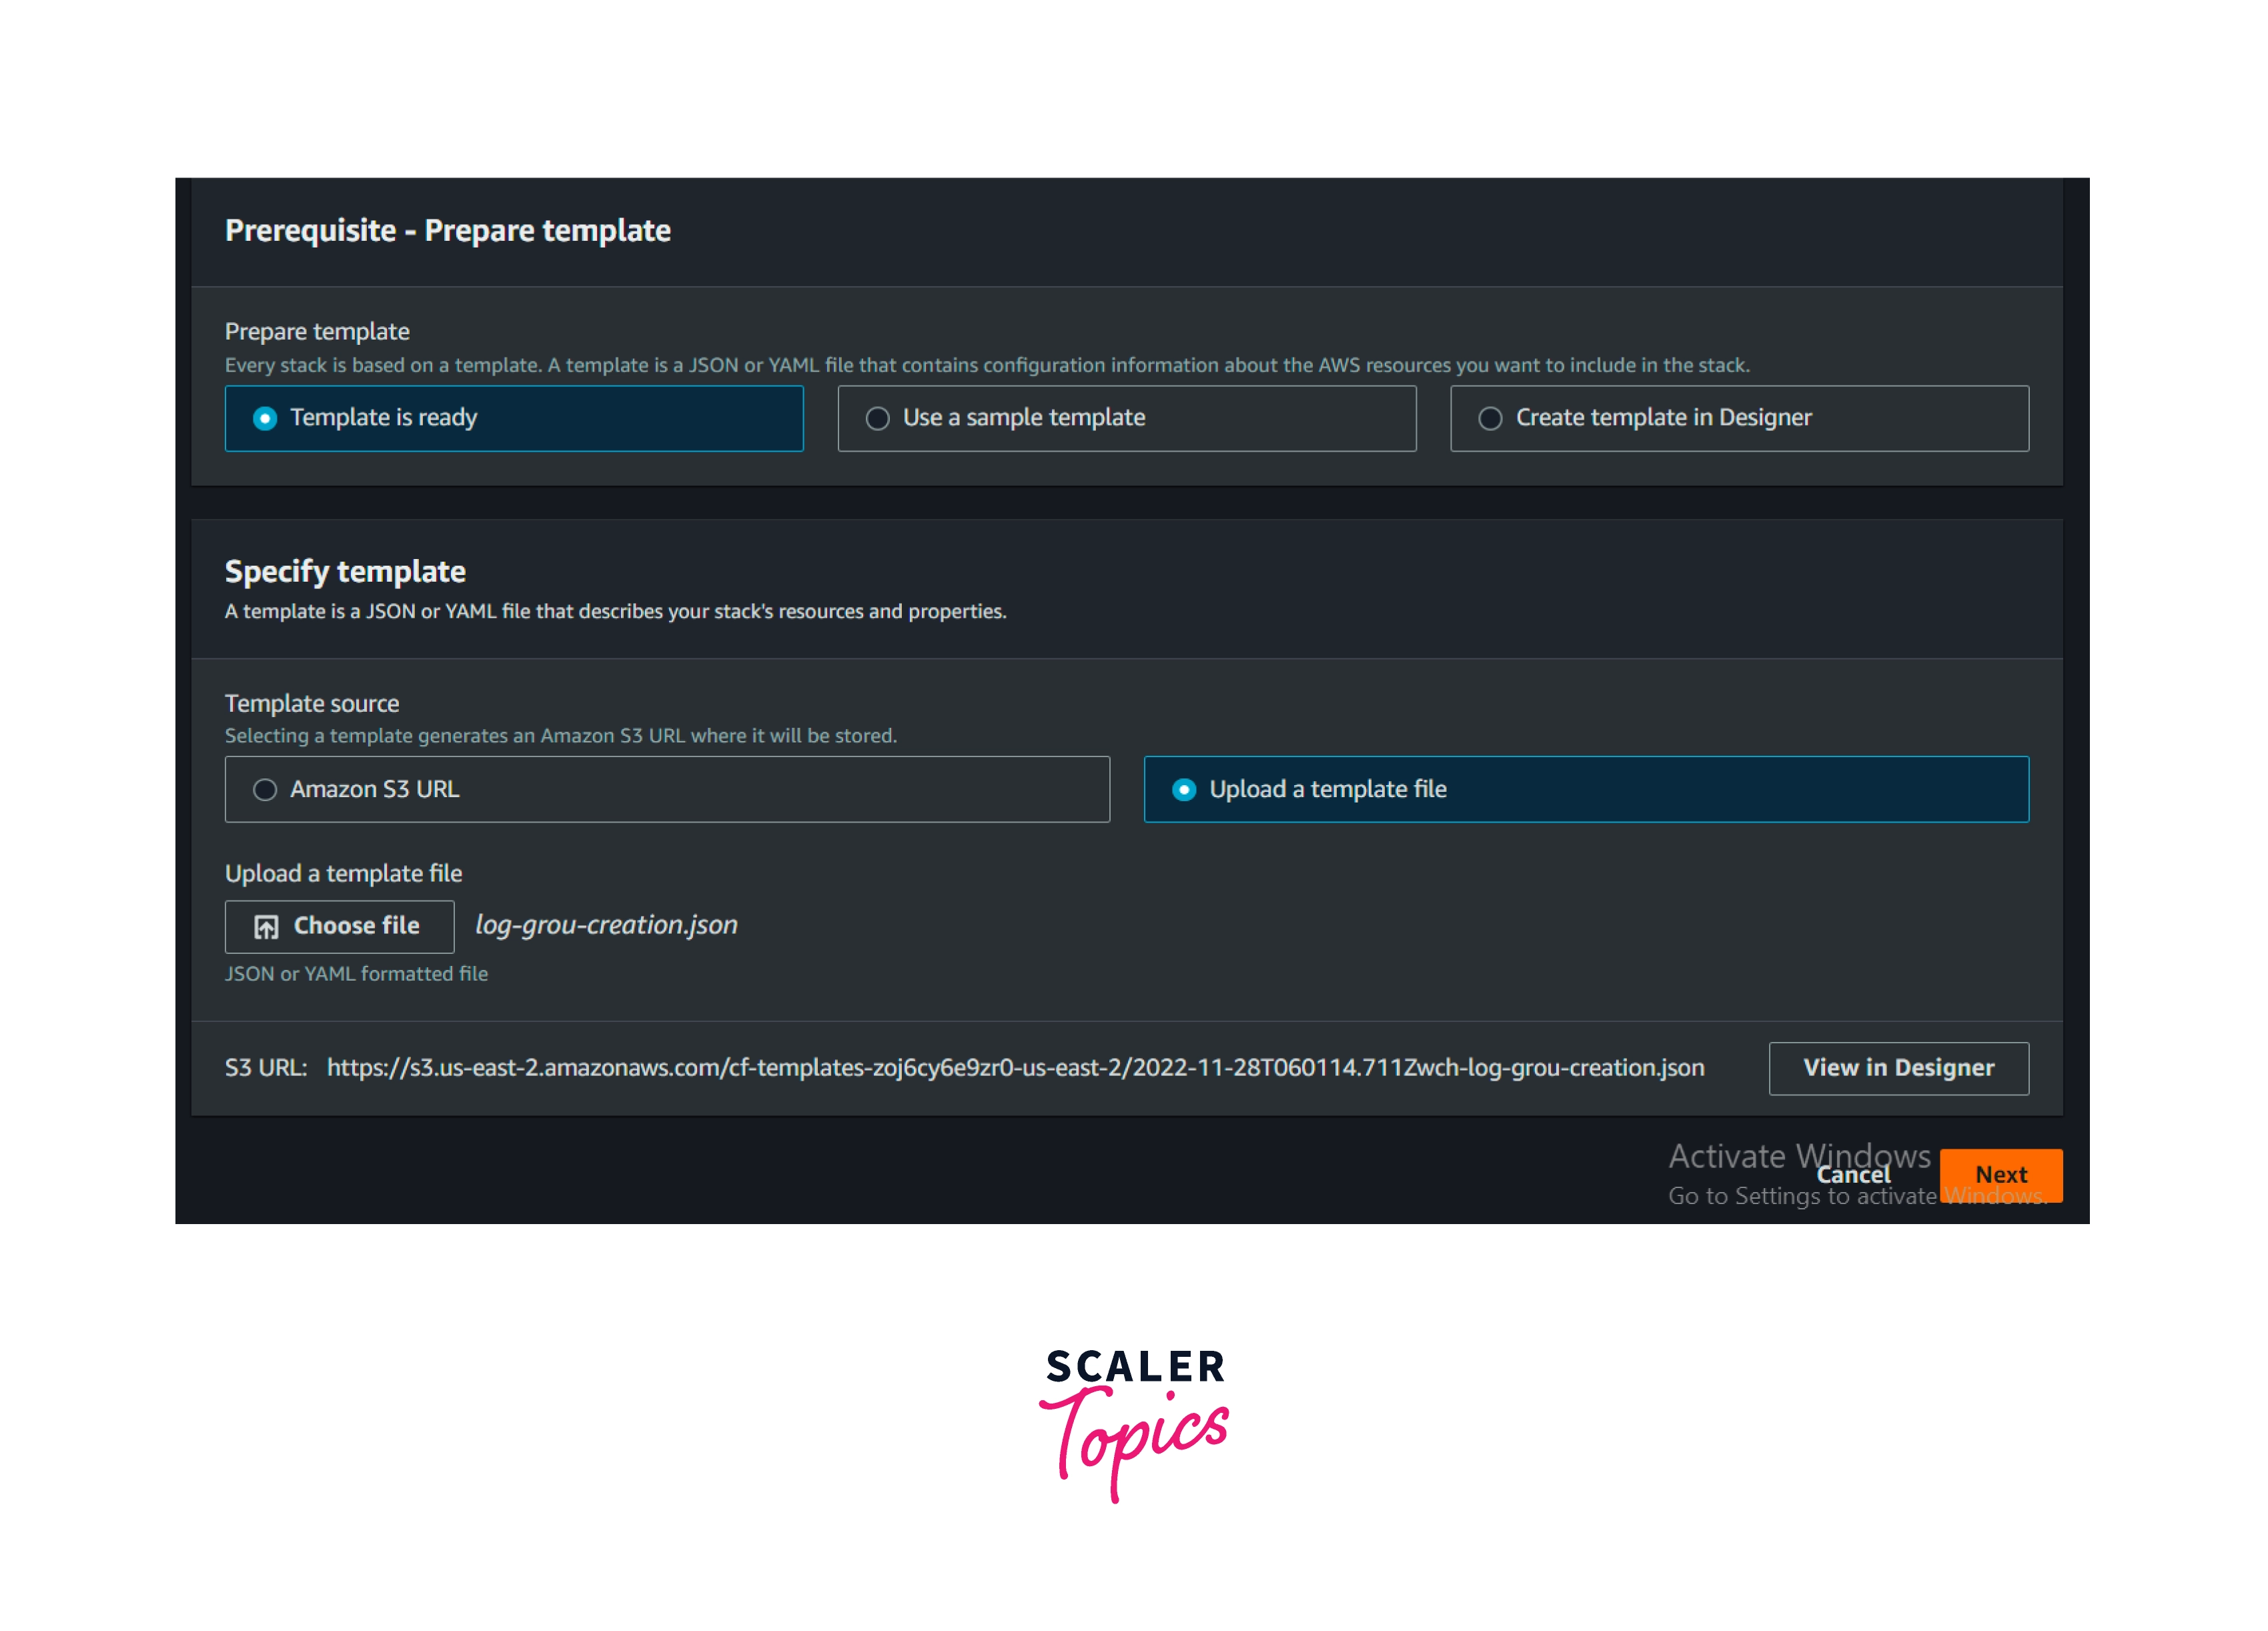
Step 3: Select a template as a ready option, upload the file log-group-creation.json, and click next then Create the Stack.
Now go to the AWS CloudWatch console. We could see the log group was created with a filter, as mentioned in the above JSON.
Reference:
Getting started with CloudWatch Logs - Amazon CloudWatch Logs
View Your CloudWatch Logs
Some AWS services will ingest the logs natively into the cloud watch logs.
One such services is AWS Lambda.
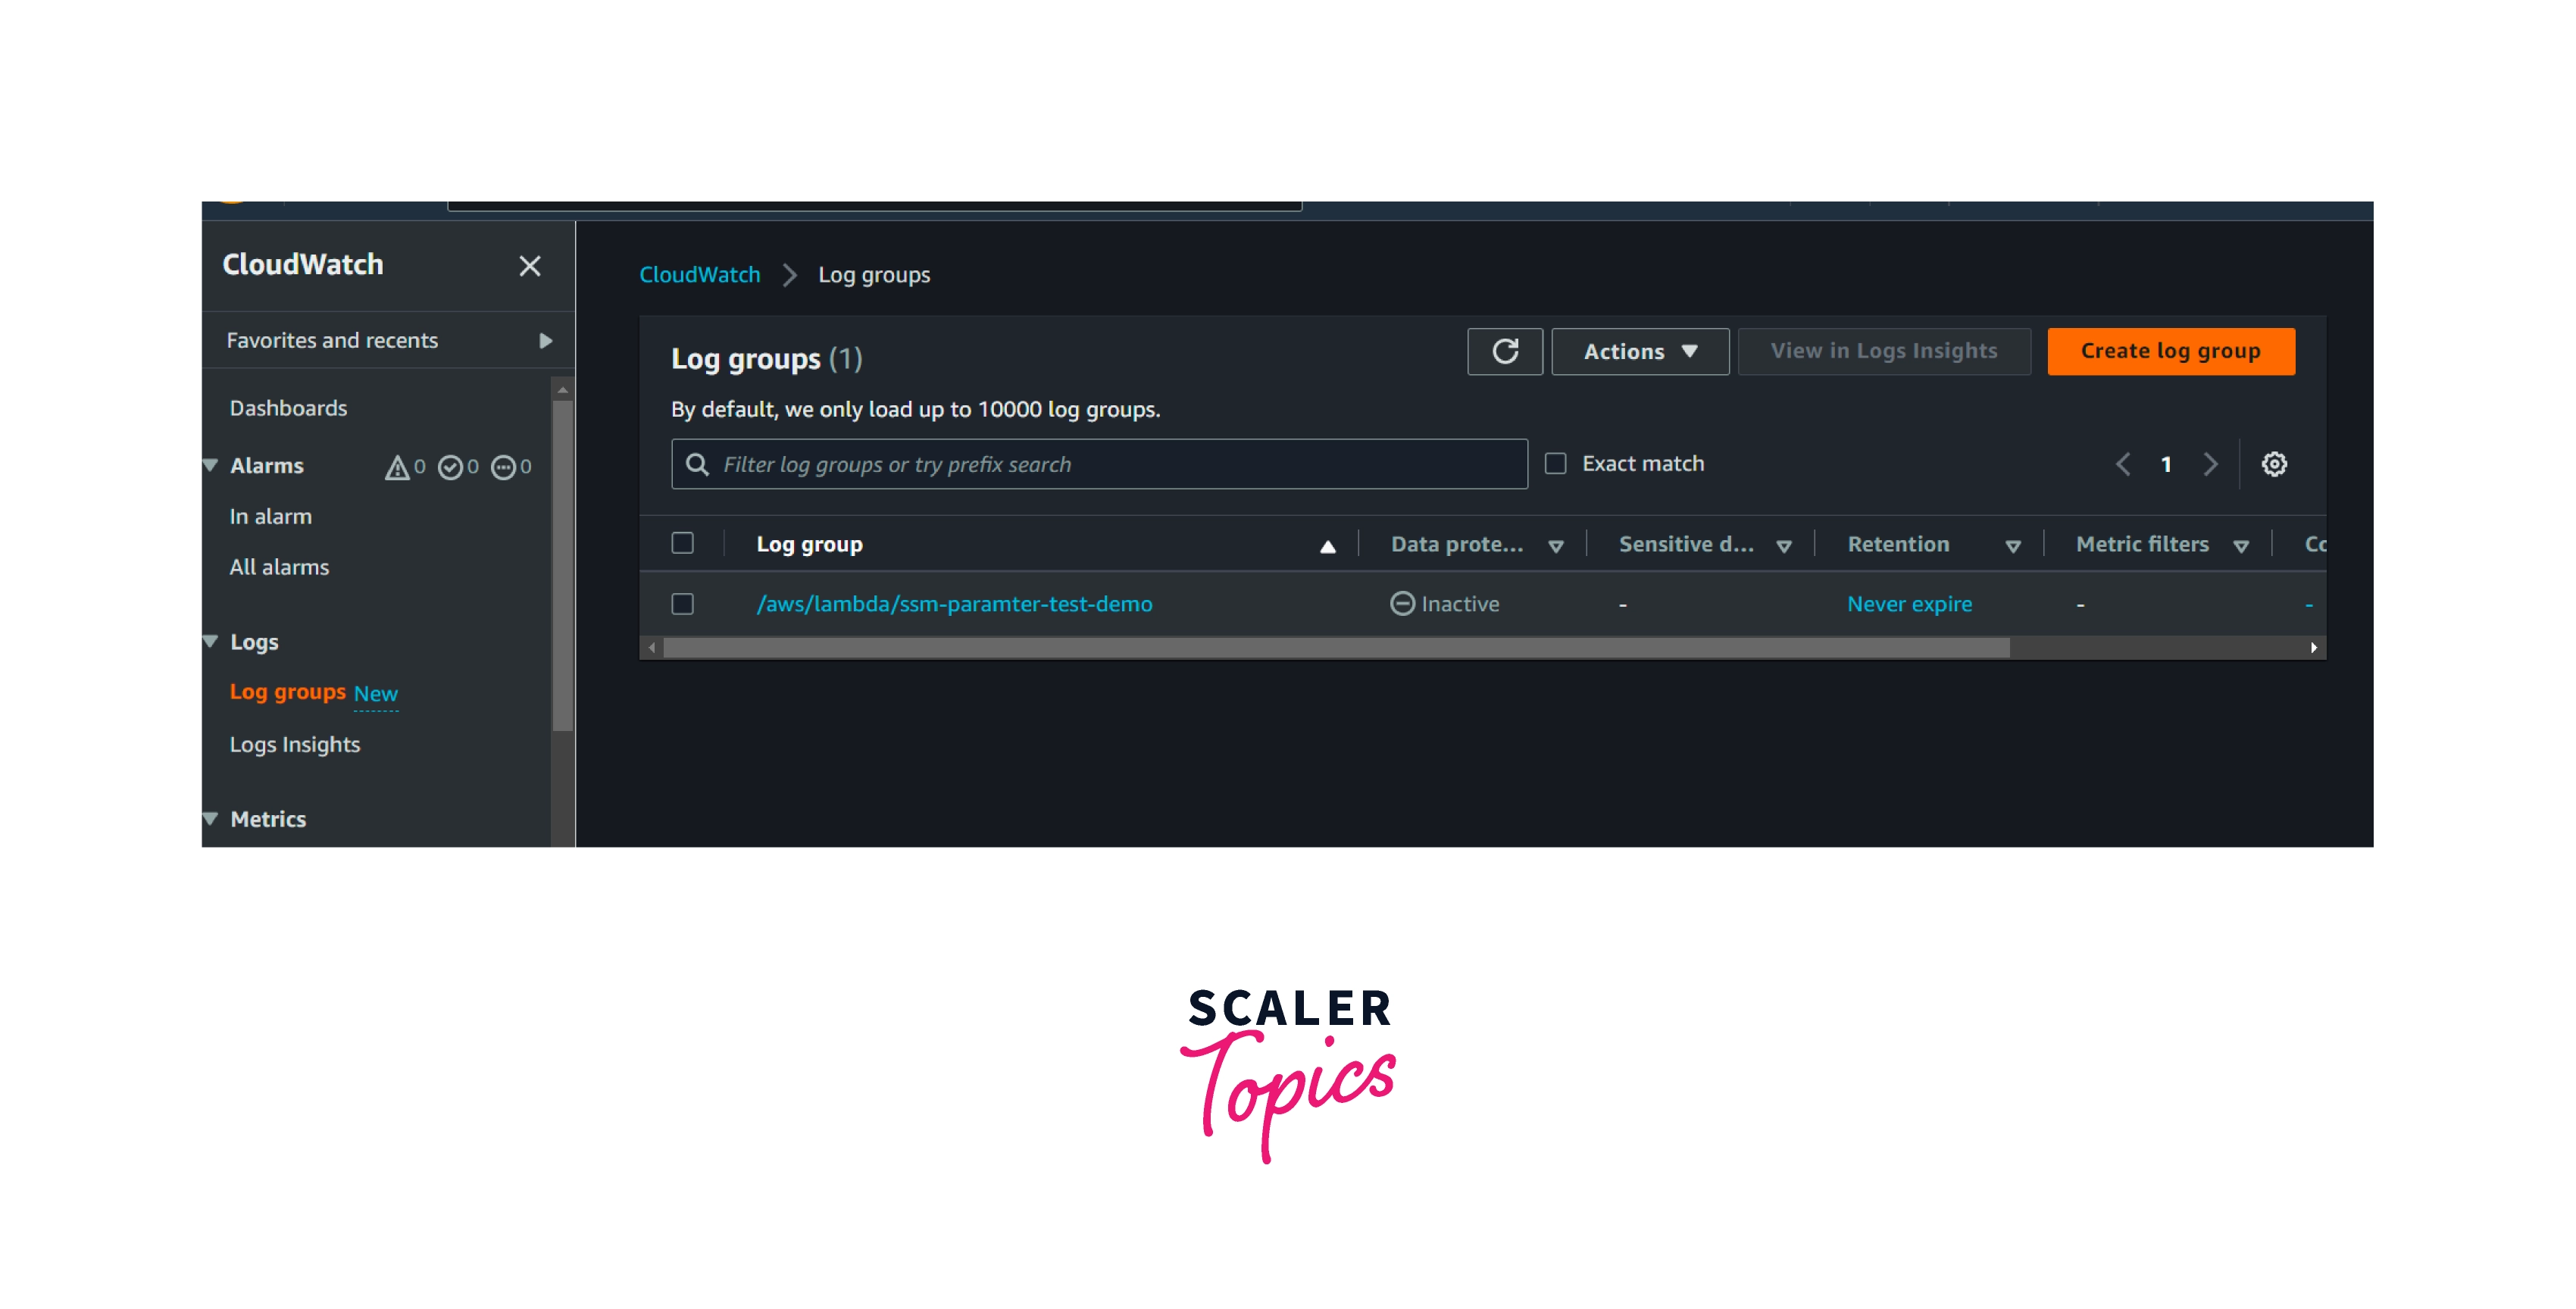
Go to the log groups in the Amazon CloudWatch console.
- Whenever lambda is invoked, lambda logs will be generated and ingested here.
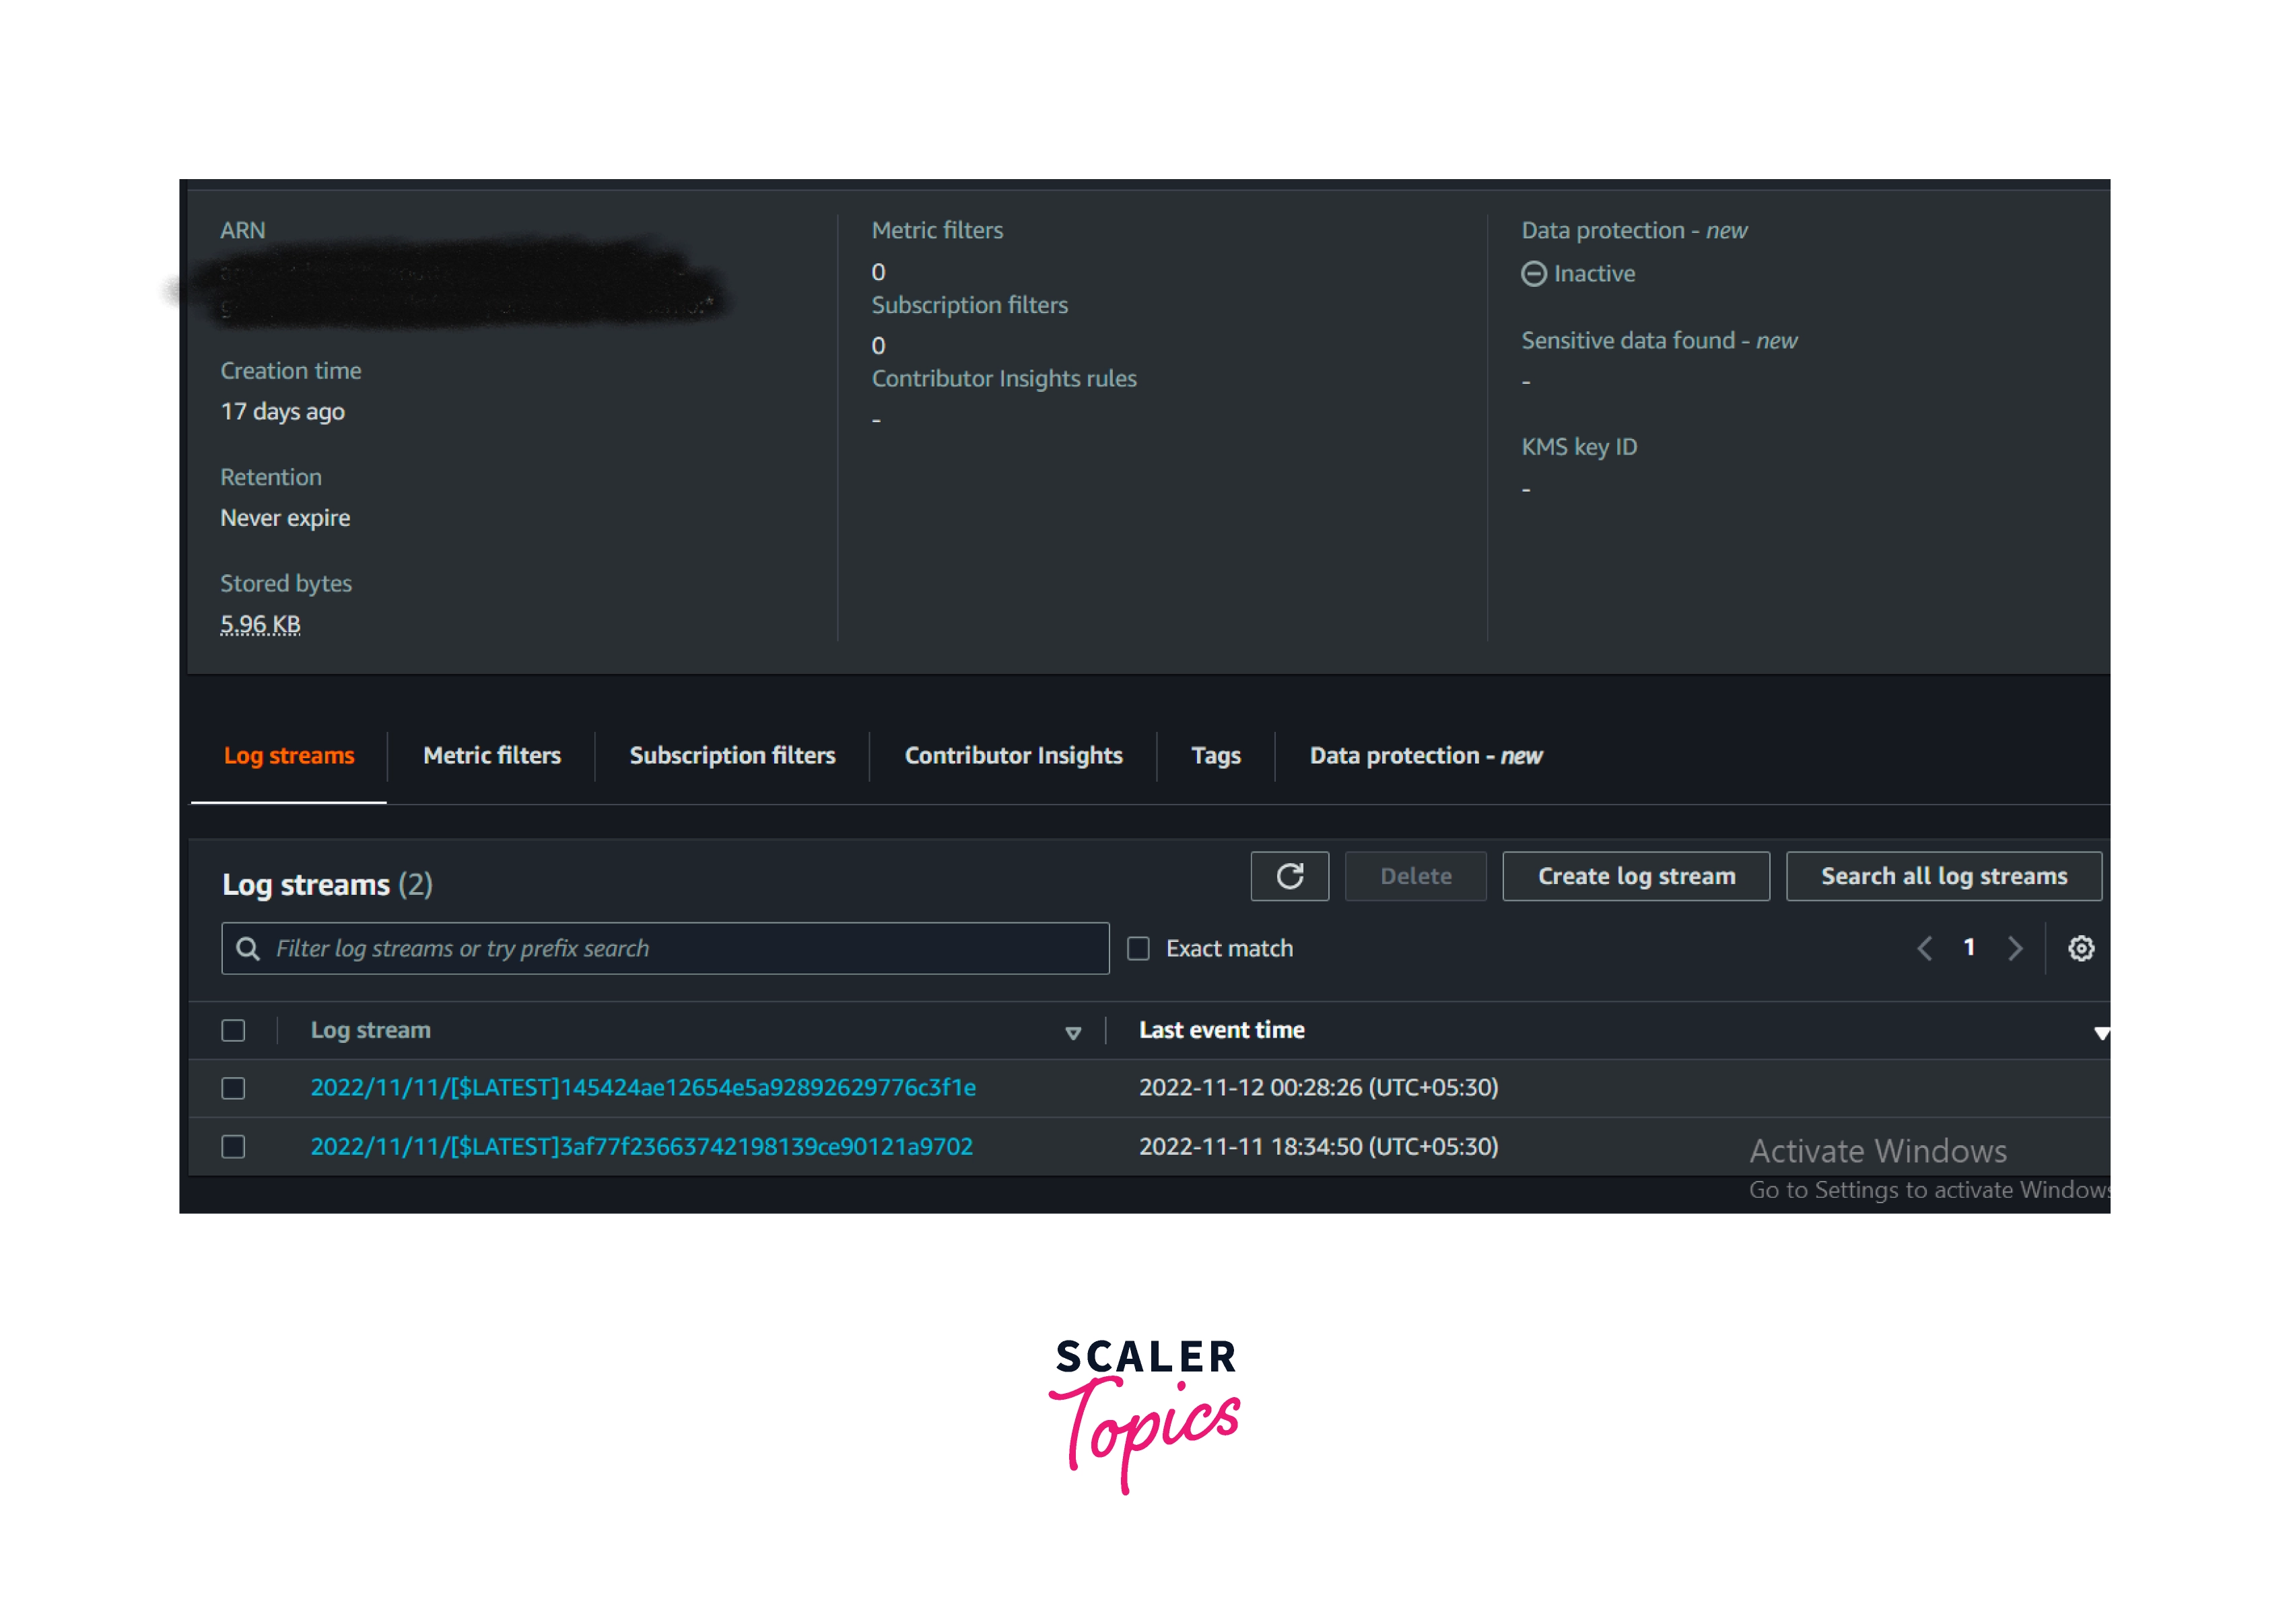
- The same function and application logs will be grouped as log streams.
AWS CloudWatch Logs Pricing
The logs are charged based on the data transfer out from the AWS to the internet and storage of the logs
Free Tier
5GB of log data (Collect, store and analyze) per month.
Paid Tier
| Components | Pricing per GB |
|---|---|
| Collect (Data Ingestion) | $0.67 per GB |
| Store (Archival) | $0.03 per GB |
| Analyze (Logs Insights queries) | $0.0067 per GB of data scanned |
Vended Logs
- Certain CloudWatch logs are natively published by AWS Service on behalf of customers.
- Available vended logs for CloudWatch are mentioned below.
Amazon VPC flow logs; Amazon Route 53 public DNS query logs; Amazon Route 53 resolver query logs; Amazon ElastiCache for Redis logs; API Gateway Access logs; AWS Step Functions Express and Standard logs; Managed Streaming for Kafka (MSK) logs; Web Application Firewall (WAF) logs; and AWS Network Firewall alerts and flow logs.
| Data ingested | Price per GB |
|---|---|
| First 10 TB | $0.67 per GB |
| Next 20 TB | $0.335 per GB |
| Next 20 TB | $0.134 per GB |
| Over 50 TB | $0.067 per GB |
| Data stored | $0.03 per GB |
Note: The above pricing is applicable for the AWS Mumbai region. Pricing will differ based on the region
Pricing Reference:
Related AWS Services to CloudWatch Logs
The following services are used in coordination with Amazon CloudWatch Logs:
AWS CloudTrail
- CloudTrail assists in determining who accessed what.
- Here, "who" refers to an IAM (Identity and Access Management) user or an AWS service, and "what" refers to AWS resources and services.
- CloudTrail is one of the AWS services that provides auditing, governance, and compliance for our AWS account.
- It records all the activities and events that are happening on our AWS account in the form of logs.
AWS IAM
- "IAM" stands for "Identity and Access Management."
- The "AWS IAM service" is used for creating "users or roles" that will be used to work around the AWS service.
- AWS IAM is the first level of "authentication" that occurs when a user attempts to log in to their AWS account or access AWS services through the AWS management console or CLI.
- In layman's terms, "AWS IAM" is in charge of deciding who (an IAM user) has access to what (AWS services).
Amazon Kinesis Datastreams
- Amazon Kinesis Data Streams is used for data aggregation in real time. Here the data refers to application logs, IT infrastructure log data, social media, market data feeds, and web clickstream data.
- The data stream aggregation will happen in real-time with lightweight. So, it plays an important role in creating the data processing application.
AWS Lambda
- AWS Lambda is a serverless service that is used to deploy applications and functions.
- It can be integrated with various AWS services natively to provide better performance for service-to-service communication.
- AWS Lambda logs are natively published to Amazon CloudWatch logs.
Conclusion
- Amazon CloudWatch logs are used to ingest, store, and analyze the logs that are generated from the AWS resources.
- AWS CloudWatch log groups have flexible retention periods and export options to an S3 bucket.
- AWS Log streams are made up of events that occur from the same source.Log groups are a grouping of log streams.
- The Vended Logs are natively published by AWS on behalf of customers. Those logs will have a certain discount in pricing when compared to other AWS Service logs.
- Amazon CloudWatch Log data is encrypted both in transit and at rest.
- The Amazon CloudWatch log group is associated with the metric filter, subscription filters, and log insight. All these features help troubleshoot across the logs. Those features also help to build a data processing application.
