DynamoDB Performance Optimization
Overview
When building applications requiring single-digit millisecond performance, your best option is to use a scalable serverless solution backed by DynamoDB. DynamoDB Performance Optimization makes the latency (taken to complete an operation) very low in its operations, with delays ranging from 10 to 20 ms. Sometimes, DynamoDB has high latency in its workload. As a result, it causes delayed responses that slow down your application. Therefore, this article will analyze latency benchmarks of DynamoDB operations, look at ways to identify latency and address ways to reduce latency and DynamoDB Performance Optimization in AWS.
Metrics and Benchmarks for DynamoDB Operations
- Scan: The scan is not a quick process. Its computational complexity is O(n), and for large tables, it can go beyond the throughput that has been allocated in a single operation. The scan limit for DynamoDB is 1MB. For eventual reads, it can use up to 128 RCU, and for strongly consistent reads, it can use up to 256 RCU. Your queries will begin to be throttled, though, if you go above the throughput limit.
- Filtering: The data retrieved from your database is not reduced when you use the FilterExpression. In the background, it first retrieves all the data before applying the Filter Expression. Because it must perform intricate filtering after reading, it increases the overhead for your operation. Thus, the latency lengthens.
- Global Secondary Indexes(GSI): DynamoDB builds a new base table for the necessary properties when you establish a GSI. The index gets its own throughput as a result. Therefore, all actions on the index use up its throughput rather than the tables. To prevent potential throttling, it is advised to set the RCU/WCU to be higher than that of the table. DynamoDB slows the request and introduces latency if you write heavily to a table and the index in the database has insufficient write capacity.
- Global Table Replication: Global table replication latency in DynamoDB is below one second. You can use the ReplicationLatency measure on CloudWatch to determine the latency.
- Insert: The table can support 40,000 writes per second for objects of 1KB in size, according to DynamoDB's 40,000 WCUs per second (depending on the location). When the write throughput exceeds the threshold and causes latency, DynamoDB will restrict the requests. That can be raised if necessary.
- Transactions: A Transactional Write/Read cannot exceed 4MB or 25 Items, as specified by DynamoDB transactions (whichever occurs first). To gather the information and commit the transaction during the transaction, DynamoDB uses a single read-and-write capacity unit. As a result, if you surpass the throughput, your requests may probably be throttled with increased latency.
- Join: Join queries can be run on DynamoDB when Apache Hive and DynamoDB are integrated. The average delay is dependent on your operation; it is not predetermined. For each Hive Query, Amazon EMR sends a statistic to CloudWatch that indicates when the provisioned throughput was exceeded. Additionally, the request's successful request latency (SuccessfulRequestLatency) is delivered to CloudWatch metrics. These measurements can be used to assess latency.
- VPC Endpoints: DynamoDB still operates at the optimal latency inside a VPC. The additional delay from the Network Throughput is also there. Each VPC Endpoint (used by DynamoDB) enables burst speeds of 40Gbps and throughput of up to 10Gbps per availability zone. Throttling and latency are added to the response if the throughput is exceeded, producing delays.
Troubleshooting High Latency in DynamoDB
Determining the cause of your DynamoDB operations' high latency is essential. You can look at the CloudWatch logs to diagnose and locate delays in your DynamoDB tables.
DynamoDB logs the SuccessfulRequestLatency key measure whenever an action is carried out. It also offers two crucial pieces of information.
- How long it took to process a request (Minimum, Maximum, Average, Sum)
- How many successful requests there were (SampleCount)
When addressing high latency, it is best to verify the Average SuccessfulRequestLatency. Additionally, a high Average SuccessfulRequestLatency is a strong predictor of latency requests.
You can also utilize the Latency Logger to obtain a more comprehensive record in order to identify the reason for the increased latency.
How Does DynamoDB Fair against Other Databases?
Over 20 million queries may be processed every second using DynamoDB, which can process up to 10 trillion requests daily. DynamoDB was created by Amazon specifically for its online store. Before we begin our performance comparison, I want to ensure you know DynamoDB's potential. DynamoDB is significantly more potent than any NoSQL database currently available when you model properly.
- RDS: Though DynamoDB is a non-relational document database, AWS RDS is fundamentally relational. Due to the data's document-based structure, DynamoDB offers speedier lookup times. Additionally, DynamoDB Performance Optimization makes data scaling simple by not requiring a pre-defined schema.
- S3: While Amazon S3 has a gigantic limit of 5TB per item, DynamoDB is only allowed a maximum of 400KB per item. The apparent winner for storing huge things is S3. But because S3 does not enable complex object filtering, it is more suitable for blob storage rather than as a transactional database.
- Redis: Only DynamoDB utilizes SSD storage. In contrast, Redis functions as an in-memory database. As a result, DynamoDB offers single-digit millisecond latency, while Redis can approach microsecond latency. In the end, Redis provides lower latency and faster reads and writes.
- ElastiCache: When longevity is not concerned, you can use Elasticache as your main data source. Because Elasticache has faster throughput and IOPS and delivers microsecond latency, it performs better than DynamoDB in use cases where DynamoDB is used to maintain analytical data or sessions.
- Aurora: While DynamoDB is a document-based NoSQL database, Amazon Aurora is a relational database. Due to its document-based architecture, which performs each action on a single document rather than a collection of related tables, DynamoDB Performance Optimization in AWS offers faster reads and writes than Aurora.
- Elasticsearch: FilterExpression can be used to filter for data in DynamoDB. However, it is ineffective since it searches the table and discards irrelevant data. Running intricate filtering on DynamoDB is also counterproductive. Elasticsearch provides inverted indexes and parallel computing to instantly process complex search requests.
- MongoDB: Compared to DynamoDB, MongoDB can manage larger datasets, however, like with any NoSQL database, latency increases as payload size does. DynamoDB, on the other hand, grows well even for larger data quantities and, if properly designed, enables you to query large records of data with latency in the single-digit millisecond range.
- CosmosDB: For data querying, CosmosDB generally has a delay of 20 milliseconds per request. Additionally, the delay tends to be larger with more data and complicated searches. However, DynamoDB Performance Optimization in AWS is preferable since it guarantees a single-digit millisecond delay in all of its operations.
What is the Best Way to Monitor DynamoDB Performance?
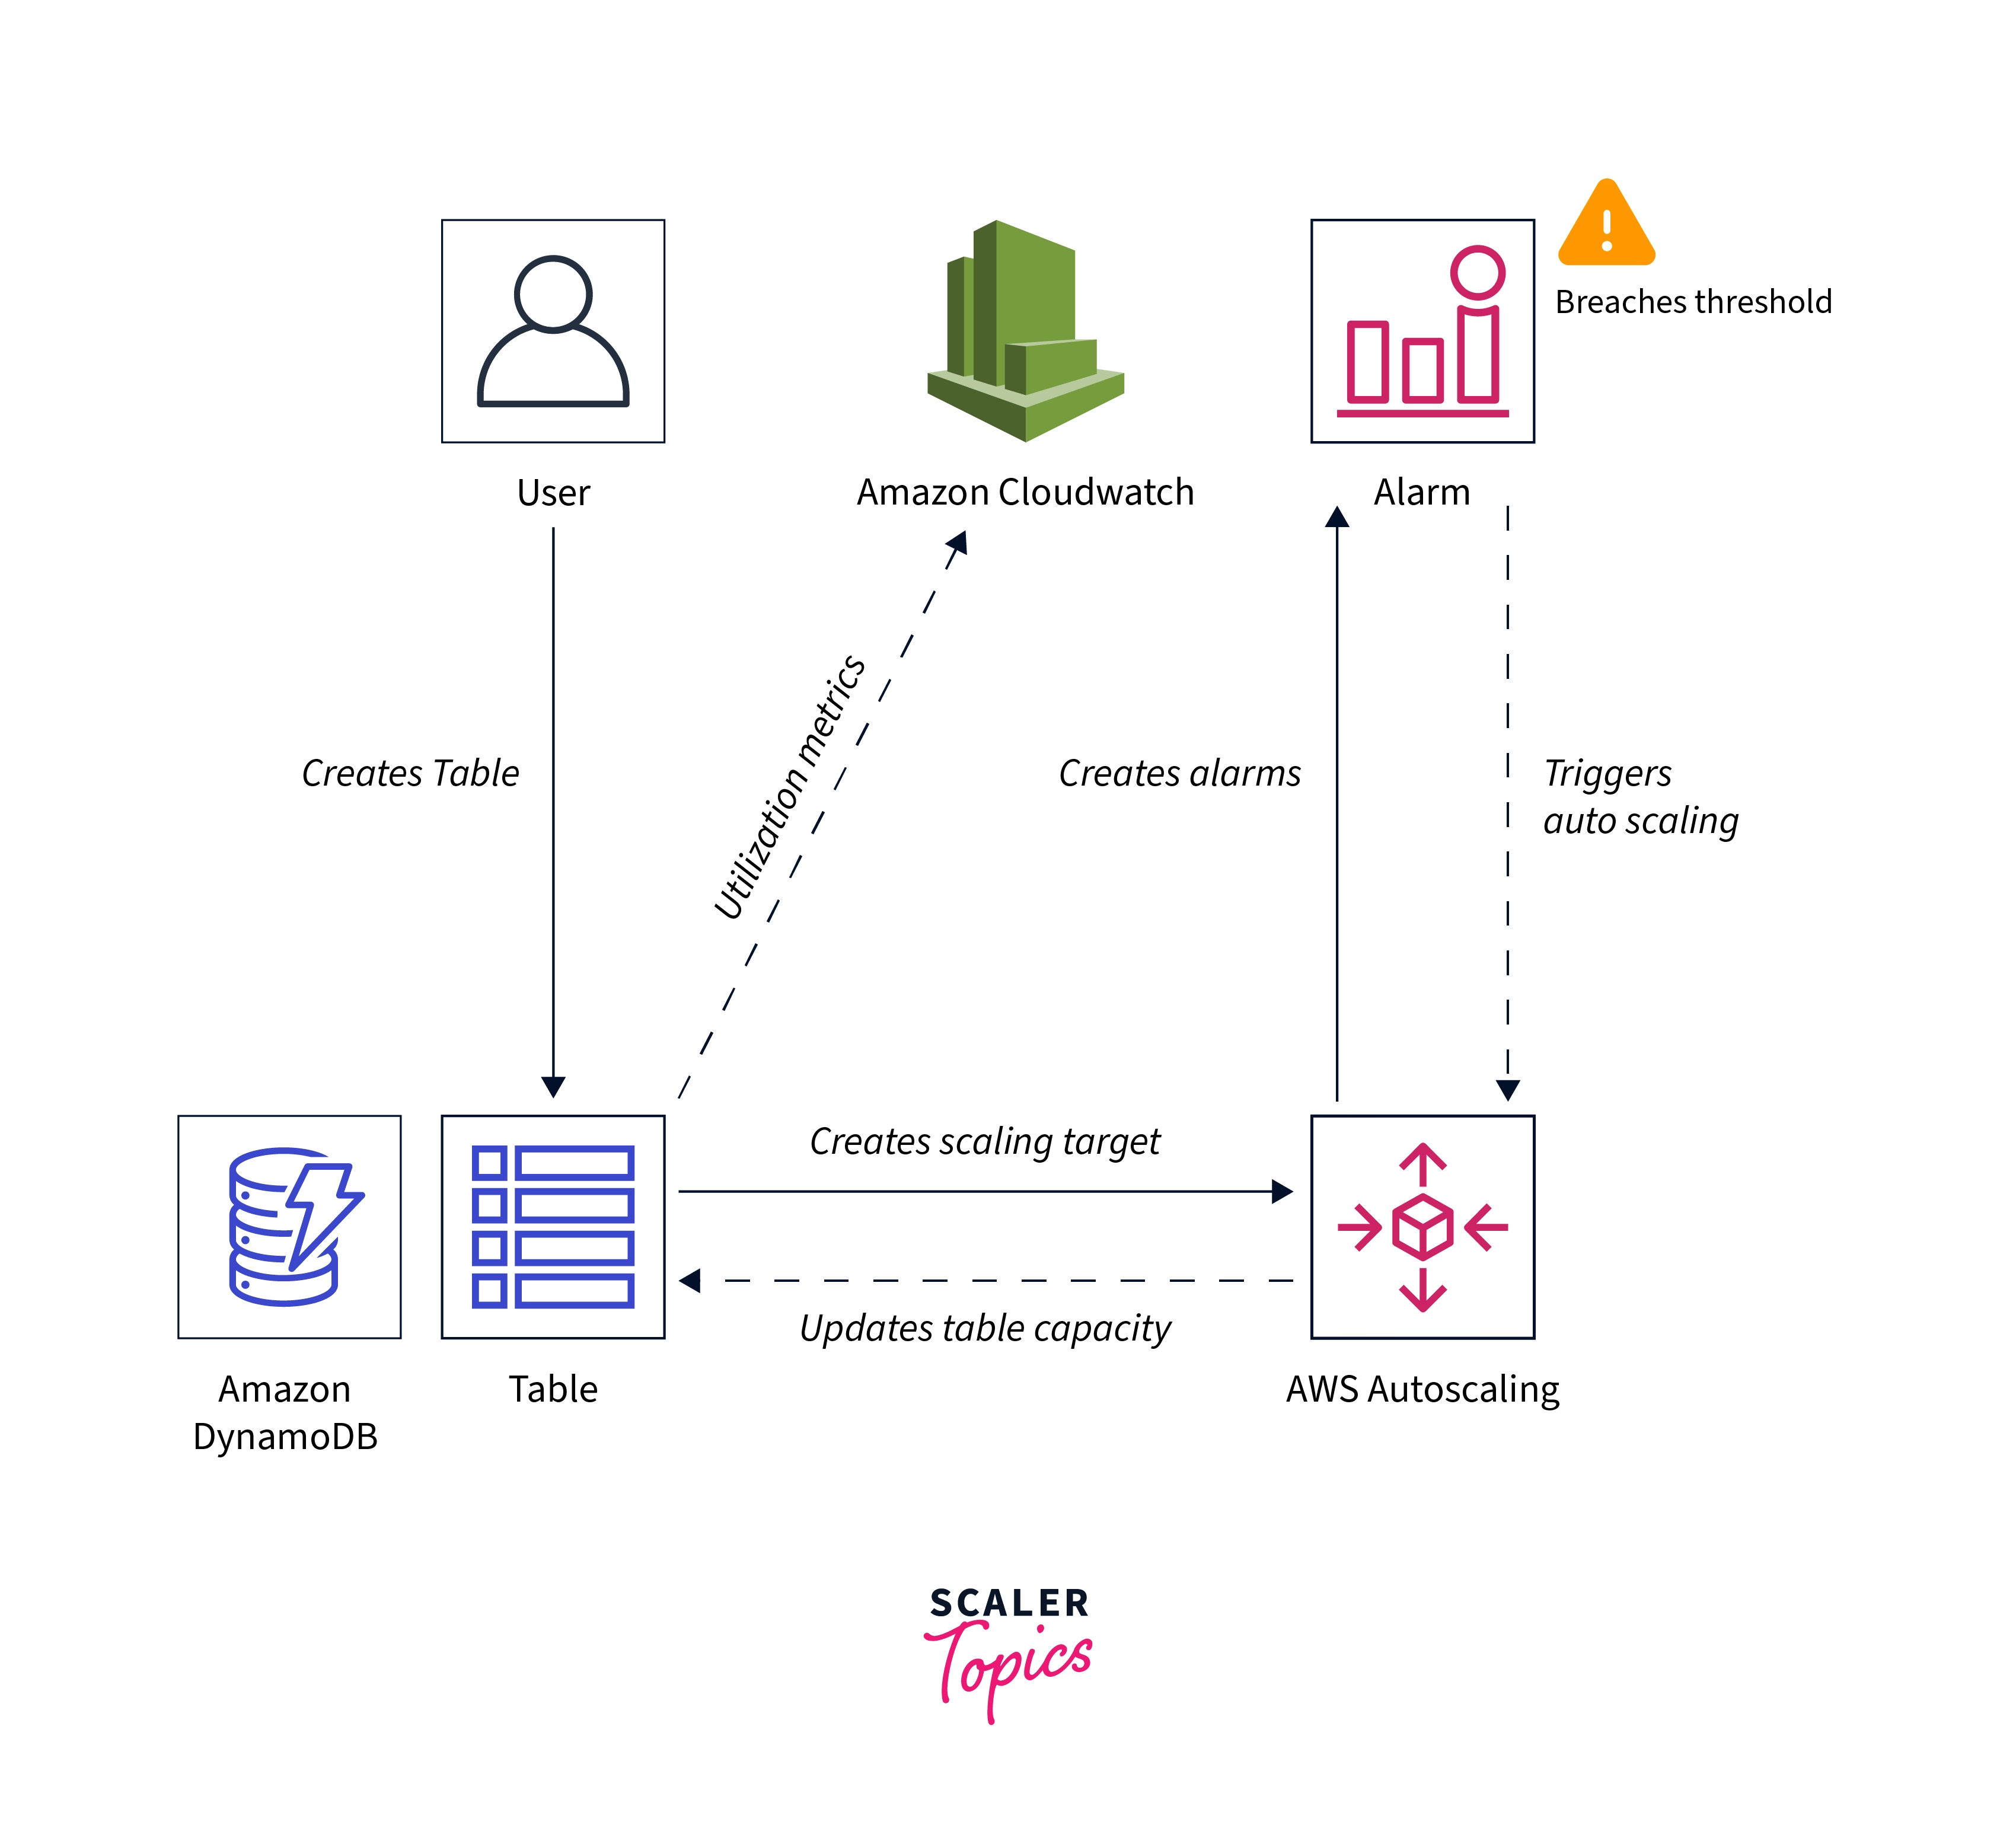
Performance monitoring for DynamoDB is not "best practice"-based. It depends on your personal preferences. Using CloudWatch, which gathers and transforms Amazon DynamoDB's raw data into comprehensible, near-real-time metrics, you can keep an eye on Amazon DynamoDB. These statistics are retained for a specific period of time in order to provide you with a better picture of how your website or application is operating. Data from DynamoDB metrics is automatically forwarded to CloudWatch by default.
Conclusion
- In this article, we examined metrics and benchmarks for DynamoDB latency. It involved metrics like Scan, Filtering, GSI, Global Table Replication, Transactions, and Join. We also learned about DynamoDB Performance Optimization.
- In its service-level agreement(SLA), DynamoDB does not mention latency. However, Amazon guarantees that DynamoDB Performance Optimization in AWS will typically have a latency of 10 to 20ms and, under ideal circumstances, a single-digit millisecond latency.
- We also looked at troubleshooting latency in DynamoDB. You can look at the CloudWatch logs to diagnose and locate high latency in your DynamoDB tables.
- Ultimately, we compared DynamoDB to various database providers like RDS, MongoDB, CosmosDB, etc.