What is Azure Monitor?
Overview
Azure Monitor is a comprehensive monitoring service provided by Microsoft Azure. It enables organizations to collect, analyze, and act upon telemetry data from various Azure resources and applications. Azure Monitor offers real-time insights into the performance, availability, and health of cloud workloads, allowing users to detect issues, troubleshoot problems, and optimize performance. It supports the monitoring of metrics, logs, and traces, providing a centralized platform for monitoring and diagnostics. Azure Monitor helps organizations ensure the reliability and efficiency of their Azure deployments by providing actionable insights and enabling proactive management and remediation.
What is Azure Monitor?
 Azure Monitor is a powerful monitoring and diagnostics service offered by Microsoft Azure. It provides organizations with a comprehensive solution to collect, analyze, and act upon telemetry data from various Azure resources and applications. Azure Monitor allows users to gain real-time insights into the performance, availability, and health of their cloud workloads, facilitating proactive management and efficient troubleshooting.
Azure Monitor also offers advanced alerting and notification capabilities. Users can define alert rules based on specific thresholds or conditions, and receive notifications via various channels like email, SMS, Azure Functions, or Azure Logic Apps. This proactive alerting mechanism enables prompt identification and resolution of any performance issues or failures. Azure Monitor also provides automated actions, allowing users to execute predefined remediation tasks or runbooks in response to alerts. This helps streamline incident response and automate remediation processes, reducing mean time to resolution (MTTR) and enhancing operational efficiency.
How does Azure Monitor Work?
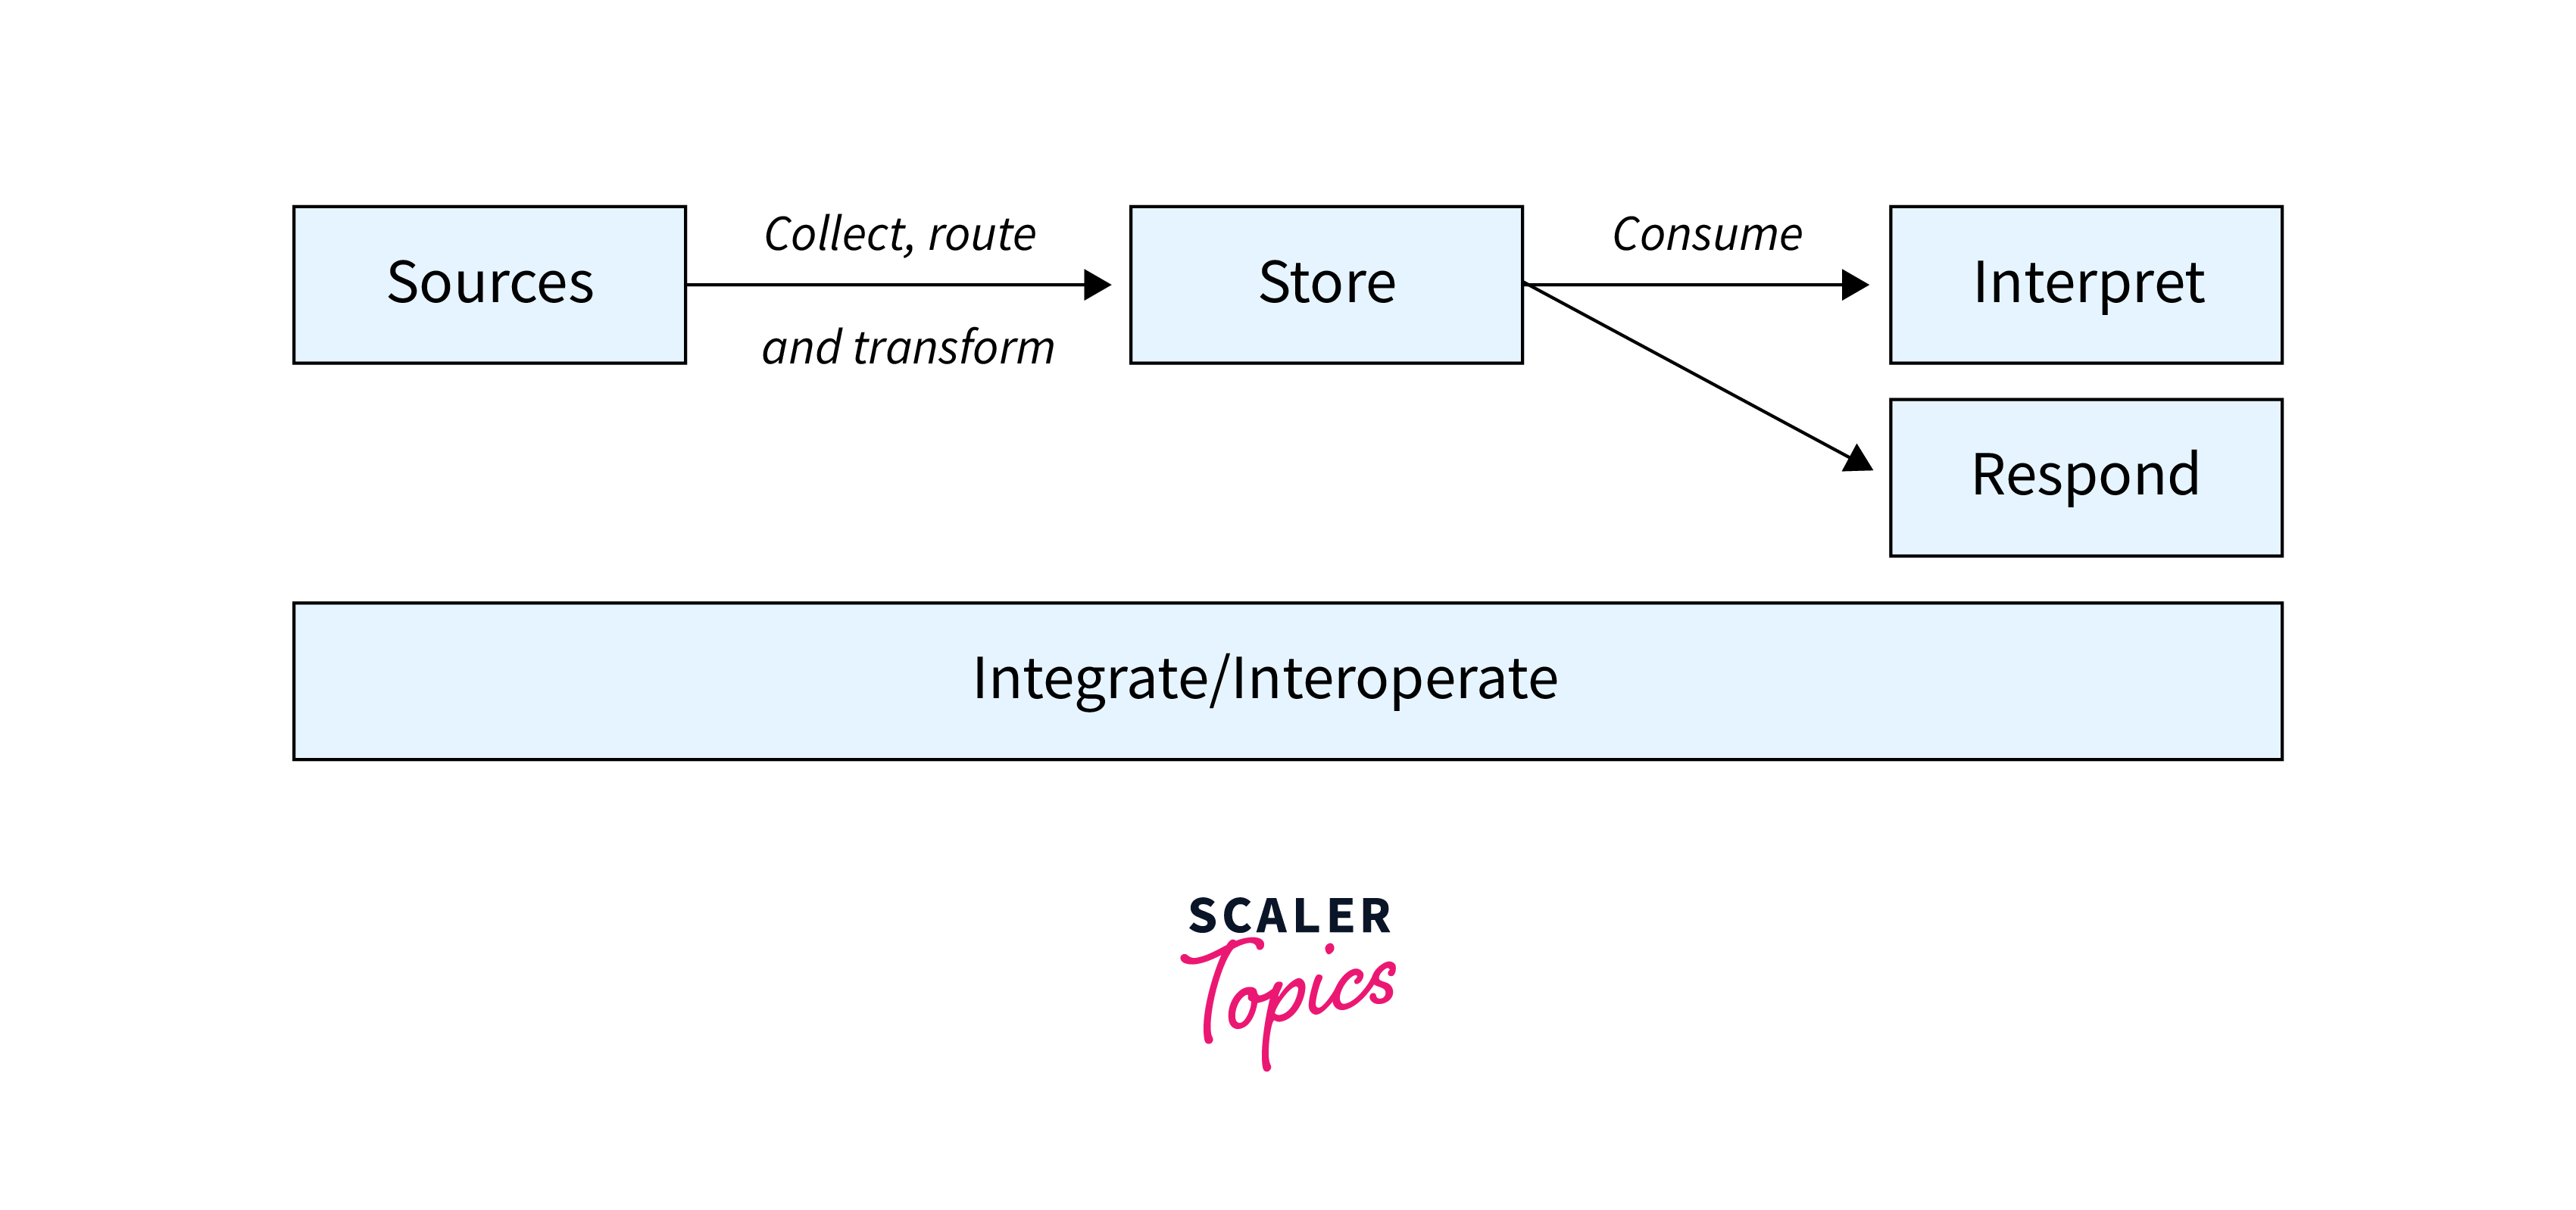
- Data Collection:
Azure Monitor collects monitoring data from various sources, including metrics, logs, and traces. It leverages agents, APIs, SDKs, and diagnostic extensions to gather the required data from Azure resources and applications. - Data Storage:
The collected monitoring data is stored in a centralized repository, allowing users to access and analyze it. Azure Monitor utilizes services like Azure Log Analytics and Azure Data Explorer for efficient data storage and retrieval. - Data Analysis:
Azure Monitor provides powerful querying capabilities using the Kusto Query Language (KQL). Users can perform ad-hoc queries, filtering, aggregation, and correlation of the monitoring data to gain insights and identify patterns or anomalies. - Action and Remediation:
Azure Monitor enables automated actions and remediation through integrations with Azure Logic Apps and Azure Functions. Users can define predefined tasks or runbooks to be executed automatically in response to specific alerts or conditions. This helps streamline incident response and automate remediation processes, reducing mean time to resolution (MTTR) and improving operational efficiency.
Monitoring Data:
 Azure Monitor collects various types of monitoring data to provide comprehensive insights into Azure resources and applications. The types of data collected include:
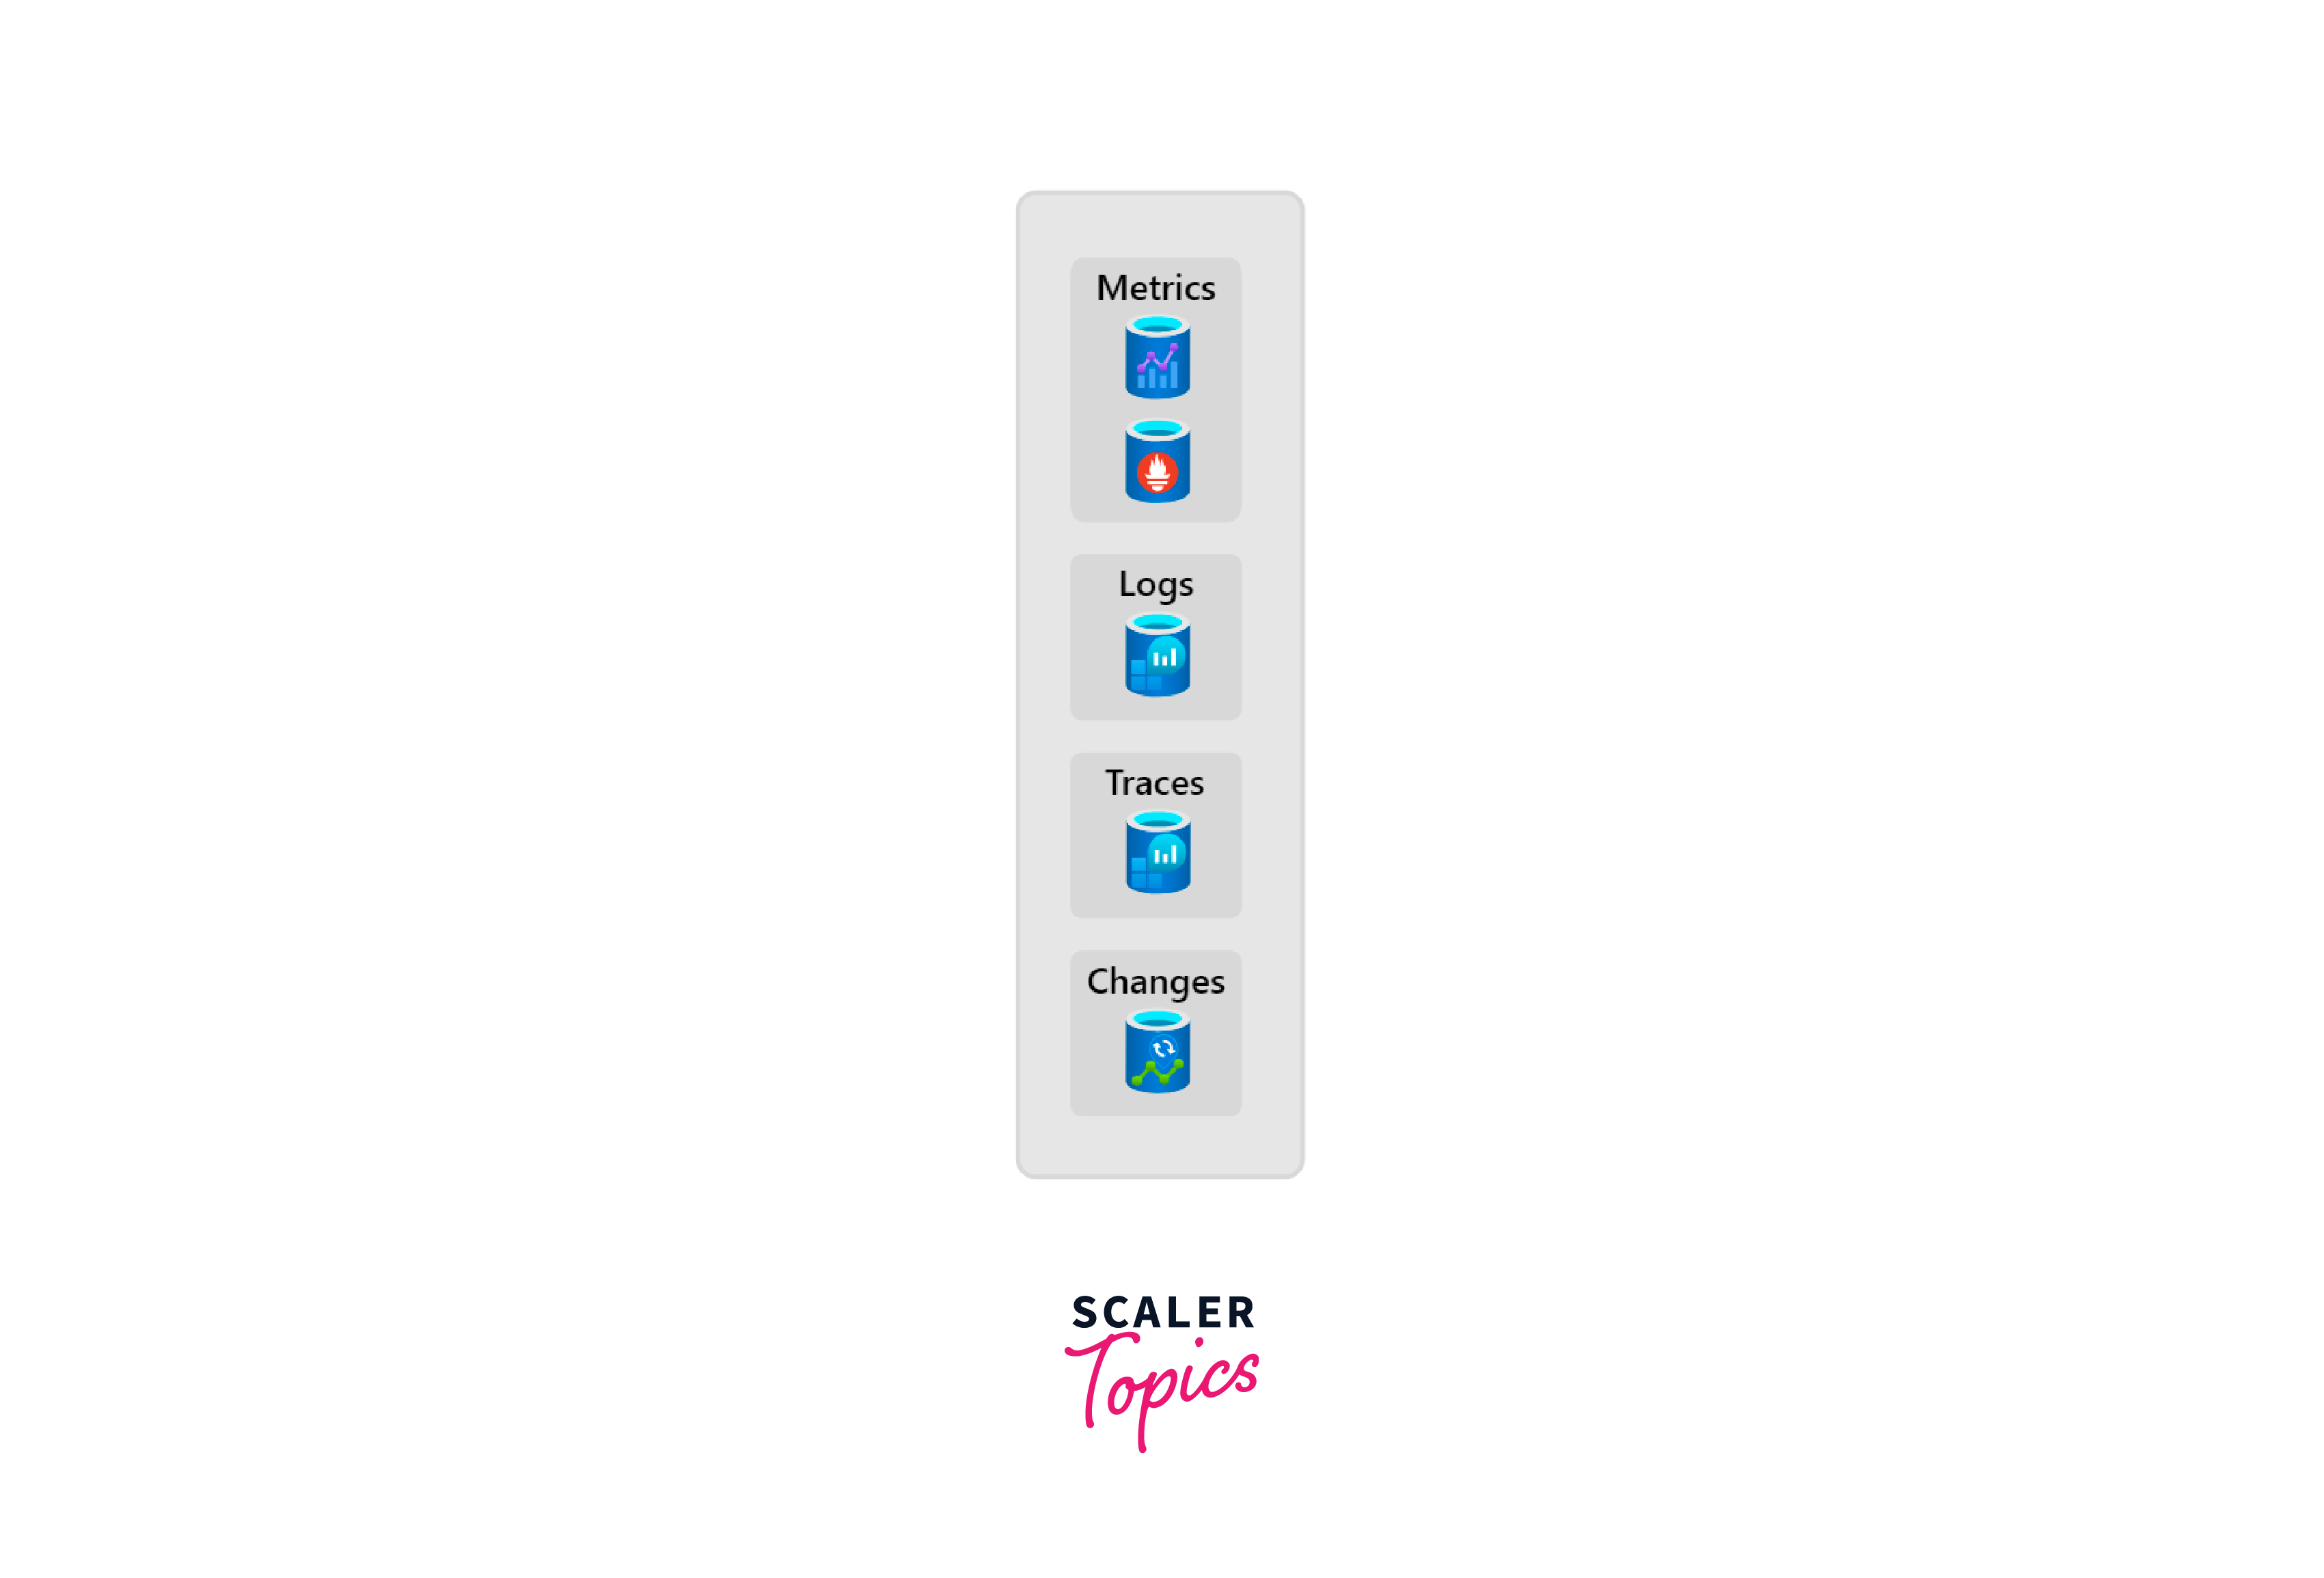
- Metrics:
Azure Monitor collects performance data in the form of metrics. These metrics can include CPU usage, memory utilization, network throughput, disk I/O, and other resource-specific indicators. Azure Monitor retrieves these metrics at regular intervals, providing real-time insights into the health and performance of Azure resources. - Logs:
Azure Monitor collects logs from different Azure services and applications. These logs contain valuable information about system events, application events, security-related activities, and more. Examples of logs include application logs, system logs, diagnostic logs, and audit logs. Azure Monitor stores and analyzes these logs, enabling users to search, query, and gain insights from the log data. - Traces:
Azure Monitor supports distributed tracing and application performance monitoring through integration with Azure Application Insights. Application Insights allows developers to instrument their applications with an SDK to capture detailed telemetry data about application requests, dependencies, exceptions, and custom events. These traces provide insights into the behavior and performance of applications, facilitating troubleshooting and optimization.
What Data does It Collect?
- Applications:
Azure Monitor can collect data from applications hosted on Azure or on-premises. This includes application performance metrics such as response time, throughput, and error rates. It can also capture application-specific logs and traces, providing insights into application behavior, request processing, and dependencies. - Azure Services:
Azure Monitor can gather data from a wide range of Azure services, including virtual machines, databases (such as Azure SQL Database and Azure Cosmos DB), storage accounts, containers (Azure Kubernetes Service), and serverless offerings (Azure Functions). It collects performance metrics specific to each service, such as CPU usage, memory utilization, storage throughput, and database query performance. - Operating Systems:
Azure Monitor can collect operating system-level data from virtual machines and physical servers. This includes metrics like CPU usage, memory utilization, disk performance, and network statistics. It also captures operating system logs, including events, errors, and security-related information, providing insights into the health and performance of the underlying infrastructure. - Azure Resource Offerings:
Azure Monitor can collect data specific to its resource offerings, such as Azure Monitor for Virtual Machines, Azure Monitor for Containers, and Azure Monitor for Azure Kubernetes Service (AKS). These offerings provide specialized insights into performance, logs, and diagnostics for the respective resources, offering deeper visibility and troubleshooting capabilities.
High-Level Architecture
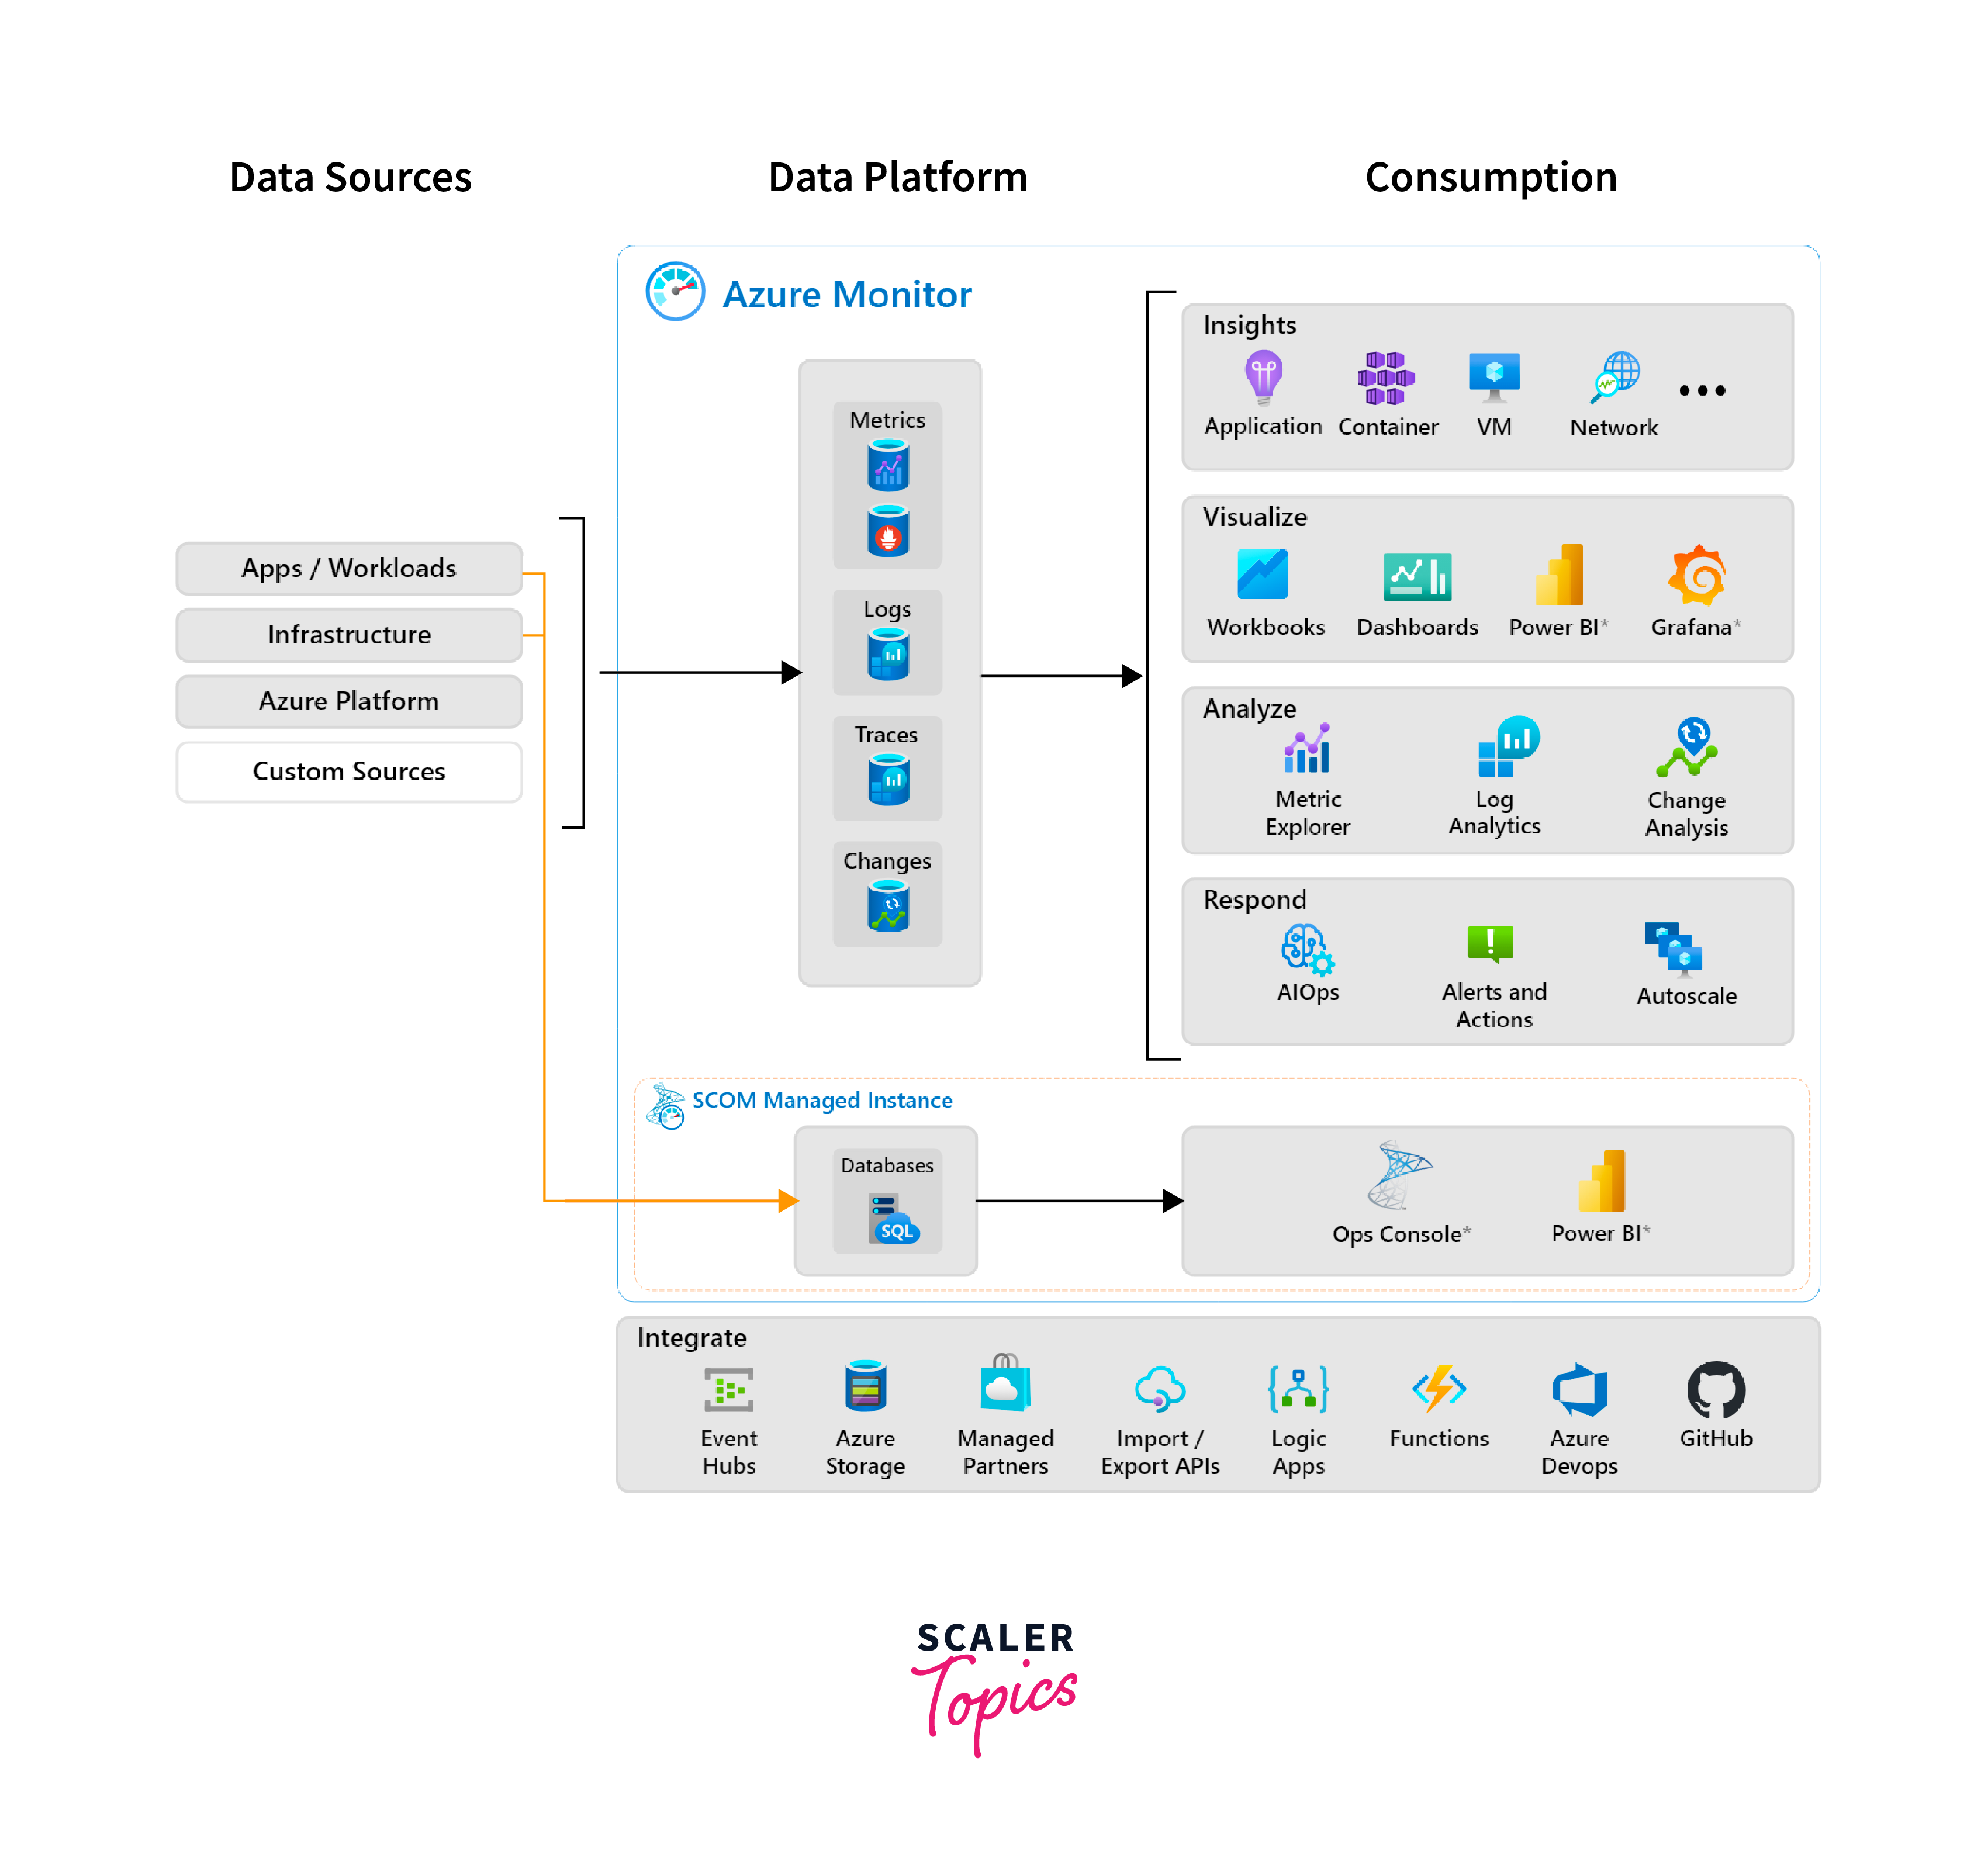
The high-level architecture of Azure Monitor encompasses various components that work together to provide comprehensive monitoring capabilities for Azure resources and applications. Here's an overview of the key components:
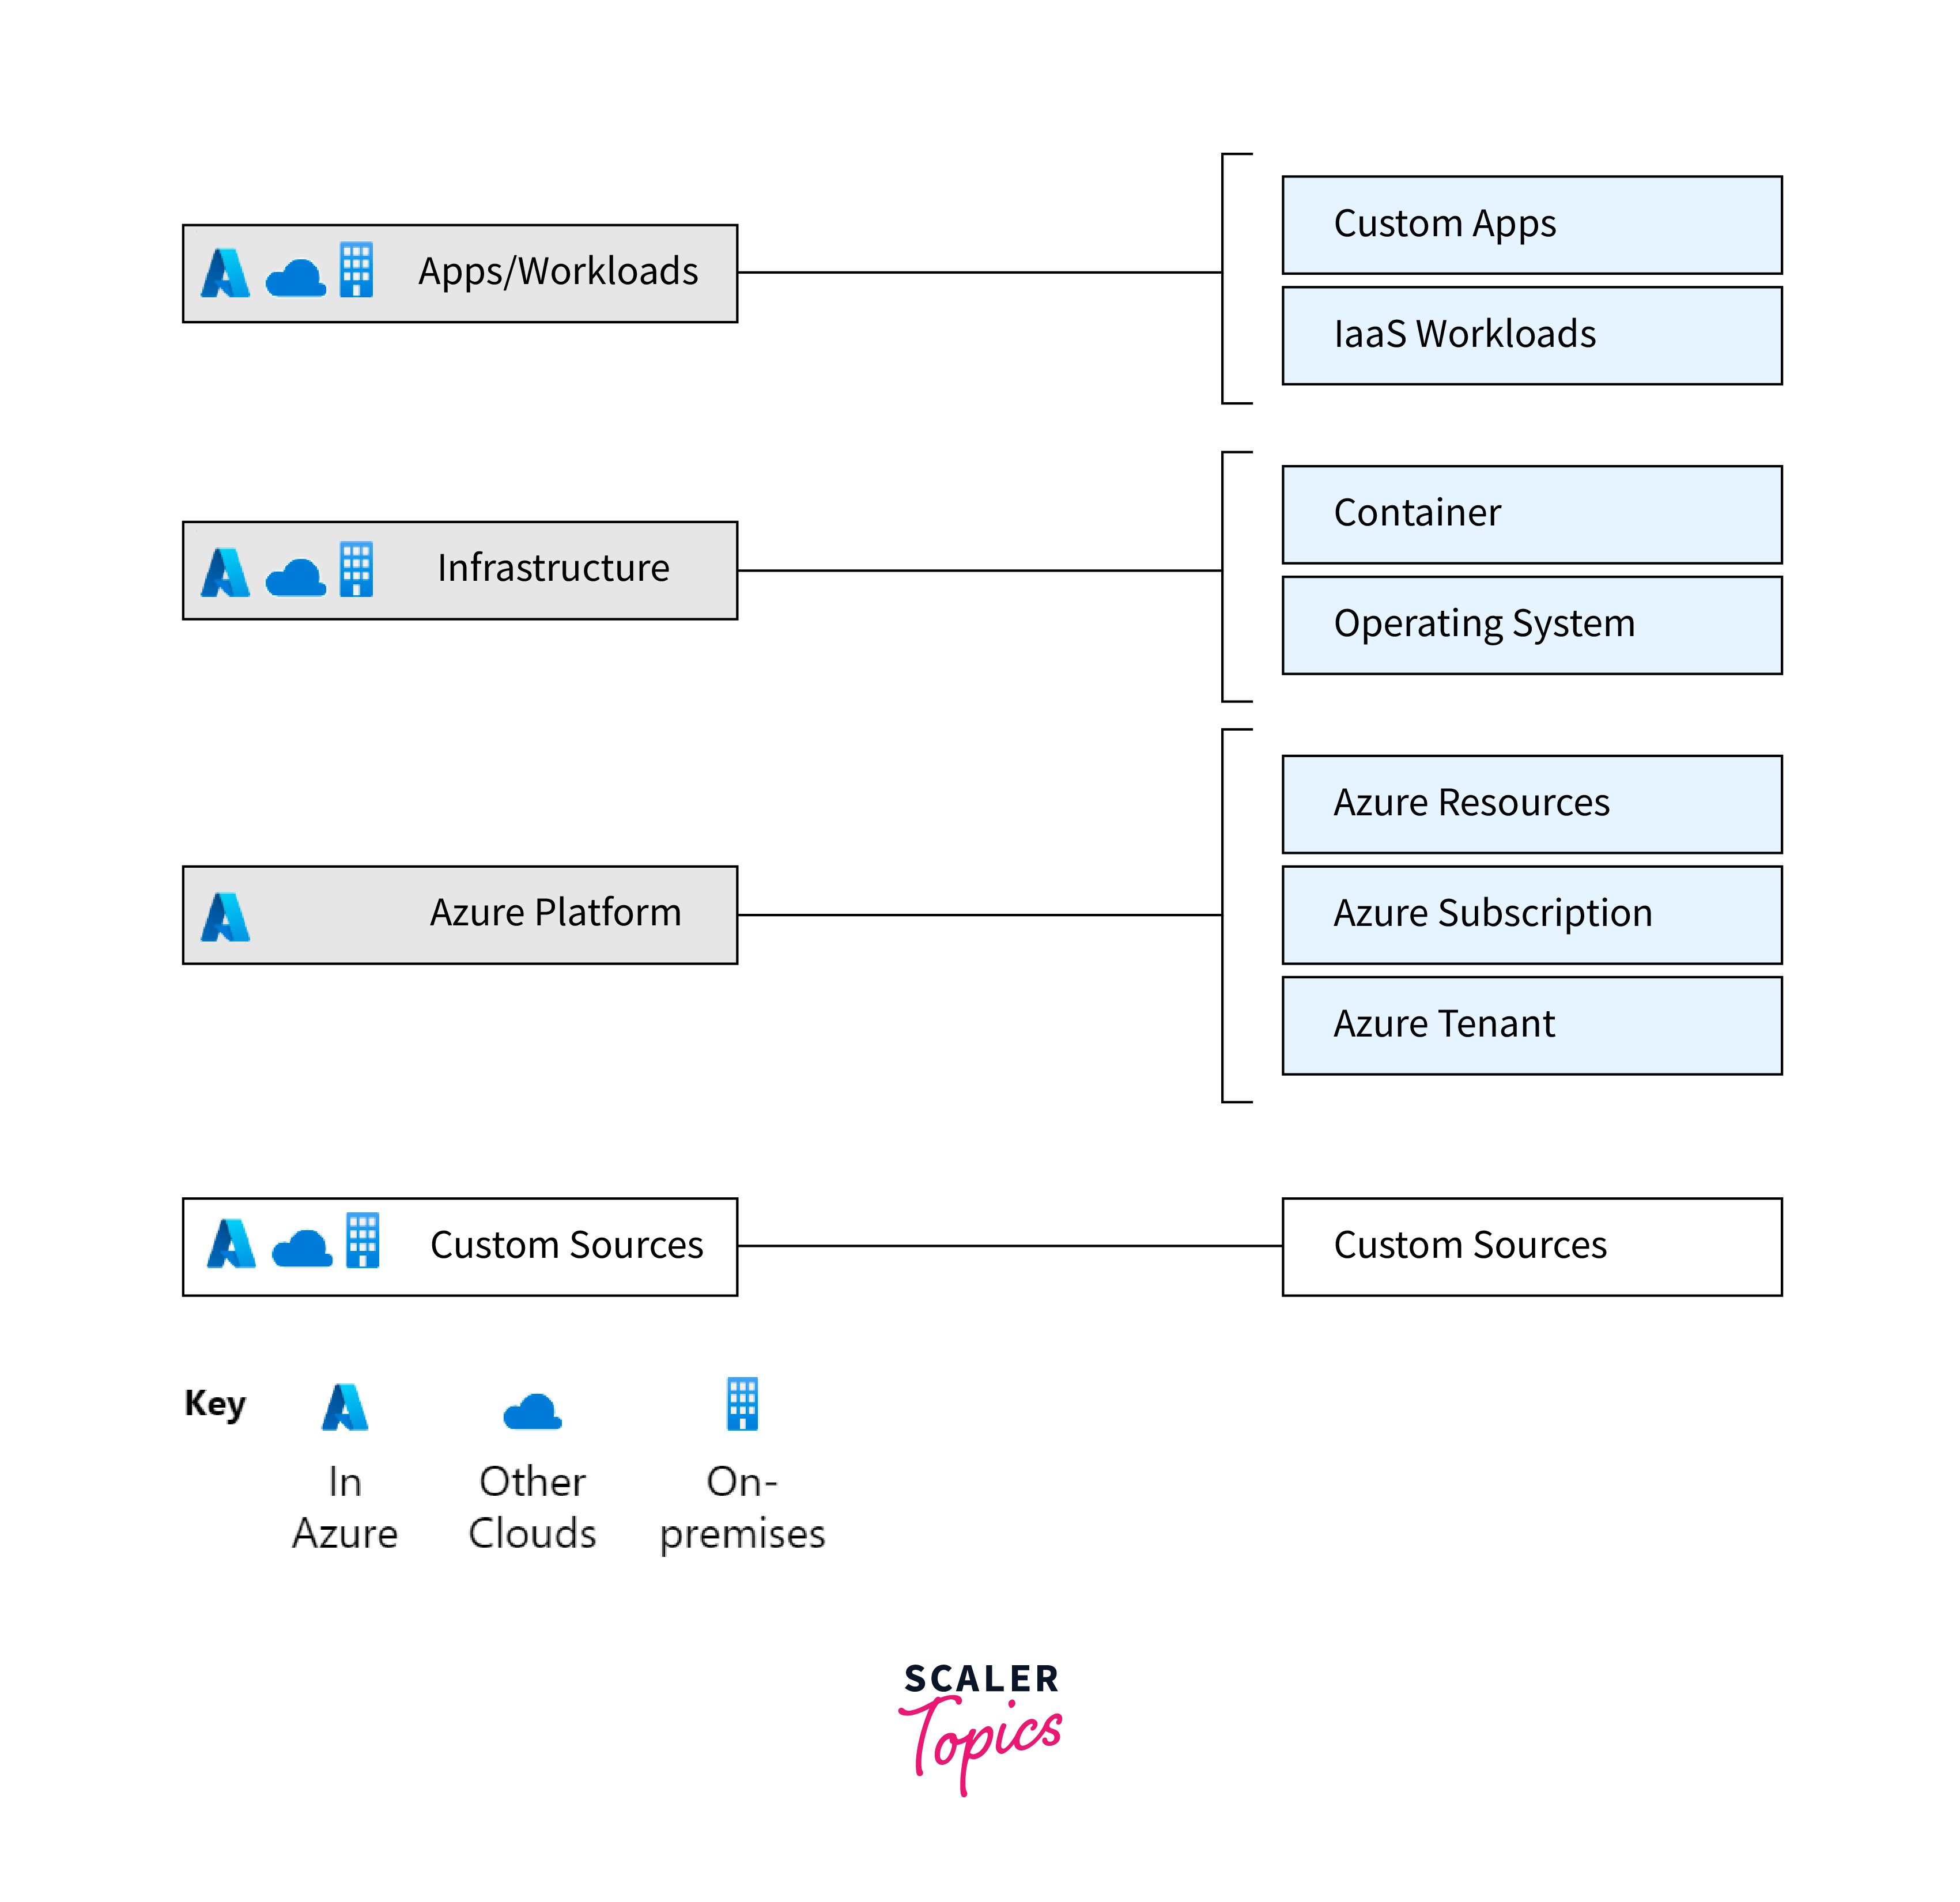
- Data Sources:
Azure Monitor collects monitoring data from various sources, including applications, Azure services, operating systems, and Azure resource offerings. These data sources generate metrics, logs, and traces that provide insights into the behavior, performance, and health of the monitored resources. - Collection Agents:
Azure Monitor utilizes agents to collect data from different sources. These agents can be installed on virtual machines, or containers, or integrated with applications using SDKs. The agents retrieve metrics, logs, and traces and transmit the data to Azure Monitor for further processing and analysis. - Data Ingestion:
The collected monitoring data is ingested into Azure Monitor, where it is stored and processed. Azure Monitor leverages services like Azure Log Analytics and Azure Data Explorer to handle large volumes of data and provide efficient storage and retrieval capabilities. - Analytics and Querying:
Azure Monitor offers powerful analytics and querying capabilities using the Kusto Query Language (KQL). Users can perform ad-hoc queries, filtering, aggregation, and correlation of monitoring data to gain insights and identify patterns or anomalies. They can analyze the data, create custom reports, and generate visualizations to monitor the health and performance of Azure resources. - Alerting and Notifications:
Azure Monitor supports alerting mechanisms, allowing users to define alert rules based on specific thresholds or conditions. When an alert is triggered, Azure Monitor sends notifications to users via various channels such as email, SMS, Azure Functions, or Azure Logic Apps. This enables proactive monitoring, timely detection of issues, and efficient incident response.
Insights in Azure Monitor
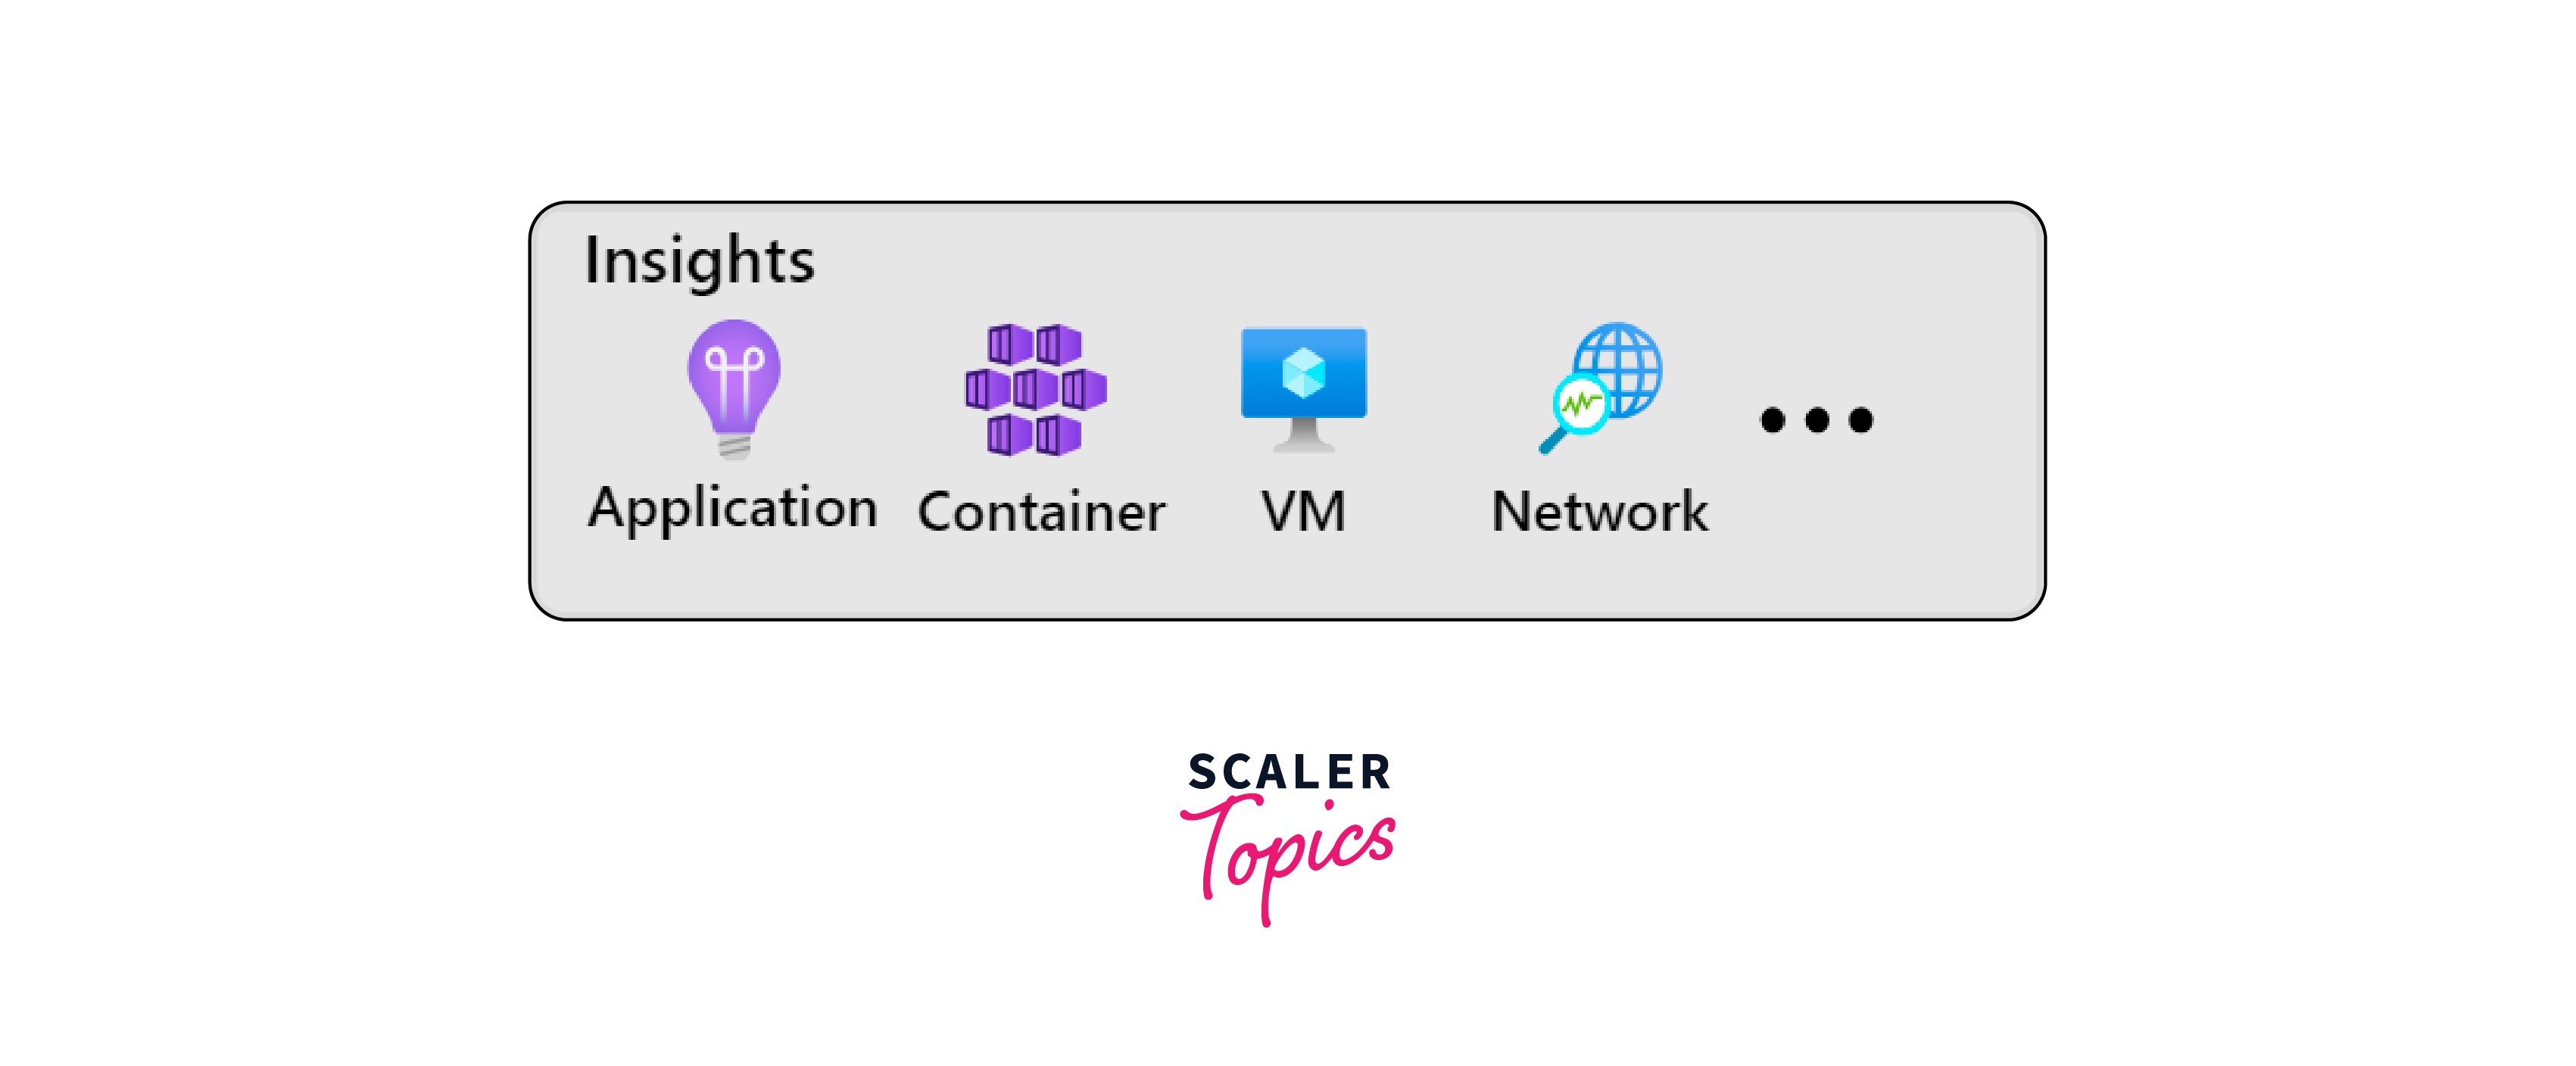
- Performance Metrics:
Azure Monitor collects and analyzes performance metrics from various Azure resources, including virtual machines, databases, storage accounts, and application services. These metrics provide visibility into resource utilization, response times, throughput, and other performance indicators. Users can monitor these metrics in real-time, track historical trends, and set thresholds for proactive alerting. This helps identify performance bottlenecks, optimize resource allocation, and ensure efficient operation of Azure resources. - Log Analytics:
Azure Monitor provides a centralized log repository with Azure Log Analytics. It collects and analyzes logs from various Azure services, applications, and operating systems. Users can search, query, and correlate log data to identify system events, errors, security incidents, and operational insights. Log Analytics offers powerful querying capabilities using Kusto Query Language (KQL), allowing users to extract valuable insights and gain deep visibility into system behavior. - Diagnostic Insights:
Azure Monitor offers diagnostic insights into Azure services and resource offerings. For example, Azure Monitor for Virtual Machines provides detailed insights into VM performance, including disk latency, network issues, and CPU throttling. Azure Monitor for Containers offers visibility into container health, orchestrator metrics, and resource utilization. These diagnostic insights enable efficient troubleshooting and optimization of specific Azure resources. - Proactive Alerting:
Azure Monitor allows users to define alert rules based on specific conditions or thresholds. When these conditions are met, Azure Monitor triggers alerts and sends notifications to relevant stakeholders. This proactive alerting mechanism enables early detection of issues, enabling timely response and minimizing the impact of potential service disruptions.
Visualization of Monitored Data
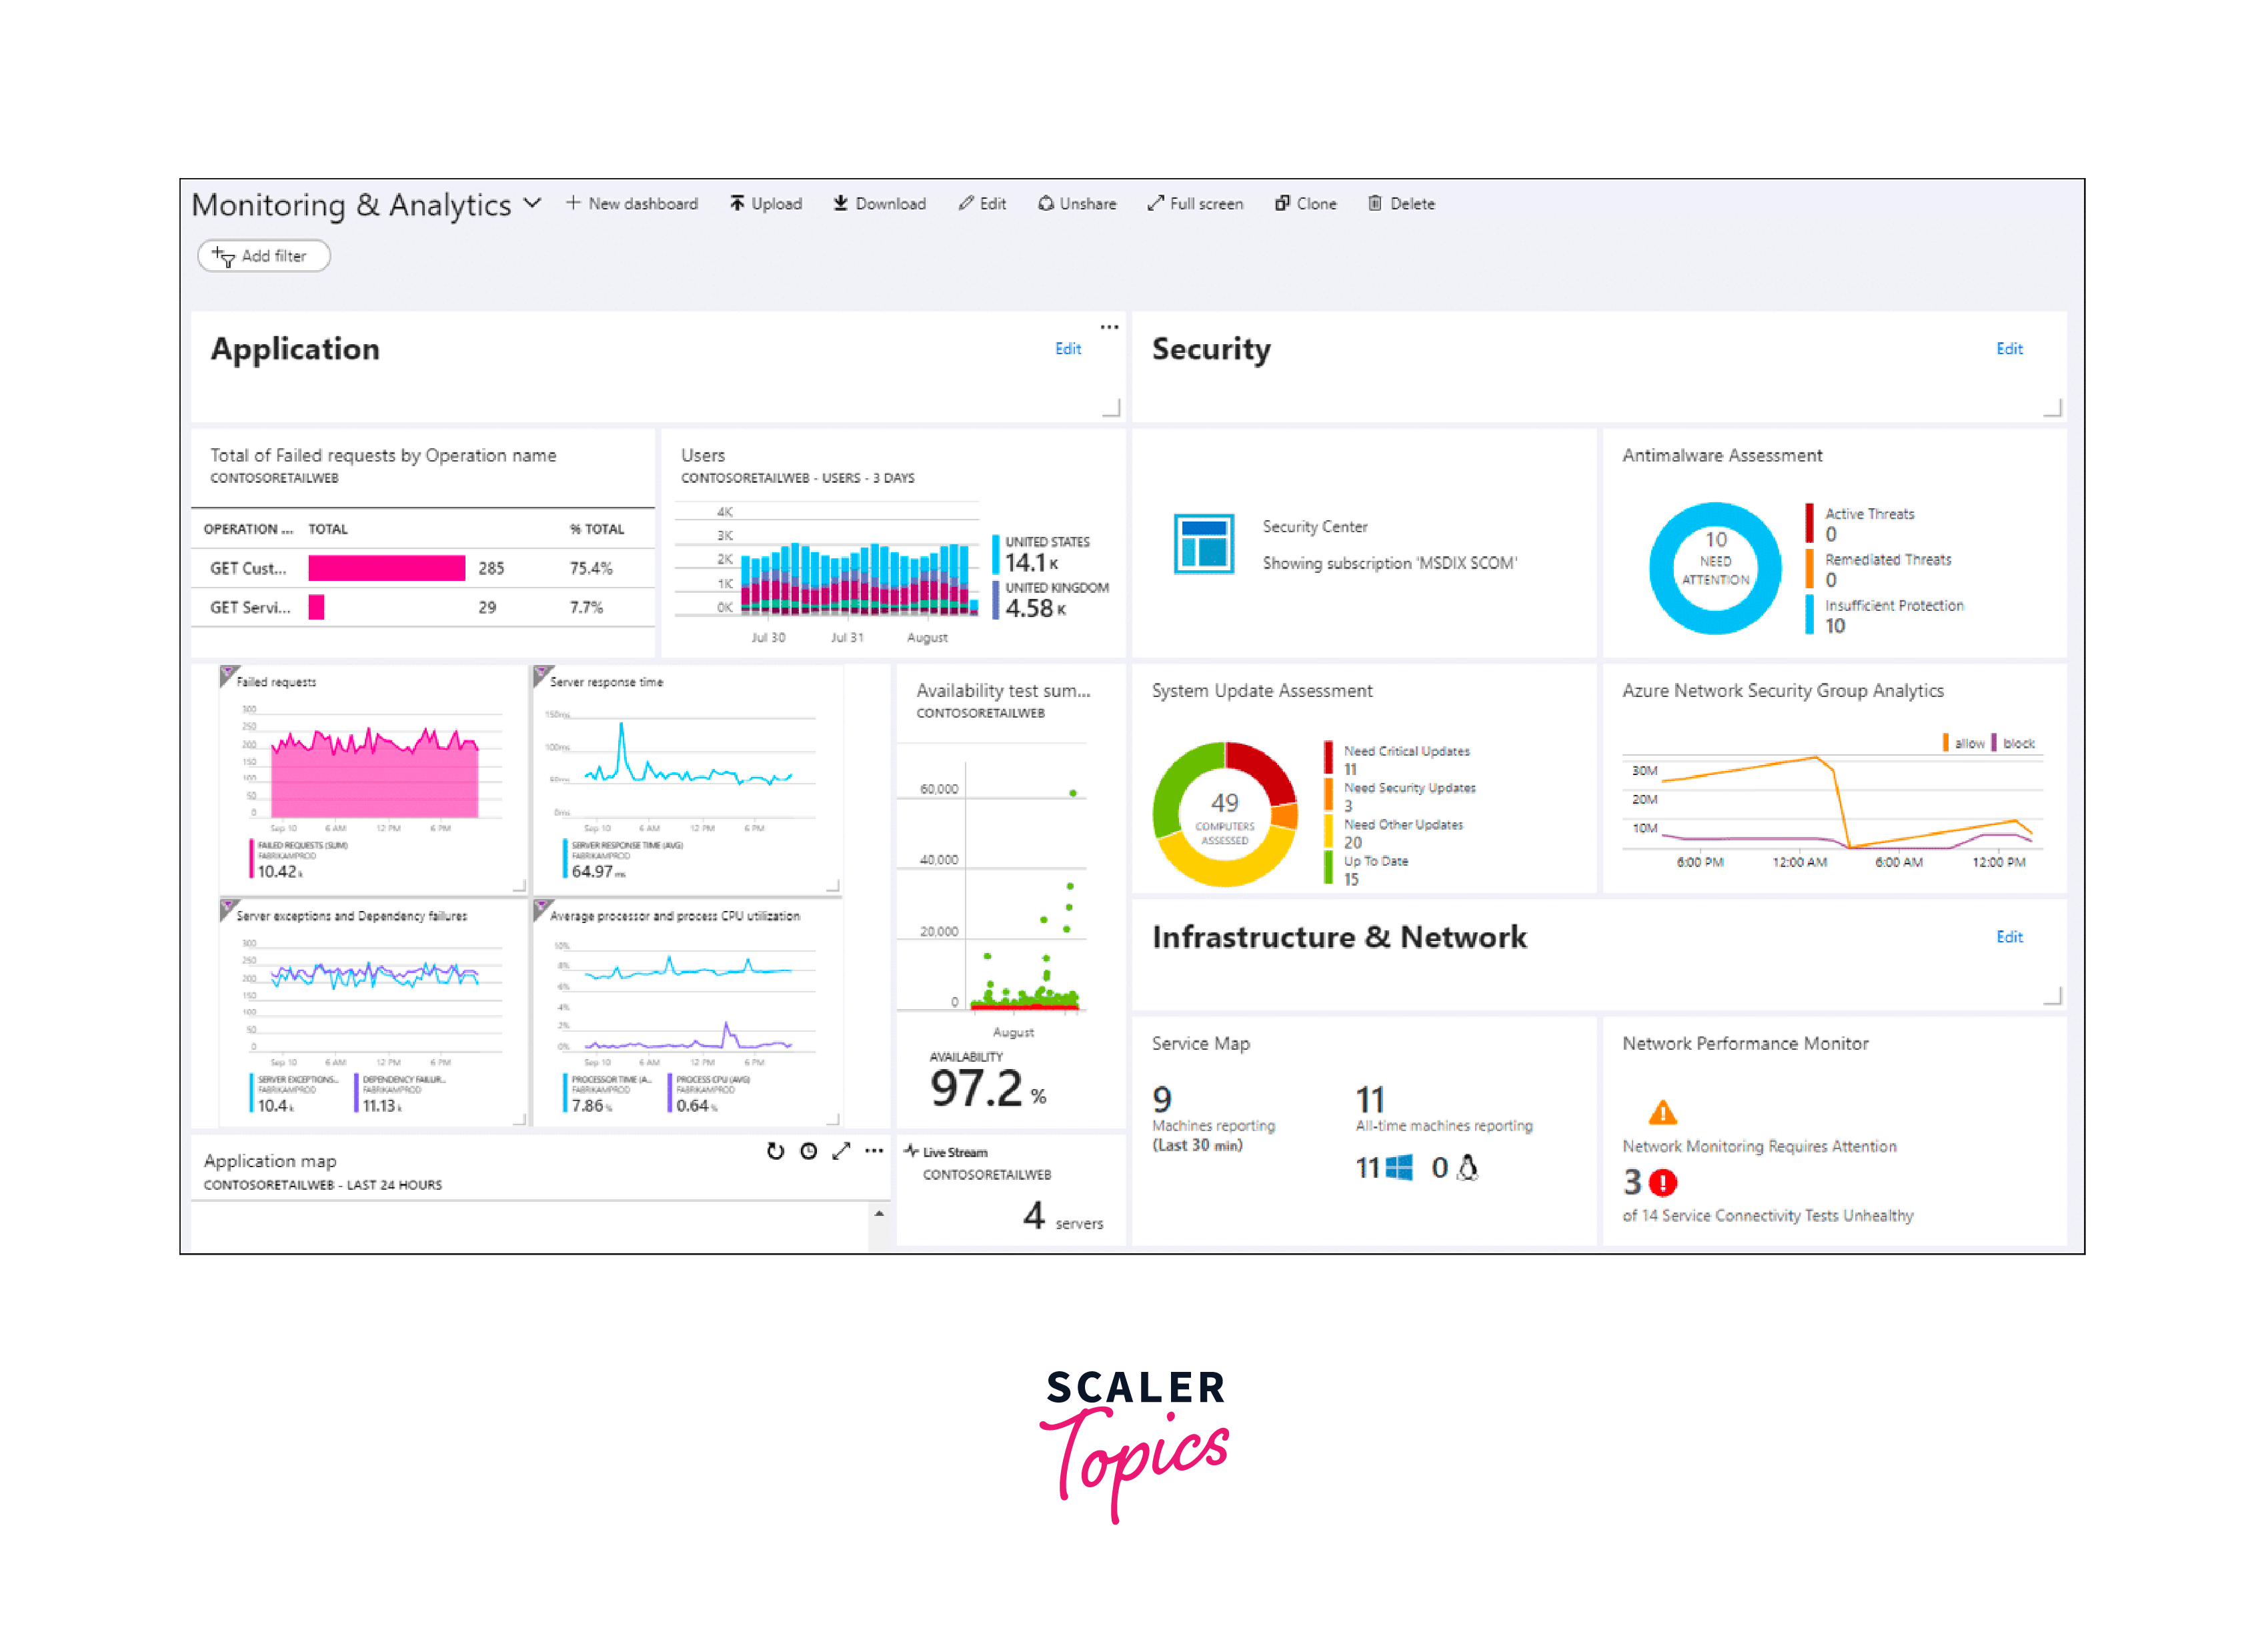
- Customizable Dashboards:
Azure Monitor allows users to create customized dashboards that provide a consolidated view of their monitored data. Users can select specific metrics, logs, or traces of interest and arrange them on the dashboard in a visually appealing manner. This enables users to have a personalized, at-a-glance view of the most important aspects of their Azure environment. - Interactive Charts and Reports:
Azure Monitor provides a range of interactive charting options to visualize monitoring data. Users can create line charts, bar charts, area charts, and more to represent trends, performance metrics, and resource utilization. These charts can be customized with different colors, scales, and time intervals. Additionally, users can generate reports that summarize key metrics and insights for sharing with stakeholders. - Time Series Analysis:
Azure Monitor allows users to perform time series analysis on the collected monitoring data. By visualizing the data over time, users can identify patterns, anomalies, and seasonal trends. This helps in understanding the historical performance of Azure resources, detecting performance degradation or spikes, and planning for capacity optimization. - Heatmaps and Heat Charts:
Azure Monitor supports heatmaps and heat charts for visualizing data with multiple dimensions. Users can represent metrics across different resource instances or periods using color gradients. Heatmaps provide a quick overview of resource performance and enable users to identify hotspots or areas that require attention. - Geospatial Visualization:
For monitoring distributed applications or resources with geographical diversity, Azure Monitor supports geospatial visualization. Users can map the monitored data onto a geographical representation, providing insights into resource distribution, performance variations across regions, and potential bottlenecks.
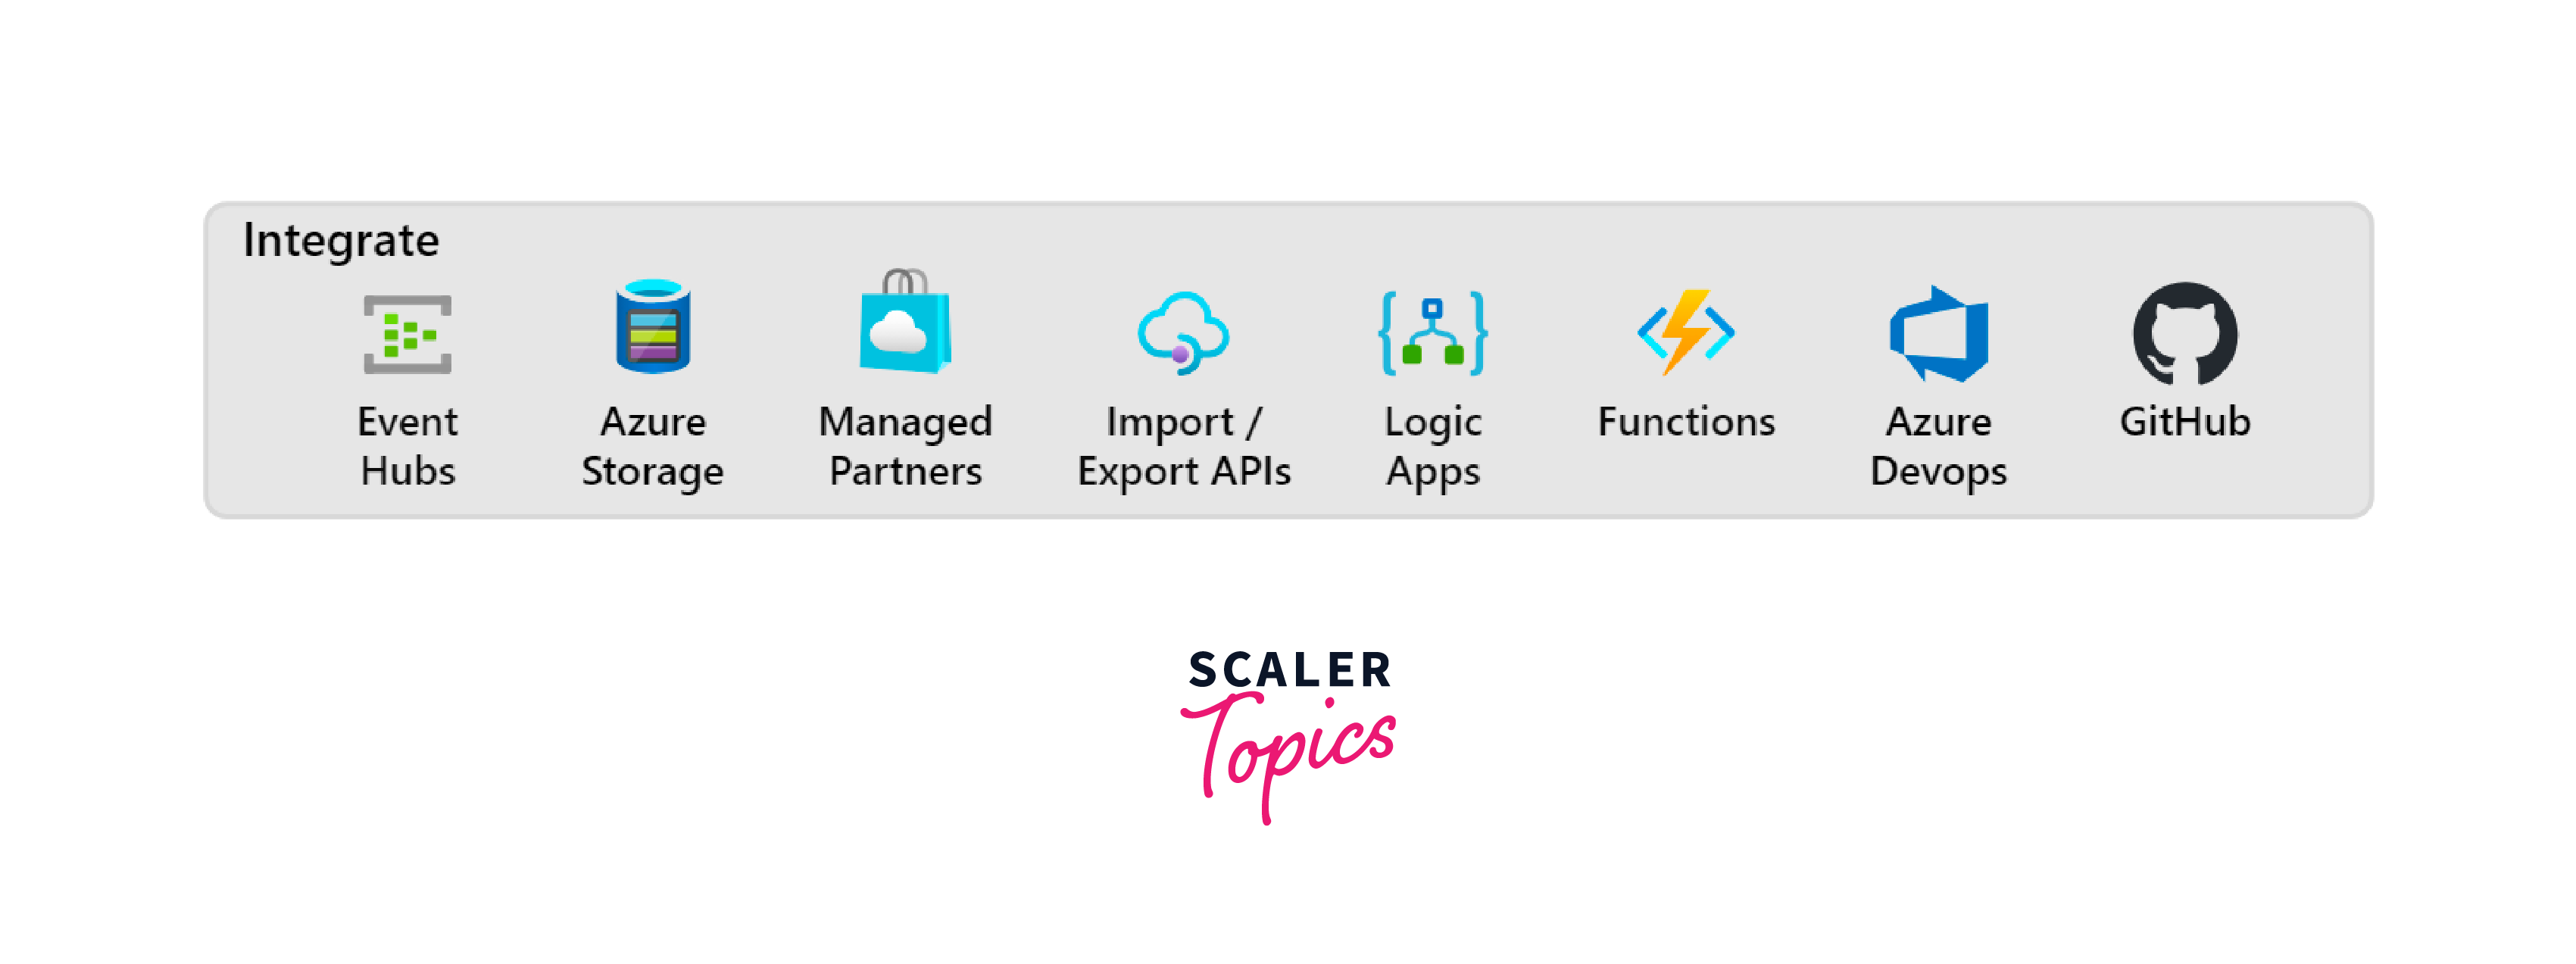
Response and Integration
- Alerting and Notifications:
Azure Monitor provides a robust alerting mechanism that allows users to define alert rules based on specific conditions or thresholds. When these conditions are met, Azure Monitor triggers alerts and sends notifications to designated stakeholders. Users can receive notifications through various channels such as email, SMS, Azure Functions, or Azure Logic Apps. This enables timely response and efficient incident management, helping to mitigate potential service disruptions. - Automated Actions and Remediation:
Azure Monitor supports automated actions and remediation through integration with Azure Logic Apps and Azure Functions. Users can define predefined tasks or runbooks that are executed automatically in response to specific alerts or conditions. This automation streamlines incident response and remediation processes, reducing mean time to resolution (MTTR) and enhancing operational efficiency. - Integration with Azure Services:
Azure Monitor seamlessly integrates with various Azure services, allowing users to extend its capabilities. For example, it integrates with Azure Security Center for security monitoring, Azure Sentinel for threat detection and response, and Azure DevOps for monitoring in a DevOps context. These integrations enable end-to-end monitoring and management of Azure resources and applications, facilitating comprehensive insights and streamlined workflows. - REST APIs and SDKs:
Azure Monitor provides REST APIs and SDKs that enable programmatic access to monitoring data and functionality. Users can leverage these APIs and SDKs to integrate Azure Monitor with custom applications, automate monitoring tasks, and build custom solutions tailored to their specific requirements. This flexibility allows for seamless integration of Azure Monitor into existing workflows and systems. - Azure Monitor Workbook:
Azure Monitor includes a feature called Workbooks, which provides a customizable workspace for data analysis and visualization. Users can create interactive Workbooks that combine monitoring data with contextual information and custom queries. These Workbooks can be shared with others and integrated into Azure dashboards or external systems, providing a comprehensive view of the monitored environment.
Conclusion
- Azure Monitor enables organizations to collect, analyze, and act upon telemetry data from various Azure resources and applications.
- It provides real-time insights into the performance, availability, and health of cloud workloads.
- Azure Monitor offers customizable dashboards and visualizations for personalized monitoring views.
- It supports alerting and notification mechanisms, enabling proactive issue detection and timely response.
- Automation and remediation capabilities streamline incident response and improve operational efficiency.
- It provides powerful querying capabilities using the Kusto Query Language (KQL).
- Azure Monitor enables application performance monitoring through integration with Azure Application Insights.
- It offers seamless integration with Power BI for advanced data visualization and reporting.