Top Azure Monitoring Tools
Overview
Azure monitoring tools helps ensure the health and performance of cloud resources. Azure Monitor provides centralized monitoring and diagnostics across applications and infrastructure, while Application Insights focuses on application performance insights. Azure Log Analytics collects, analyzes, and acts on telemetry data, and Azure Security Center offers threat protection. These tools collectively enable real-time monitoring, proactive issue detection, and efficient troubleshooting in the Azure environment.
Azure Monitoring Tools
Azure Monitoring Tools are a set of powerful resources to oversee the health, performance, and security of applications, services, and infrastructure hosted on the Azure cloud platform. These tools gather data from various sources, such as virtual machines, databases, websites, and more.
Azure Monitoring tools can be divided into various categories based on the type of resource they monitor:
- Infrastructure Monitoring Tools:
- Manages and monitors the health and performance of Azure resources through metrics, logs, and alerts.
- Handles diagnostic data collection from Azure resources to aid in troubleshooting and resource optimization.
- Provides visibility into the availability and condition of Azure resources.
- Application Performance Monitoring (APM) Tools:
- Monitors web application performance, user interactions, and diagnostics to enhance user experience.
- Analyzes traffic patterns through Azure Application Gateway for efficient application delivery.
- Network Monitoring Tools:
- Offers tools to diagnose and visualize network connectivity, aiding in network management.
- Delivers real-time network monitoring and analytics in hybrid and multi-cloud environments.
- Security and Compliance Monitoring Tools:
- Manages advanced threat protection for Azure resources, providing security insights and recommendations.
- Enforces compliance and regulatory standards through resource policies.
- Business Process Monitoring Tools:
- Tracks and ensures the reliability of Azure Logic Apps execution, supporting business workflows.
- Monitors and manages data integration and ETL workflows.
- Container and Kubernetes Monitoring Tools:
- Offers insights into AKS cluster performance and health.
- Monitors performance of Azure Container Instances.
- Databases and Data Monitoring Tools:
- Monitors Azure SQL Database performance, query efficiency, and resource usage.
- Tracks performance and usage metrics of Azure Cosmos DB.
- Hybrid Cloud Monitoring Tools: Extends Azure monitoring and management capabilities to on-premises and multi-cloud environments.
- Custom Monitoring Solutions:
- Collects and analyzes log data from various sources, enabling custom queries and analysis.
- Visualizes and explores metrics data from different Azure resources.
Benefits of Azure Monitors
Azure Monitor offers several key benefits for effectively managing and optimizing your Azure environment:
- Proactive Issue Detection: Azure Monitor provides real-time insights into the performance and health of your applications and infrastructure. It helps identify issues and anomalies before they become critical problems, enabling you to take proactive measures.
- Centralized Monitoring: With a single dashboard, Azure Monitor consolidates data from various Azure services, making it easier to monitor and analyze the overall health of your resources. This centralized view enhances operational efficiency.
- Customizable Alerts: You can set up alerts based on specific conditions, such as high CPU usage or low disk space. This helps you stay informed about critical events and take timely actions to mitigate potential problems.
- Scalability Insights: Azure Monitor provides performance metrics and insights that aid in optimizing resource usage and scalability. You can identify trends and patterns to make informed decisions about resource allocation.
- Application Performance Monitoring: Integrating with Application Insights, Azure Monitor offers deep visibility into the performance of your applications. You can track user interactions, identify bottlenecks, and optimize application responsiveness.
- Diagnostic Data Collection: It collects and retains diagnostic data, including performance metrics, logs, and traces, which are essential for troubleshooting and root cause analysis when issues occur.
- Integration with DevOps: Azure Monitor seamlessly integrates with DevOps processes, enabling development and operations teams to collaborate more effectively by sharing insights and performance data.
- Insights for Infrastructure: Azure Monitor provides insights into the health and performance of your infrastructure, including virtual machines, databases, and networking components. This helps ensure the reliability and availability of your services.
- Cost Optimization: By analyzing usage patterns and performance data, Azure Monitor helps you identify opportunities to optimize resource allocation and reduce unnecessary costs.
List of Azure Monitoring Tools
Azure offers a range of monitoring tools to help you monitor and manage your resources effectively. Here are some of the key monitoring tools used in Azure:
- Serverless360:
- Serverless App Monitoring
- Streamlines complex serverless app management with precise monitoring and alerts.
- Site24x7:
- Website & App Monitoring
- Guarantees smooth user experiences by real-time monitoring of websites and apps.
- M365 Manager Plus:
- Microsoft 365 Management
- Simplifies Microsoft 365 service management and reporting.
- Better Stack:
- Azure Resource Monitoring
- Provides real-time Azure resource insights for optimized utilization.
- Application Insights:
- Web App Performance
- Enhances web app performance by identifying and resolving bottlenecks.
- Azure Monitor:
- Comprehensive Monitoring Solution
- Simplifies Azure resource management through comprehensive monitoring.
- Service Bus Explorer:
- Service Bus Management
- Ensures dependable communication by managing and monitoring Service Bus messaging.
- Cerebrata:
- Azure Resource Tools
- Offers a suite of tools for efficient Azure resource management and monitoring.
- CloudMonix:
- Cloud Monitoring & Automation
- Optimizes cloud resource usage via automated monitoring and response.
- Datadog:
- Cloud-Scale Monitoring
- Ensures cloud app and infrastructure stability through scalable monitoring.
- Dynatrace:
- App Performance Insights
- Improves app performance swiftly by delivering actionable insights.
- Log Analytics:
- Log Data Analysis
- Speeds up issue resolution and performance enhancement by analyzing log data.
- New Relic:
- App Performance Monitoring
- Elevates app quality by monitoring performance, user experience, and infrastructure.
- Nodinite:
- Business Process Monitoring
- Manages and monitors business processes, ensuring seamless operations.
- Splunk:
- Data Analytics Platform
- Gains valuable insights and operational efficiency by analyzing diverse data sources.
Comparison of Best Azure Monitors
Let's compare some of the best Azure Monitoring tools.
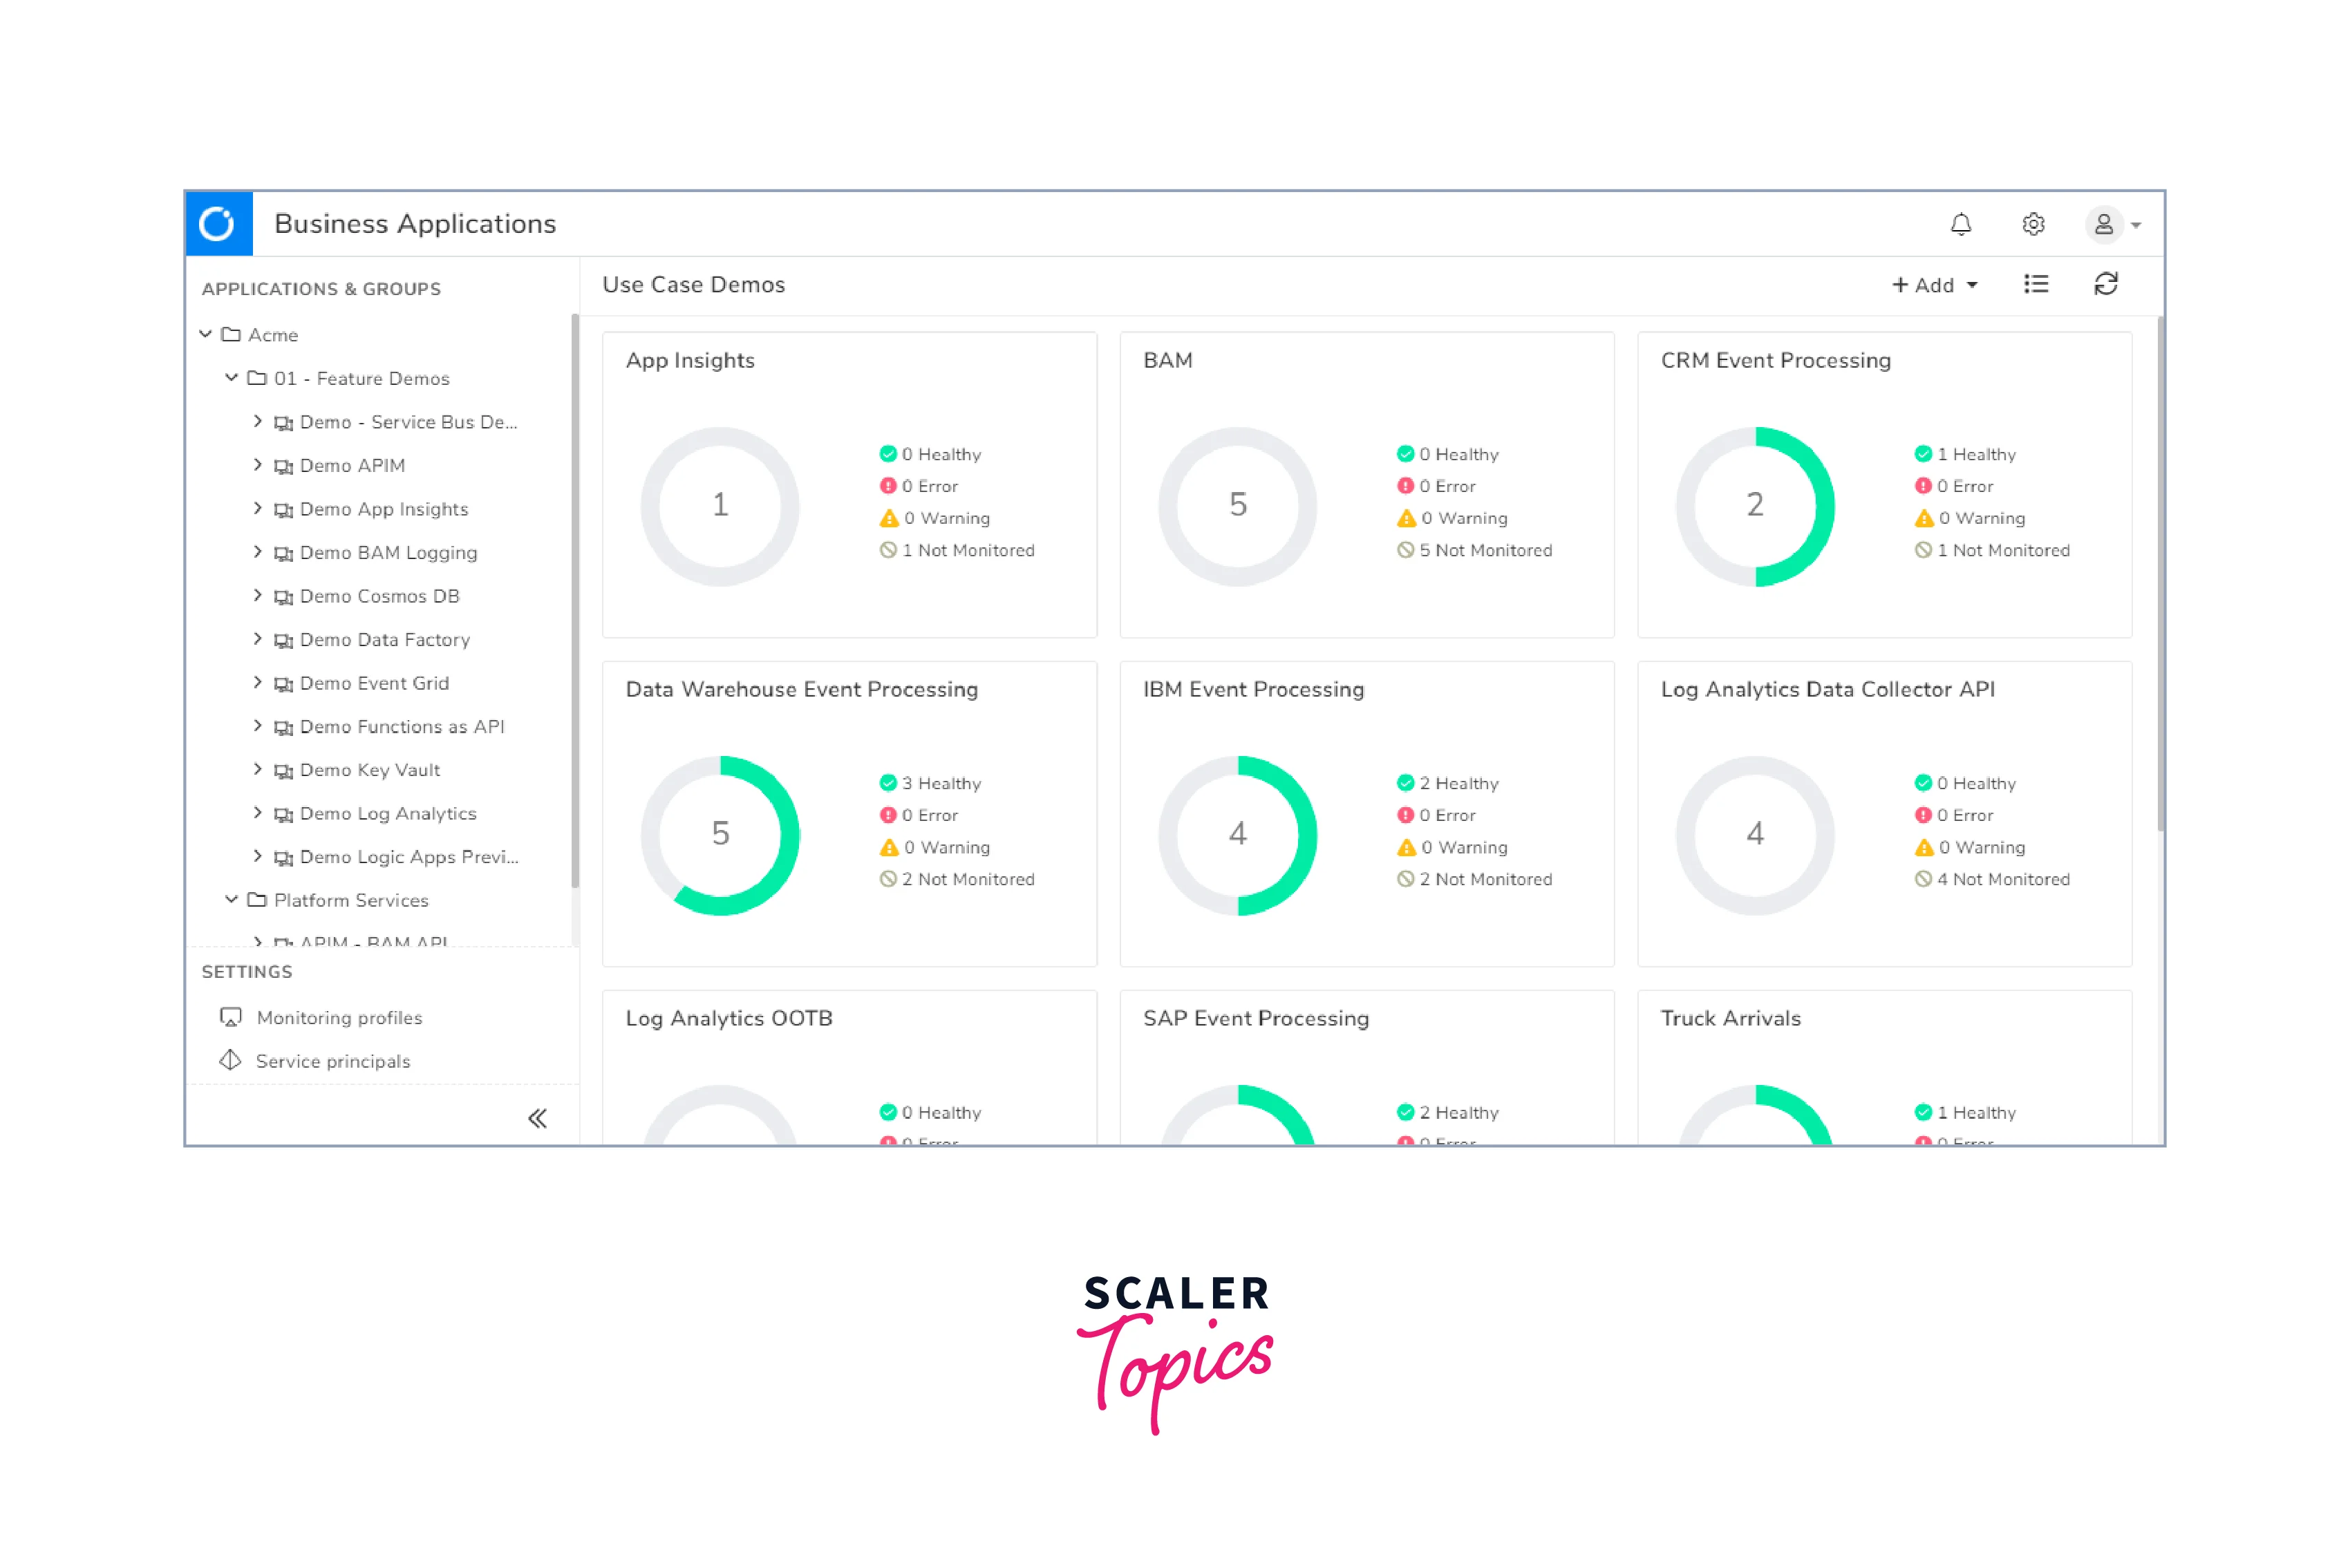
Serverless360 (Best Overall)
Serverless360 is a platform designed to provide monitoring, management, and governance capabilities for applications built on serverless architectures, such as those using Microsoft Azure Functions, AWS Lambda, or Google Cloud Functions. It aims to address the challenges that come with managing complex serverless applications by offering tools to streamline operations, ensure reliability, and enhance visibility into the various components of a serverless application.
Features
Key features of Serverless360 include:
- Monitoring and Alerts: Serverless360 allows users to monitor the health, performance, and behavior of serverless functions and other components. It provides customizable alerting mechanisms to notify users about critical issues.
- End-to-End Visibility: The platform offers a consolidated view of different serverless resources and their interactions. This can ``help in understanding the flow of data and requests across the application.
- Troubleshooting and Debugging: Serverless360 provide tools to analyze and troubleshoot issues in serverless applications. It can help in identifying bottlenecks, errors, and performance problems.
- Security and Governance: The platform include features to enforce security policies and governance rules on serverless resources. This could involve managing access control, compliance, and data protection.
- Analytics and Reporting: The platform could provide analytics and reporting features, allowing users to gain insights into application usage, performance trends, and other relevant metrics.
Site24x7
Site24x7 is a cloud-based monitoring and management platform designed to help businesses monitor the performance, availability, and user experience of their websites, applications, servers, networks, and cloud infrastructure. Site24x7 offers a comprehensive suite of monitoring tools and features to ensure that businesses can proactively detect and resolve performance issues before they impact end-users.
Features
Key features of Site24x7 include:
- Website Monitoring: Site24x7 can monitor the uptime and performance of websites from various locations globally. It can alert users when there are issues such as downtime, slow response times, or errors.
- Application Performance Monitoring (APM): Site24x7 provides insights into the performance of web applications and identifies bottlenecks in the application code, database queries, and external service dependencies.
- Server Monitoring: The platform can monitor physical servers, virtual servers, and cloud infrastructure. It tracks resource utilization, health, and performance metrics to help identify and troubleshoot server-related problems.
- Network Monitoring: Site24x7 monitors network devices and infrastructure components, helping to identify connectivity issues, latency, and other network-related problems.
- Cloud Monitoring: The platform offers monitoring for cloud infrastructure and services from providers such as Amazon Web Services (AWS), Microsoft Azure, Google Cloud, and more.
- User Experience Monitoring: Site24x7 can simulate user interactions with applications and websites, providing insights into the end-user experience from different geographic locations.
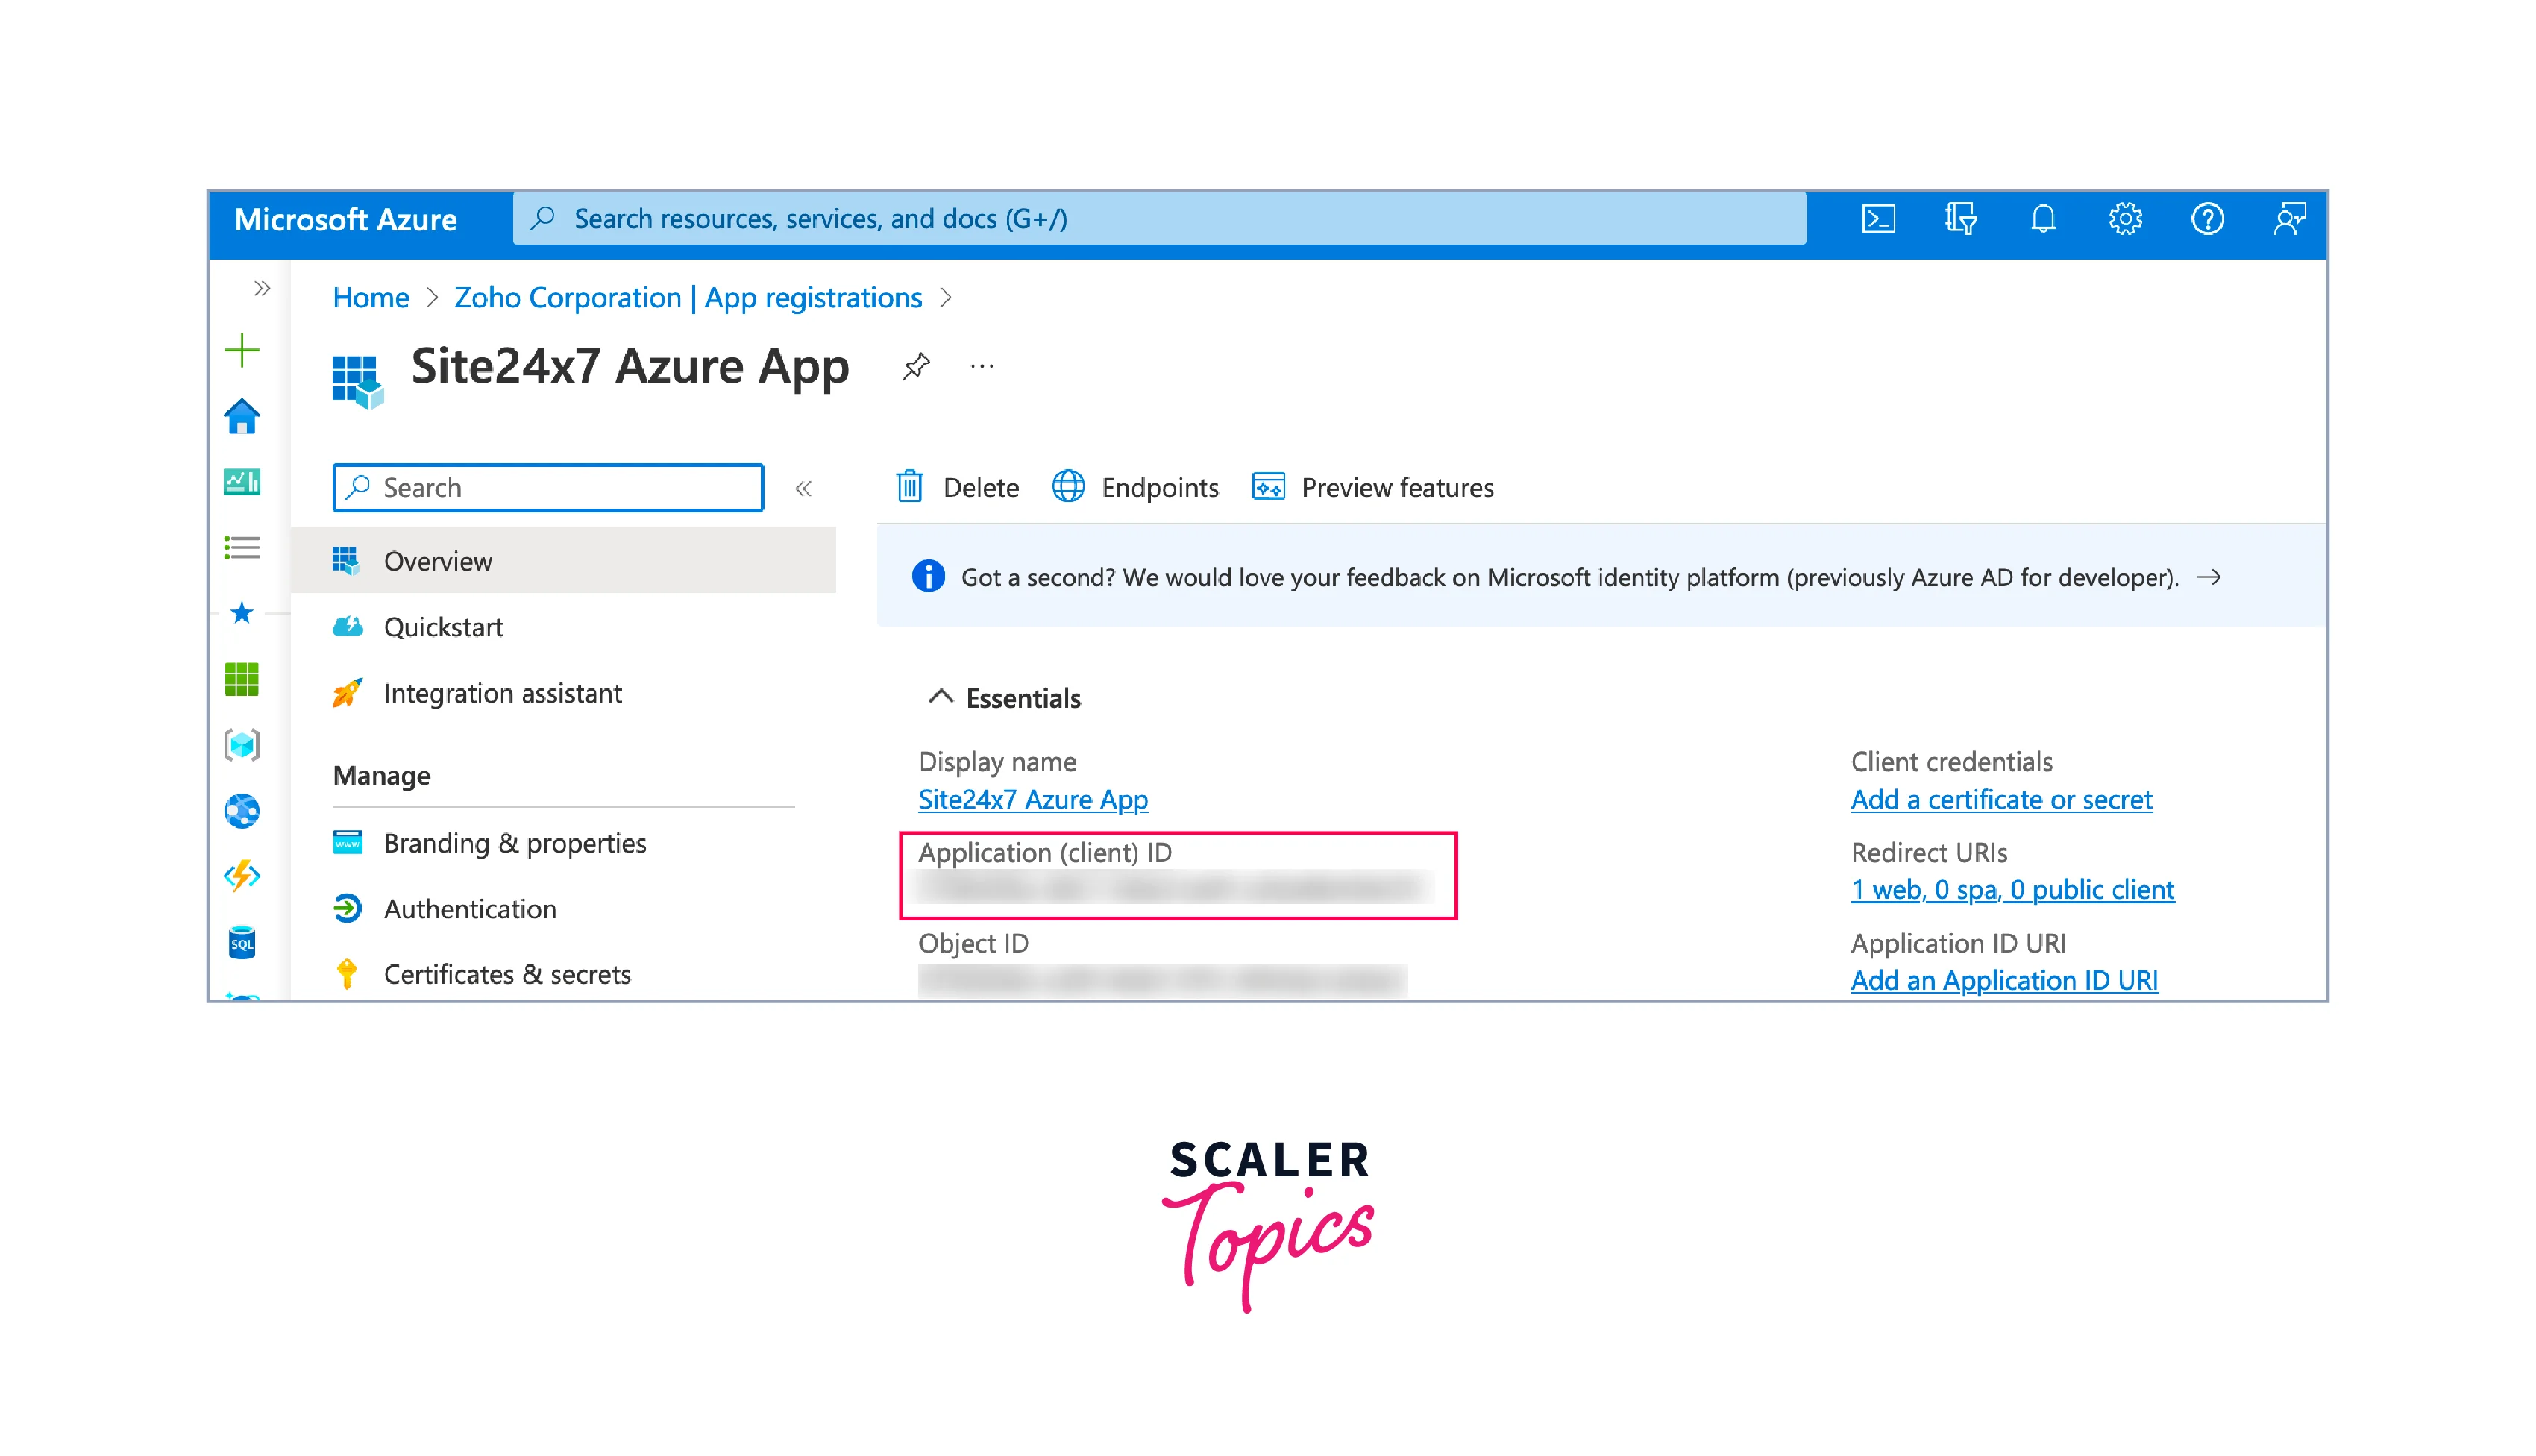
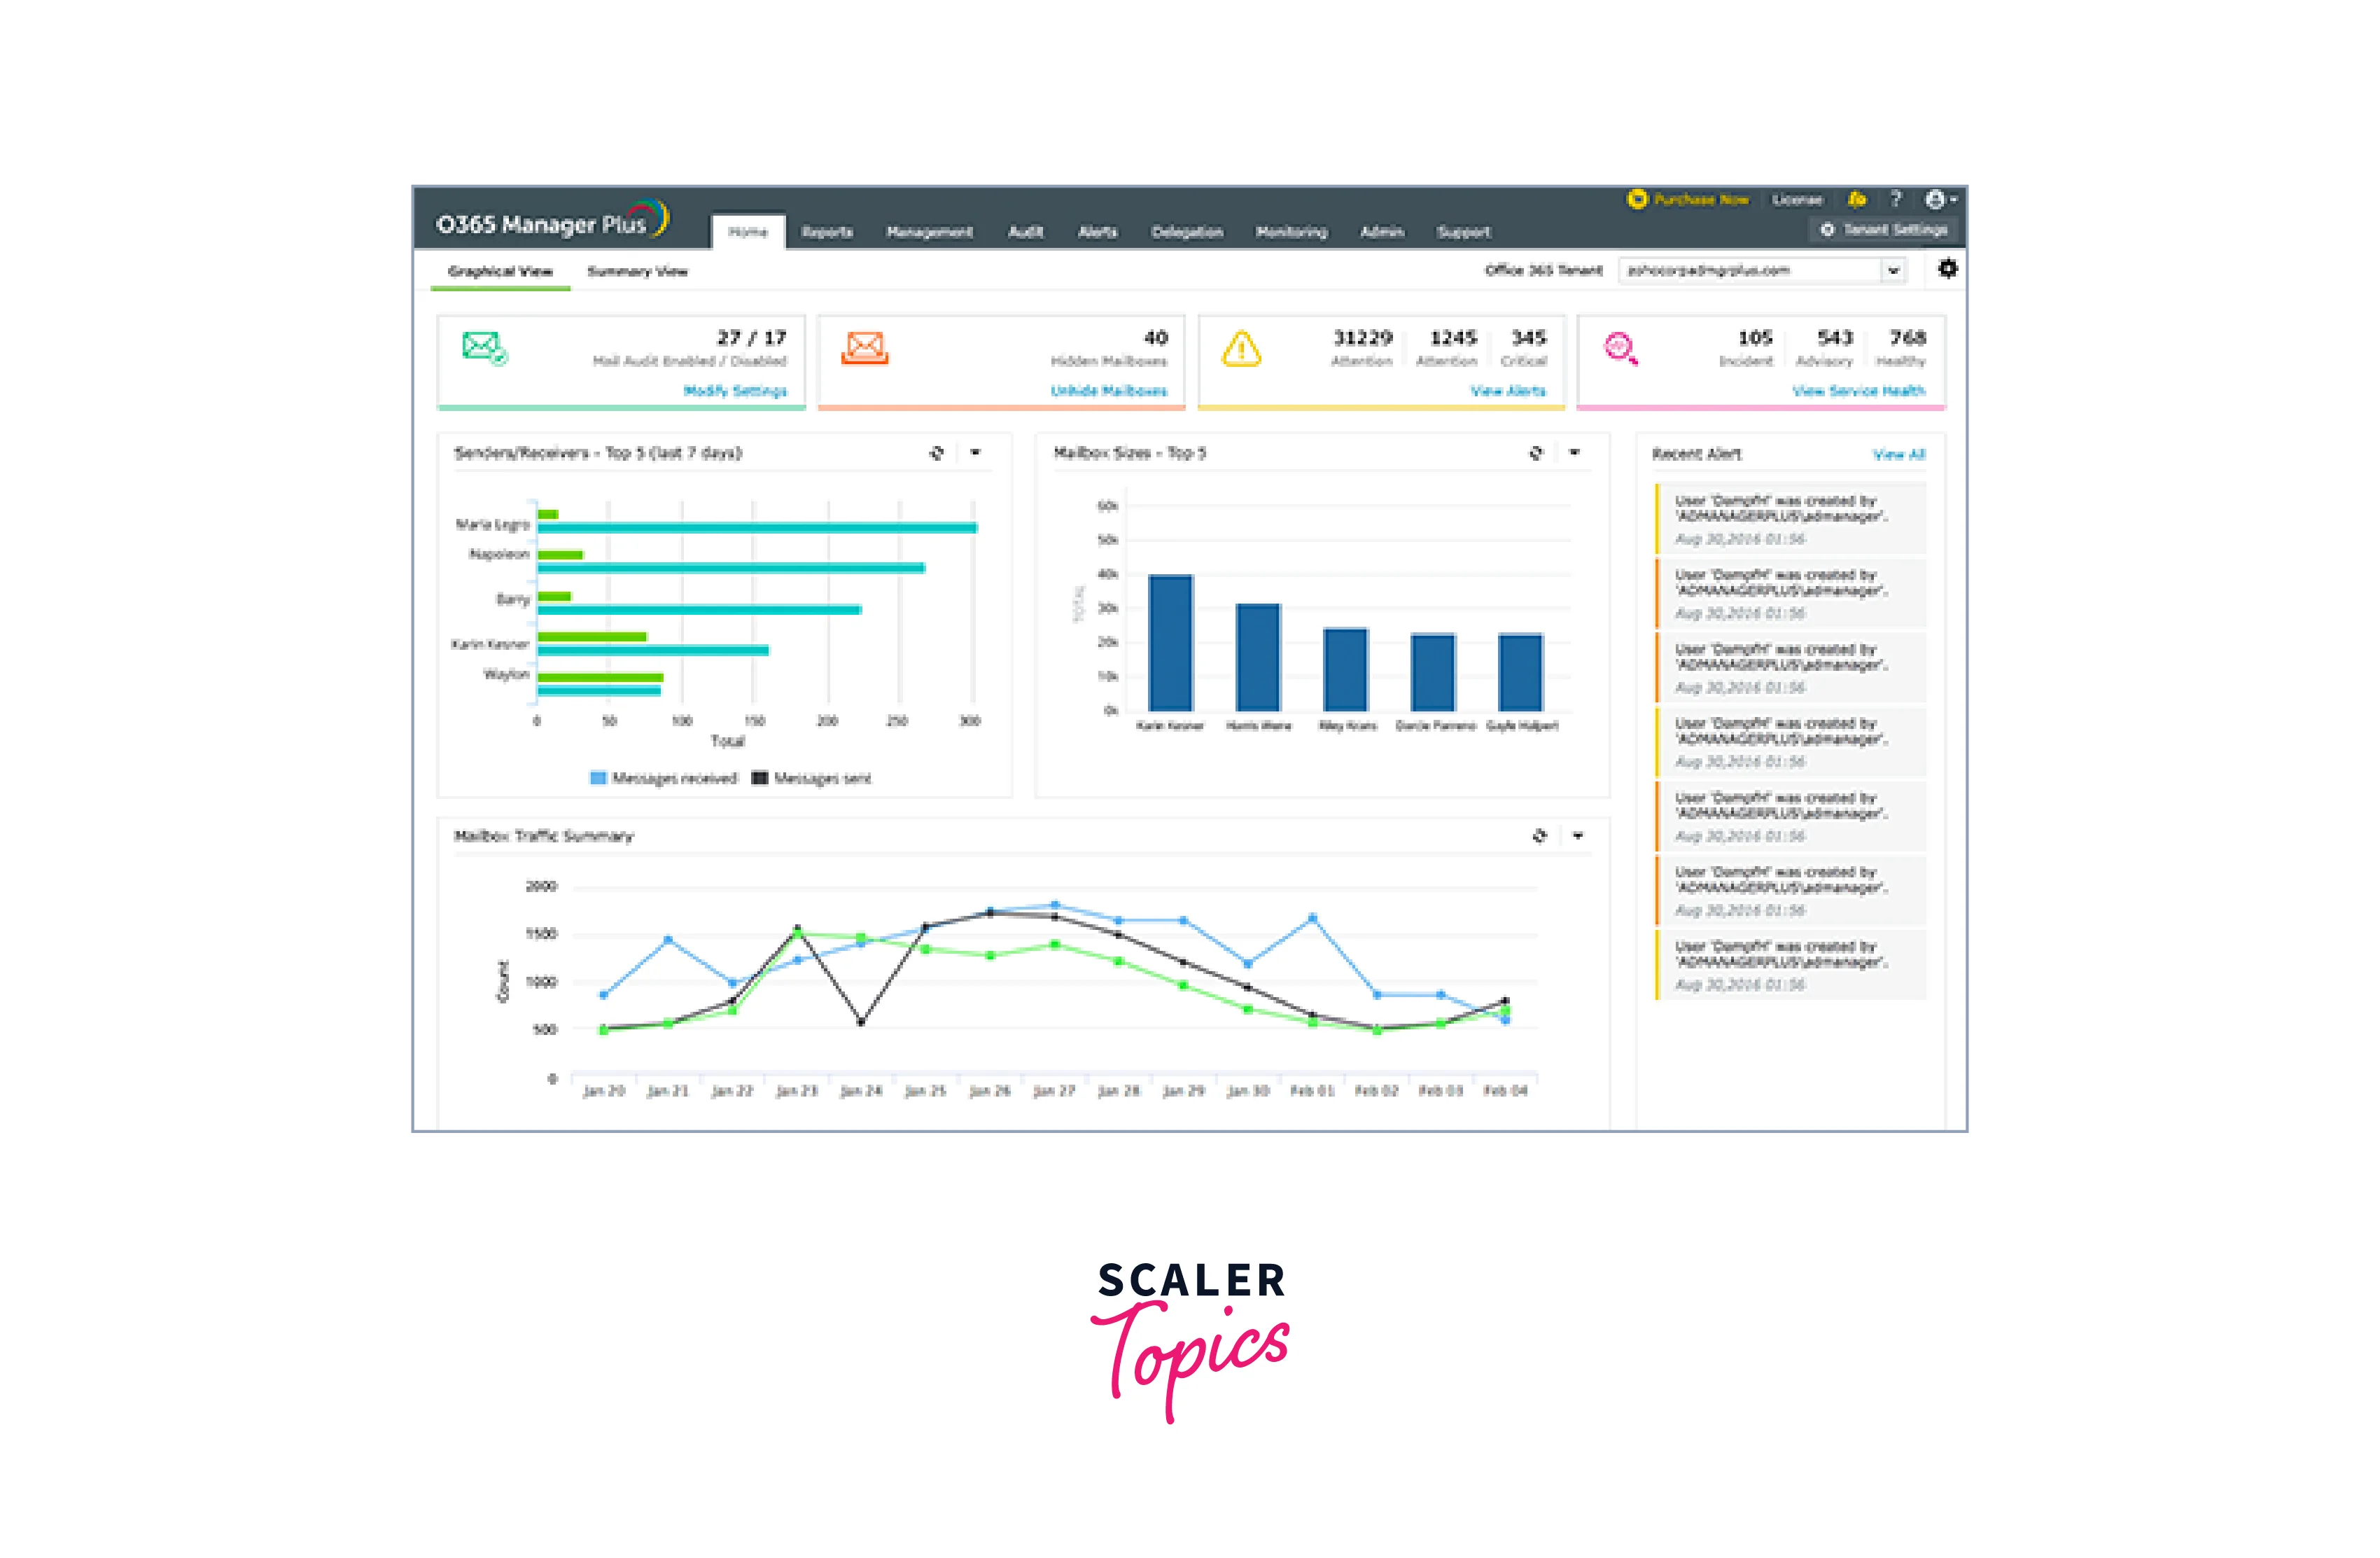
ManageEngine M365 Manager Plus
ManageEngine M365 Manager Plus is a comprehensive solution developed by ManageEngine, a division of Zoho Corporation. M365 Manager Plus is designed to provide management, monitoring, reporting, and auditing capabilities for Microsoft 365 (formerly known as Office 365) environments. It aims to help organizations efficiently manage their Microsoft 365 services, users, and resources.
Features
Key features of ManageEngine M365 Manager Plus include:
- User Management: M365 Manager Plus allows administrators to manage user accounts, licenses, and attributes within Microsoft 365. This includes provisioning, deprovisioning, and modifying user accounts.
- Active Directory Management: The solution might offer capabilities to manage Active Directory objects like users, groups, and contacts in the Microsoft 365 environment.
- Mailbox Management: Administrators can perform tasks related to mailbox management, such as creating, deleting, and migrating mailboxes, as well as monitoring mailbox usage.
- Security and Compliance: M365 Manager Plus might include features to help organizations enforce security policies, monitor access, and track changes. This can aid in compliance with data protection regulations.
- Auditing and Reporting: The solution could provide auditing and reporting tools to track user activities, changes to configurations, and other actions within Microsoft 365. This is useful for security and compliance purposes.
- Mail Traffic Monitoring: Administrators might be able to monitor and analyze mail traffic patterns, including inbound and outbound emails, to detect anomalies or potential security threats.
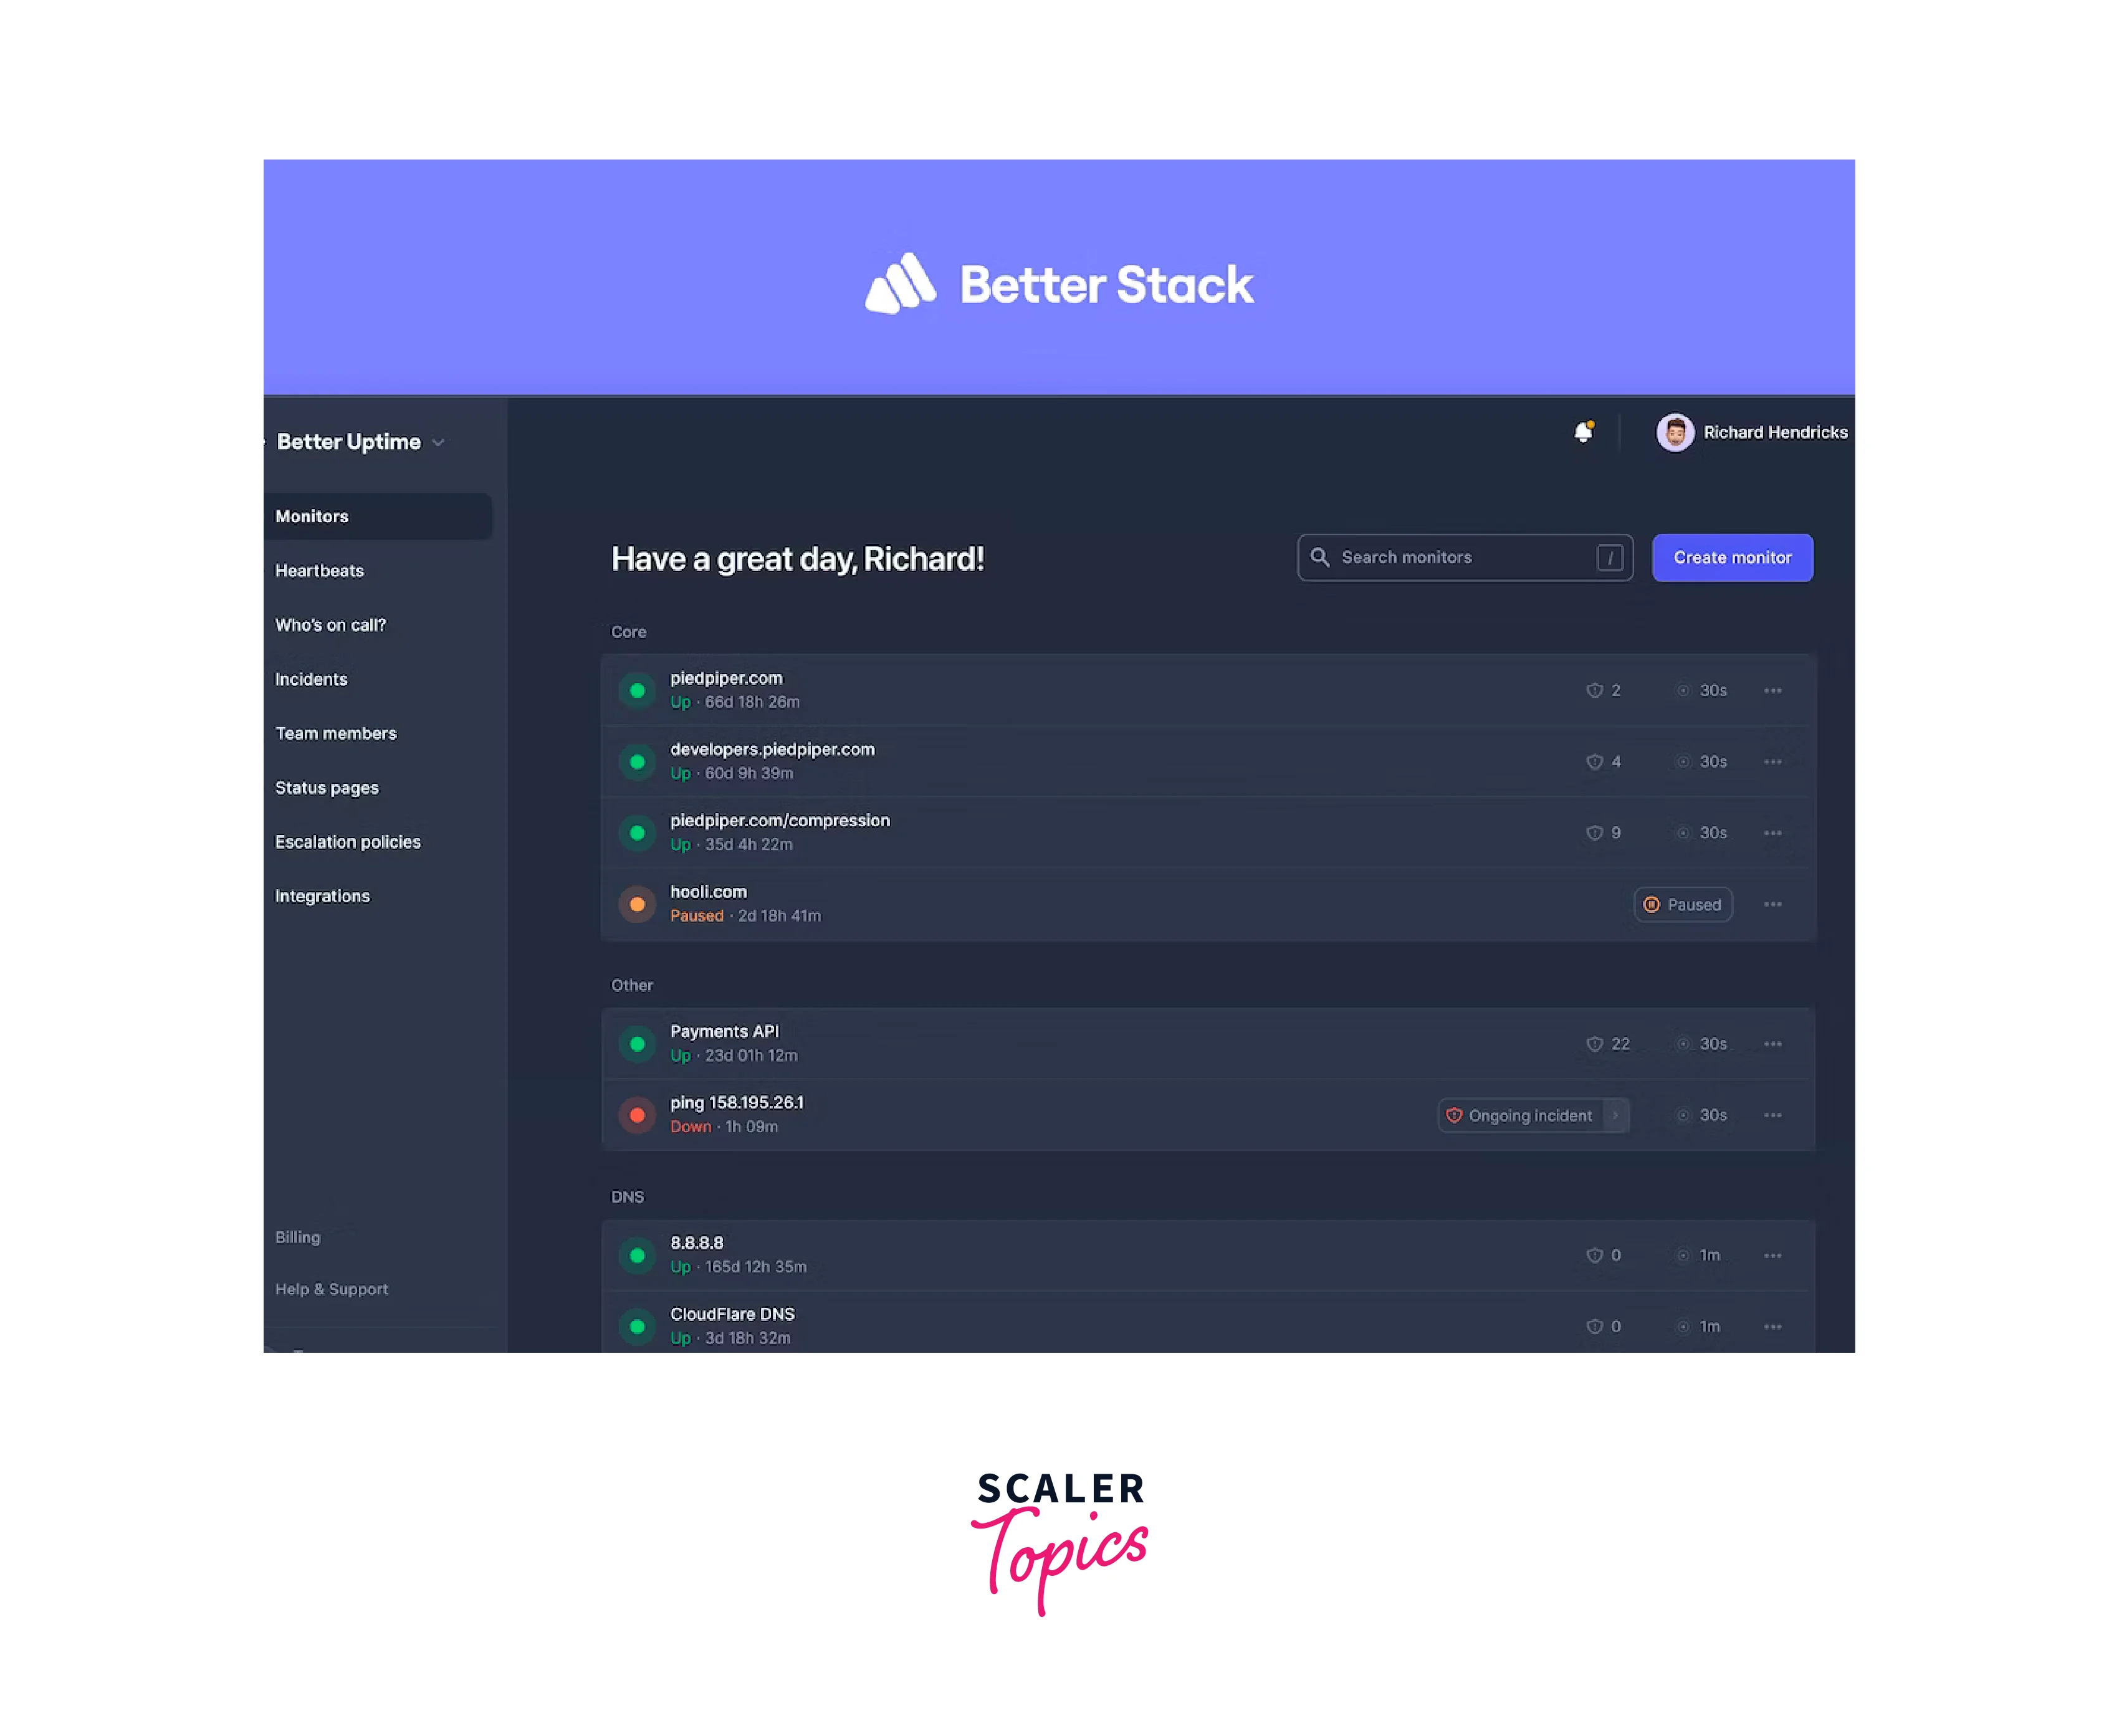
Better Stack
Better Stack is a cloud monitoring tool designed to offer in-depth insights into Azure infrastructure, facilitating real-time monitoring of various Azure resources, including virtual machines, storage accounts, and databases. The tool aims to proactively detect performance bottlenecks and issues, helping users address them before they impact operations. With its user-friendly interface and visual dashboards, Better Stack provides a clear overview of critical metrics, enabling users to assess the health and performance of their Azure resources effectively.
Features:
Key features of Better Stack include:
- Customizable Alerts and Notifications: Better Stack allows users to set up custom alerts and notifications, ensuring that they are promptly informed about any anomalies or performance deviations.
- Pre-Built Visual Dashboard: The tool features a visually appealing and intuitive dashboard that displays key metrics and insights, making it easier for users to monitor and analyze their Azure resources.
- Automatic Detection of Azure Resources: Better Stack can automatically discover and monitor Azure resources, saving time and effort in manual setup and configuration.
- Incident Management: The tool supports incident management, enabling teams to collaborate efficiently and address issues as they arise.
- Advanced Analytics and Reporting: Better Stack offers advanced analytics capabilities, empowering users to dive deep into their data for more comprehensive insights. It also provides reporting functionalities to facilitate data-driven decision-making.
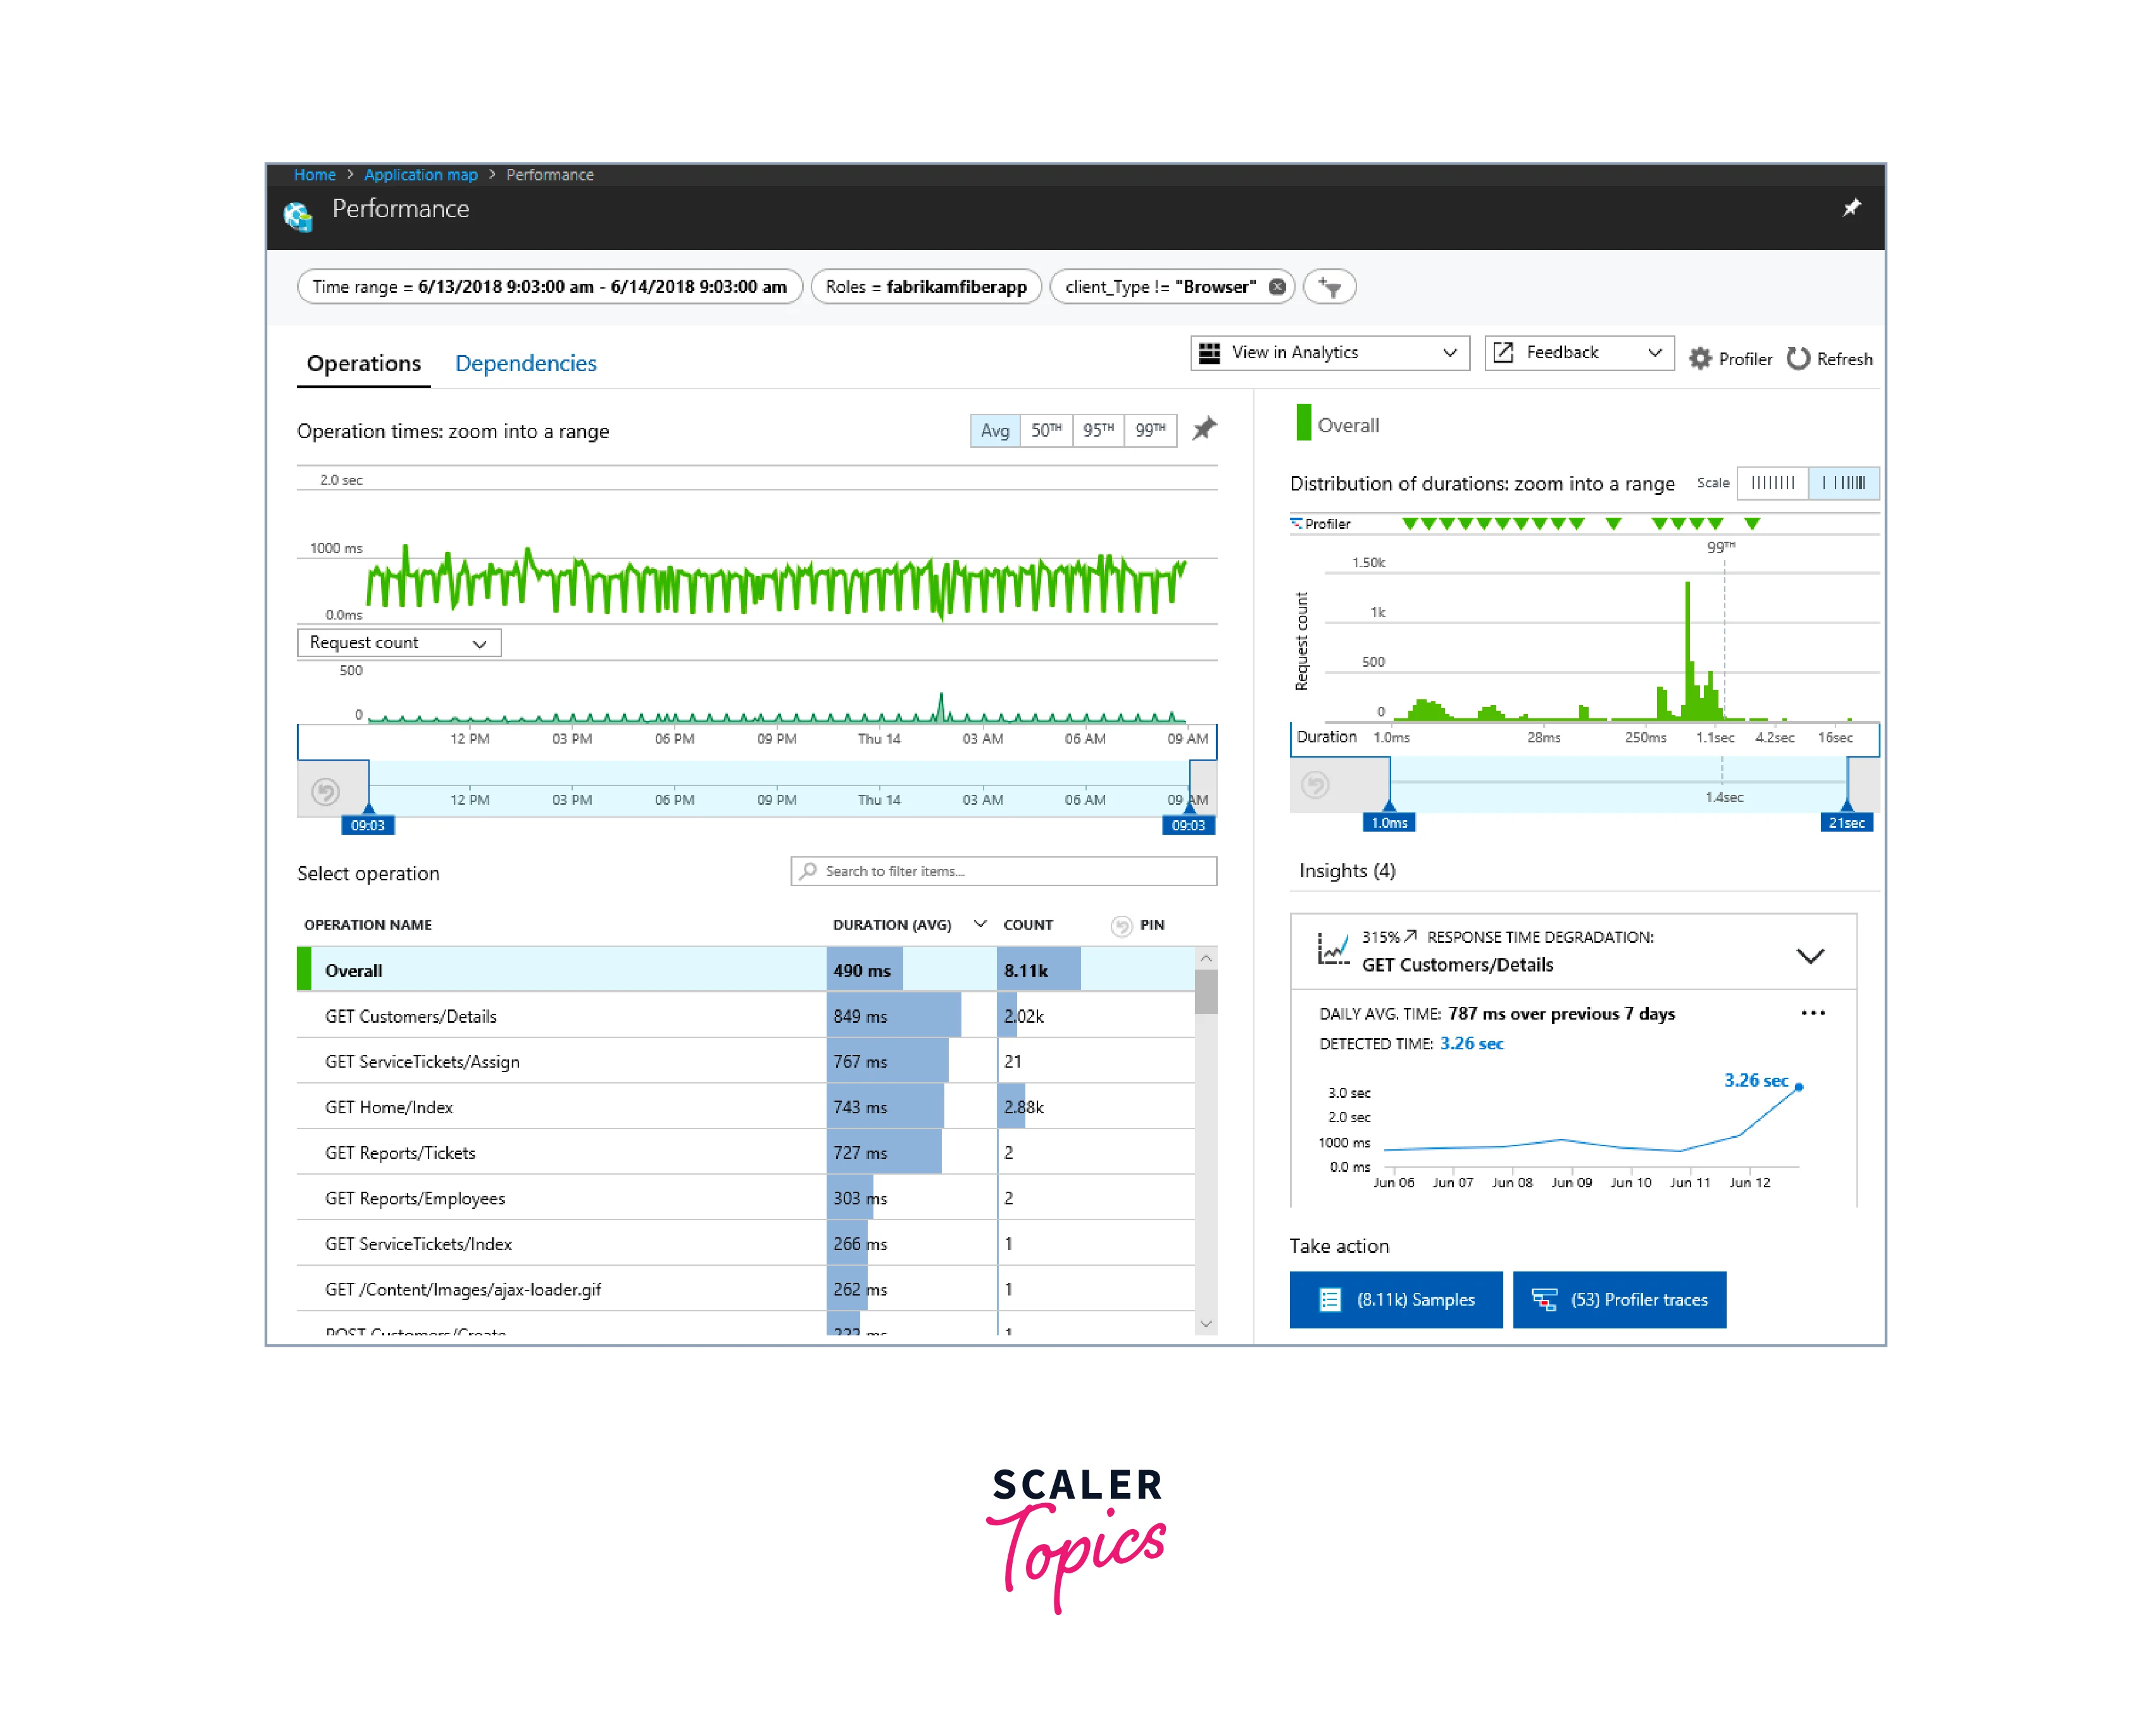
Application Insights
Application Insights is a comprehensive monitoring and diagnostics tool provided by Microsoft Azure, primarily focused on ensuring the optimal performance and availability of your applications. It offers deep insights into the behavior of your applications, user experiences, and performance bottlenecks, helping you identify and address issues proactively.
Features:
Key features of Application Insights include:
- Application Performance Monitoring: Application Insights allows you to monitor the performance of your applications in real-time. It tracks response times, server dependencies, and user interactions to provide a clear picture of how your app is performing.
- User Experience Tracking: The tool tracks user interactions and experiences within your application. You can gain insights into how users are interacting with different parts of your app and identify areas for improvement.
- Code-Level Diagnostics: Application Insights provides detailed insights into the code-level behavior of your application. You can track exceptions, crashes, and failures, pinpointing the root causes and resolving issues more efficiently.
- Availability Monitoring: The tool monitors the availability of your application by performing availability tests from various locations. This helps you identify downtime and performance degradation across different geographical regions.
- Customizable Alerts: You can set up custom alerts and notifications based on specific conditions. This allows you to be notified when performance thresholds are breached or critical errors occur.
- Integration with DevOps: Application Insights seamlessly integrates with DevOps processes, enabling development and operations teams to collaborate effectively. It provides insights that help improve the quality of your application.
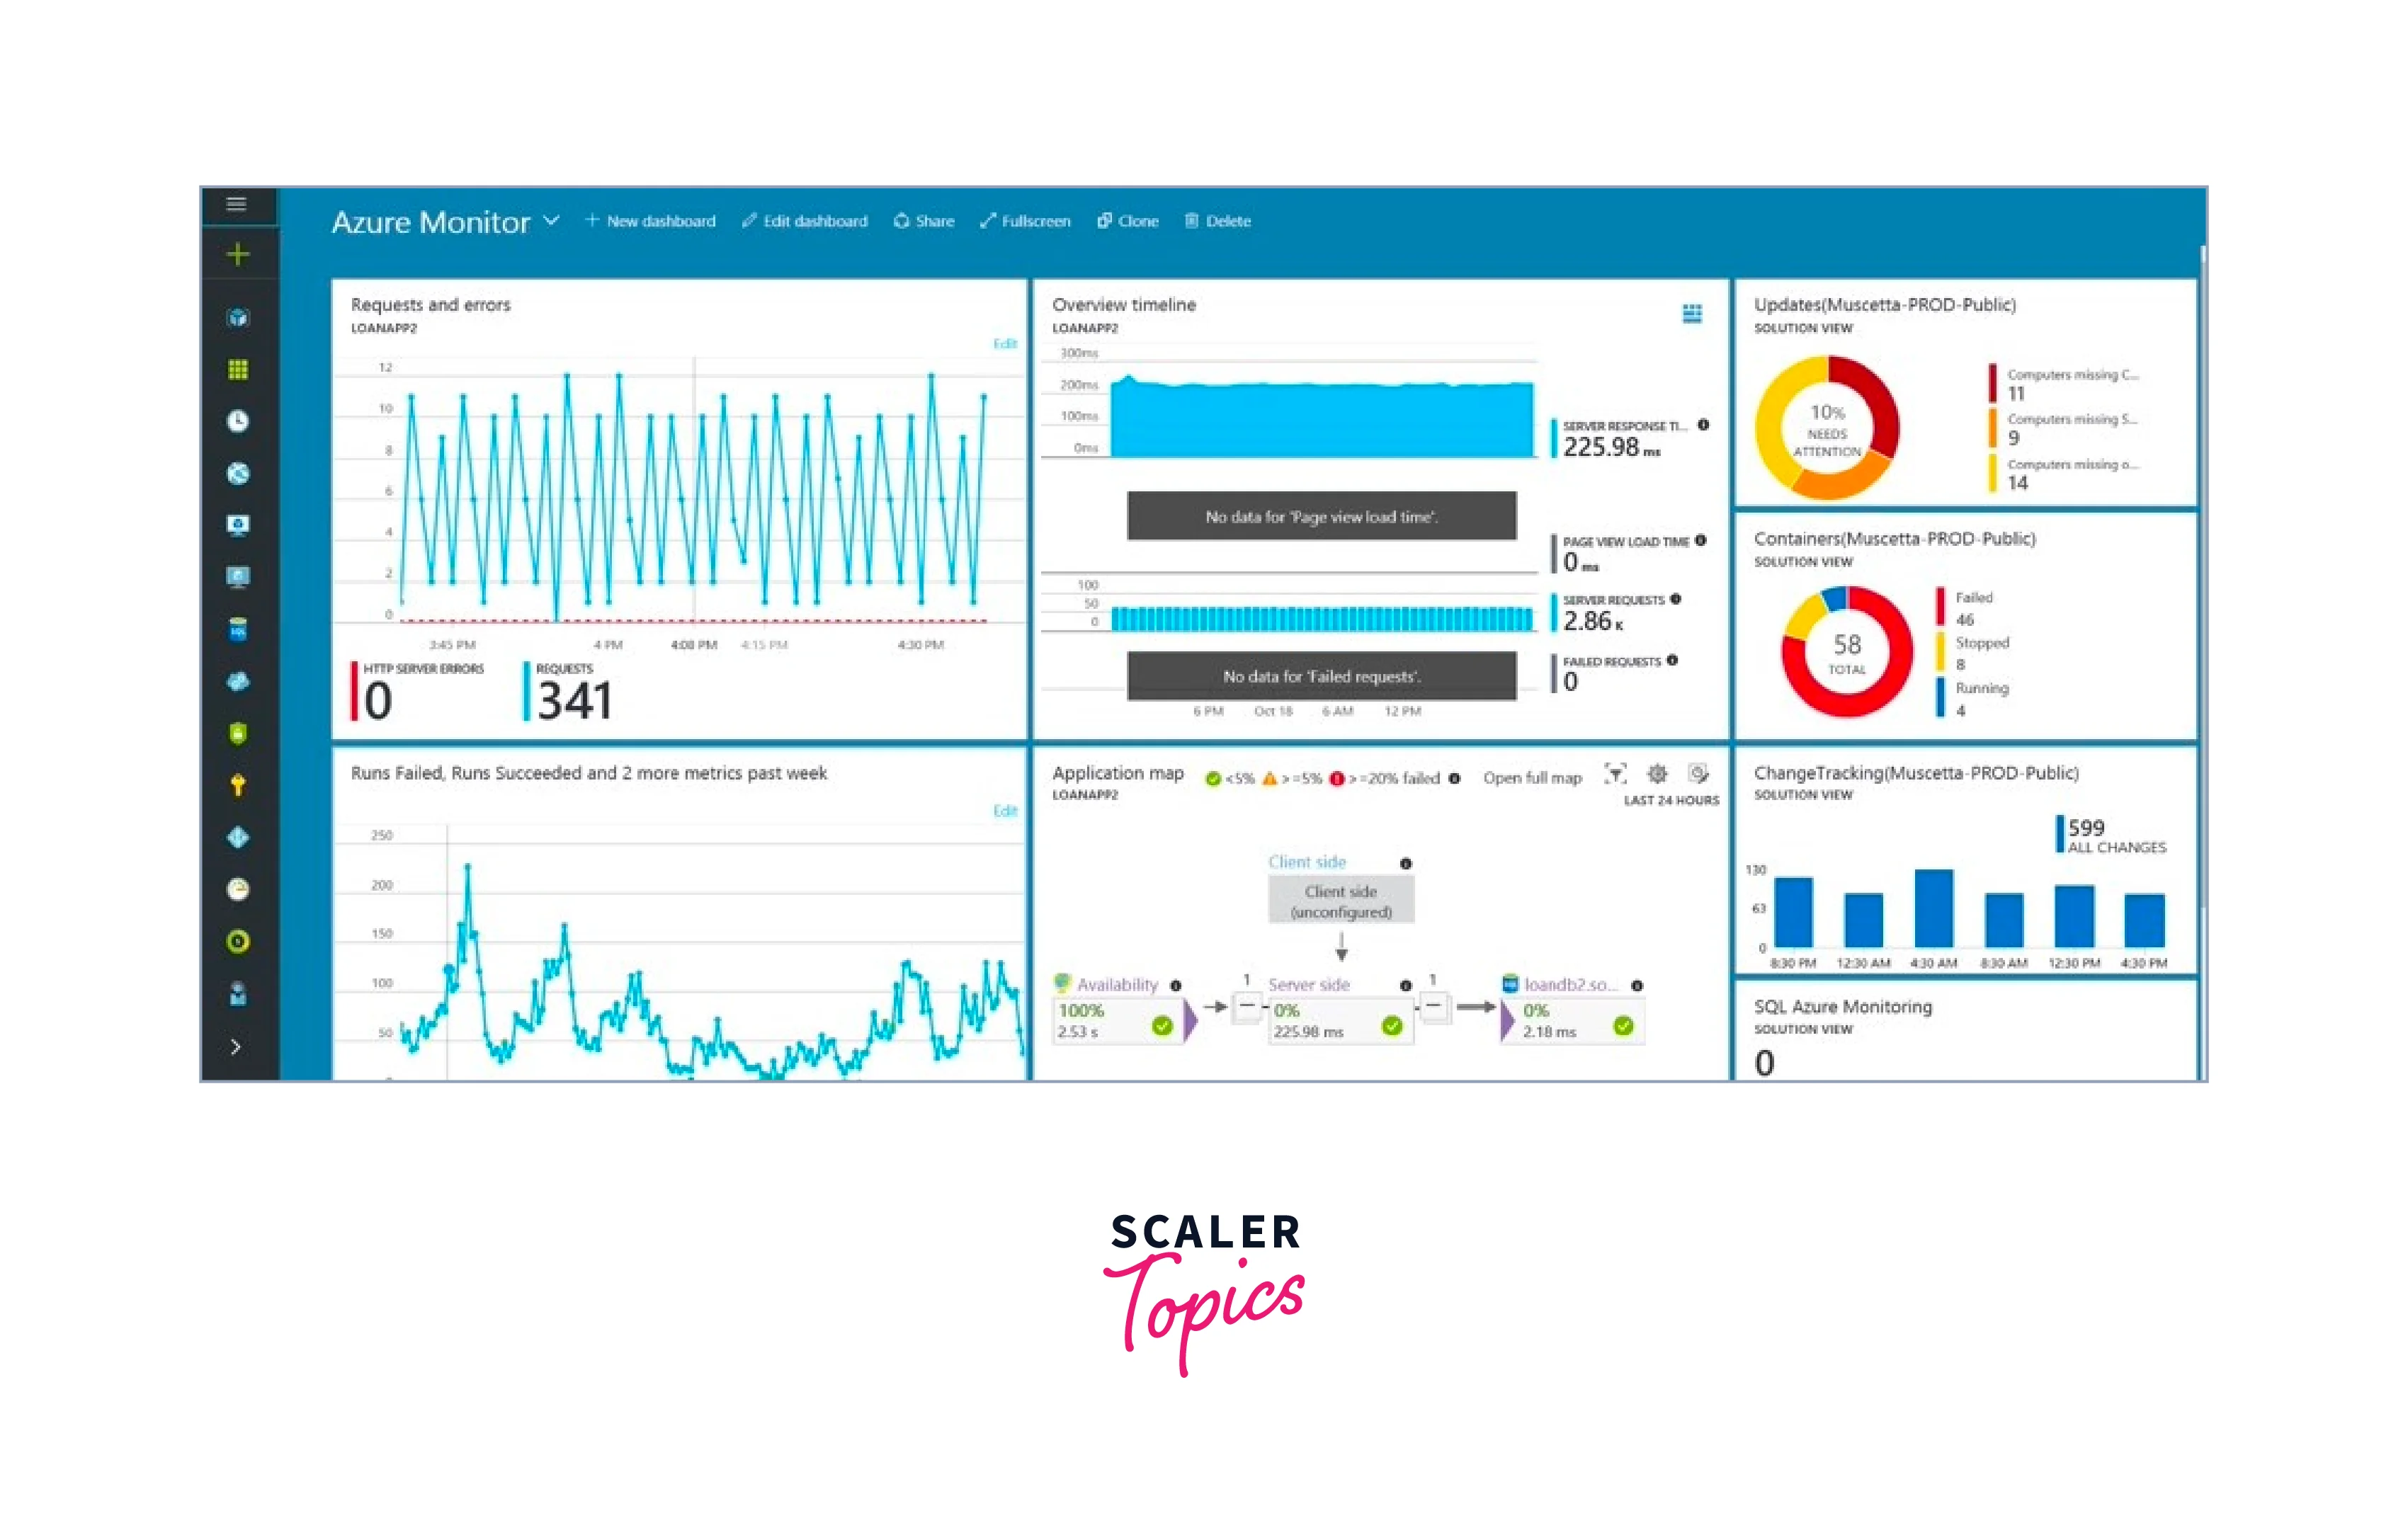
Azure Monitor
Azure Monitor is a robust cloud monitoring solution provided by Microsoft Azure. Its primary focus is to help you gain insights into the performance, health, and availability of your applications, infrastructure, and networks hosted on the Azure platform. Azure Monitor consolidates metrics, logs, and alerts into a centralized dashboard, providing a comprehensive view of your resources.
Features:
Key features of Azure monitor include:
- Centralized Monitoring: Azure Monitor acts as a control center, offering a single dashboard that displays metrics, logs, and alerts from various Azure services. This unified view simplifies monitoring and troubleshooting.
- Metrics and Logs: The tool collects and stores metrics and logs from Azure resources, enabling you to track performance trends, analyze historical data, and identify issues.
- Application Insights Integration: Azure Monitor seamlessly integrates with Application Insights, providing deeper insights into application performance and user experiences.
- Resource Health Monitoring: You can monitor the health and availability of individual Azure resources using Azure Monitor's Resource Health feature. This helps you diagnose and address resource-specific issues.
- Scalability Insights: Azure Monitor provides insights into the scalability of your applications by tracking resource utilization and performance metrics.
- Diagnostic Data Collection: The tool collects diagnostic data, including performance metrics and logs, which are essential for troubleshooting and root cause analysis.
- Automation and Action Groups: Azure Monitor supports automation through Azure Logic Apps and Azure Functions, enabling you to take automated actions in response to alerts. Action groups define who should be notified or what actions to take when alerts occur.
- Integration with DevOps: Azure Monitor seamlessly integrates with DevOps practices, facilitating collaboration between development and operations teams.
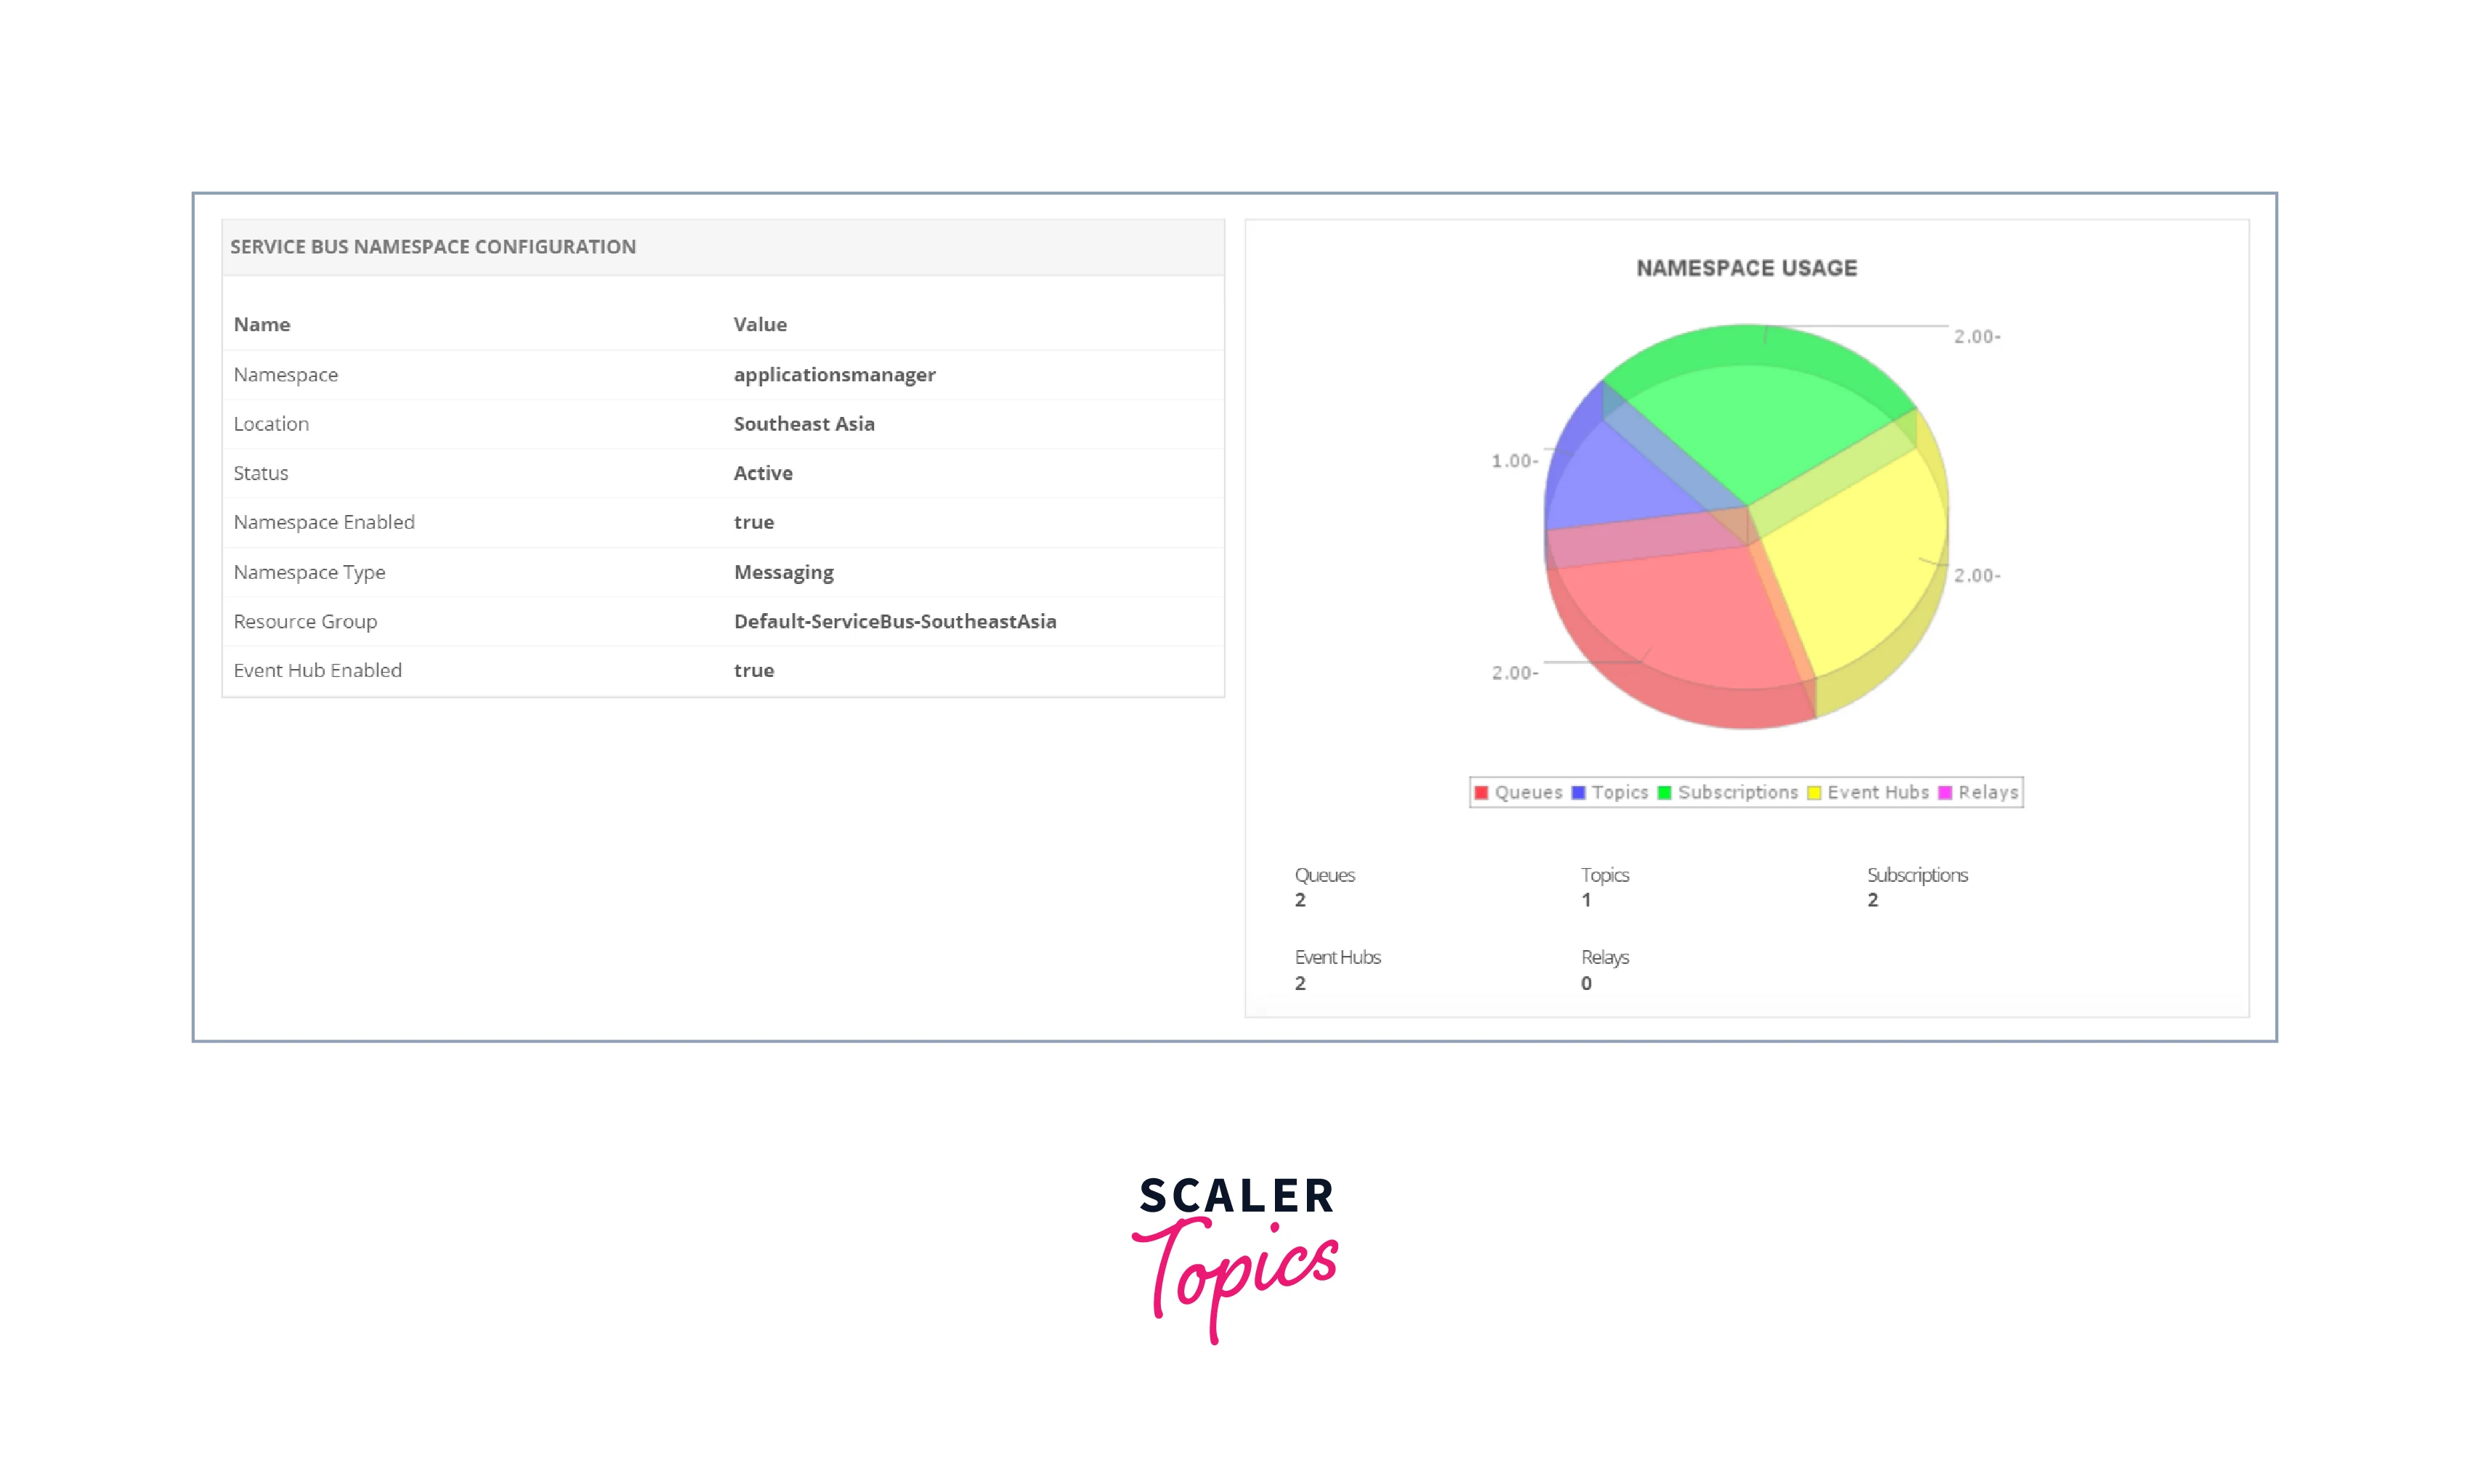
Service Bus Explorer
Service Bus Explorer is a tool designed to provide developers and administrators with a graphical interface to interact with Azure Service Bus, a messaging service that enables communication between different applications or components. The tool allows users to manage and monitor queues, topics, subscriptions, and messages within Azure Service Bus.
Features:
Key features of Service Bus Explorer include:
- Service Bus Management: Service Bus Explorer offers a user-friendly interface to manage various aspects of Azure Service Bus, including creating and deleting queues, topics, and subscriptions.
- Message Manipulation: Users can send, receive, and view messages within queues and topics. This feature is particularly useful for testing message processing and understanding message behavior.
- Real-time Monitoring: The tool provides real-time insights into message activity, including message counts, message sizes, and other metrics related to message processing.
- Queue and Topic Metrics: Users can access and visualize metrics related to queue and topic activity, helping them understand the flow and performance of messages.
- Dead Letter Queue Handling: Service Bus Explorer allows you to manage dead letter queues, which contain messages that couldn't be processed successfully. This feature assists in troubleshooting message processing issues.
- Authorization and Authentication: The tool supports different authentication methods, ensuring secure access to your Azure Service Bus resources.
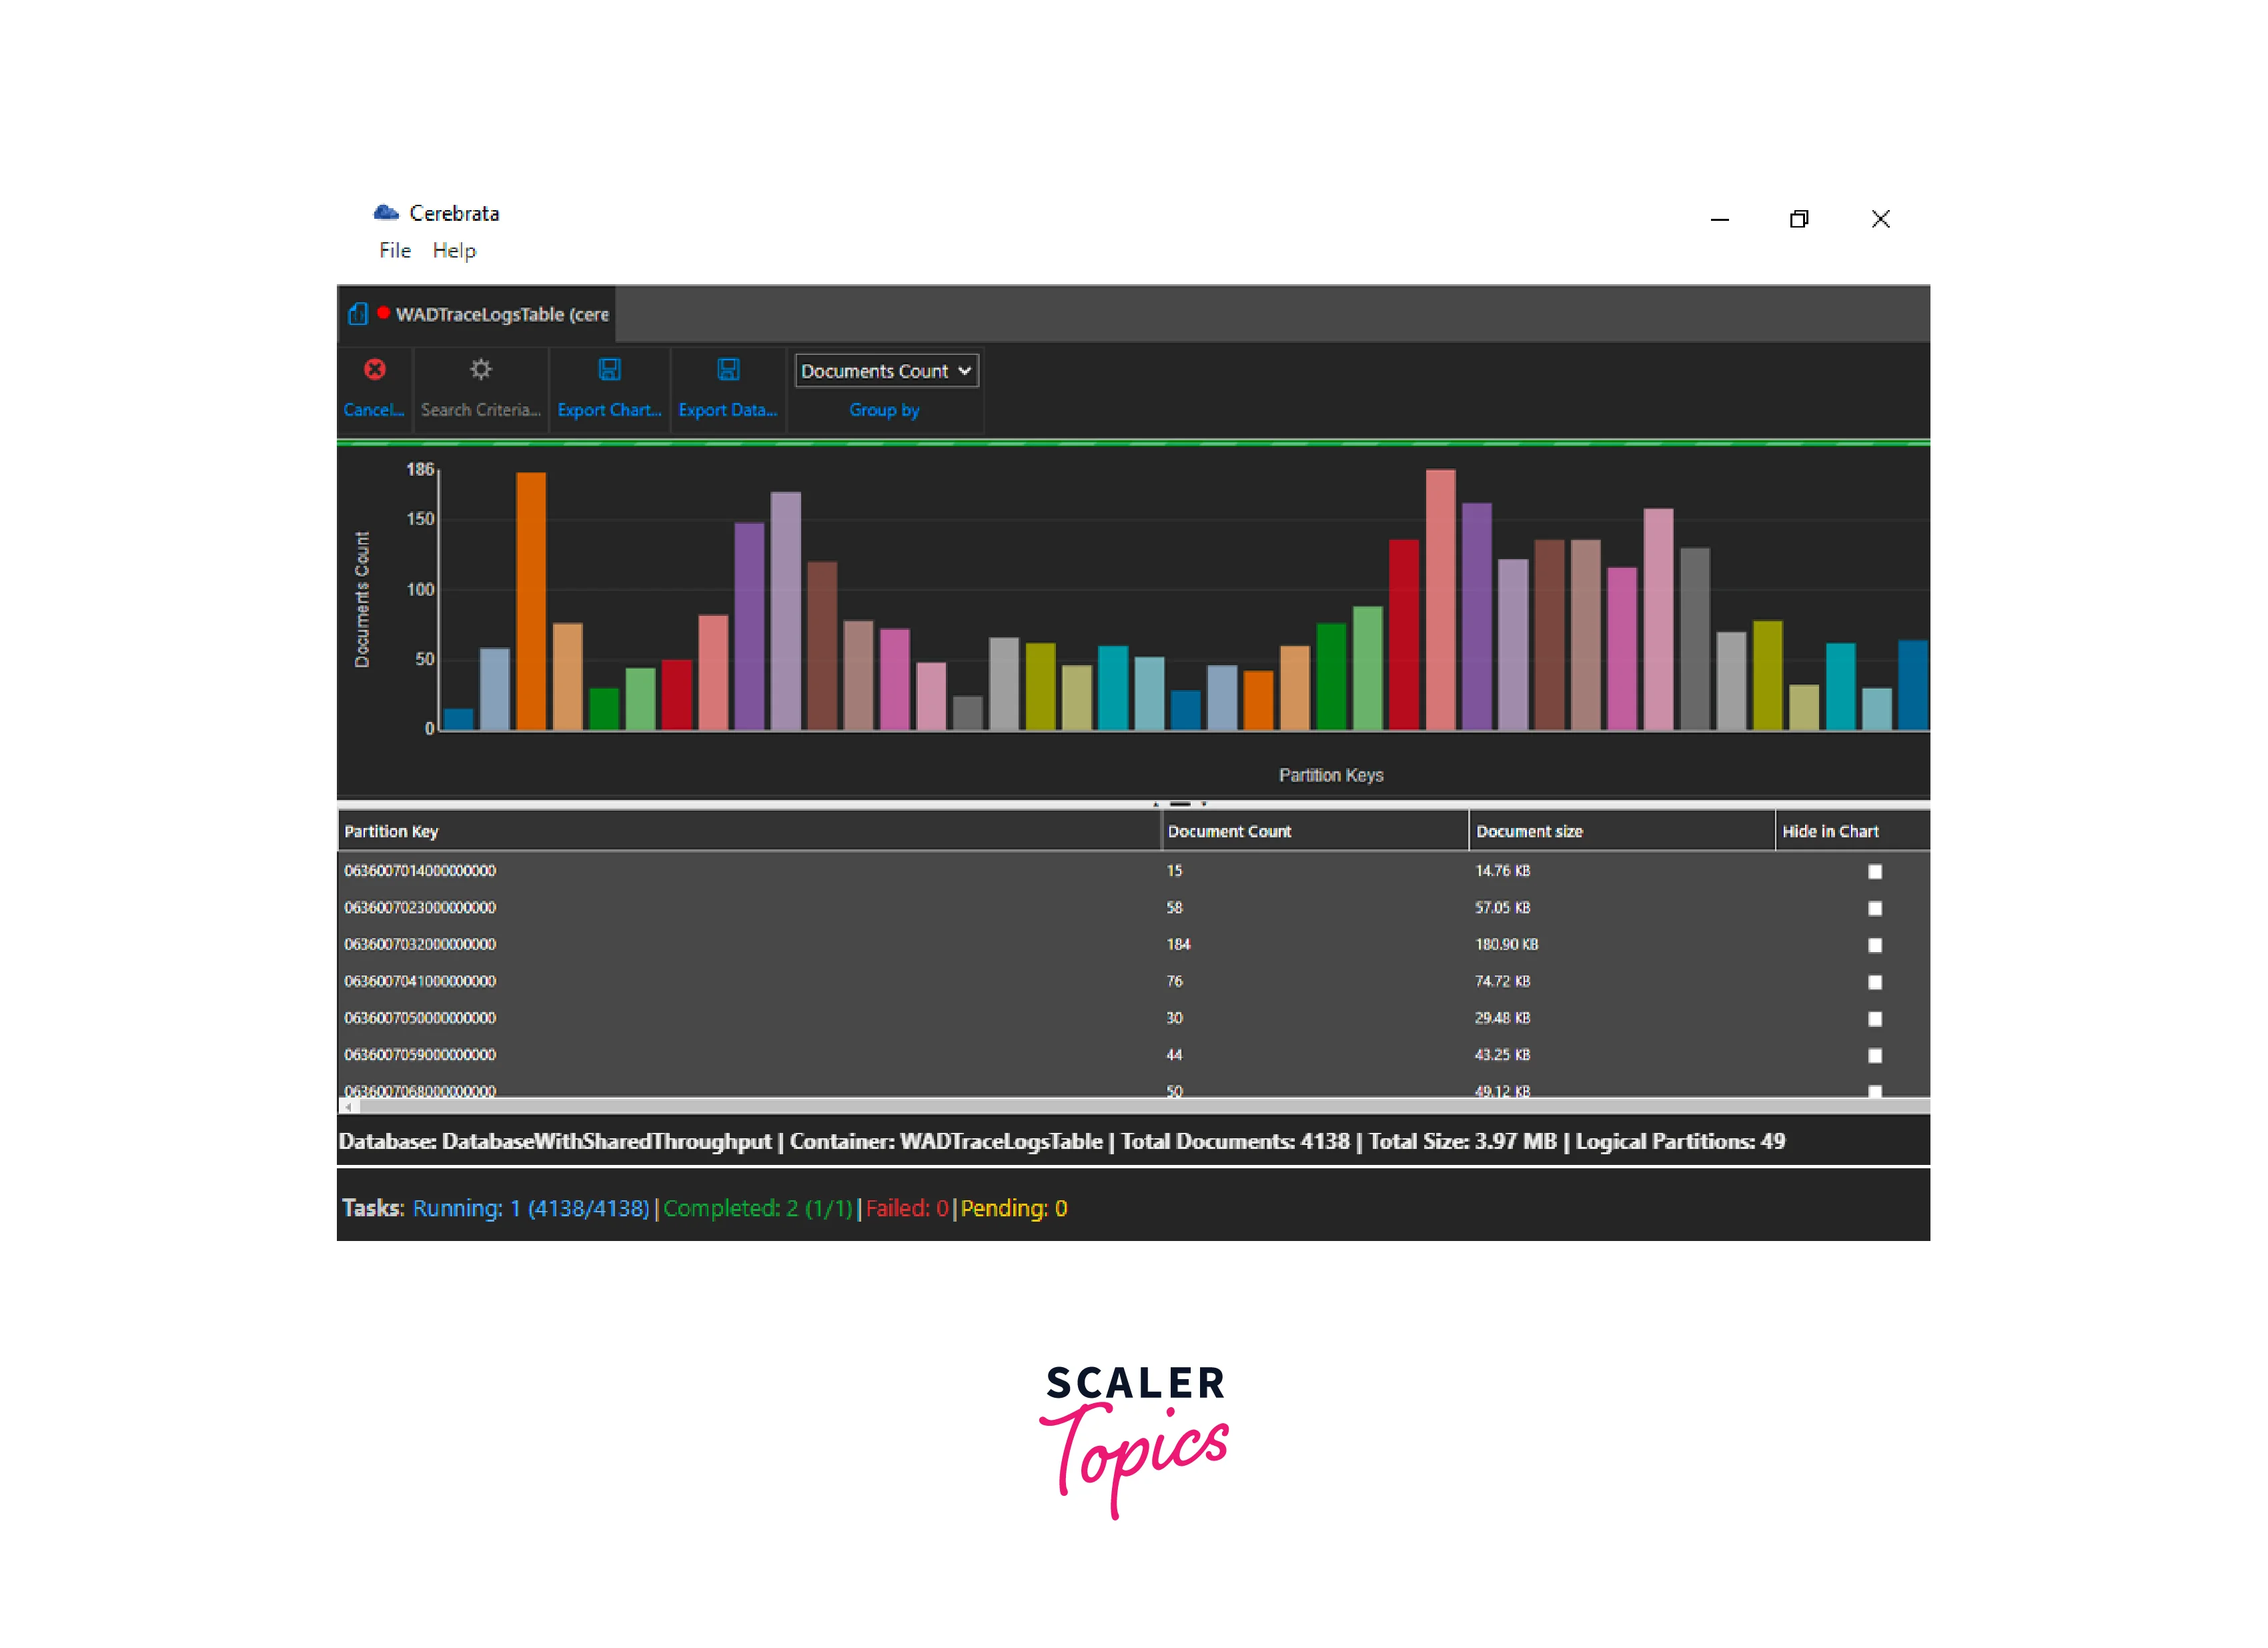
Cerebrata
Cerebrata is a suite of tools designed to help users manage and monitor various Azure resources effectively. The suite offers a range of capabilities to streamline management tasks, gain insights, and troubleshoot issues across different Azure services.
Features:
Key features of Cerebrate include:
- Azure Resource Management: Cerebrata tools support the management of Azure resources such as Azure Storage, Azure Cosmos DB, and Azure Service Bus. This includes tasks like provisioning, configuration, and monitoring.
- Resource Monitoring: The suite provides insights into the health, performance, and usage of Azure resources. This enables users to monitor resource activity and identify potential issues.
- Storage Management: Cerebrata tools offer functionalities to manage Azure Storage resources, such as managing containers, blobs, and queues, as well as monitoring storage analytics.
- Cosmos DB Management: Users can perform tasks related to Azure Cosmos DB, such as managing databases, containers, and data, as well as monitoring performance.
- Service Bus Management: The suite includes tools for Azure Service Bus management, allowing users to interact with queues, topics, and subscriptions, as well as monitor messaging activity.
- Security and Compliance: Cerebrata tools offer features to help users ensure security and compliance by managing access controls, auditing, and monitoring for various resources.
- Analytics and Reporting: The suite may include analytics and reporting capabilities to provide insights into resource usage and trends, helping users optimize their Azure environment.
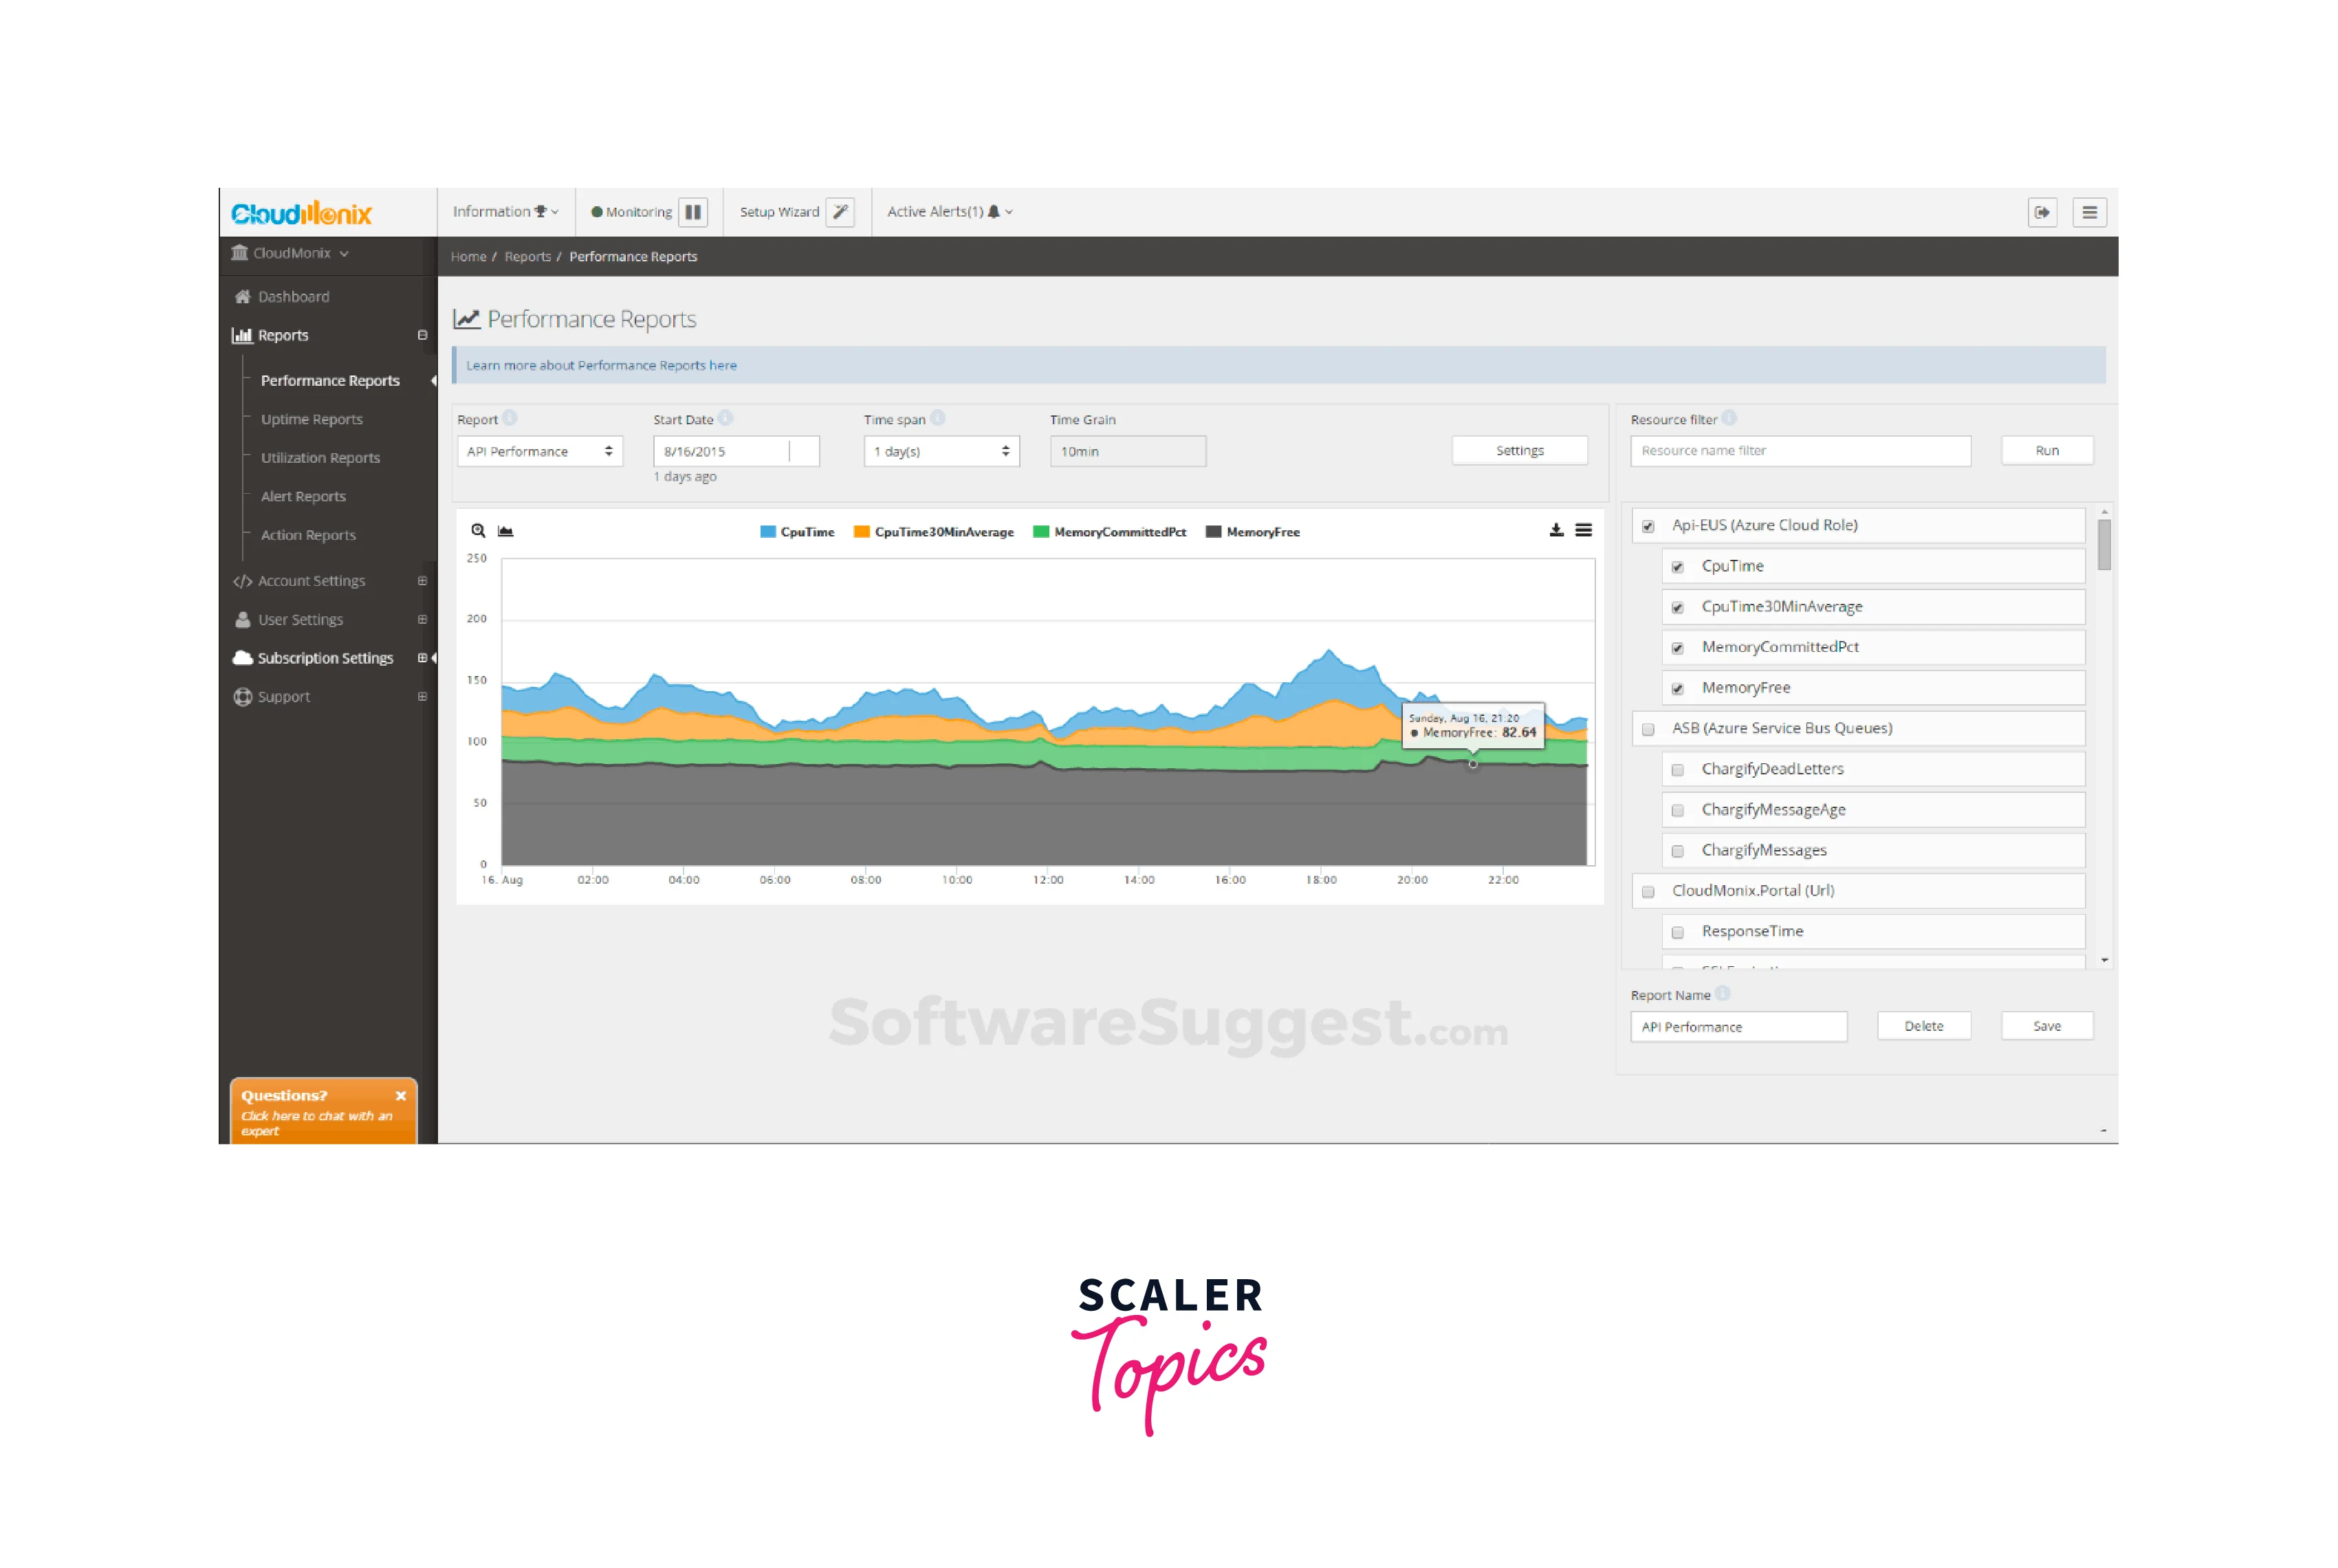
CloudMonix
CloudMonix is a cloud monitoring and automation platform designed to help users monitor, manage, and optimize their cloud resources, including those in Microsoft Azure. The platform offers a range of monitoring and automation features to ensure the performance, availability, and cost-efficiency of cloud environments.
Features:
Key features of CloudMonix include:
- Comprehensive Monitoring: CloudMonix provides real-time monitoring of Azure resources, tracking metrics and performance indicators across virtual machines, databases, web apps, and other services.
- Auto-Scaling: The platform supports auto-scaling capabilities, automatically adjusting resources based on demand to optimize performance and minimize costs.
- Alerts and Notifications: Users can set up customizable alerts and notifications to be informed about critical incidents, resource utilization spikes, or other predefined conditions.
- Automated Actions: CloudMonix enables users to define automated actions triggered by specific events. These actions can include scaling resources, restarting services, or executing custom scripts.
- Dashboards and Visualizations: The platform offers customizable dashboards and visualizations, allowing users to create visual representations of key metrics and performance data.
- Cost Optimization: CloudMonix assists in cost optimization by monitoring resource utilization and recommending adjustments to ensure efficient resource allocation.
- Support for Multi-Cloud: While the focus is on Azure, CloudMonix also supports monitoring and management for other cloud platforms.
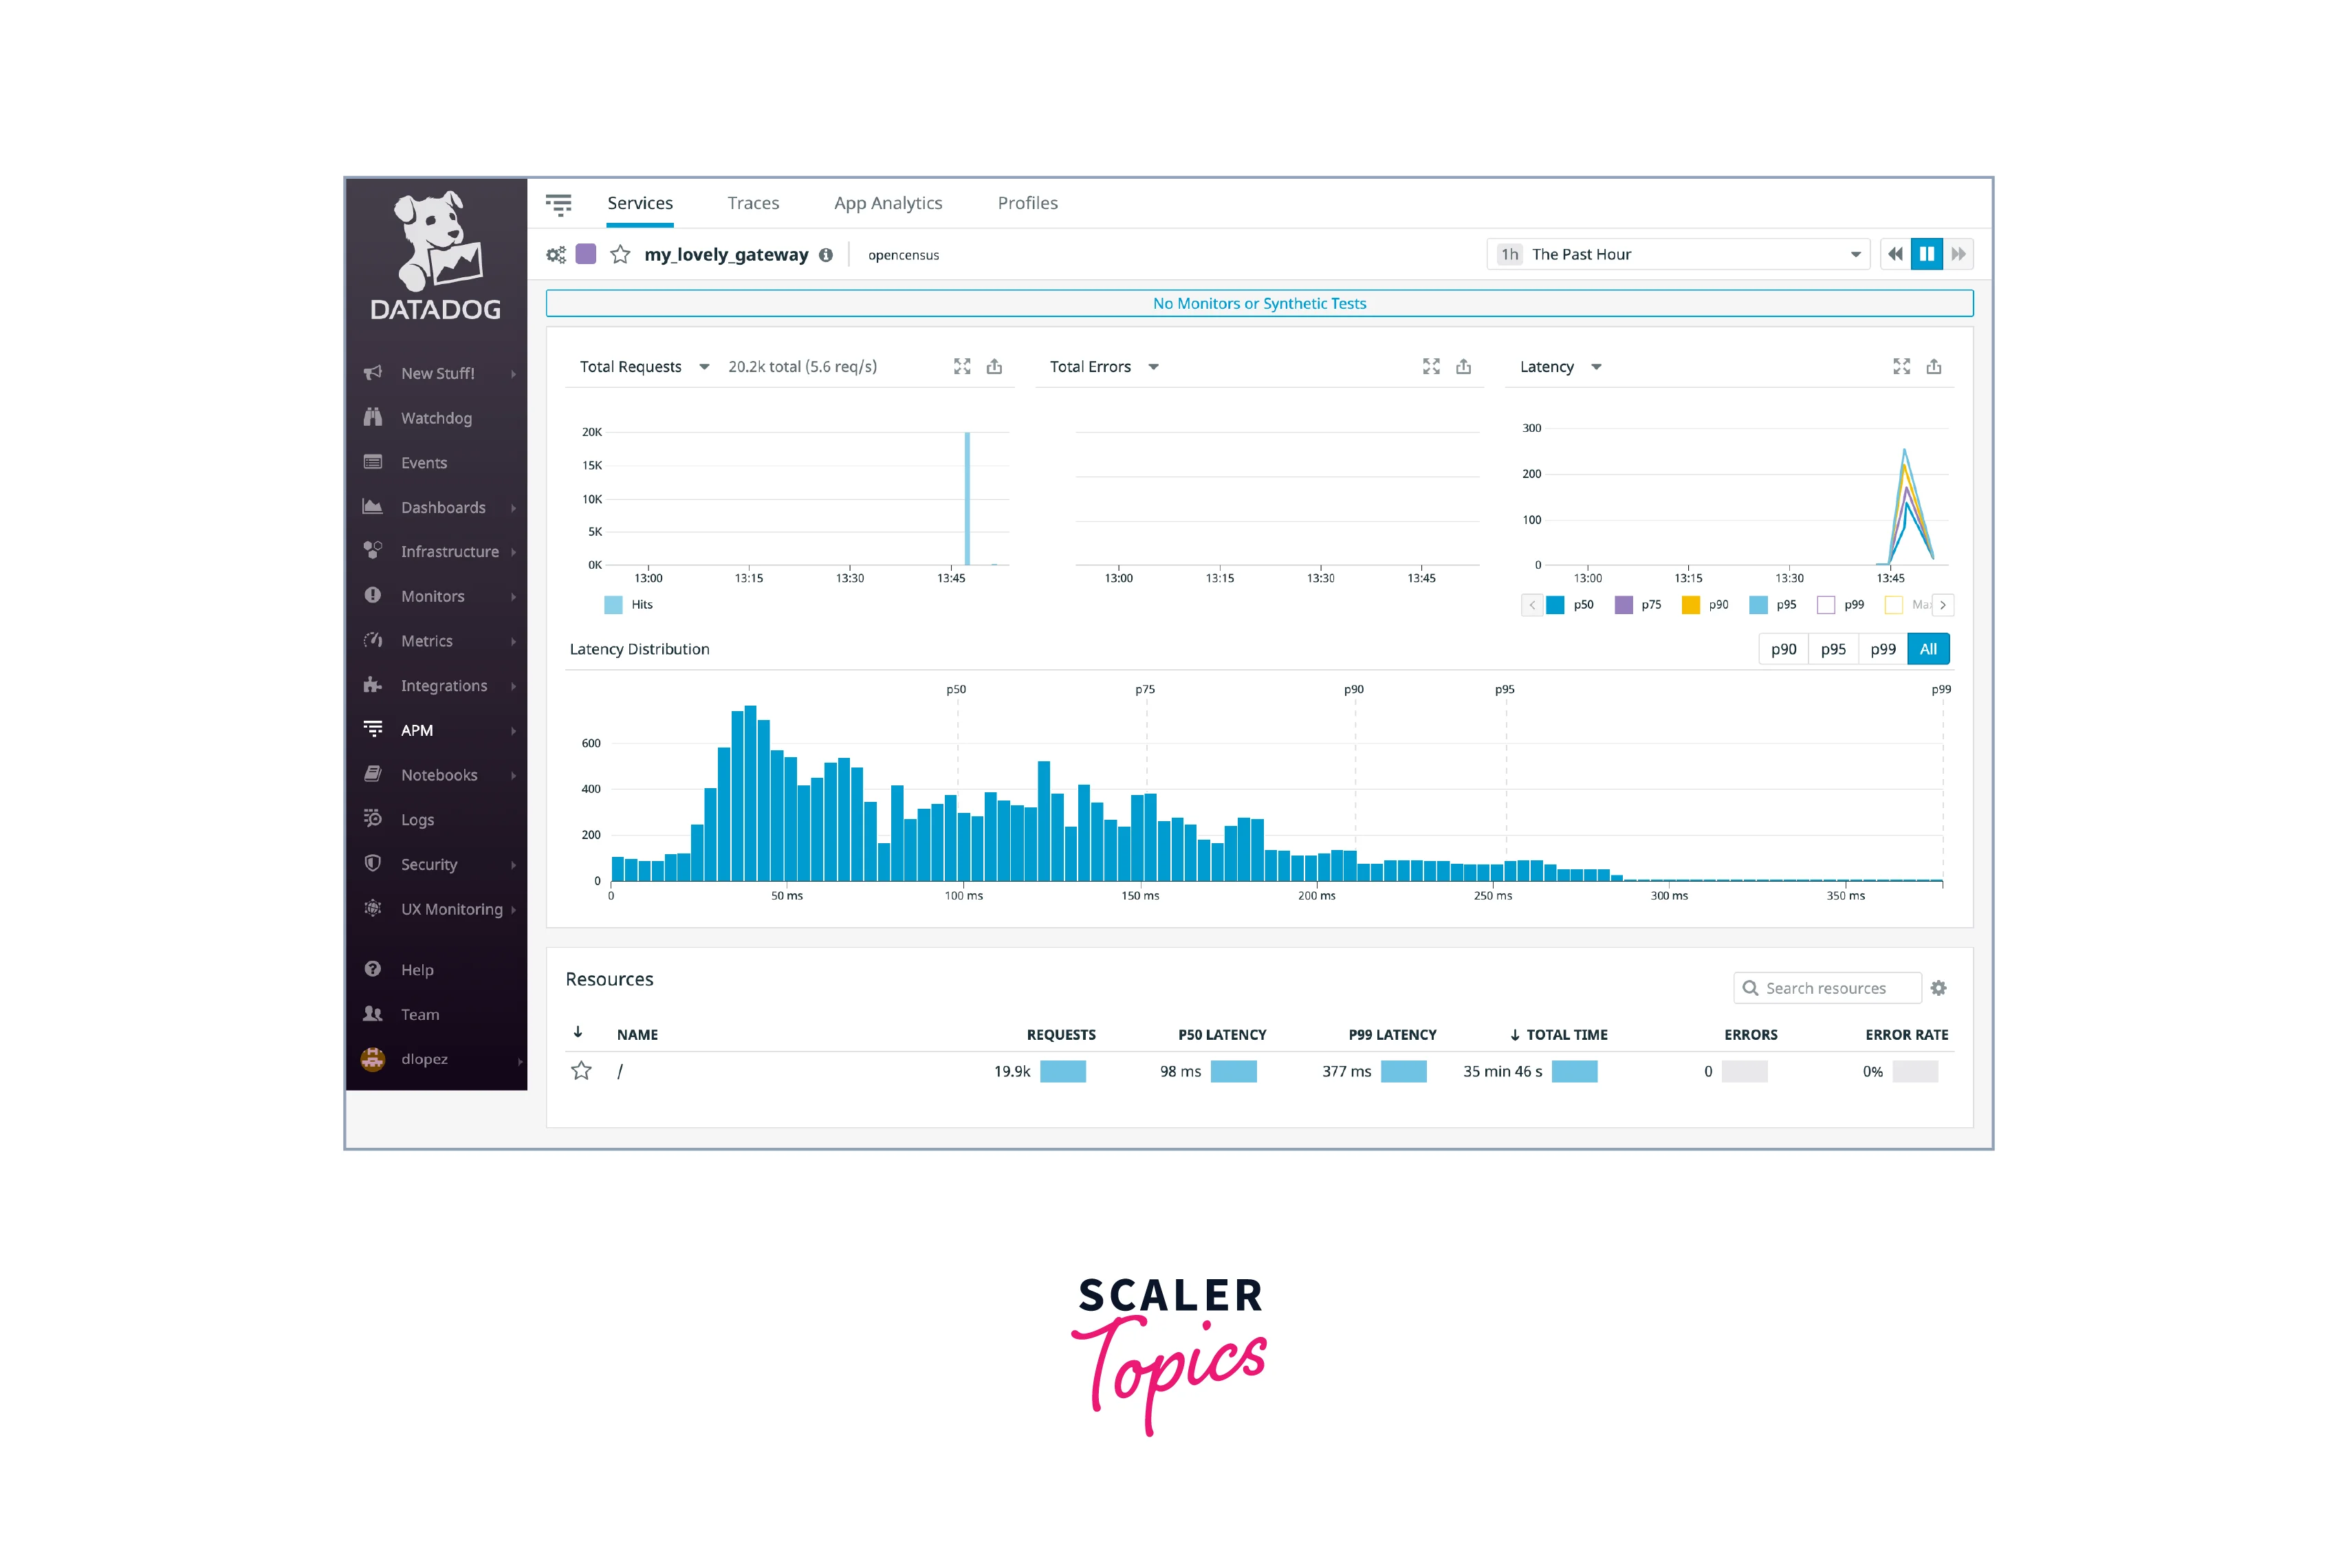
Datadog
Datadog is a cloud-scale monitoring and analytics platform that provides real-time insights into the performance, availability, and security of applications, infrastructure, and cloud environments. While not exclusive to Azure, Datadog supports monitoring across a wide range of cloud platforms, making it suitable for multi-cloud or hybrid environments.
Features:
Key features of Datadog include:
- End-to-End Visibility: Datadog offers comprehensive visibility into applications and infrastructure, allowing users to monitor and analyze metrics, logs, and traces from various sources.
- Application Performance Monitoring (APM): Datadog's APM capabilities enable users to track application performance, identify bottlenecks, and optimize code for better user experiences.
- Infrastructure Monitoring: The platform supports monitoring of Azure infrastructure, including virtual machines, storage, databases, and networking components.
- Security Monitoring: Datadog provides security monitoring by detecting and alerting on suspicious activities and potential threats across applications and infrastructure.
- Customizable Dashboards: Users can create custom dashboards to visualize key metrics and data points, facilitating quick insights into the health of resources.
- Alerting and Notifications: Datadog offers customizable alerts and notifications based on predefined conditions, helping users stay informed about important events.
- Multi-Cloud Support: While Azure is supported, Datadog also works with other cloud platforms, allowing organizations with diverse cloud environments to monitor and manage their resources effectively.
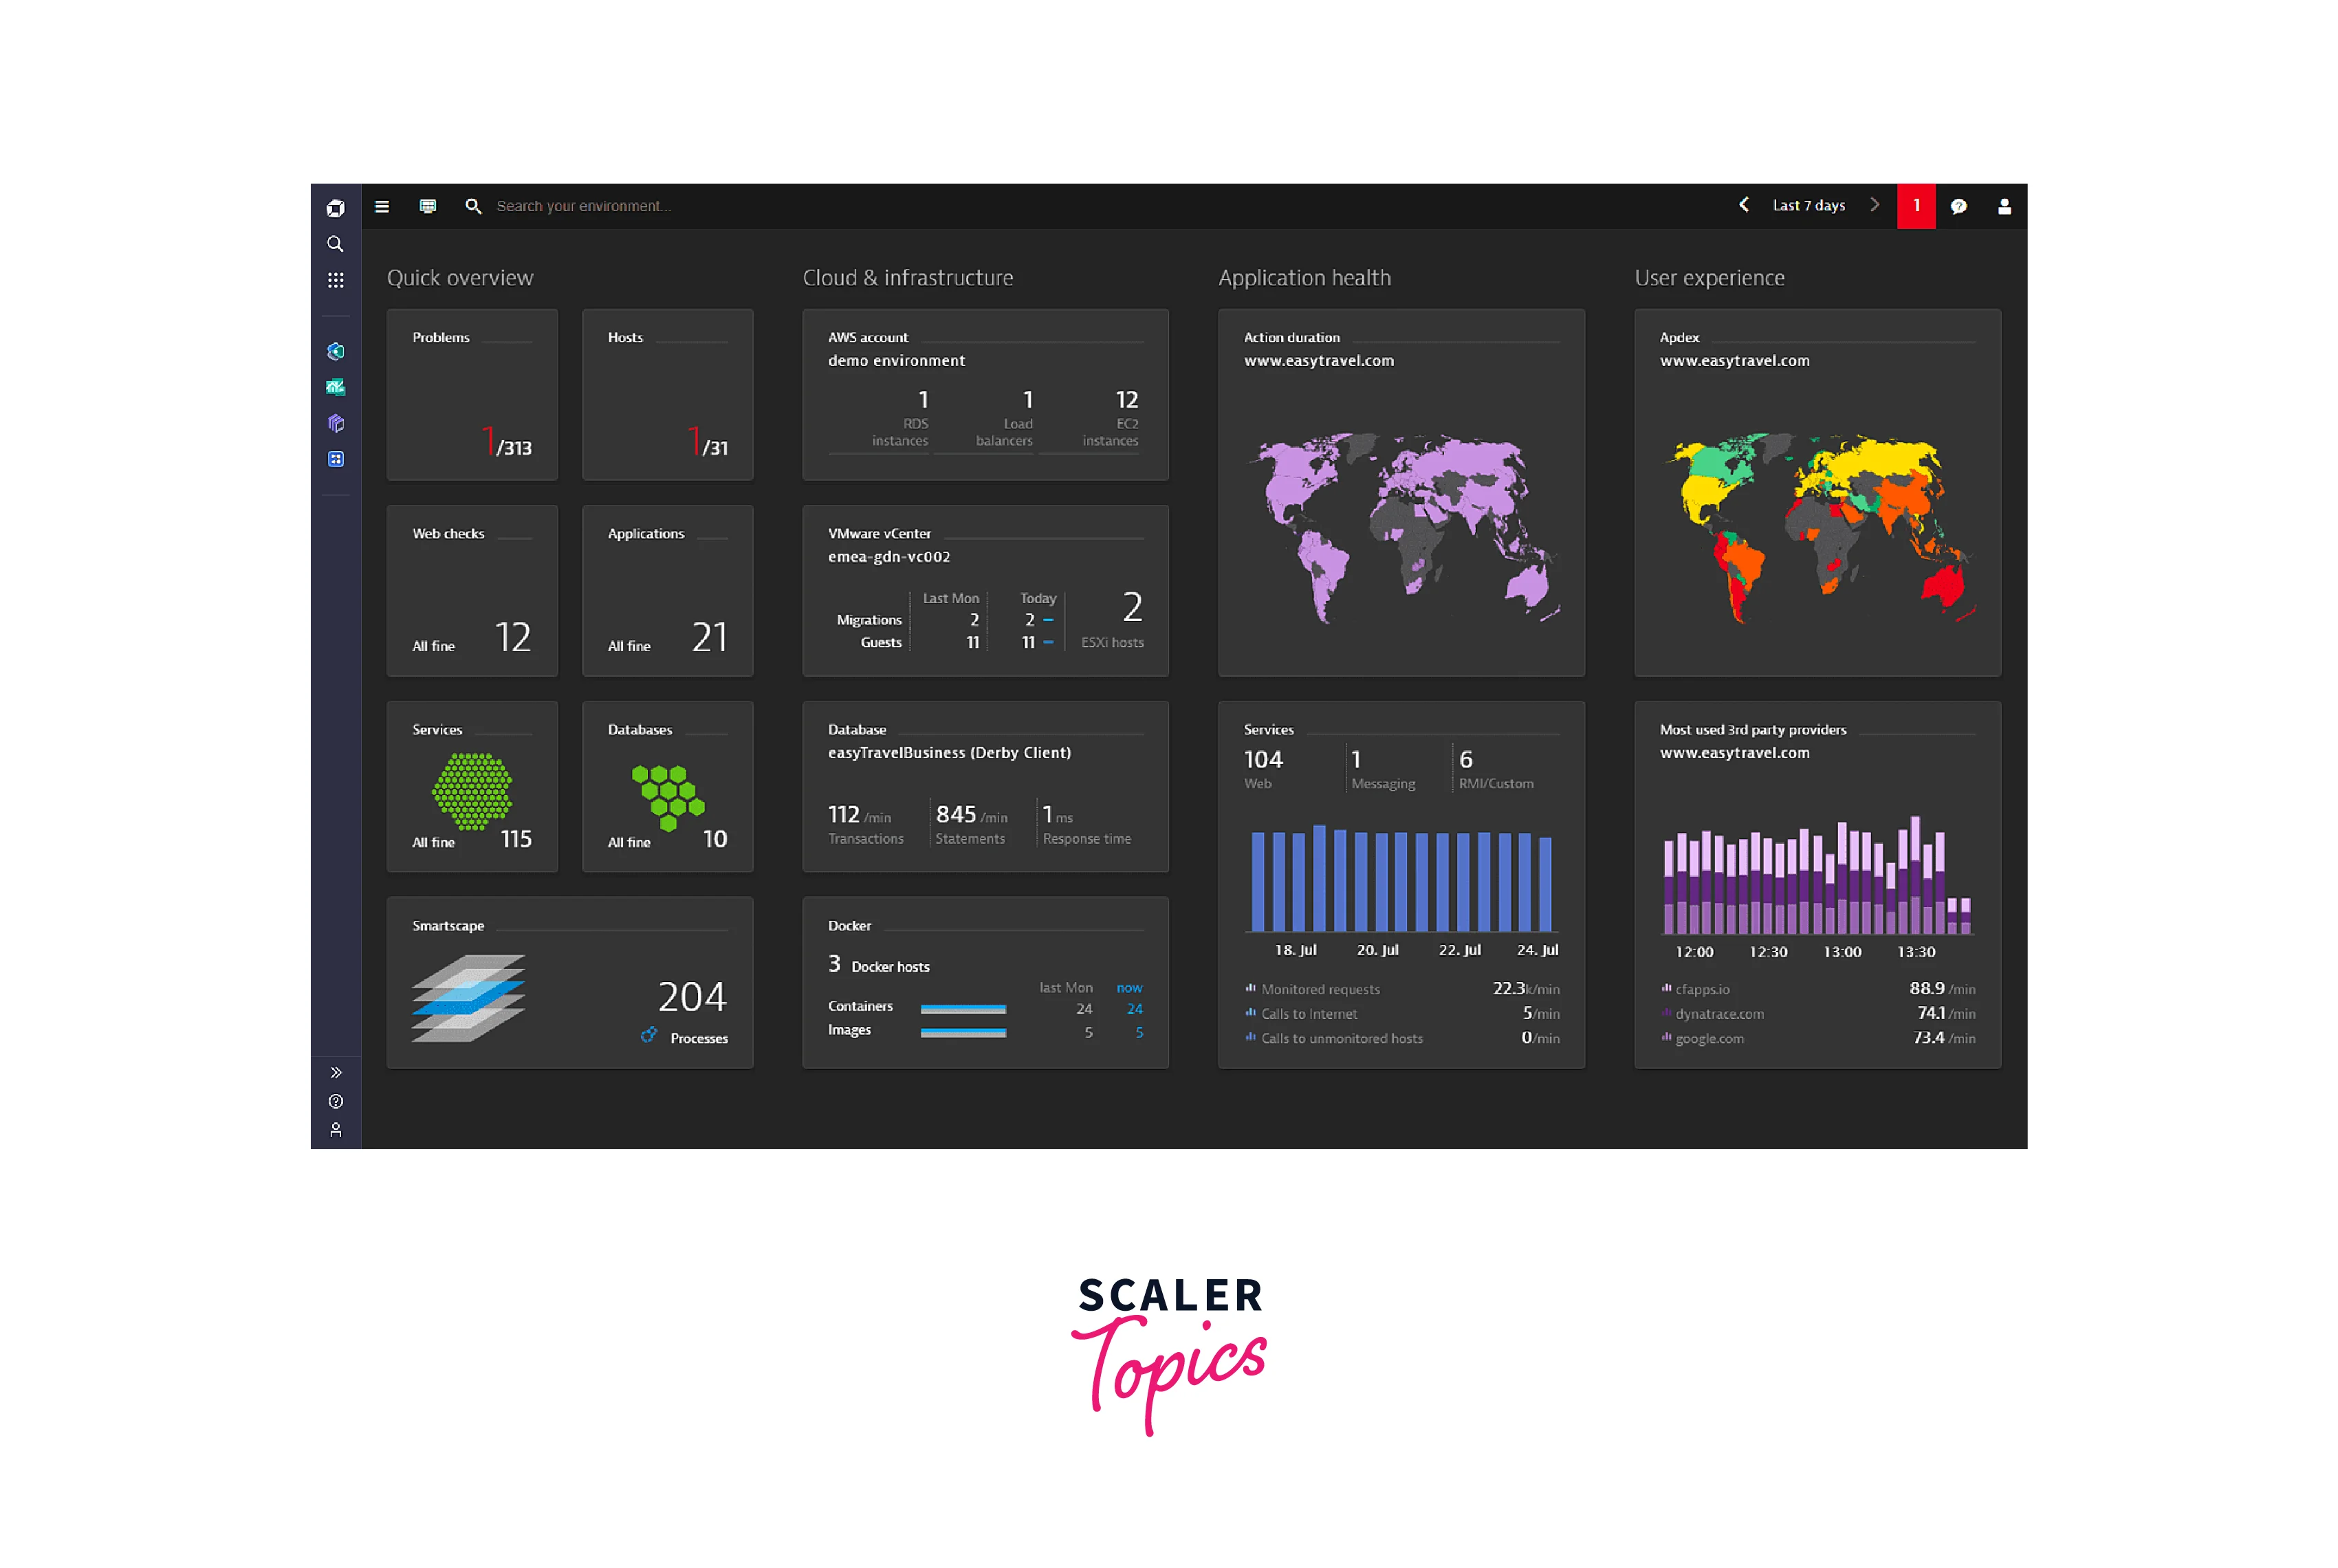
Dynatrace
Dynatrace is an intelligent application performance management (APM) platform that focuses on monitoring, analyzing, and optimizing the performance of applications, infrastructure, and user experiences. While not exclusive to Azure, Dynatrace supports a wide range of cloud environments, making it suitable for organizations with diverse cloud or hybrid setups.
Features:
Key features of Dynatrace include:
- AI-Powered Monitoring: Dynatrace leverages artificial intelligence to automatically detect anomalies, performance issues, and bottlenecks in real-time, providing actionable insights.
- Application Performance Monitoring (APM): The platform offers deep insights into application behavior, code-level performance, and transaction traces, helping users identify issues that impact user experiences.
- Infrastructure Monitoring: Dynatrace monitors the underlying infrastructure, including cloud services, virtual machines, containers, and networks, to ensure optimal performance.
- User Experience Monitoring: The platform tracks user interactions and experiences, helping identify user pain points and areas for optimization.
- Auto-Remediation: Dynatrace supports auto-remediation by automatically triggering actions to resolve performance issues, ensuring minimal impact on users.
- AI-Powered Analytics: The platform provides AI-driven analytics to analyze patterns, trends, and correlations across various data sources, aiding in proactive issue resolution.
- Cloud and Multi-Cloud Support: Dynatrace supports monitoring in various cloud environments, including Azure, AWS, and Google Cloud, making it suitable for organizations with multi-cloud or hybrid setups.
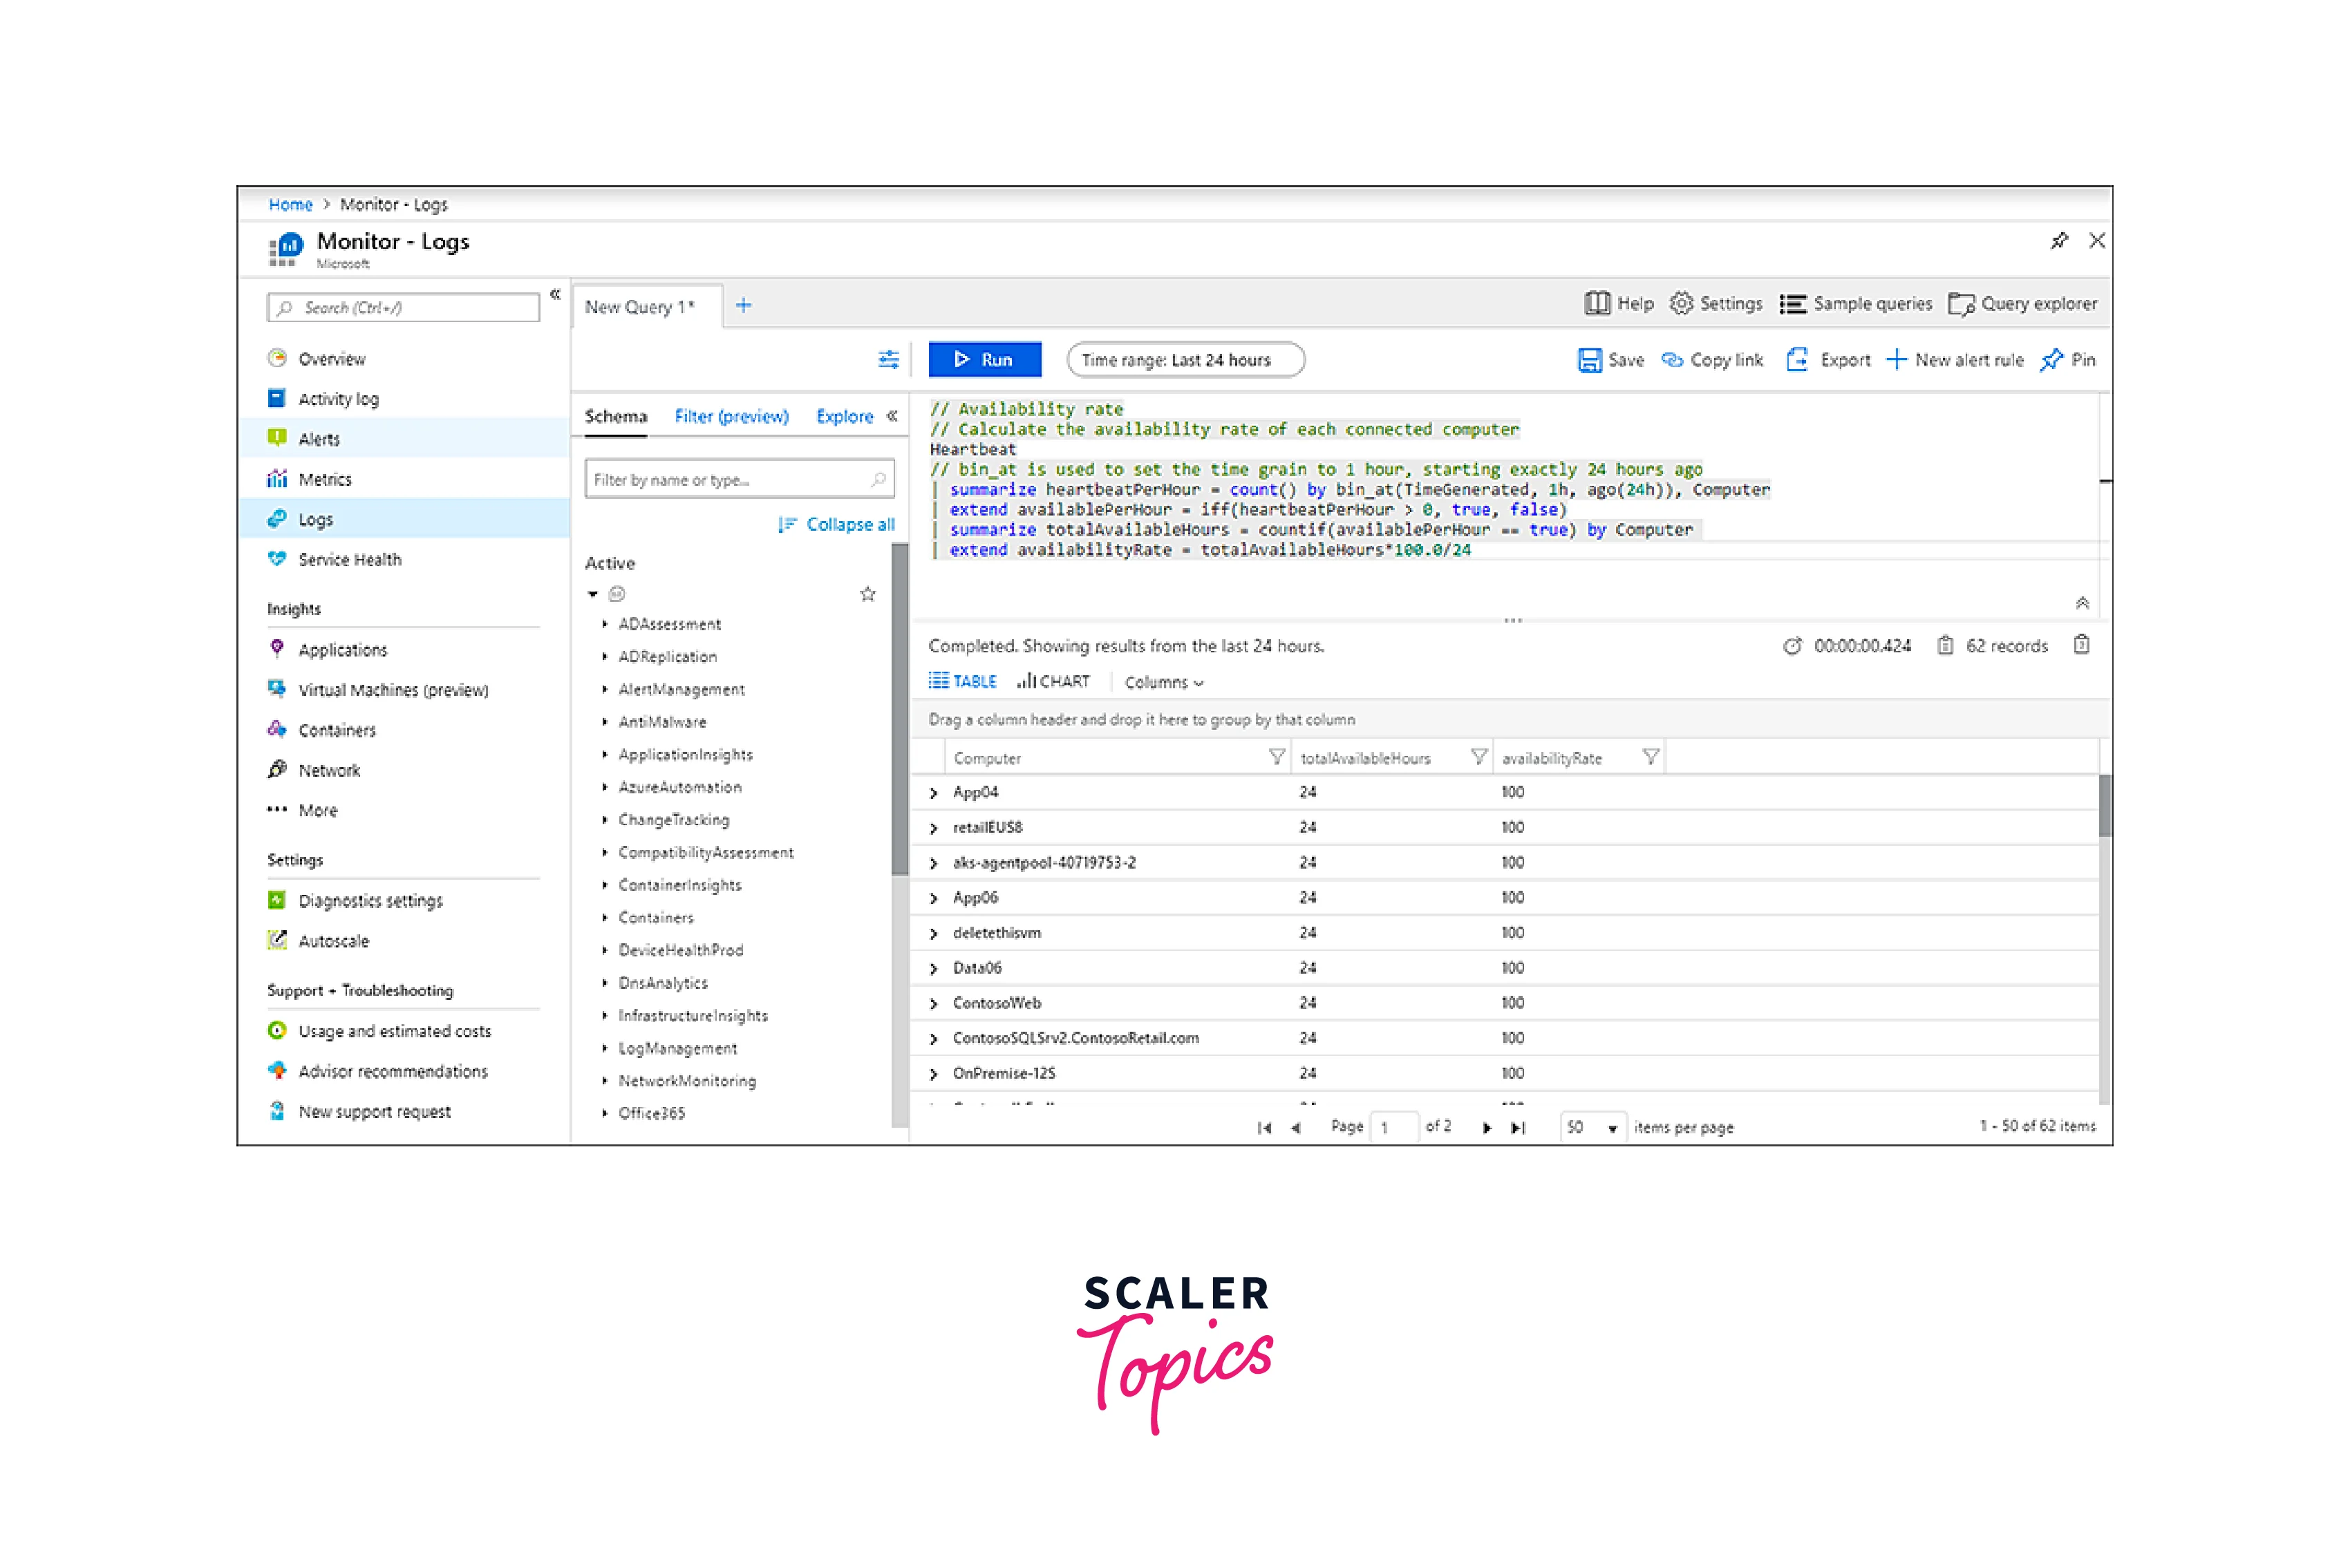
Log Analytics
Log Analytics is a service provided by Microsoft Azure that focuses on collecting, analyzing, and visualizing log data from various sources across your applications and infrastructure. It's a critical tool for gaining insights into the operational health of your resources and troubleshooting issues effectively.
Features:
Key features of Log Analytics include:
- Log Data Collection: Log Analytics aggregates log data from different Azure services and applications, as well as external sources, into a centralized repository for analysis.
- Custom Log Queries: Users can write custom queries using the Kusto Query Language (KQL) to analyze log data, uncover patterns, and gain insights into application behavior.
- Visualization: The platform offers visualization options like charts and graphs to help you understand and present log data trends and anomalies.
- Alerts and Notifications: Users can set up alerts based on specific log events, helping them stay informed about critical incidents or anomalies.
- Dashboards and Workbooks: Log Analytics allows you to create custom dashboards and interactive workbooks to display log data and insights in a user-friendly format.
- Integration with Azure Monitor: Log Analytics is part of the Azure Monitor suite and can be integrated with other Azure monitoring and alerting tools.
- Automation and Remediation: You can use Log Analytics data to trigger automation workflows and remediation processes based on specific log events.
New Relic
New Relic is an observability platform that specializes in monitoring and analyzing the performance of applications, infrastructure, and user experiences. It provides insights into various aspects of your digital environment to help you identify and address issues that impact the overall performance and user satisfaction.
Features:
Key features of New Relic include:
- Application Performance Monitoring (APM): New Relic offers APM capabilities to monitor the performance of applications, track transaction traces, and identify performance bottlenecks.
- Infrastructure Monitoring: The platform monitors the underlying infrastructure, including hosts, containers, and cloud services, to ensure they are performing optimally.
- User Experience Monitoring: New Relic tracks user interactions and experiences, helping you understand how users engage with your applications and identifying areas for improvement.
- Real-Time Alerts: Users can set up real-time alerts and notifications based on predefined conditions, ensuring quick responses to performance anomalies.
- End-to-End Visibility: The platform provides end-to-end visibility by tracing requests across different components, from the frontend to the backend.
- Custom Dashboards: New Relic allows users to create customizable dashboards and visualizations to display key metrics and insights in a visually appealing manner.
- AI-Powered Insights: The platform uses AI-driven analytics to identify patterns, anomalies, and trends within your application and infrastructure data.
Nodinite
Nodinite is a platform designed for business process monitoring, integration, and communication. It focuses on providing insights into the health, performance, and reliability of various business processes and integrations across different systems and applications.
Features:
Key features of Nodinite include:
- Business Process Monitoring: Nodinite allows users to monitor and visualize business processes, workflows, and integrations. It provides insights into process health and performance.
- Integration Monitoring: The platform supports monitoring and tracking of integrations between different systems, helping users identify bottlenecks and issues.
- Incident Management: Nodinite facilitates incident management by providing alerts and notifications for process failures or deviations from expected behavior.
- Custom Dashboards: Users can create customized dashboards to visualize key metrics and performance indicators related to their business processes and integrations.
- Message Tracking: The platform offers message tracking capabilities, allowing users to trace the flow of messages between systems and applications.
- Automated Documentation: Nodinite helps automate documentation of processes and integrations, aiding in maintaining a comprehensive overview of your environment.
Splunk
Splunk is a powerful data analytics and monitoring platform that focuses on helping organizations collect, analyze, and gain insights from large volumes of data, including logs, events, and metrics. While not exclusively focused on Azure, Splunk supports various cloud and on-premises environments.
Features:
Key features of Splunk include:
- Data Collection and Indexing: Splunk allows you to collect and index data from various sources, including logs, events, and metrics, making it accessible for analysis.
- Search and Analysis: The platform provides a robust search and query language, enabling you to search, analyze, and visualize data to gain insights into your applications and infrastructure.
- Real-Time Monitoring: Splunk supports real-time monitoring and alerting, allowing you to set up alerts based on specific conditions or events.
- Visualization and Dashboards: Splunk offers visualization capabilities to create custom dashboards and reports that display key metrics and trends.
- Machine Learning and AI: Splunk integrates machine learning and AI capabilities to help you detect anomalies, predict trends, and gain deeper insights from your data.
- Security and Compliance: The platform includes features for security information and event management (SIEM), assisting in security monitoring and compliance reporting.
- Custom Apps and Integrations: Splunk supports custom apps and integrations to extend its capabilities and integrate with other tools and services.
Conclusion
- Azure Monitoring Tools are a set of powerful resources to oversee the health, performance, and security of applications, services, and infrastructure hosted on the Azure cloud platform.
- Some of the best azure monitoring tools are Serverless360, Site24x7, M365 Manager Plus, Better Stack, Application Insights, Azure Monitoris, etc.
- Serverless360 is a specialized tool for monitoring Azure serverless applications and resources.
- Site24x7 is a comprehensive monitoring tool for websites, applications, servers, and networks.
- M365 Manager Plus is a management and reporting solution for Microsoft 365 services.