Azure Metrics
Overview
Azure Metrics is a pivotal feature in Microsoft Azure, providing real-time insights into the performance, health, and usage of various Azure resources. It offers both standard and custom metrics, enabling comprehensive monitoring and analysis. Through data collection, REST API integration, and robust security with Azure RBAC, Azure Metrics ensures that users have secure and versatile access to vital telemetry data. With tools like the Metrics Explorer, users can delve into multi-dimensional metrics, making informed decisions based on structured time-series data. Azure Metrics thus stands as a cornerstone for effective cloud resource management in the Azure ecosystem.
What is Azure Metrics?
Azure Metrics is a feature within Microsoft Azure that enables users to collect, analyze, and act on telemetry data from Azure resources. It's designed to provide real-time visibility into the performance, health, and utilization of services deployed on the Azure platform. By offering a detailed view of various metrics, Azure Metrics plays a crucial role in diagnosing issues, identifying trends, and optimizing resource usage.
This service includes a range of standard metrics for common Azure resources and also allows the creation of custom metrics tailored to specific monitoring needs. Azure Metrics simplifies the complex task of cloud monitoring, providing users with essential data to maintain and improve their applications and services efficiently.
Types of Metrics
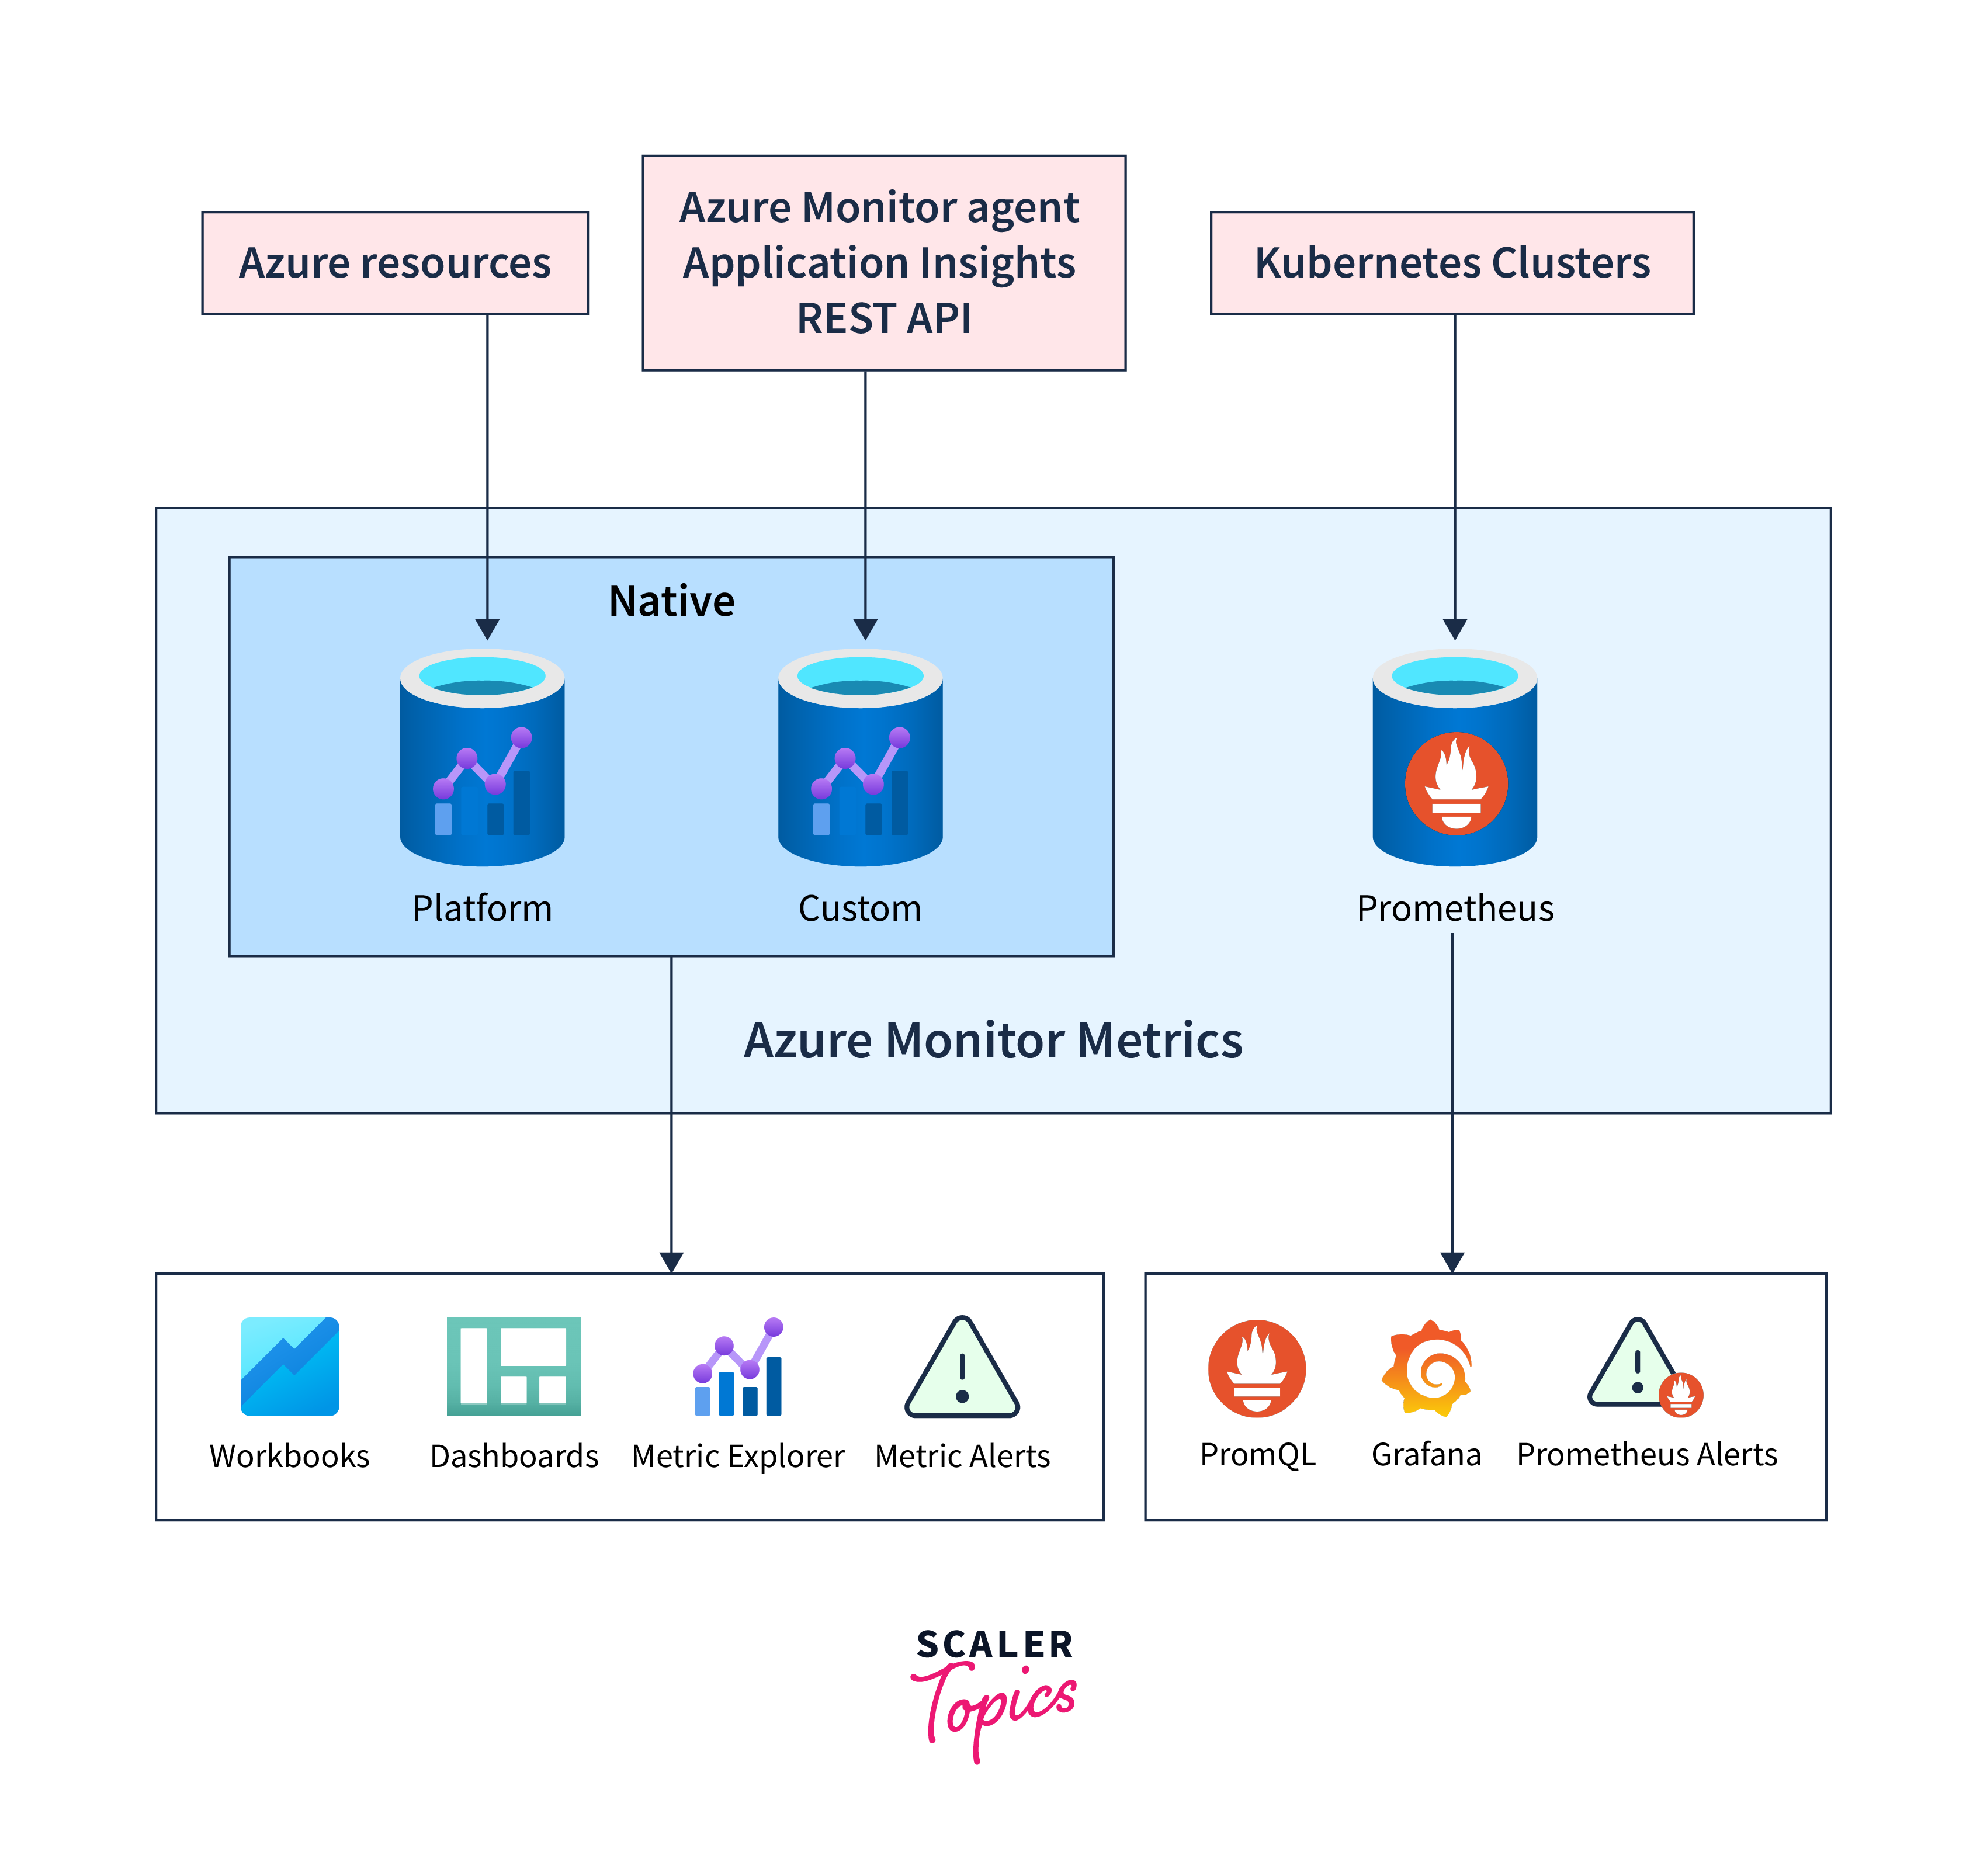
Azure Monitor Metrics in Microsoft Azure encompasses a variety of metric types, each designed for specific monitoring purposes:
- Native Metrics:
These are metrics that leverage Azure Monitor’s own tools for analysis and alerting, providing immediate insights from within the Azure platform. - Platform Metrics:
These are the metrics that Azure automatically gathers from its resources. They're convenient as they require no setup and incur no additional costs. Platform metrics offer a straightforward way to monitor the health and performance of Azure services.
- Custom Metrics:
These are metrics gathered from sources configured by the user, including applications and agents on virtual machines. Custom metrics allow for personalized monitoring solutions beyond what standard metrics offer. - Prometheus Metrics:
These metrics are specifically collected from Kubernetes clusters, such as Azure Kubernetes Service (AKS), and utilize standard industry tools like PromQL and Grafana for analysis and alerting.
Here's a comparative overview of these metric types:
| Aspect | Native Platform Metrics | Native Custom Metrics | Prometheus Metrics |
|---|---|---|---|
| Source of Data | Direct from Azure Resources | Via Azure Monitor agent, Application Insights, or REST API | From AKS or any Kubernetes cluster through remote-write |
| Setup Required | None | Dependent on source | Activation of Azure Monitor service for Prometheus |
| Storage Location | Within Subscription | Within Subscription | In Azure Monitor workspace |
| Associated Cost | None | Yes | Yes, but free during preview |
| Data Aggregation | Automatically aggregated | Automatically aggregated | Provided as raw data |
| Tools for Analysis | Metrics Explorer | Metrics Explorer | PromQL, Grafana dashboards |
| Alerting Mechanism | Through metrics alert rules | Through metrics alert rules | Using Prometheus alert rules |
| Visualization Options | Workbooks, Azure dashboards, Grafana | Workbooks, Azure dashboards, Grafana | Primarily through Grafana |
| Data Retrieval Methods | Azure CLI, Azure PowerShell cmdlets, REST API or client libraries in various languages | Same as Native Platform Metrics | Mainly through Grafana |
Each metric type within Azure Monitor Metrics offers distinct functionalities and advantages, enabling users to tailor their monitoring strategy to their specific needs and preferences in the Azure ecosystem.
Data Collection
Azure Monitor adeptly collects metrics from diverse sources, and once these metrics are stored in the Azure Monitor metric database, they can be analyzed together, irrespective of their origin:
- Azure Resources:
Platform metrics, generated by Azure resources, offer critical insights into their health and performance. Each resource type produces its unique set of metrics automatically, requiring no setup. Typically, platform metrics from Azure resources are gathered every minute, although this frequency may vary based on the specific metric's definition. - Applications:
Application Insights generates metrics for monitored applications, assisting in identifying performance issues and tracking usage trends. These metrics include vital data points like Server response time and Browser exceptions. - Virtual Machine Agents:
Metrics are also sourced from the guest operating system of virtual machines. For Windows virtual machines, guest OS metrics can be activated using the Windows diagnostic extension, while for Linux virtual machines, the InfluxData Telegraf agent is used. - Custom Metrics:
Beyond the standard metrics that are automatically available, users have the option to define custom metrics. These can be configured within an application monitored by Application Insights or created for an Azure service through the custom metrics API. - Kubernetes Clusters:
Kubernetes clusters typically relay metric data to a locally maintained Prometheus server. However, Azure Monitor's managed service for Prometheus offers a streamlined solution that collects metrics from Kubernetes clusters and stores them in Azure Monitor Metrics.
REST API
Azure Monitor offers a suite of REST APIs that facilitate the efficient movement and management of data within Azure Monitor Metrics.
- API for Custom Metrics:
This API empowers you to import your own metrics into the Azure Monitor Metrics database. Once uploaded, these custom metrics become accessible for analysis via the same tools used for Azure Monitor’s native platform metrics. - Azure Monitor Metrics REST API:
This API provides access to the definitions and values of Azure Monitor platform metrics. For comprehensive details, you can refer to the Azure Monitor REST API documentation. Additionally, a practical guide on utilizing this API is available in the Azure monitoring REST API walkthrough. - Azure Monitor Metrics Data Plane REST API:
Tailored for high-volume usage, this API is ideal for scenarios involving large-scale metrics queries. While it shares similarities with the standard Azure Monitor Metrics REST API, it boasts the capability to retrieve metric data for up to 50 resource IDs within the same subscription and region through a single batch API call. This feature significantly enhances query efficiency and minimizes the risk of throttling.
Security
Azure Metrics prioritizes security by integrating robust measures to safeguard metrics data. It utilizes Role-Based Access Control (RBAC) to ensure that only authorized users can access or modify metrics. Data encryption is rigorously implemented, protecting data both at rest and in transit. Compliance with industry standards, regular security updates, and stringent network security measures further fortify the integrity of Azure Metrics. Additionally, auditing and monitoring tools provide transparency, allowing administrators to track access and usage, ensuring a secure and reliable monitoring environment within the Azure ecosystem.
Metrics Explorer
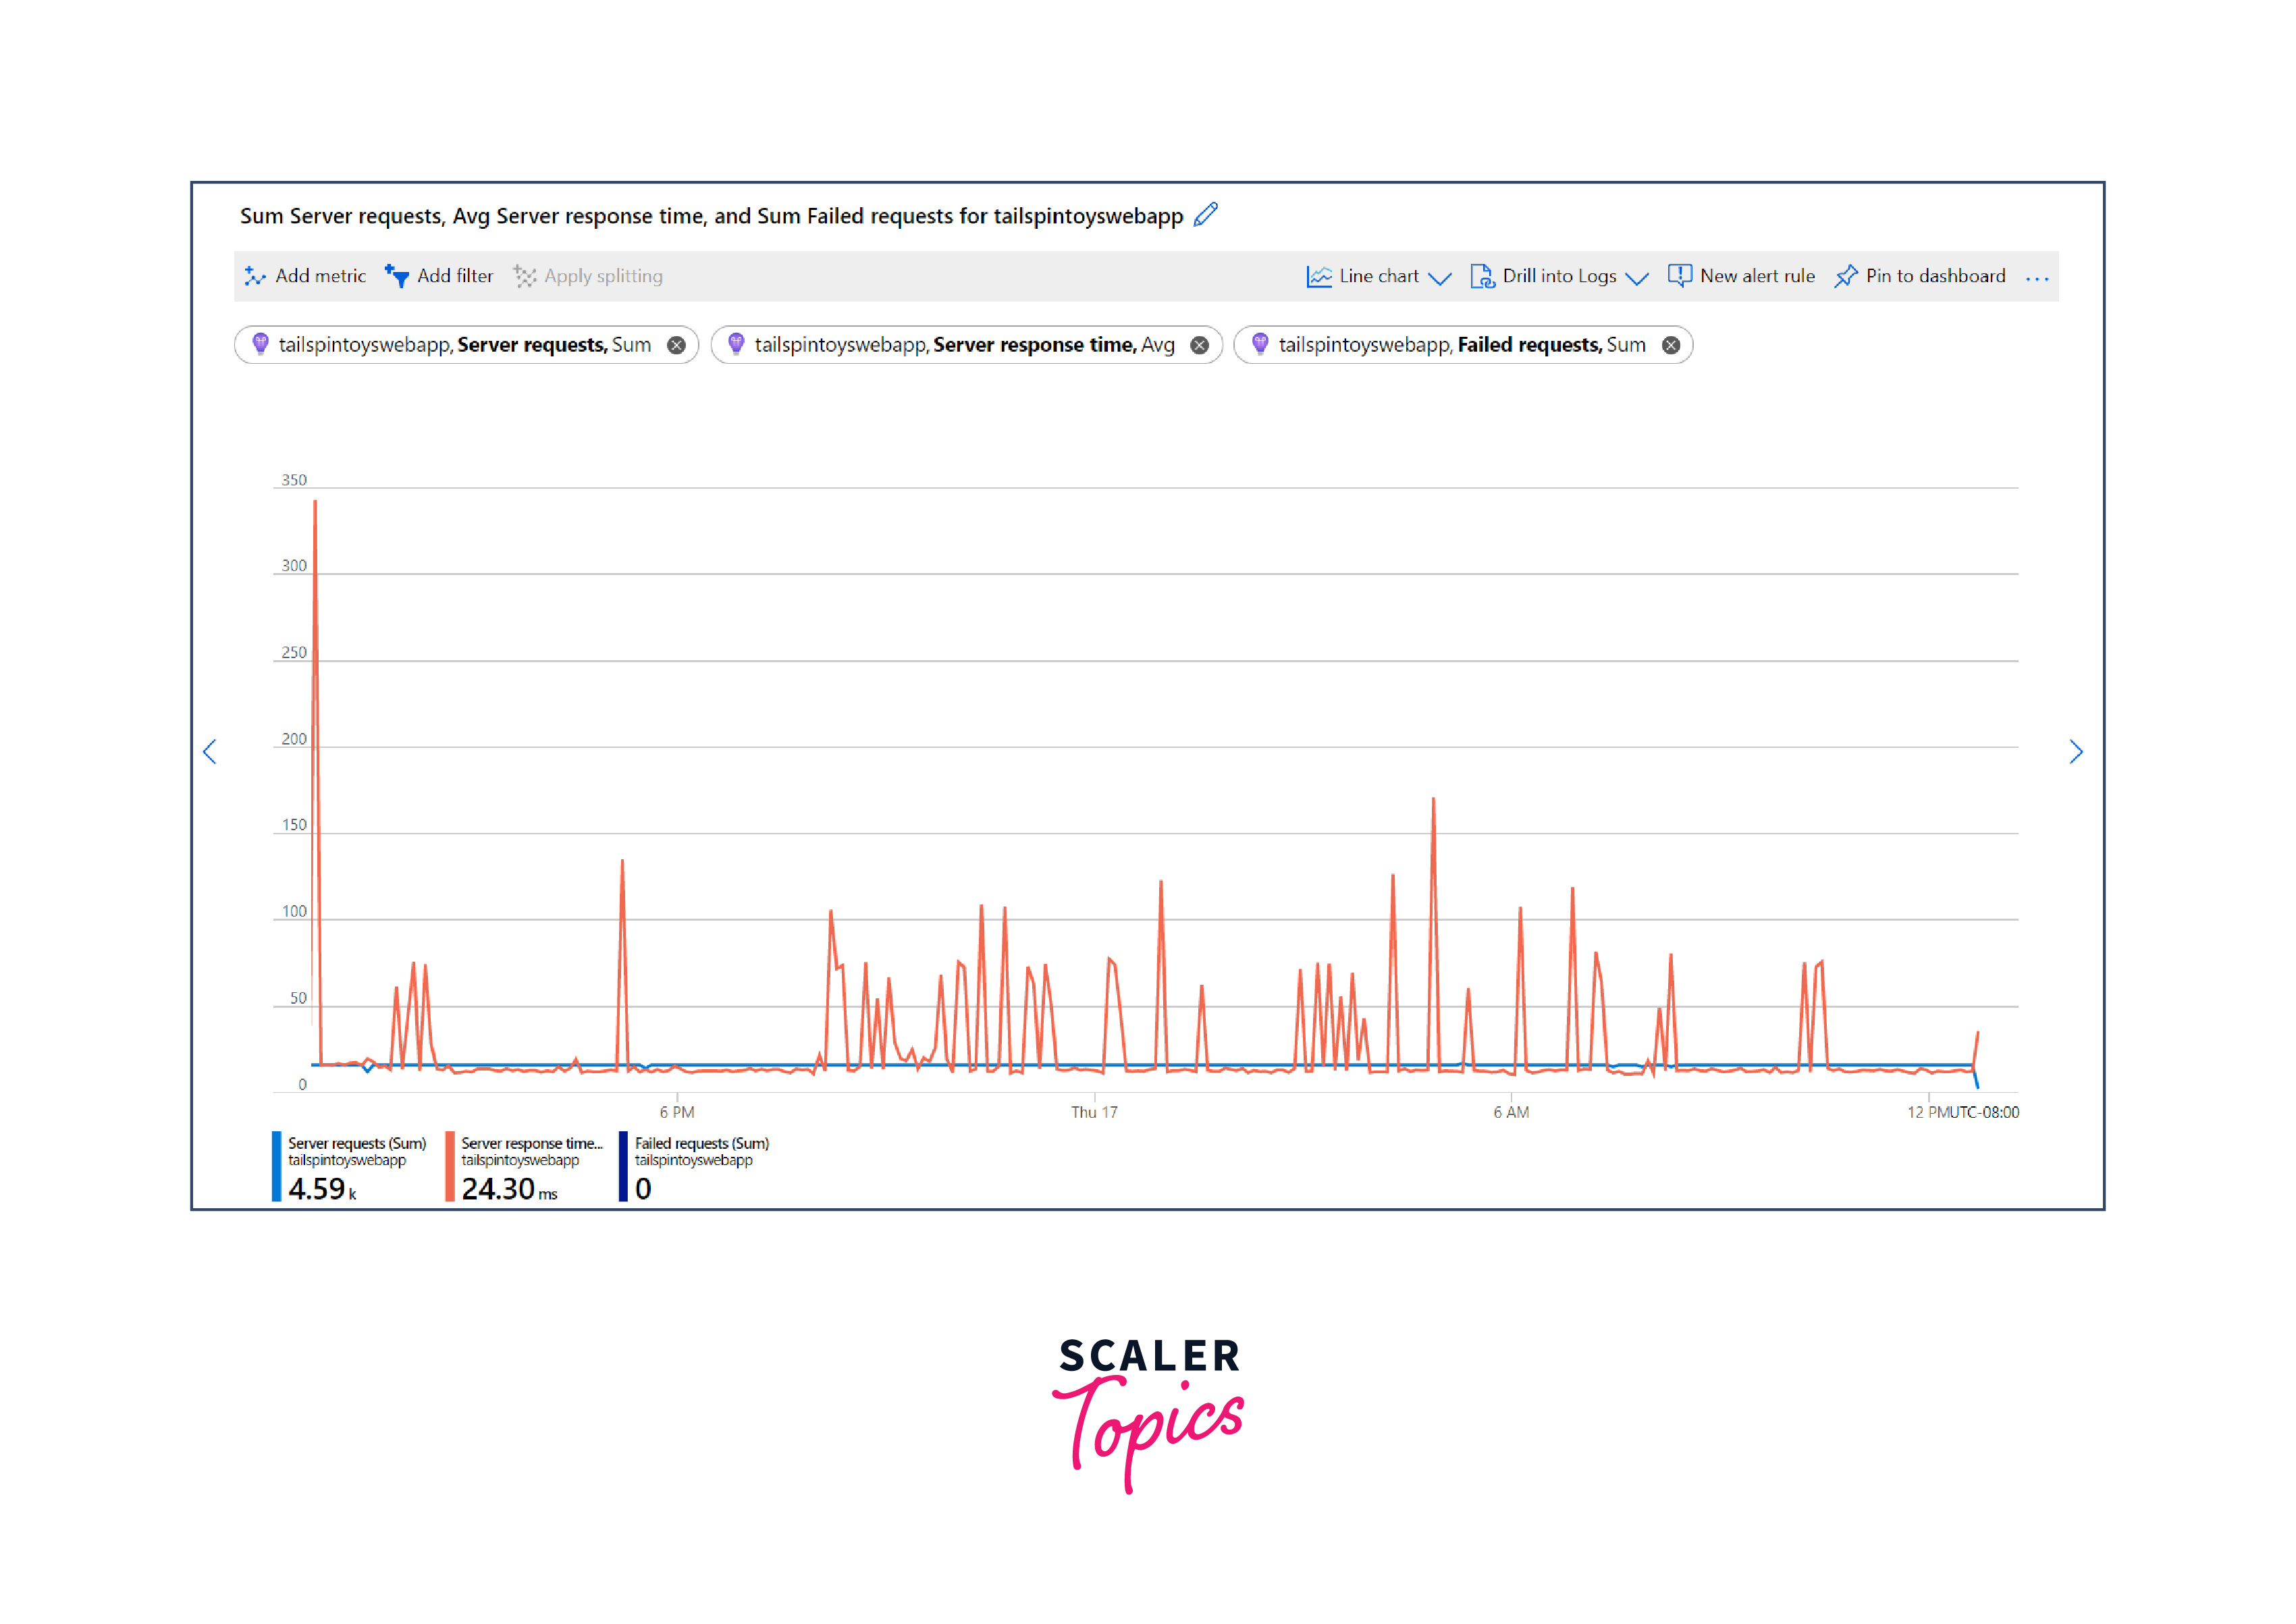
Metrics Explorer in Azure is a versatile tool within the Azure Portal that enables users to visualize and analyze metrics across various Azure resources. It provides a user-friendly interface where you can effortlessly create, customize, and pin charts that display metrics data over time. Metrics Explorer allows users to filter, aggregate, and segment data, offering insights into the performance and health of Azure services. With capabilities for setting time ranges, comparing metrics, and exploring multi-dimensional data, it serves as a critical tool for real-time monitoring and informed decision-making in the Azure environment.

Data Structure
The data structure of Azure Metrics is designed to efficiently organize and manage the vast amount of metrics data generated by Azure services. At its core, the data structure is time-series based, where each data point consists of a metric value recorded at a specific timestamp. These metrics are stored in a hierarchical manner, starting from the Azure subscription level down to individual resources.
Each metric typically includes the following components:
- Metric Name:
A unique identifier for the metric, describing what is being measured, such as CPU usage or disk read/write operations. - Timestamp:
The specific point in time when the metric was recorded. - Metric Value:
The actual data point or measurement for the metric at that particular timestamp. - Dimensions:
These are attributes or tags that provide additional context to the metric, allowing for more granular analysis. Dimensions can include information like the region, instance type, or any other relevant detail. - Aggregation Type:
Metrics often include aggregated data over a period, such as the average, sum, minimum, or maximum values.
Multi-dimensional Metrics
Multi-dimensional metrics in Azure represent a powerful feature that adds depth and flexibility to the monitoring and analysis of Azure resources. Unlike simple metrics, which provide a singular data point, multi-dimensional metrics offer multiple data points, each differentiated by one or more dimensions. These dimensions are essentially attributes or tags that provide additional context, allowing for more detailed and nuanced insights.
Retention of Metrics
Azure Metrics implements a defined retention policy for metrics data, ensuring that historical data is available for analysis over a specified period. Typically, Azure retains metrics for a default duration of 90 days, allowing users to access and analyze historical performance and usage data within this timeframe. This retention policy strikes a balance between providing sufficient historical insight for trend analysis and optimization, and managing storage resources efficiently within the Azure environment.
Integration and Compatibility
Azure Metrics seamlessly integrates with a suite of Azure services and tools, creating a cohesive monitoring ecosystem. It acts as the foundational data layer for Azure Monitor, which aggregates and analyzes performance data. Metrics can be correlated with logs in Azure Log Analytics, providing a more comprehensive diagnostic context. Furthermore, Azure Application Insights leverages Azure Metrics for detailed application telemetry, enabling developers to monitor live applications and detect performance anomalies. This integration facilitates a unified approach to monitoring across services, applications, and infrastructure within the Azure cloud, providing users with the tools needed for end-to-end visibility and deep analytical insights.
Best Practices
To optimize the use of Azure Metrics, it is recommended to strategically set up alerts for key performance indicators to ensure prompt issue detection and resolution. Creating dashboards that effectively visualize the most critical metrics can provide quick insights into system health and trends at a glance. When structuring metric names and dimensions, adopt a consistent and descriptive naming convention that reflects the metric's purpose, and use dimensions judiciously to enable efficient slicing and dicing of data without creating unnecessary complexity. Additionally, regularly review and adjust your metrics strategy to align with evolving monitoring needs and to maintain operational performance at optimal levels.
Scalability
Azure Metrics is engineered to scale dynamically, catering to a diverse range of environments, from small-scale applications to large, complex deployments. Its robust backend can handle the ingestion of massive volumes of data points across multiple dimensions, ensuring that as an application or infrastructure grows, the monitoring capabilities of Azure Metrics scale accordingly. This scalability is facilitated by Azure's global infrastructure, which provides the necessary compute, storage, and networking resources to accommodate an increase in monitoring data without compromising performance. Consequently, Azure Metrics delivers consistent, reliable monitoring capabilities that can grow in tandem with your application's or organization's needs, making it an apt choice for businesses of all sizes.
Conclusion
- Azure Metrics offers a robust platform for monitoring the performance and health of Azure resources, providing critical insights for system optimization and decision-making.
- With features like multi-dimensional metrics and types ranging from native to custom and Prometheus metrics, Azure Metrics caters to a wide range of monitoring needs, offering depth and flexibility.
- Tools like Metrics Explorer and REST APIs facilitate easy access, visualization, and analysis of metrics data, enhancing the user experience and efficiency.
- Azure Metrics prioritizes security through measures like encryption, RBAC, and adherence to compliance standards, ensuring the integrity and safety of metrics data.
- Azure Metrics ensures scalability for varying workloads, effortlessly adapting to the needs of both small and large-scale applications with its globally distributed infrastructure.
