Azure Service Monitoring
Overview
This Scaler Topics article introduces Microsoft's Azure resource monitoring tool. It covers key features like metrics, logs, and application insights, providing a detailed understanding of optimizing performance and availability in the Azure cloud. The guide includes setting personalized alerts and utilizing advanced log analytics with Kusto Query Language (KQL) for seamless operations. It's suitable for both beginners and experienced users seeking to make the most of Azure Monitors for efficient cloud operations.

What is Azure Monitoring?
Azure Monitoring is a vital tool provided by Microsoft for gaining insights into the performance and health of applications and services within the Azure ecosystem. It serves as a comprehensive solution for tracking the behaviour of various resources, ensuring they operate optimally and remain available. This monitoring system collects and analyzes data from different sources, enabling you to make informed decisions and take proactive steps to address any potential issues.
How does it Work?
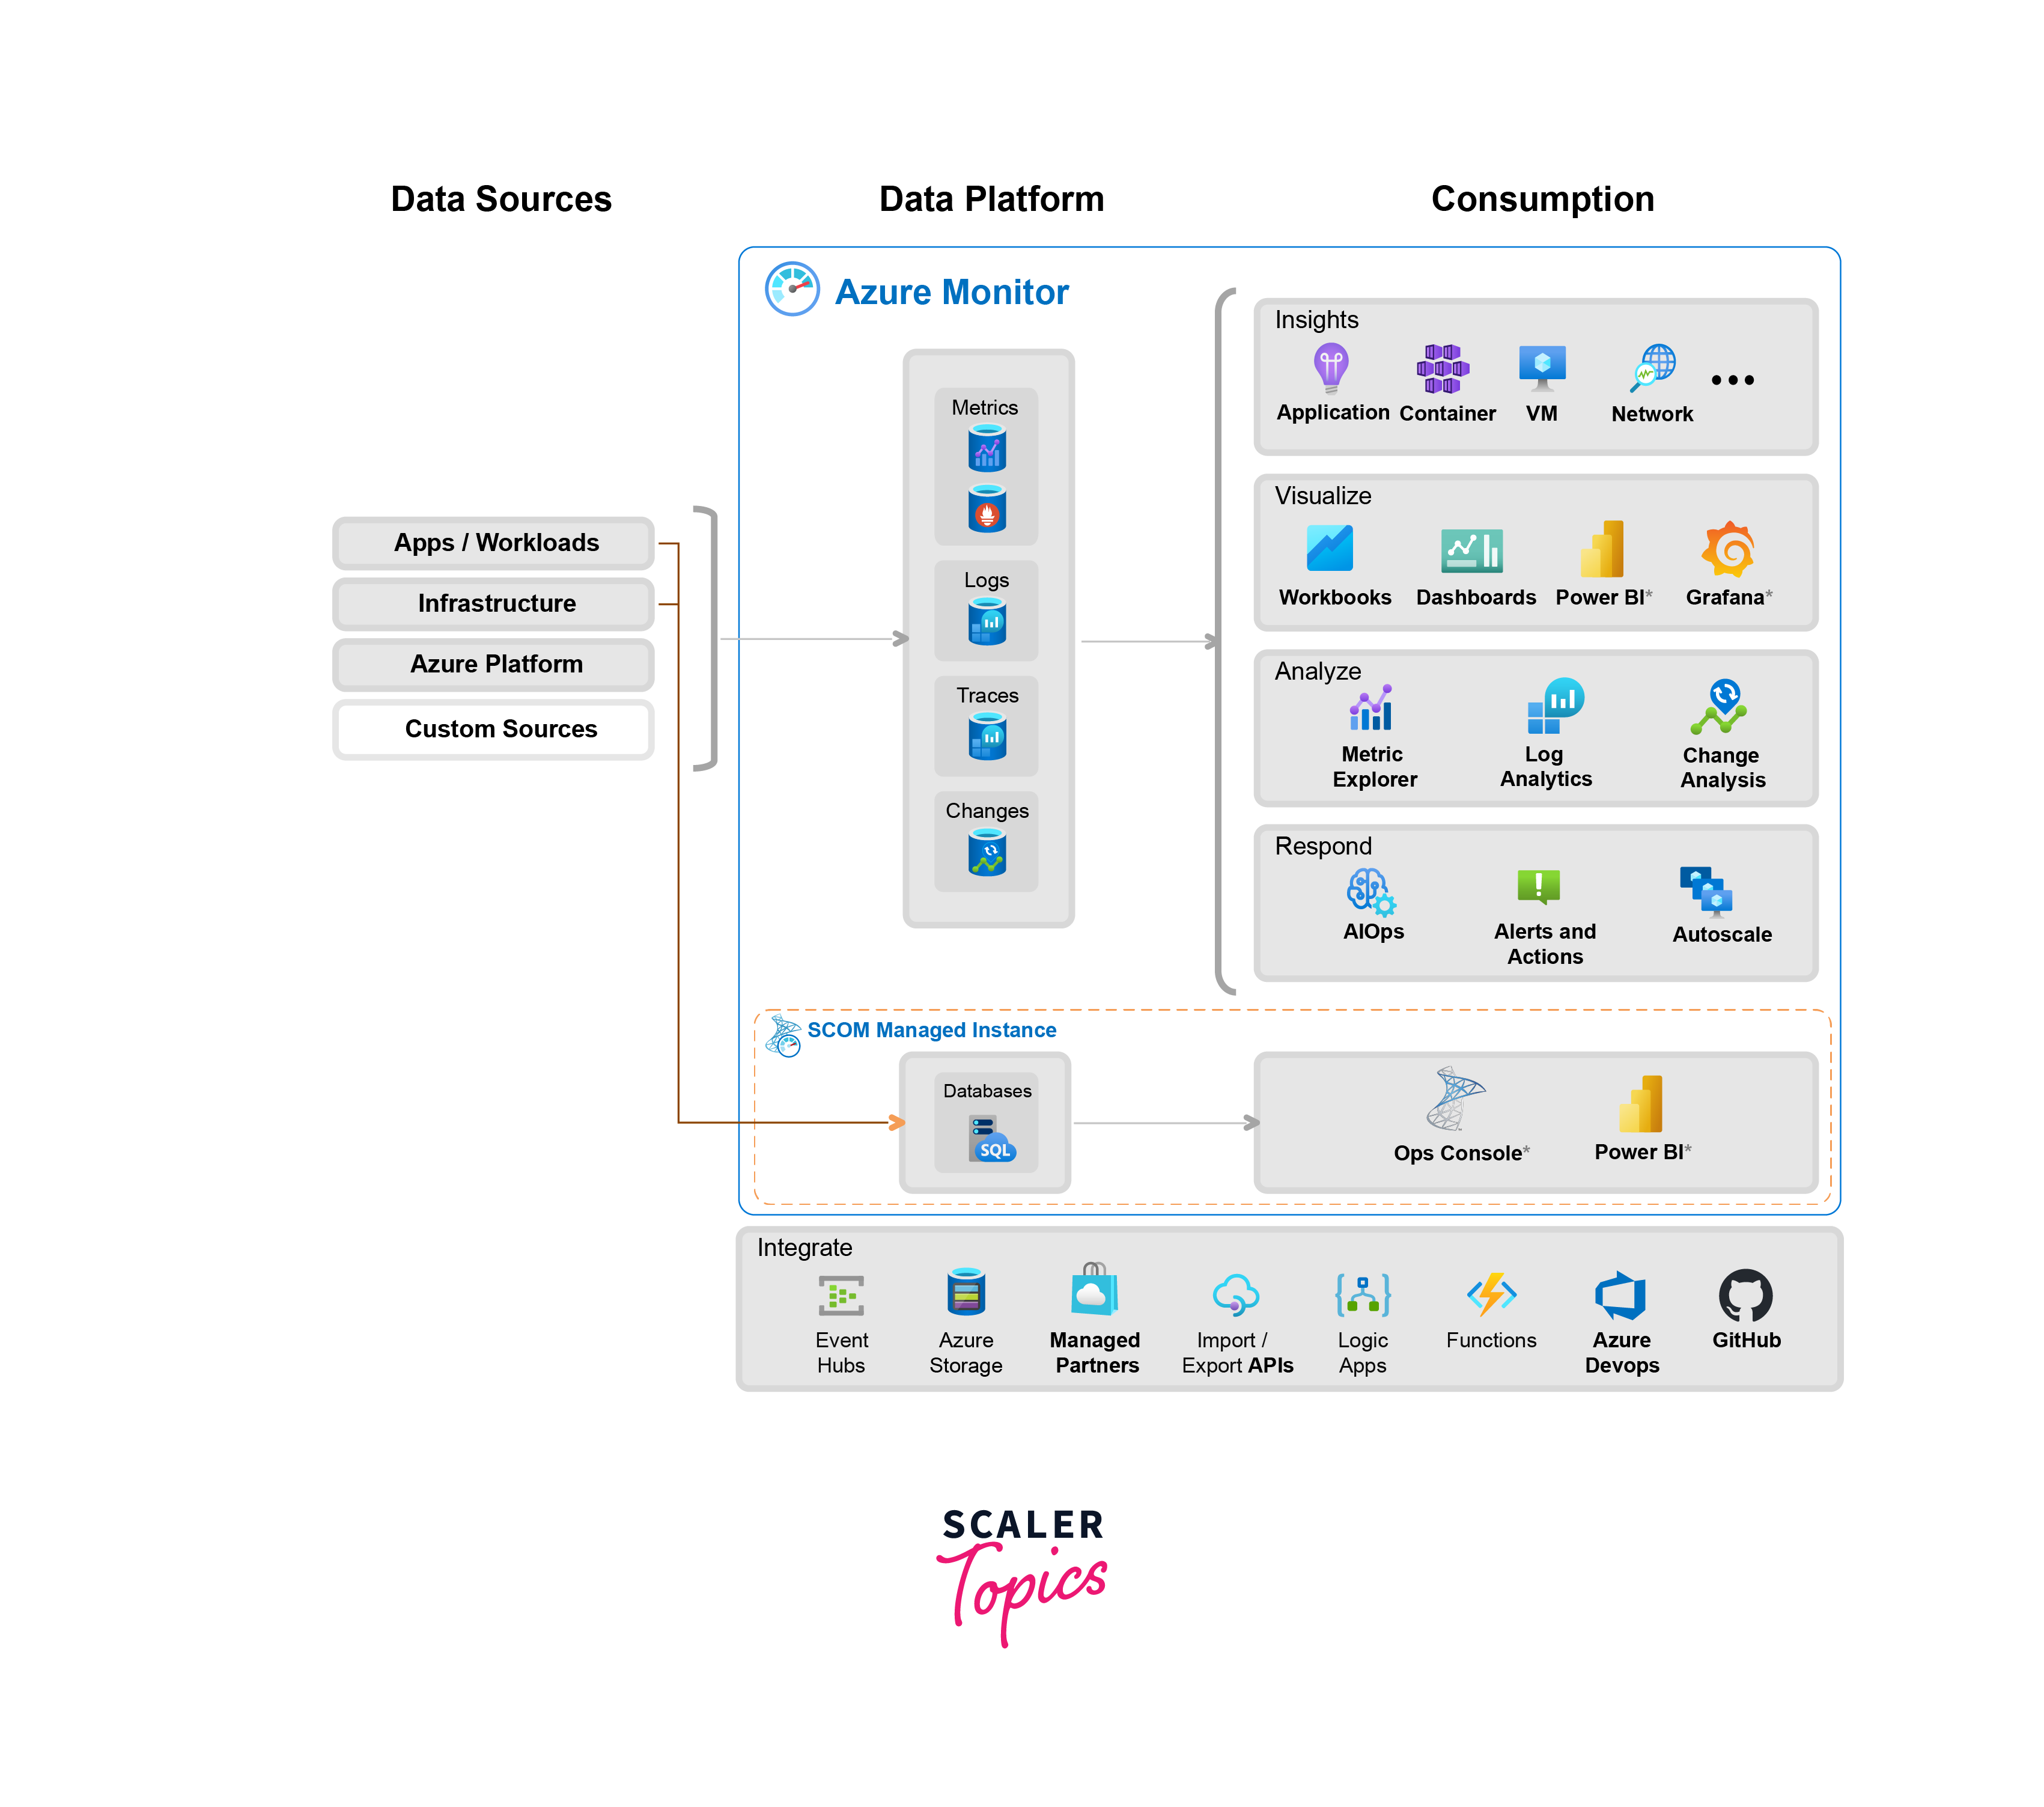
Azure Monitoring is made up of several essential components, each designed to cater to specific monitoring needs:
Metrics
Metrics form the backbone of Azure Monitoring. They provide numerical data about the performance of resources, such as virtual machines, databases, and web applications. These metrics cover a wide range of parameters, including CPU usage, memory utilization, network traffic, and more. By visualizing and analyzing these metrics, you can identify trends, pinpoint performance bottlenecks, and make necessary adjustments to enhance efficiency.
Logs and Analytics
Azure Monitor also captures log data from various sources like applications, virtual machines, and platform services. This data is stored centrally, allowing you to perform powerful queries using the Kusto Query Language (KQL). With log analytics, you can dive deep into the details, gaining valuable insights into the behaviour and interactions of your resources.
Application Insights
For developers, Application Insights is a critical component of Azure Monitoring. It offers a specialized set of tools for tracking and understanding the performance of applications. Developers can monitor response times, detect failures, and trace dependencies, enabling them to fine-tune code and optimize user experiences.
Alerts and Notifications
Azure Monitor provides a robust alerting system, allowing you to set up customized alerts based on specified conditions. This feature ensures that you are promptly notified of any anomalies or performance deviations. Whether it's a sudden spike in resource consumption or an application error, timely alerts help you take immediate action to rectify the situation.
Service Health
Keeping track of the health of Azure services is crucial for maintaining uninterrupted operations. Azure Monitor's Service Health feature provides real-time updates and personalized alerts about service issues, ensuring you are aware of any disruptions that may affect your applications.
What are the Insights in Azure Service Monitoring?
Azure Service Monitoring gives you important information about how well your Azure services and applications are working. This information is crucial for keeping them running smoothly and quickly fixing any problems that might come up. Let's explore some of the key insights offered by Azure Service Monitoring:
- Performance Metrics: Azure Service Monitoring offers a rich set of performance metrics for various Azure resources. These metrics include crucial parameters such as CPU utilization, memory usage, network latency, and request rates. By analyzing these metrics, you gain a detailed understanding of how your services are performing, enabling you to fine-tune configurations for optimal efficiency.
- Error and Exception Tracking: Tracking errors and exceptions is important for ensuring the reliability of your applications. Azure Service Monitoring provides detailed logs and metrics related to errors, exceptions, and failed requests. This insight allows you to identify and address issues promptly, enhancing the overall robustness of your applications.
- Dependency Tracking: Understanding the dependencies of your applications is essential for troubleshooting and optimizing performance. Azure Service Monitoring allows you to track dependencies on external services, databases, APIs, and more. This insight helps you pinpoint potential bottlenecks and optimize interactions with external resources.
- Response Time Analysis: Monitoring response times is critical for delivering a seamless user experience. Azure Service Monitoring provides detailed insights into the response times of your services. By analyzing this data, you can identify performance bottlenecks and take steps to optimize critical paths within your applications.
- Availability and Uptime: Ensuring high availability is a cornerstone of reliable service delivery. Azure Service Monitoring tracks the availability and uptime of your services, providing real-time updates on service health. This insight enables you to proactively address any downtime and minimize disruptions to your users.
Visualizations of Monitored Data
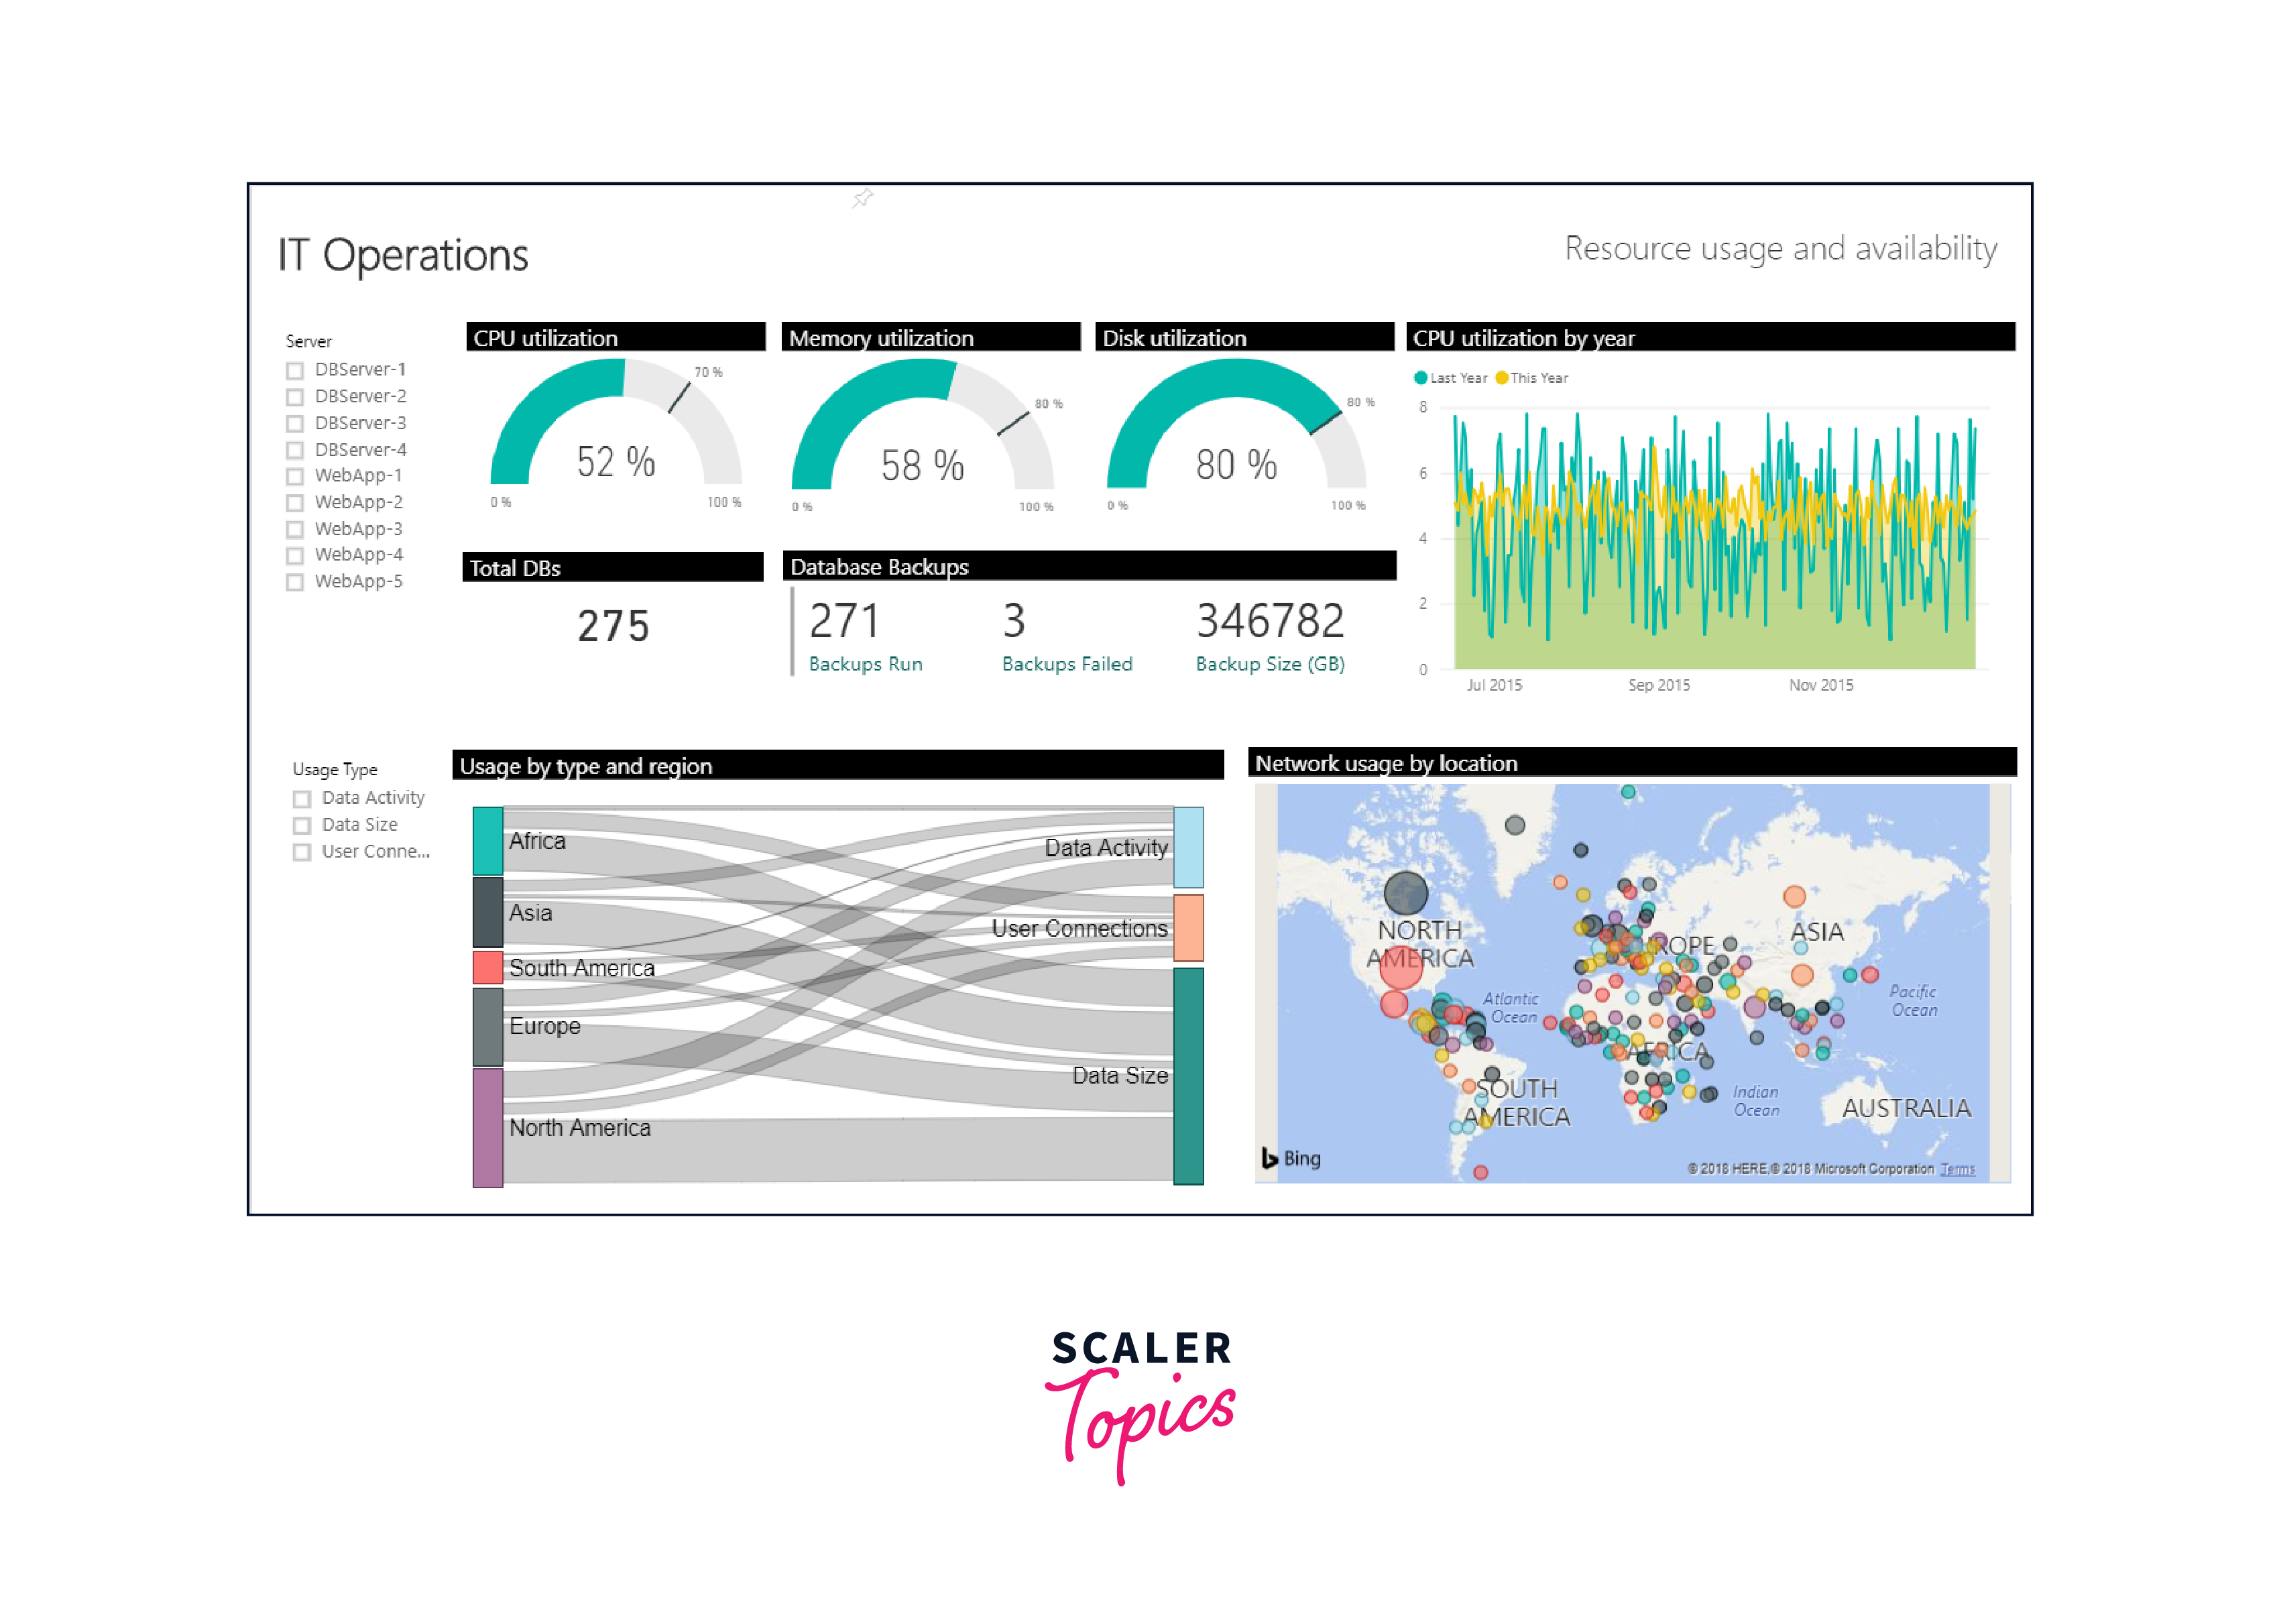
Here is a sample of how the visualization of the data presented by Azure Monitors looks like:

The key points to notice from the above visualization are as follows:
- Monitors showing CPU Utilization, Memory Utilization, Disk Utilization in terms of percentage.
- Count of total databases.
- The size of the data that is backed up and the number of successful and failed backup runs.
- Graph for year-wise CPU utilization.
- Graph for region-wise usage clubbed with the usage type.
- Network usage graph by location.
Responses and Integrations
One of the strengths of Azure Monitors lies in its ability to facilitate swift responses and seamless integrations within your monitoring ecosystem. This section dives into the key aspects of responses and integrations in Azure Monitors:
- Alerts and Notifications: Azure Monitors enables you to set up customized alerts based on specific conditions. These alerts act as early warning signals, promptly notifying you of any deviations or critical events. You can configure alerts to be delivered through various channels, including email, SMS, and webhook notifications. This ensures that you and your team are instantly aware of any issues that require attention.
- Automated Responses: Beyond simple alerts, Azure Monitors allows for automated responses to predefined conditions. Leveraging Azure Logic Apps or Azure Functions, you can set up automated workflows that kick into action when specific criteria are met. For example, you can automatically scale resources, restart services, or trigger other corrective actions, reducing the need for manual intervention.
- Third-Party Integrations: Azure Monitors seamlessly integrates with a wide array of third-party tools and services. This enables you to centralize monitoring data and correlate it with information from other platforms. Whether you use popular DevOps tools like Jenkins or collaboration platforms like Slack, Azure Monitors can be configured to share critical information and alerts, ensuring that your entire team stays in the loop.
- Service Management and Automation: Azure Monitors plays a pivotal role in service management and automation. By combining Azure Monitor with Azure Automation, you can implement sophisticated management tasks, such as configuration changes, patching, and scaling operations. This not only streamlines operations but also enhances the overall efficiency and reliability of your services.
- Incident Response and Remediation: In the event of an incident, Azure Monitors provides valuable data for incident response and remediation efforts. Through integration with incident management platforms like ServiceNow or Jira, you can seamlessly create and manage incidents, track progress, and ensure timely resolution. This holistic approach to incident management helps maintain service continuity and customer satisfaction.
Monitoring Tools
Let's explore some of the essential monitoring tools:
- Azure Metrics Explorer: Azure Metrics Explorer serves as a centralized dashboard for visualizing and analyzing metric data from various Azure resources. This tool allows users to create custom charts and graphs, enabling a detailed view of resource performance.
- Log Analytics Workspace: The Log Analytics Workspace provides a robust platform for collecting, analyzing, and querying log data from diverse sources. Using the powerful Kusto Query Language (KQL), users can perform advanced log analytics to gain deep insights into the behaviour of applications and services.
- Azure Network Watcher: For those focused on network monitoring, Azure Network Watcher is an invaluable tool. It provides a range of network diagnostic and visualization tools to help users gain insights into network performance, security, and compliance.
- Azure Security Center: While primarily focused on security, Azure Security Center also offers valuable monitoring capabilities. It provides insights into the security posture of Azure resources, identifies potential vulnerabilities, and offers recommendations for improving security configurations.
FAQs
Q1. How does Azure Monitor optimize resource performance?
A1: It provides metrics, logs, and alerts for tracking and proactively managing performance.
Q2: Can Azure Monitors integrate with third-party tools?
A2: Yes, it supports seamless integration with various external platforms.
Q3: Why are automated responses important in Azure Monitors?
A3: They enable instant actions for specific conditions, reducing manual intervention and improving efficiency.
Conclusion
- Azure Monitoring is a comprehensive solution for tracking the performance and health of Azure resources.
- It includes Metrics, Logs, Application Insights, Service Health, Activity Logs, and more.
- It allows automated responses to be set up using Azure Logic Apps or Azure Functions.
- Azure Metrics Explorer, Log Analytics Workspace, and Azure Network Watcher are some monitoring tools that can be used to visualize and analyze metric data.
