Azure VM Monitoring
Overview
Monitoring is a critical aspect of managing resources in cloud environments like Microsoft Azure. Azure provides a range of tools and services to help you monitor your virtual machines (VMs) and other resources effectively. In this guide, we'll focus on Azure VM monitoring using the Azure Monitor service, with a specific emphasis on the Overview page and key monitoring features.
What is Azure Monitor?
A whole suite of services for keeping an eye on your Azure resources is offered by Azure Monitor, a full-stack monitoring service. However, because Azure Monitor's functionalities are integrated with the Azure site for the Azure services it monitors, you may do a range of monitoring tasks without having to deal with Azure Monitor directly. See Monitor Azure resources by using Azure Monitor for a tutorial that provides an overview of how Azure Monitor interacts with Azure resources.
Azure Monitor is like a watchful guardian for your Azure resources. It keeps an eye on your applications, virtual machines, databases, and other cloud services, checking for any issues, and provides you with information and alerts in simple terms if something goes wrong. Think of it as your cloud health dashboard that helps you keep your Azure services running smoothly by tracking their performance and ensuring they're secure and available.
Monitoring Virtual Machine Data
The types of monitoring data that are gathered by Azure virtual machines are identical to those gathered by other Azure resources, as detailed in Monitoring data from Azure resources. You can read about monitoring Azure virtual machine data for further information on the metrics and logs generated by Azure virtual machines.
Overview Page
Go to your virtual machine's Overview page and choose the Monitoring tab to start exploring Azure VM monitoring. On the tab, you can view the total number of active notifications.
The alerts that have been triggered in the previous twenty-four hours are displayed in the Alerts window, along with pertinent alert statistics. There is a link to assist you in rapidly creating new alerts for your virtual machine (VM) if none are currently configured.
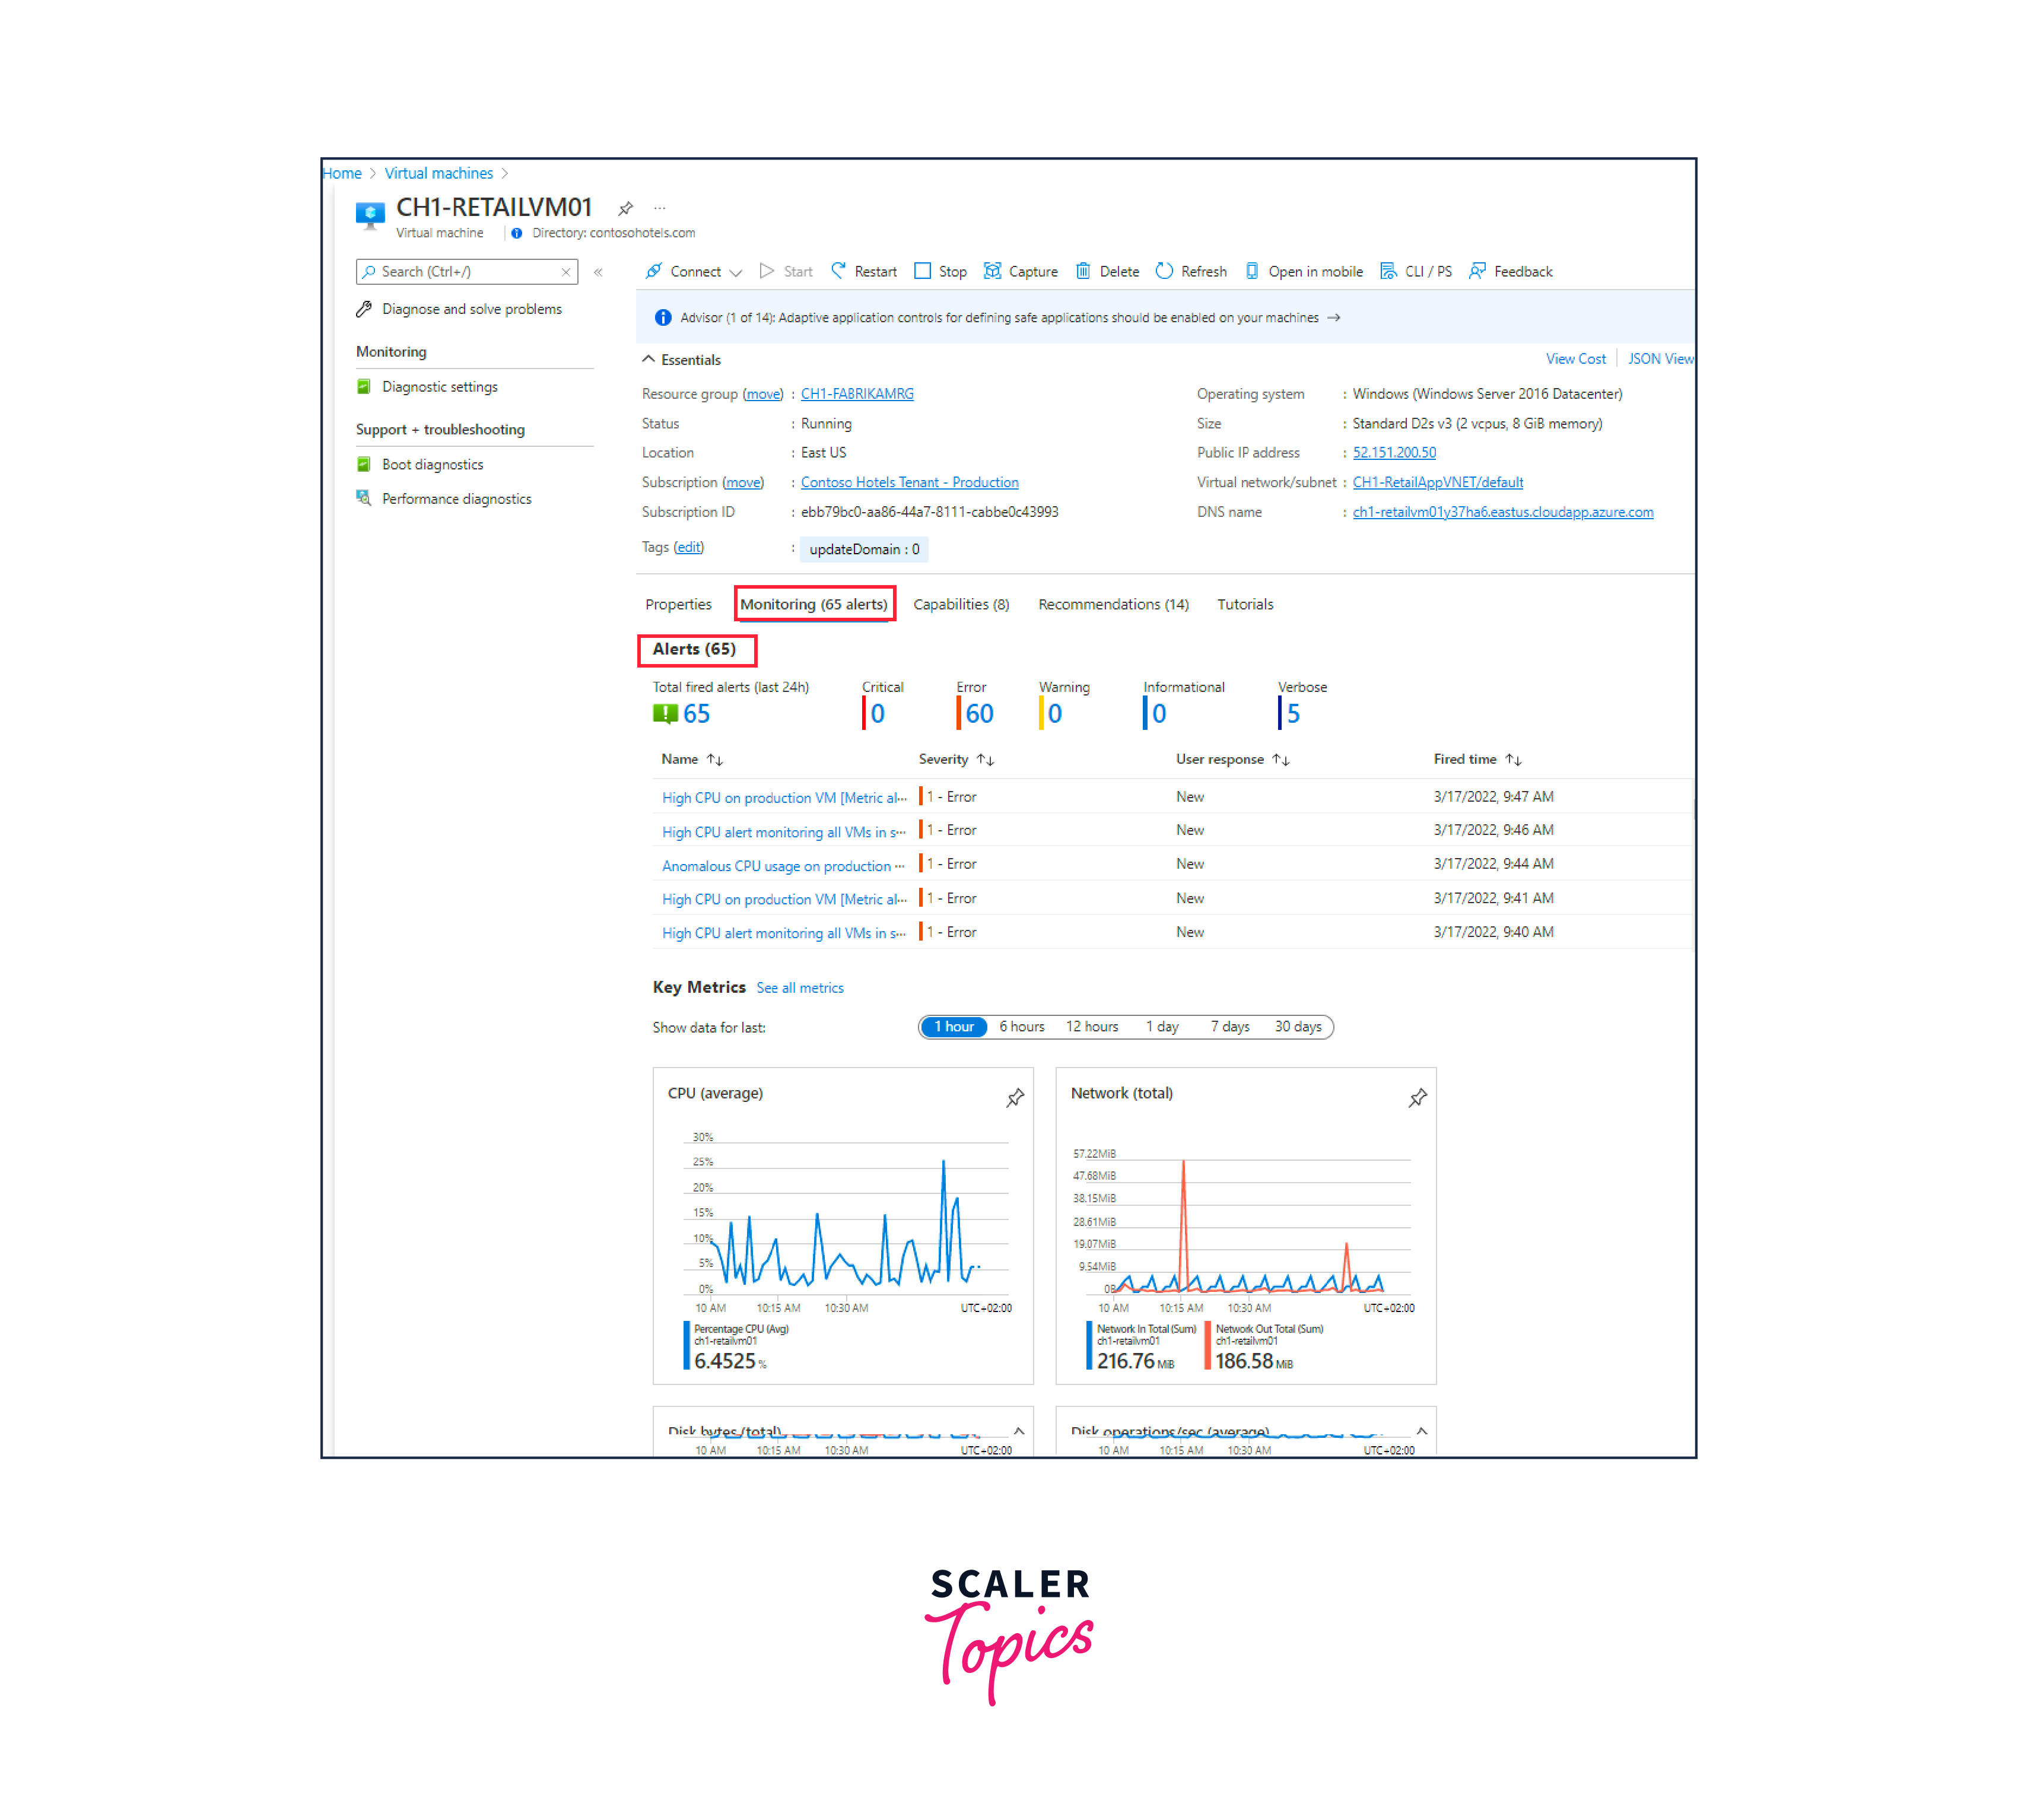
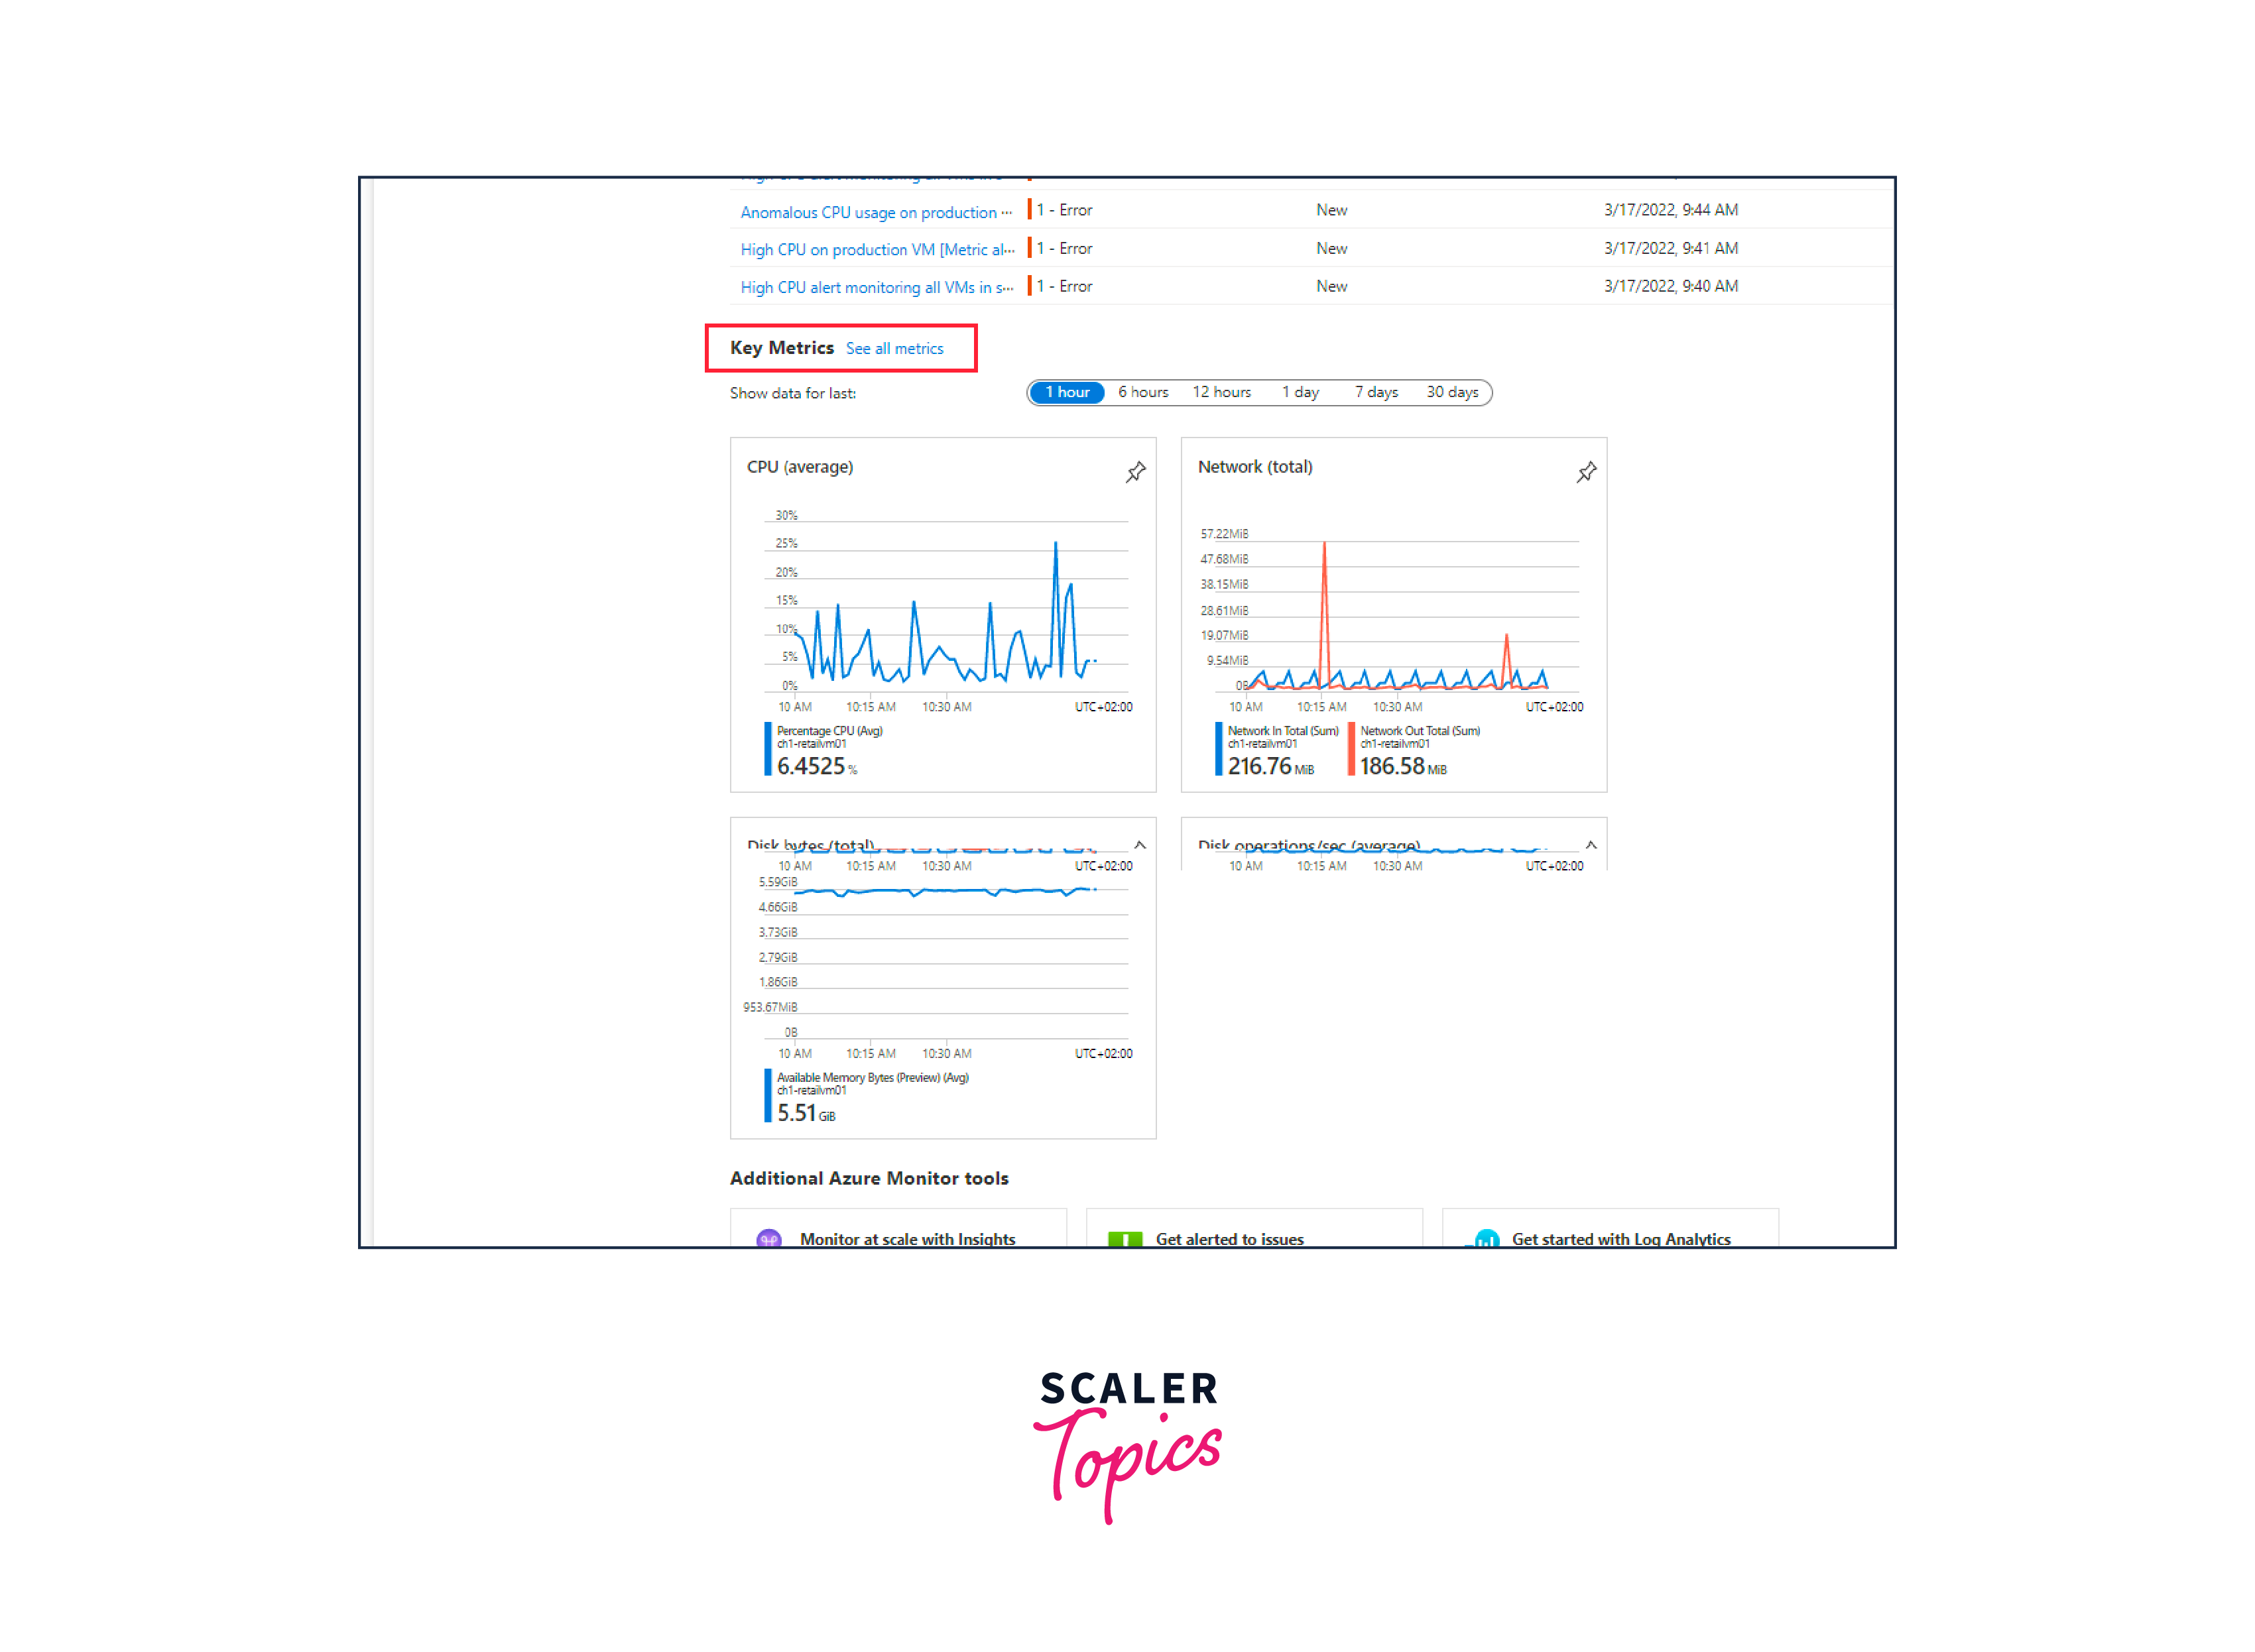
Charts displaying important health measures, such as average CPU and network utilization, are included in the Key measures window. You can modify the time range of the charts by selecting a duration at the top of the pane. You can also establish an alert rule or drill down further by selecting a chart to access the Metrics pane.
Activity Log
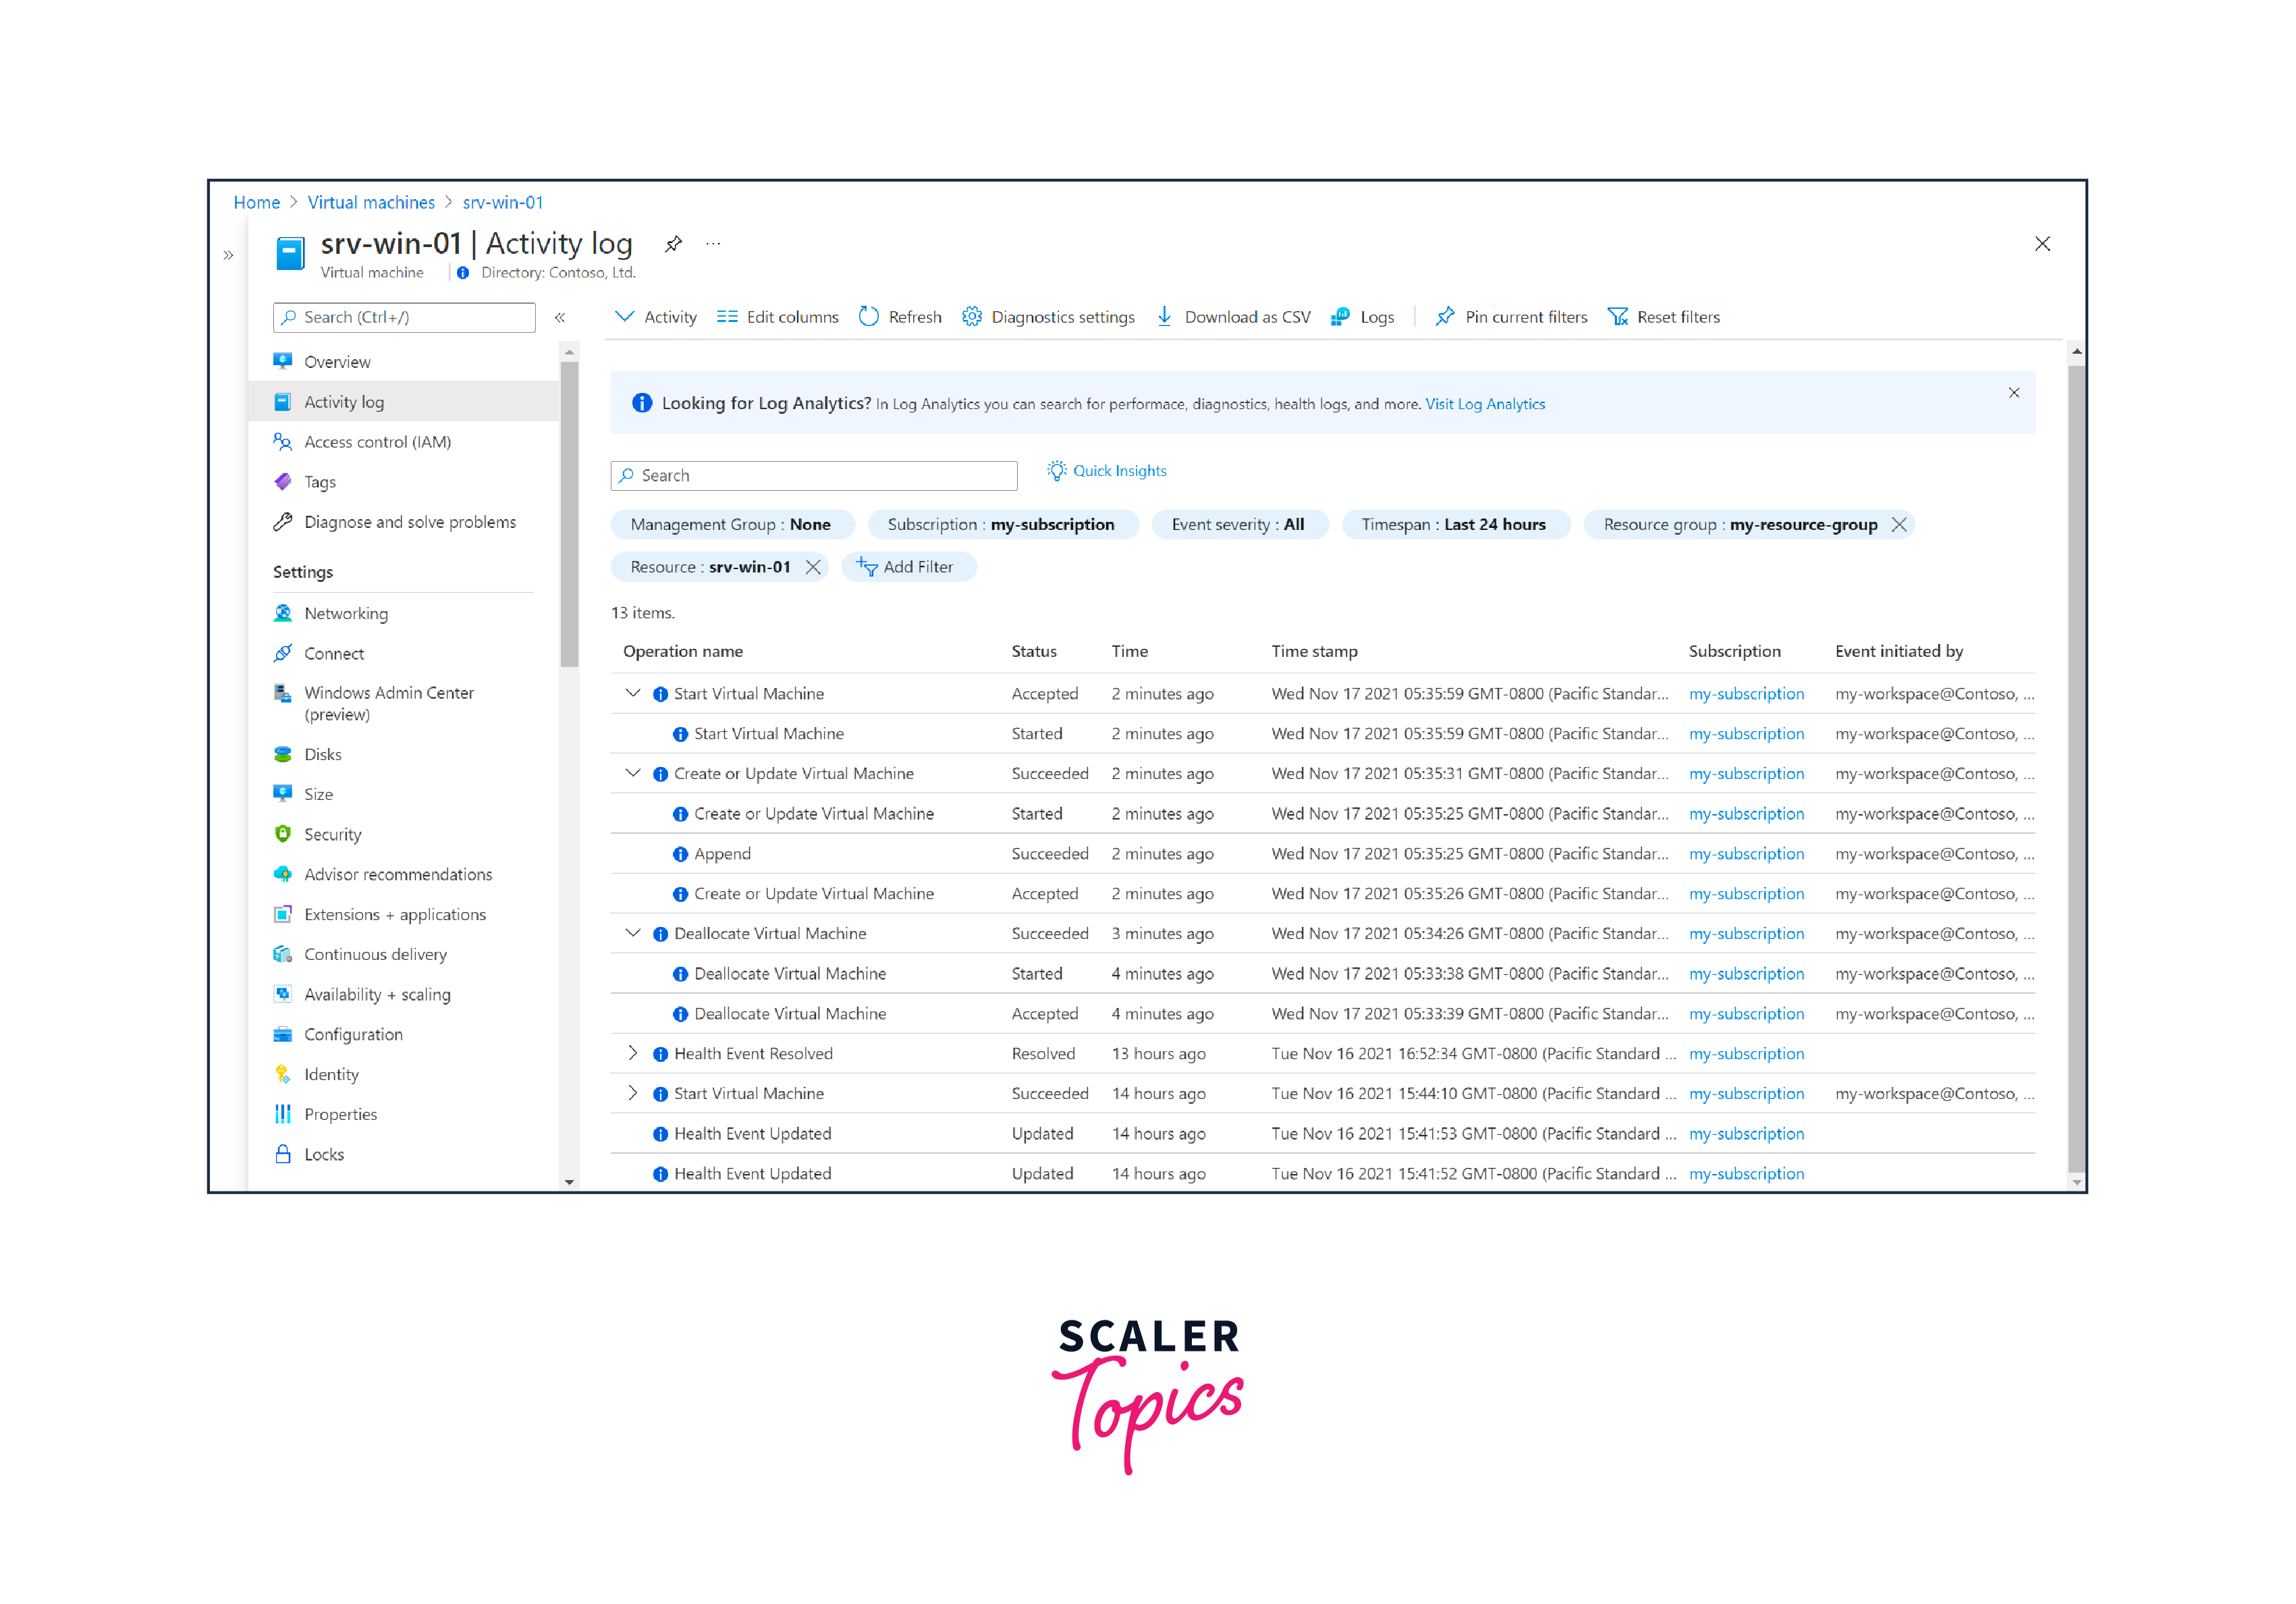
The virtual machine's recent activity, including any configuration changes and the times it was stopped and started, is shown in the Activity log. Use the Azure site to view the Activity log, or set up a diagnostic to send it to a workspace in Log Analytics, where you may observe events over time and examine them in conjunction with other data that has been gathered.
Azure Monitor Agent
When you build the virtual machine host, Azure Monitor begins gathering metrics automatically. However, you need to install the Azure VM monitoring agent to gather logs and performance information from the virtual machine's guest operating system. Installing the agent and configuring collection can be done through VM insights or by following the steps below to create a data collection rule.
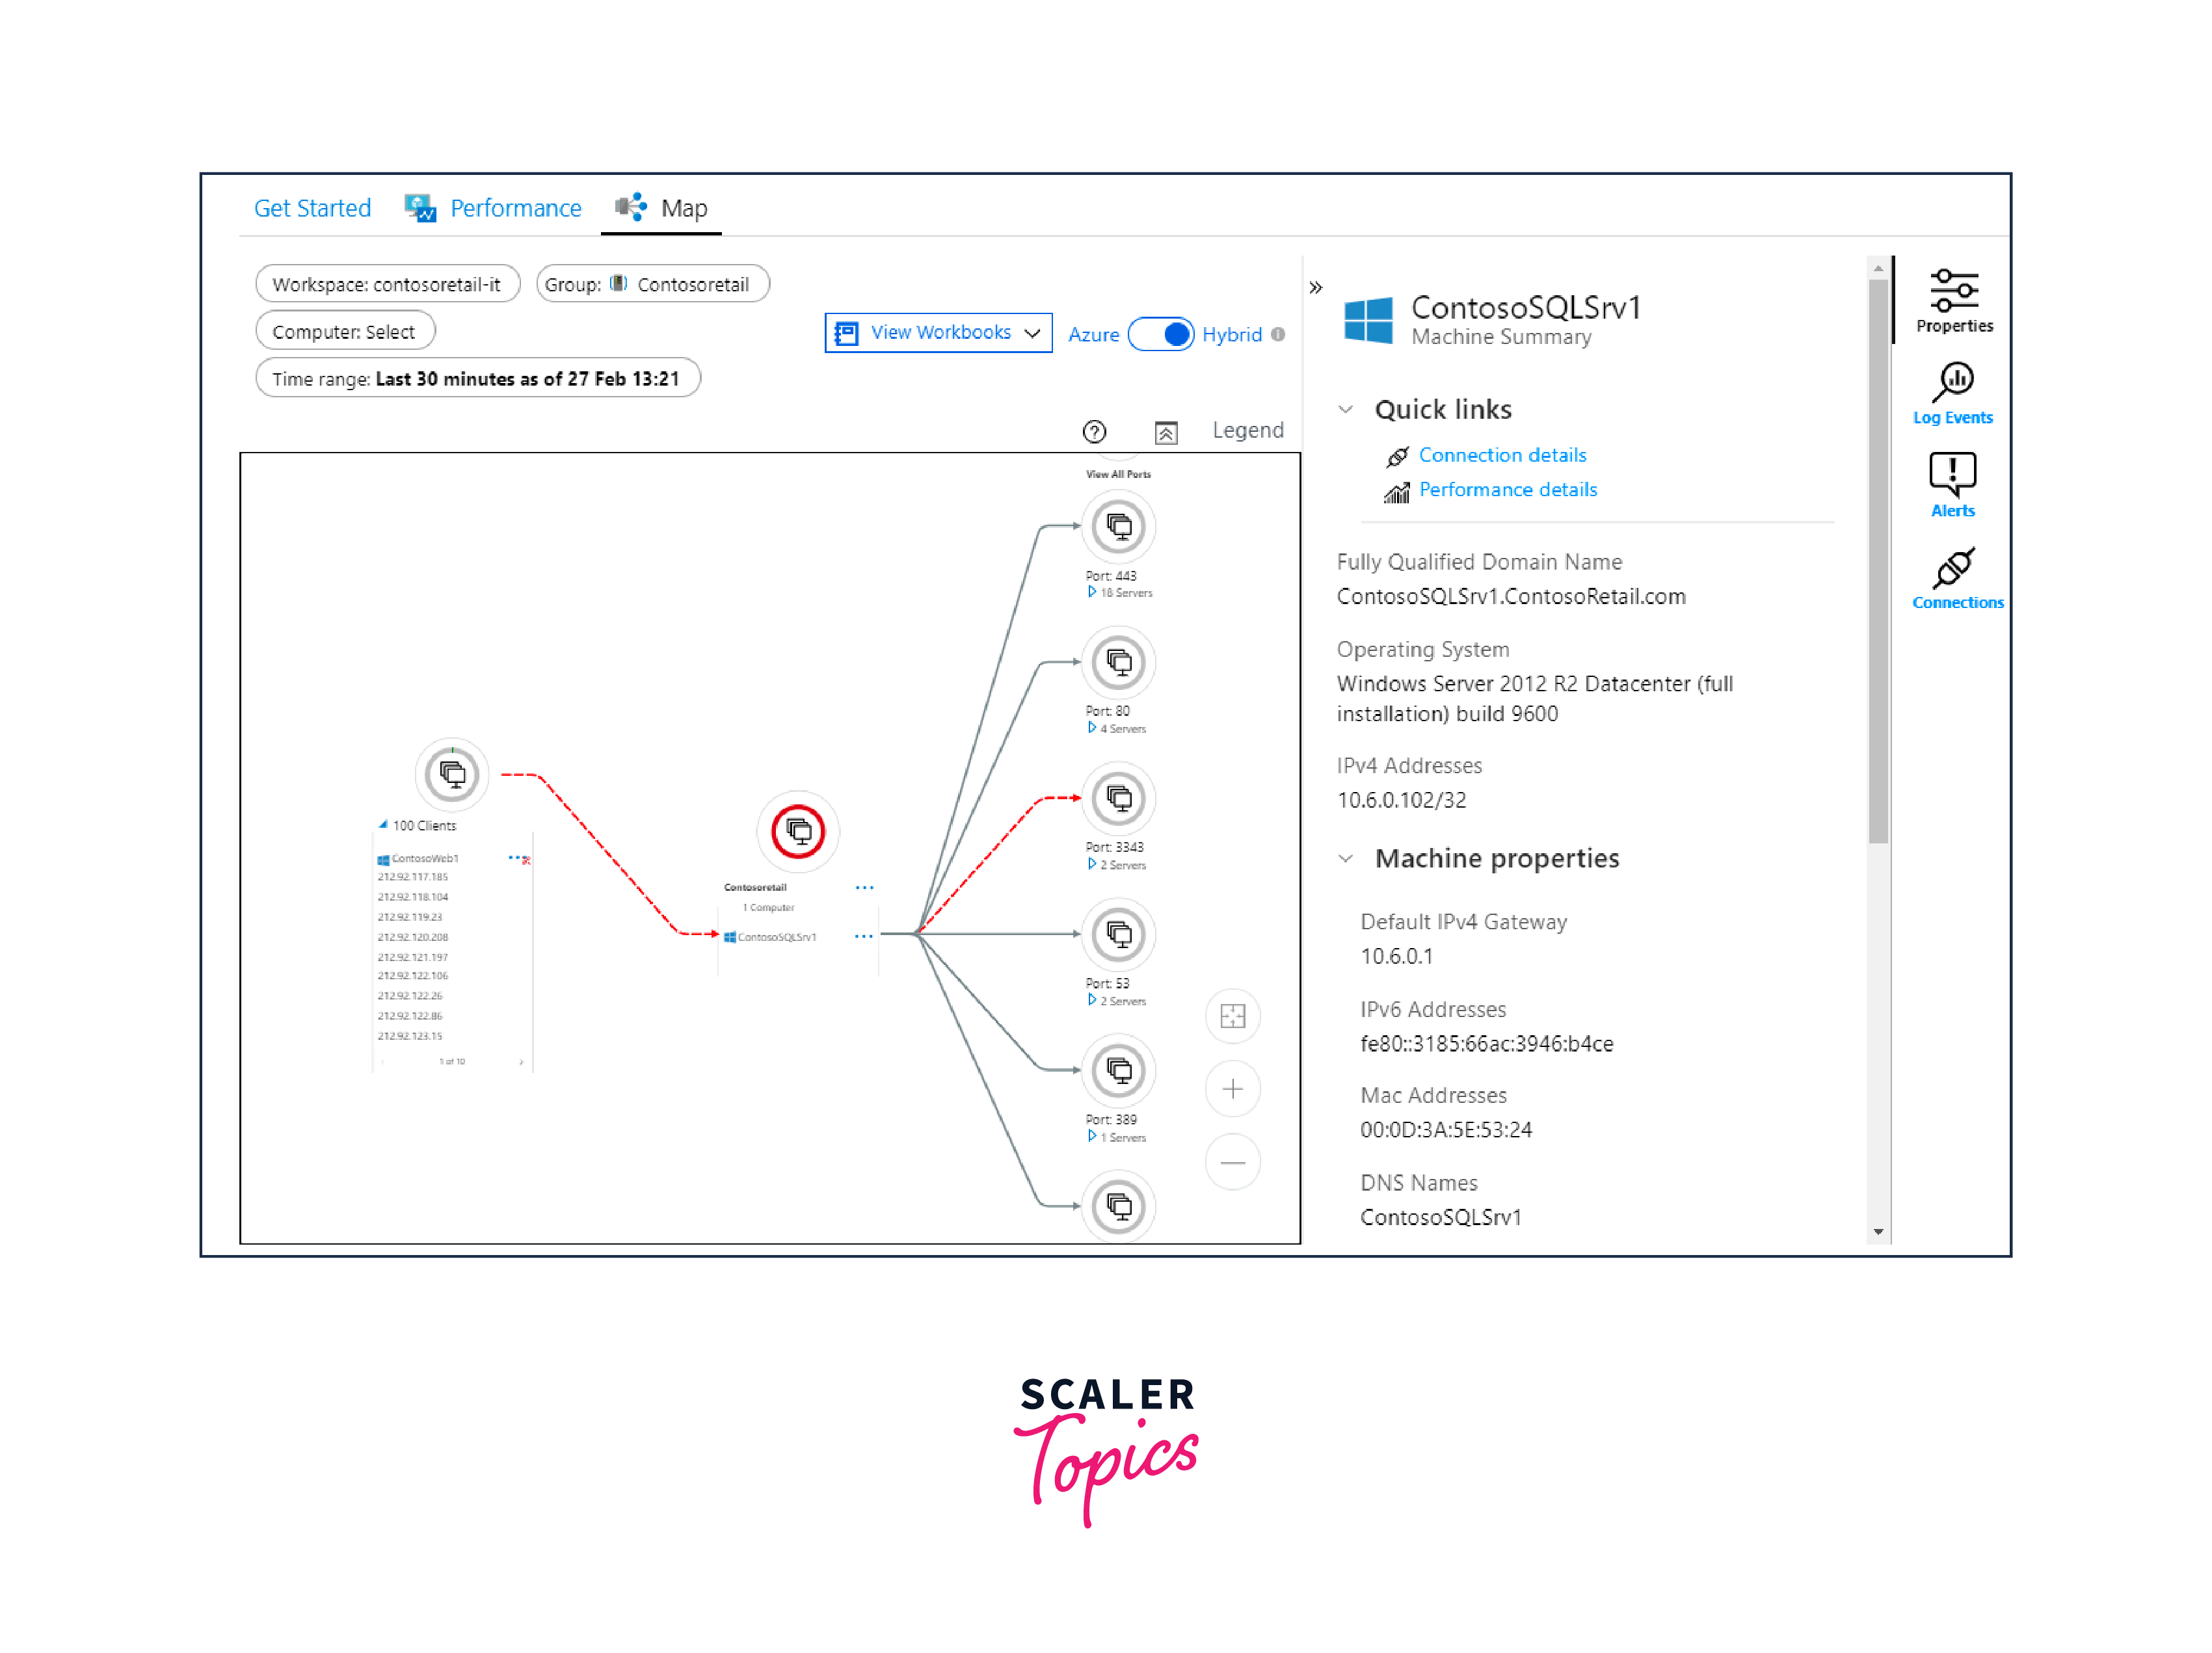
VM Insights
Customized monitoring experiences are displayed in Azure Monitor for certain Azure services. These encounters, dubbed insights, come with pre-made workbooks and additional features designed specifically for that specific service.
With VM insights, you can keep an eye on both your hybrid and Azure virtual machines from a single interface. In addition to other options for monitoring virtual machines in Azure Monitor, VM insights offer the following advantages:
-
Streamlined onboarding for the Dependency and Azure Monitor agents, enabling you to keep an eye on workloads and the guest operating system of virtual machines. predetermined guidelines for gathering data that gather the most popular set of performance metrics.
-
Workbooks and trending performance charts that are pre-defined so you may examine key performance indicators from the guest operating system of the virtual machine.
Create Data Collection Rule
Data collection rules allow you to customize what data you want to collect and send to Azure Monitor for analysis. You can create rules that target specific VMs, specific log types, and more, tailoring the monitoring experience to your specific needs.
The Azure Monitor agent is installed and begins delivering a predetermined set of performance data to Azure Monitor Logs if you enable VM insights. It is possible to generate extra rules for gathering data on events and other aspects of performance.
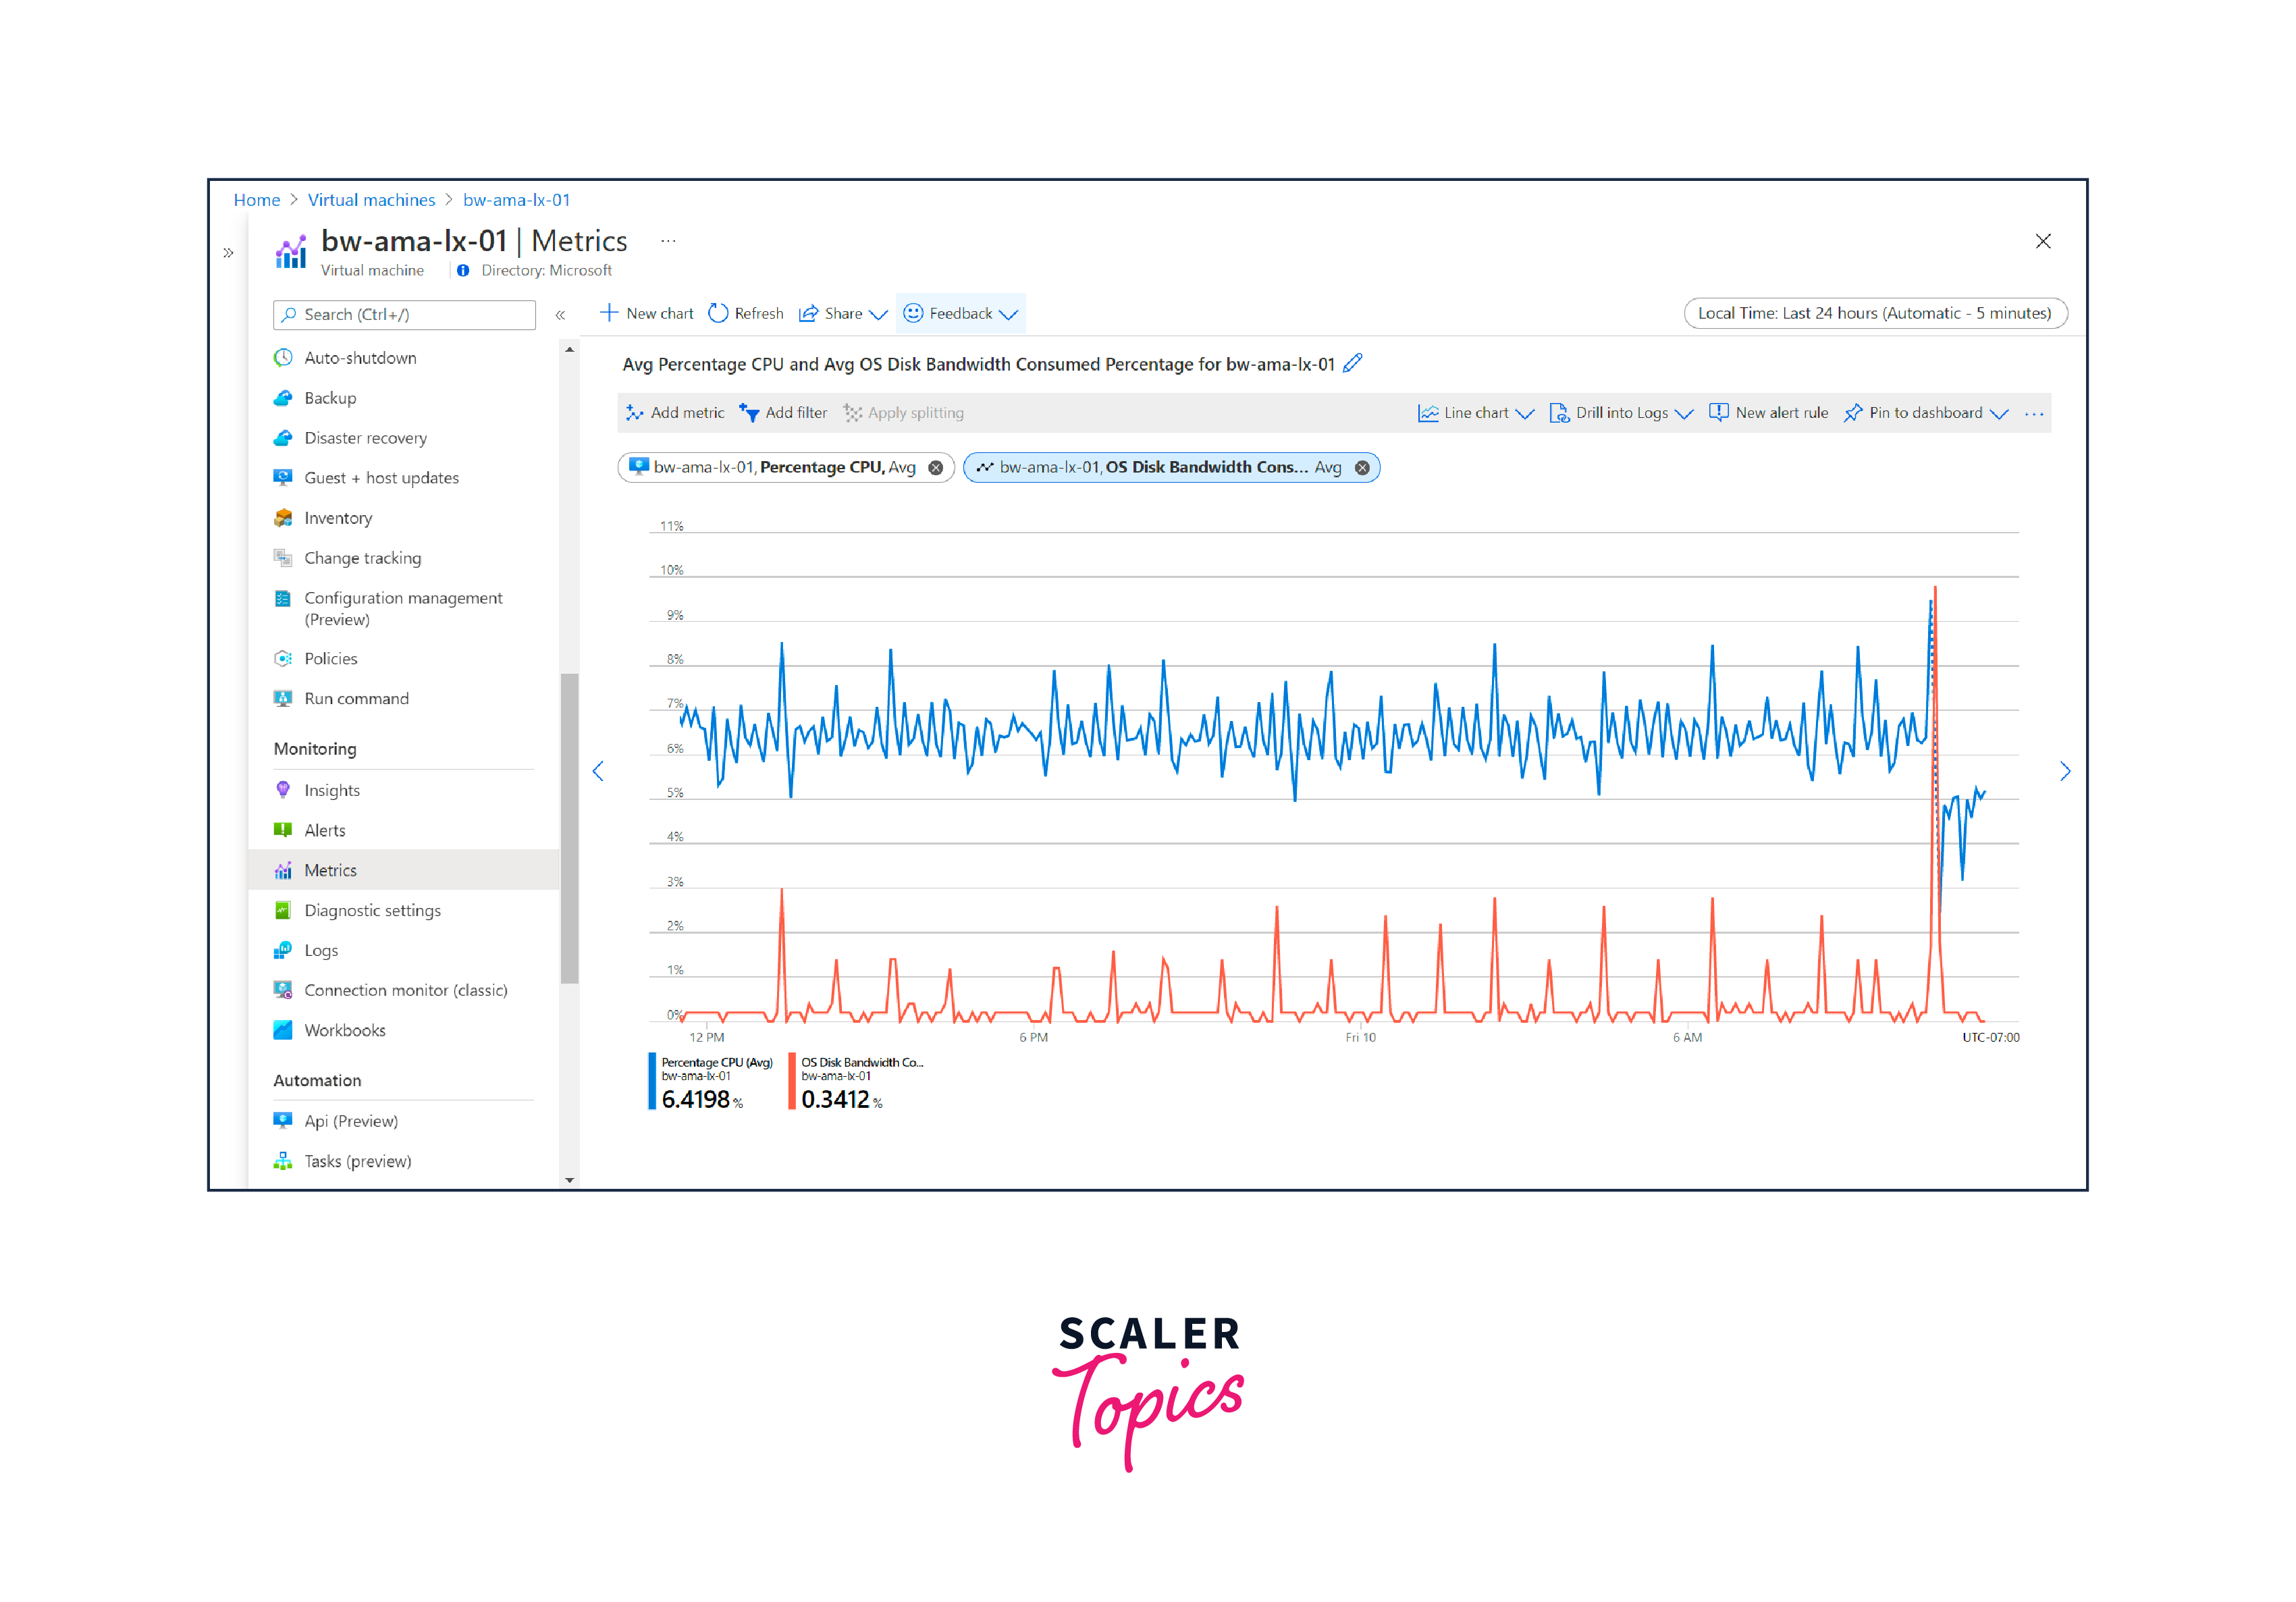
Analyze Metrics
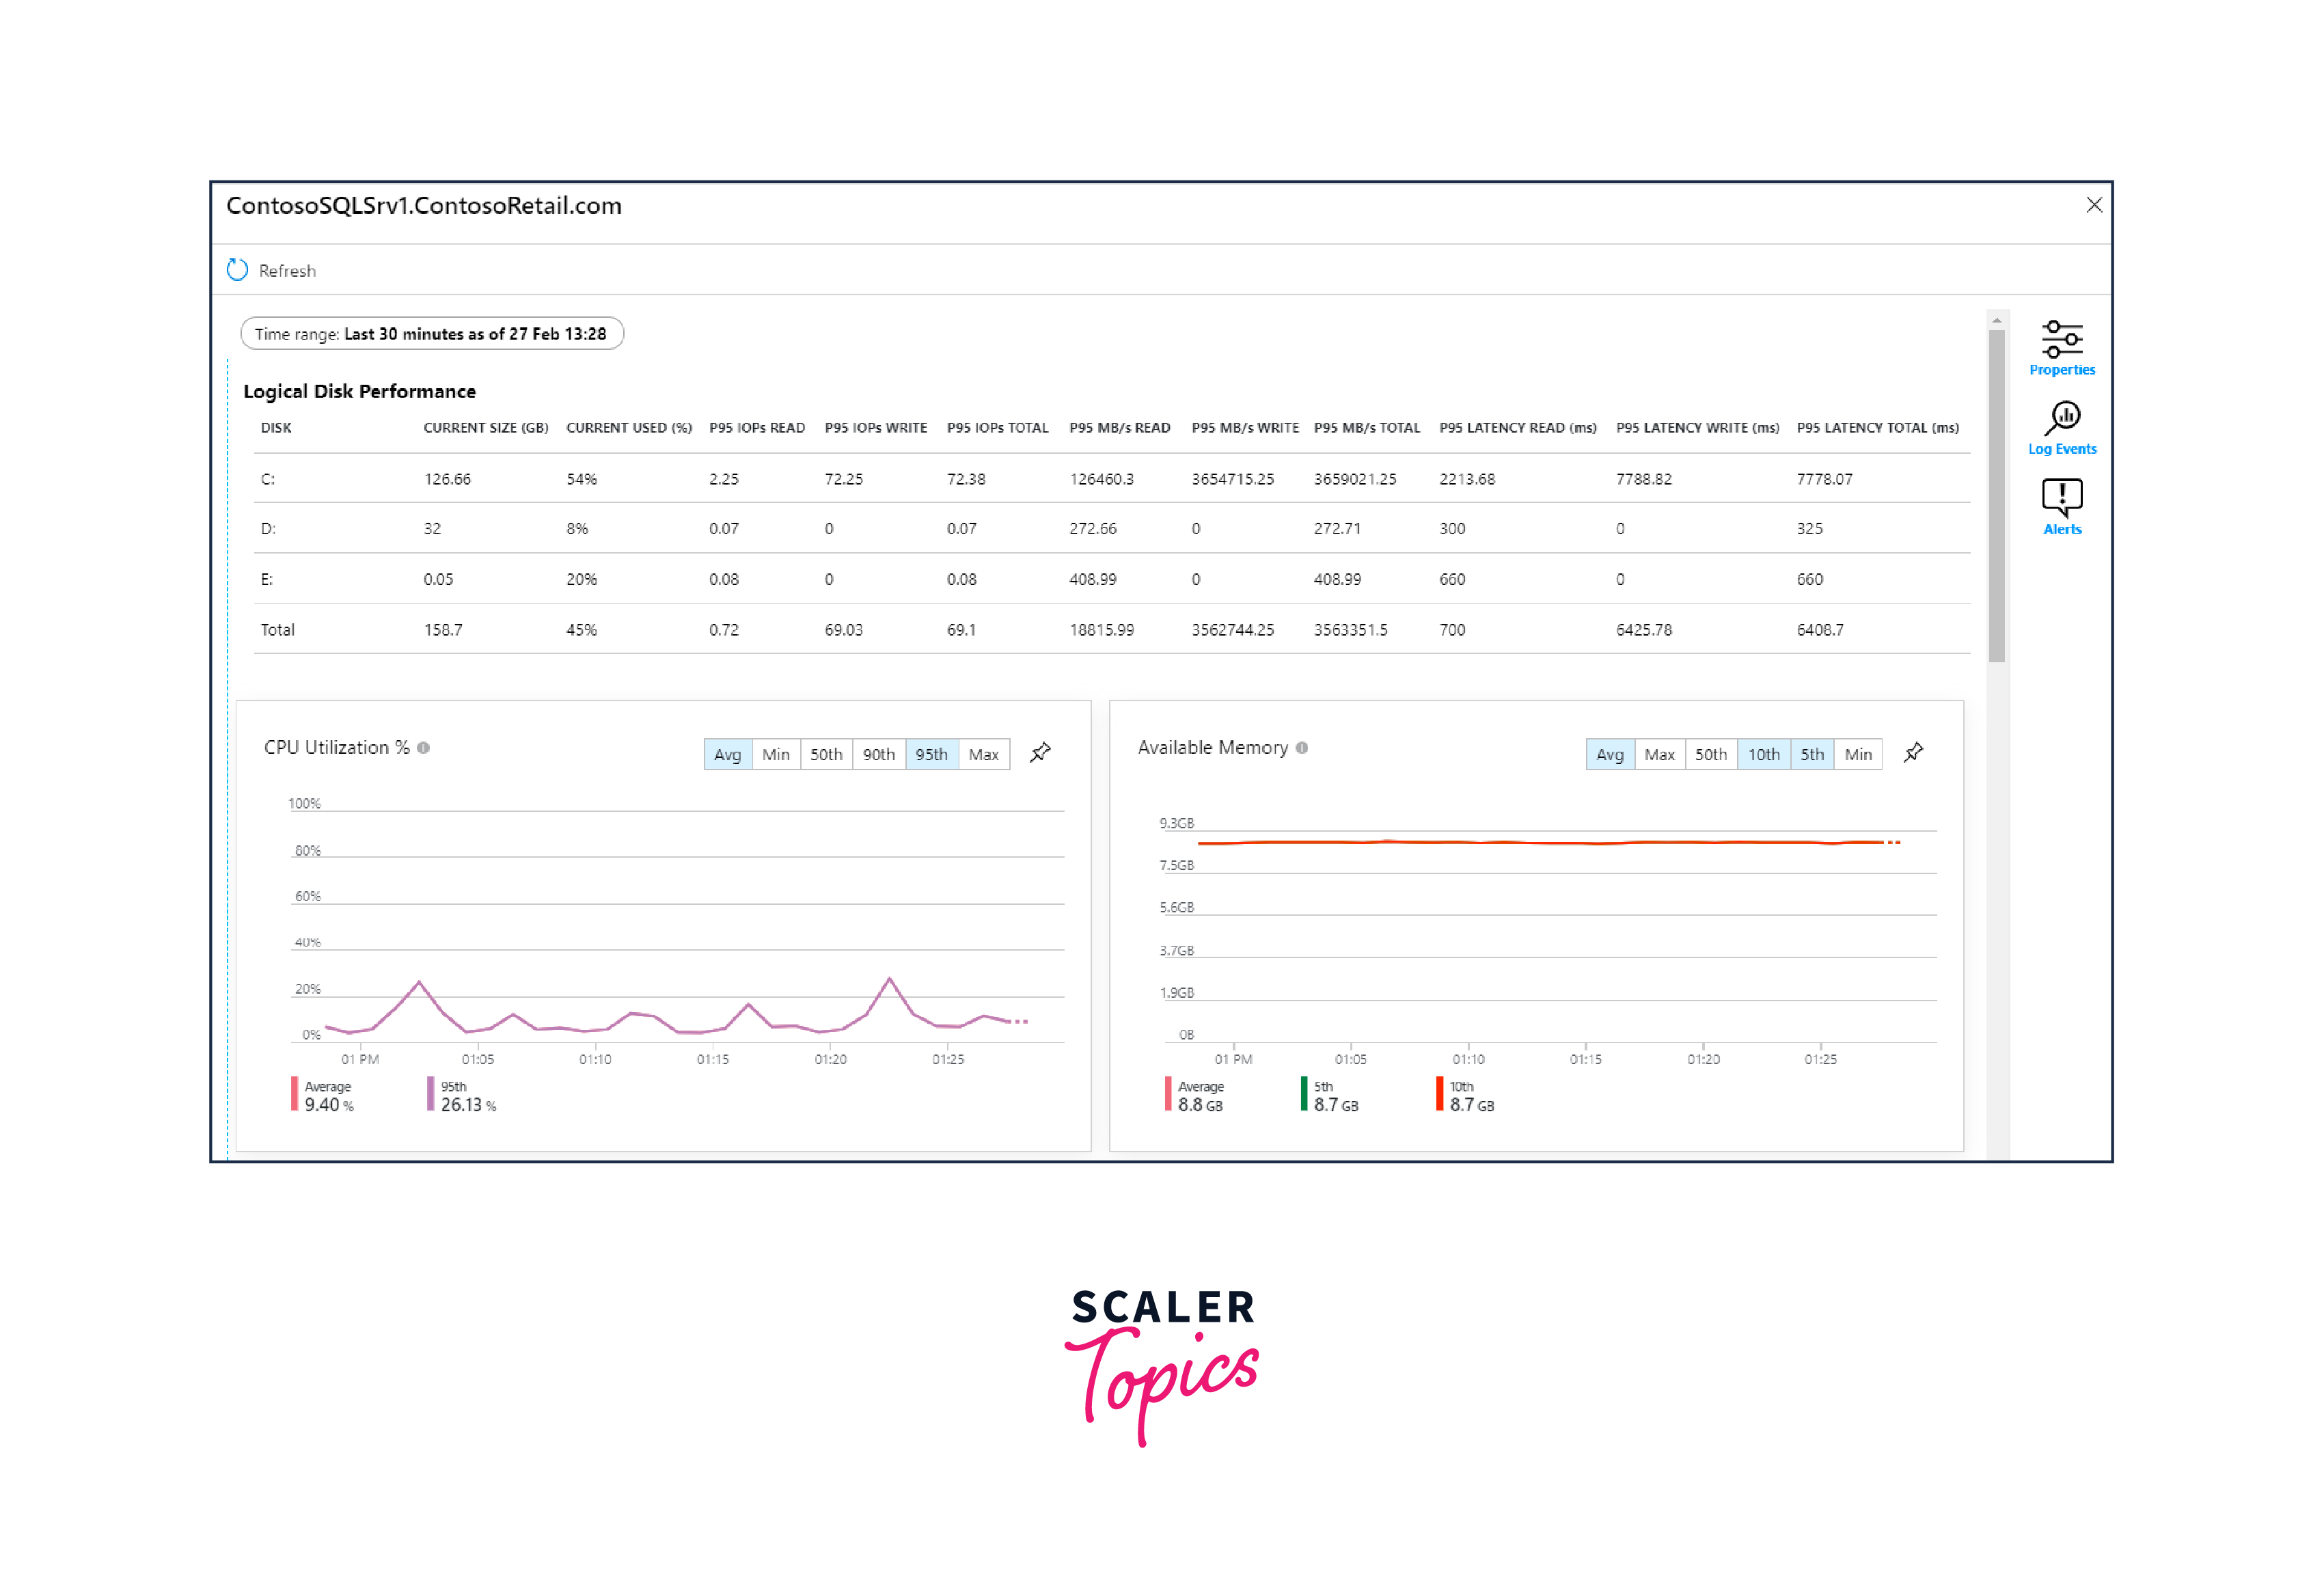
Metrics are numbers that represent a system's characteristics at a specific moment in time. While platform metrics are automatically gathered for the virtual machine host, to collect guest metrics, you need to install the Azure VM monitoring agent and set up a data collection rule.
The most popular host metrics are shown in the Overview pane; the Metrics pane allows you to explore additional data. Using this application, you may visually correlate trends by creating charts using metric information. Additionally, you have the option to add a graphic or metric alert rule to an Azure dashboard.
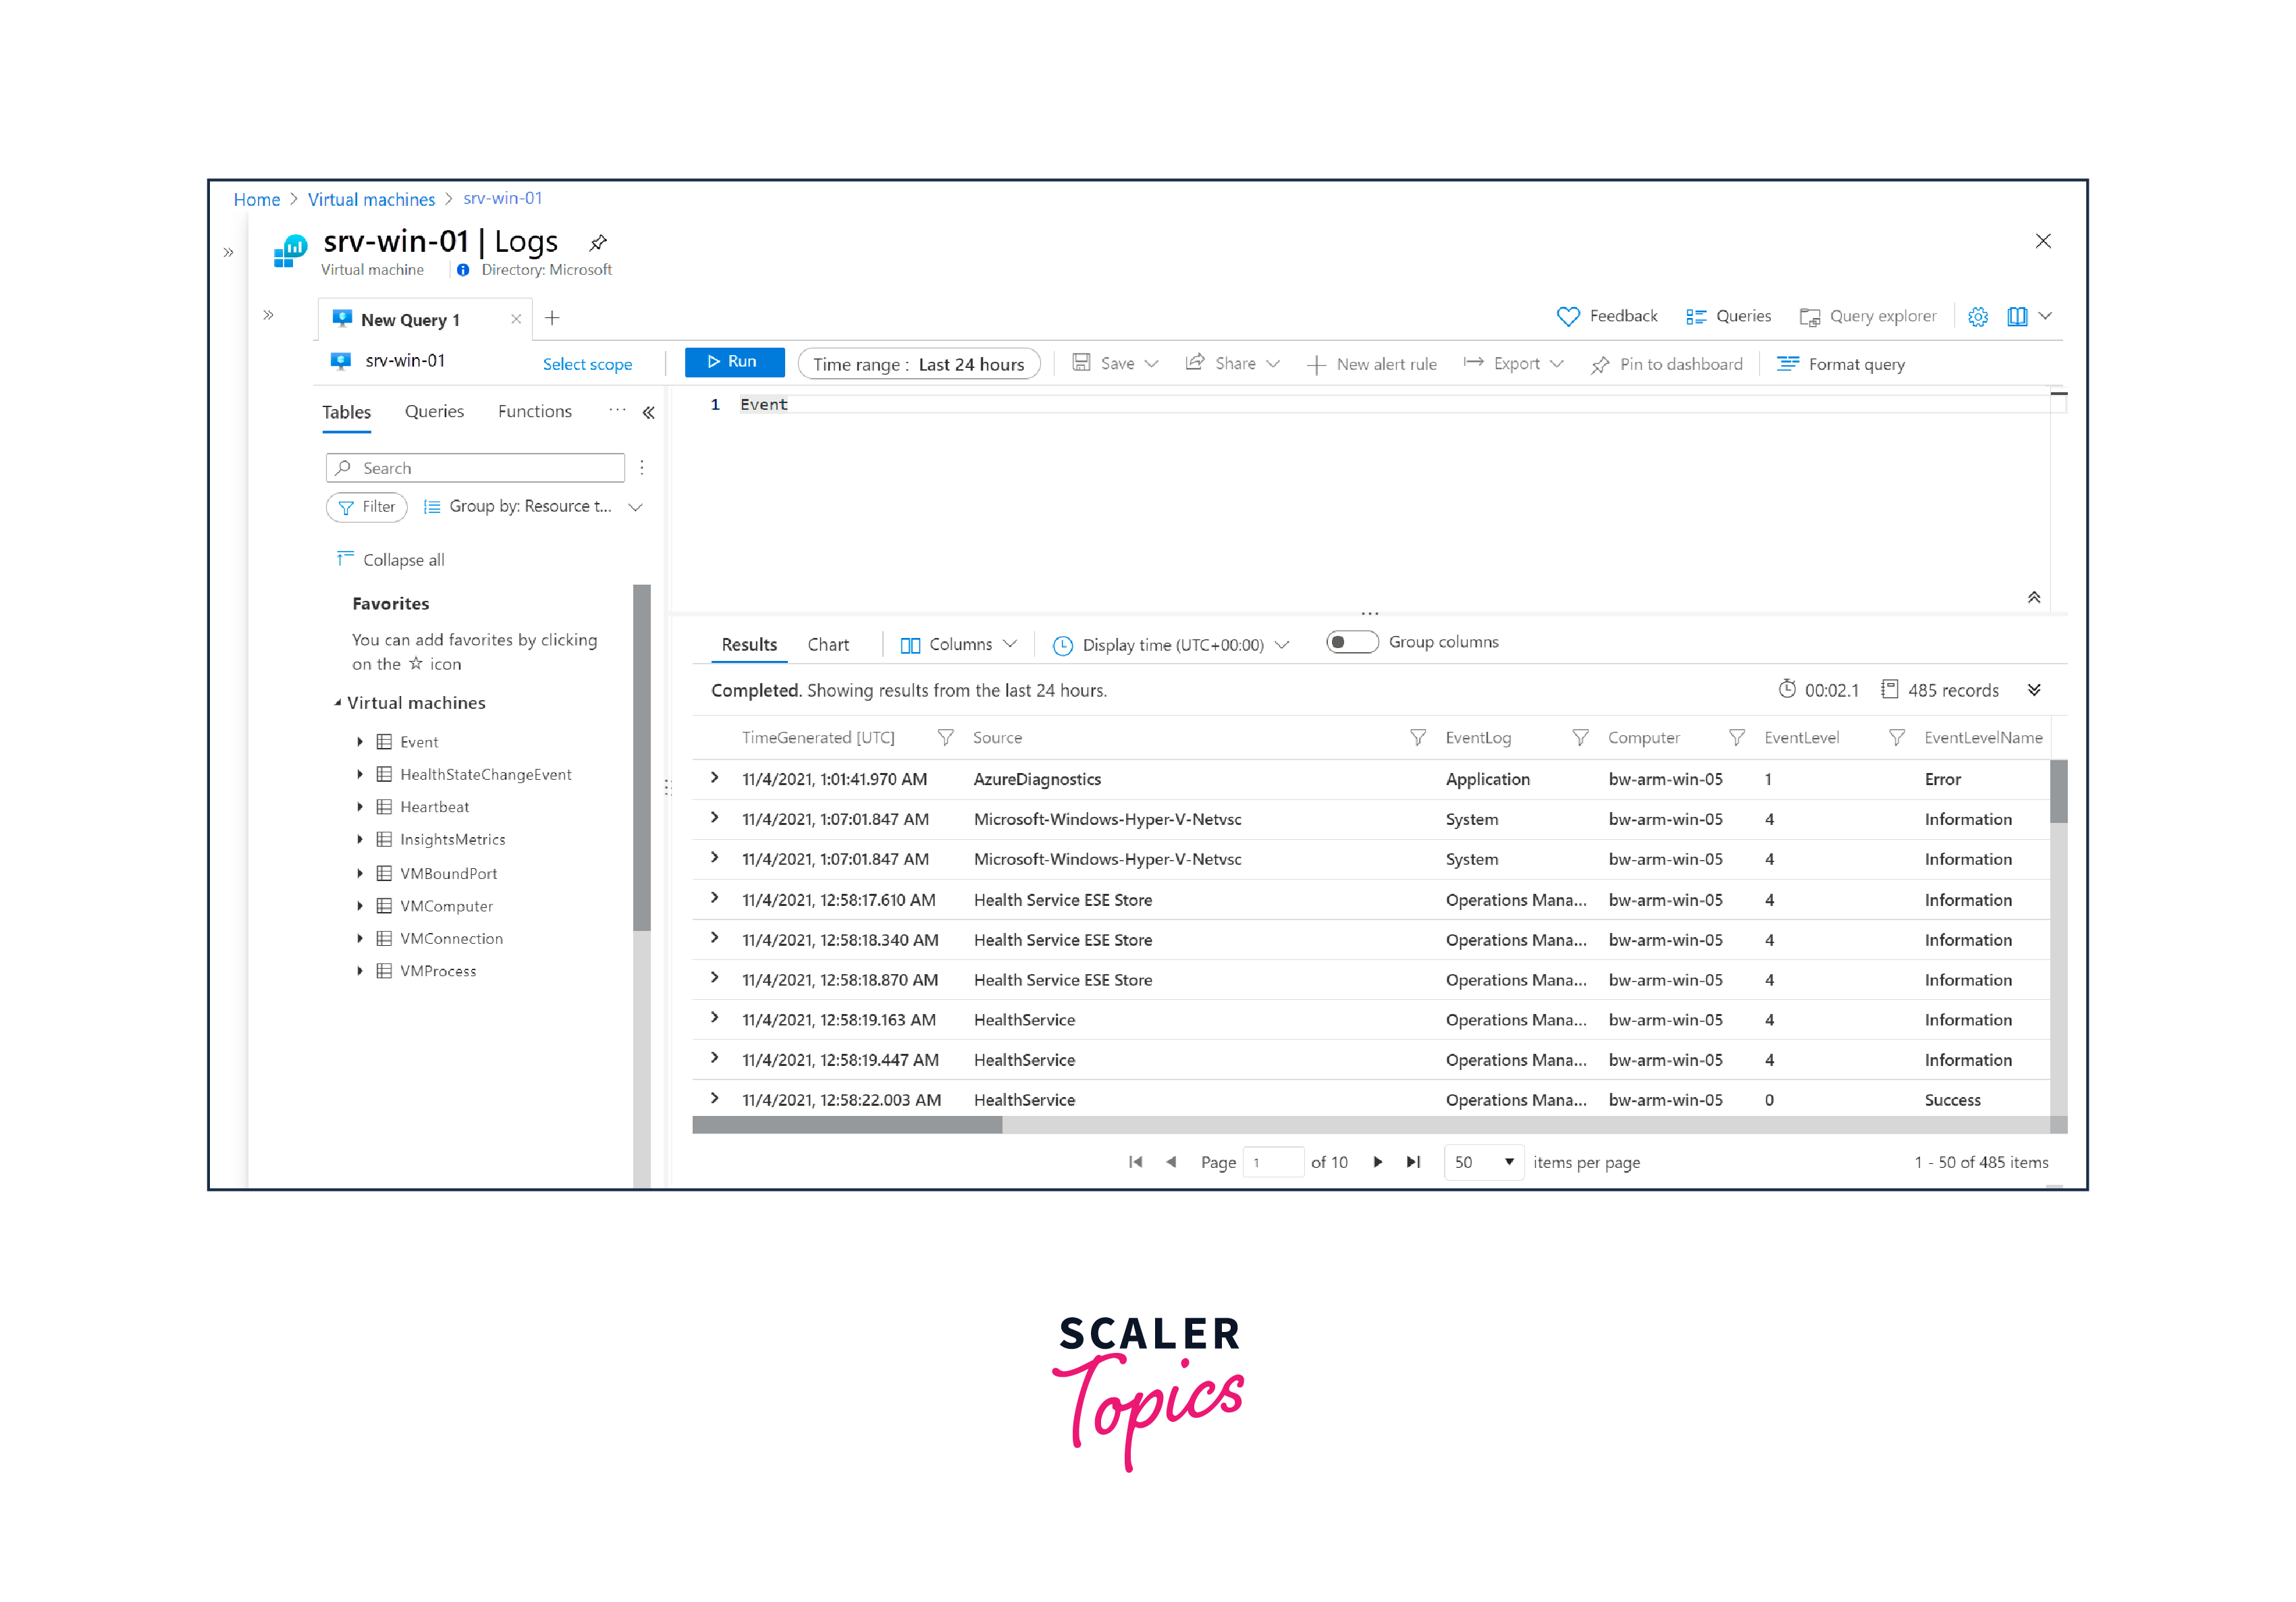
Analyze Logs
Azure Monitor Logs stores event data in a workspace called Log Analytics, where it is organized into tables, each with its own set of properties.
The data that VM insights gather is stored in Logs, and you can utilize the insights' performance and map views to interactively evaluate the data. Working directly with this data allows you to conduct bespoke analyses or go further into the details.
Use log queries in Log Analytics to examine other log data that you gather from your virtual machines. You can use one of the many pre-built virtual machine queries, or you can write your own. The output of these searches can be worked with interactively, added to a workbook so that other users can access it, or used to create alerts.
Alerts
You are proactively alerted by Azure Monitor when significant circumstances are discovered in your monitoring data. These notifications can assist you in locating and resolving system problems before your clients become aware of them. Metrics, logs, and activity logs all have alert settings.
Recommended Alerts
Turn on suggested alerts first. These are pre-established alert criteria that are based on the virtual machine's host metrics. Using the Azure interface, you can rapidly enable and modify each of these rules with a few clicks.
Multi-resource Metric Alerts
For every virtual machine, an individual alert rule is made using the suggested alerts. Alternatively, you can use a single alert rule that covers all virtual machines (VMs) in a specific resource group or subscription (within the same region) by using a multi-resource alert rule.
Conclusion
- Azure provides a comprehensive solution for monitoring virtual machines in the cloud environment.
- Important tools and features include the Overview page, Activity Log, Azure Monitor agent, VM insights, data collection rules, metrics analysis, log analysis, and alerts.
- Azure VM monitoring offers real-time insights into VM performance and health, aiding in proactive issue resolution.
- Data collection rules and log analysis can be customized to meet specific monitoring and troubleshooting requirements.
- Alert rules help ensure that you're promptly notified of potential issues, allowing for proactive management of VMs.
- Monitoring tools empower organizations to optimize VM performance, ensure reliability, and enhance application service delivery.
Effective VM monitoring is essential for maintaining the health and performance of Azure resources, making Azure VM monitoring a critical component of cloud management.