Service Map Azure
Overview
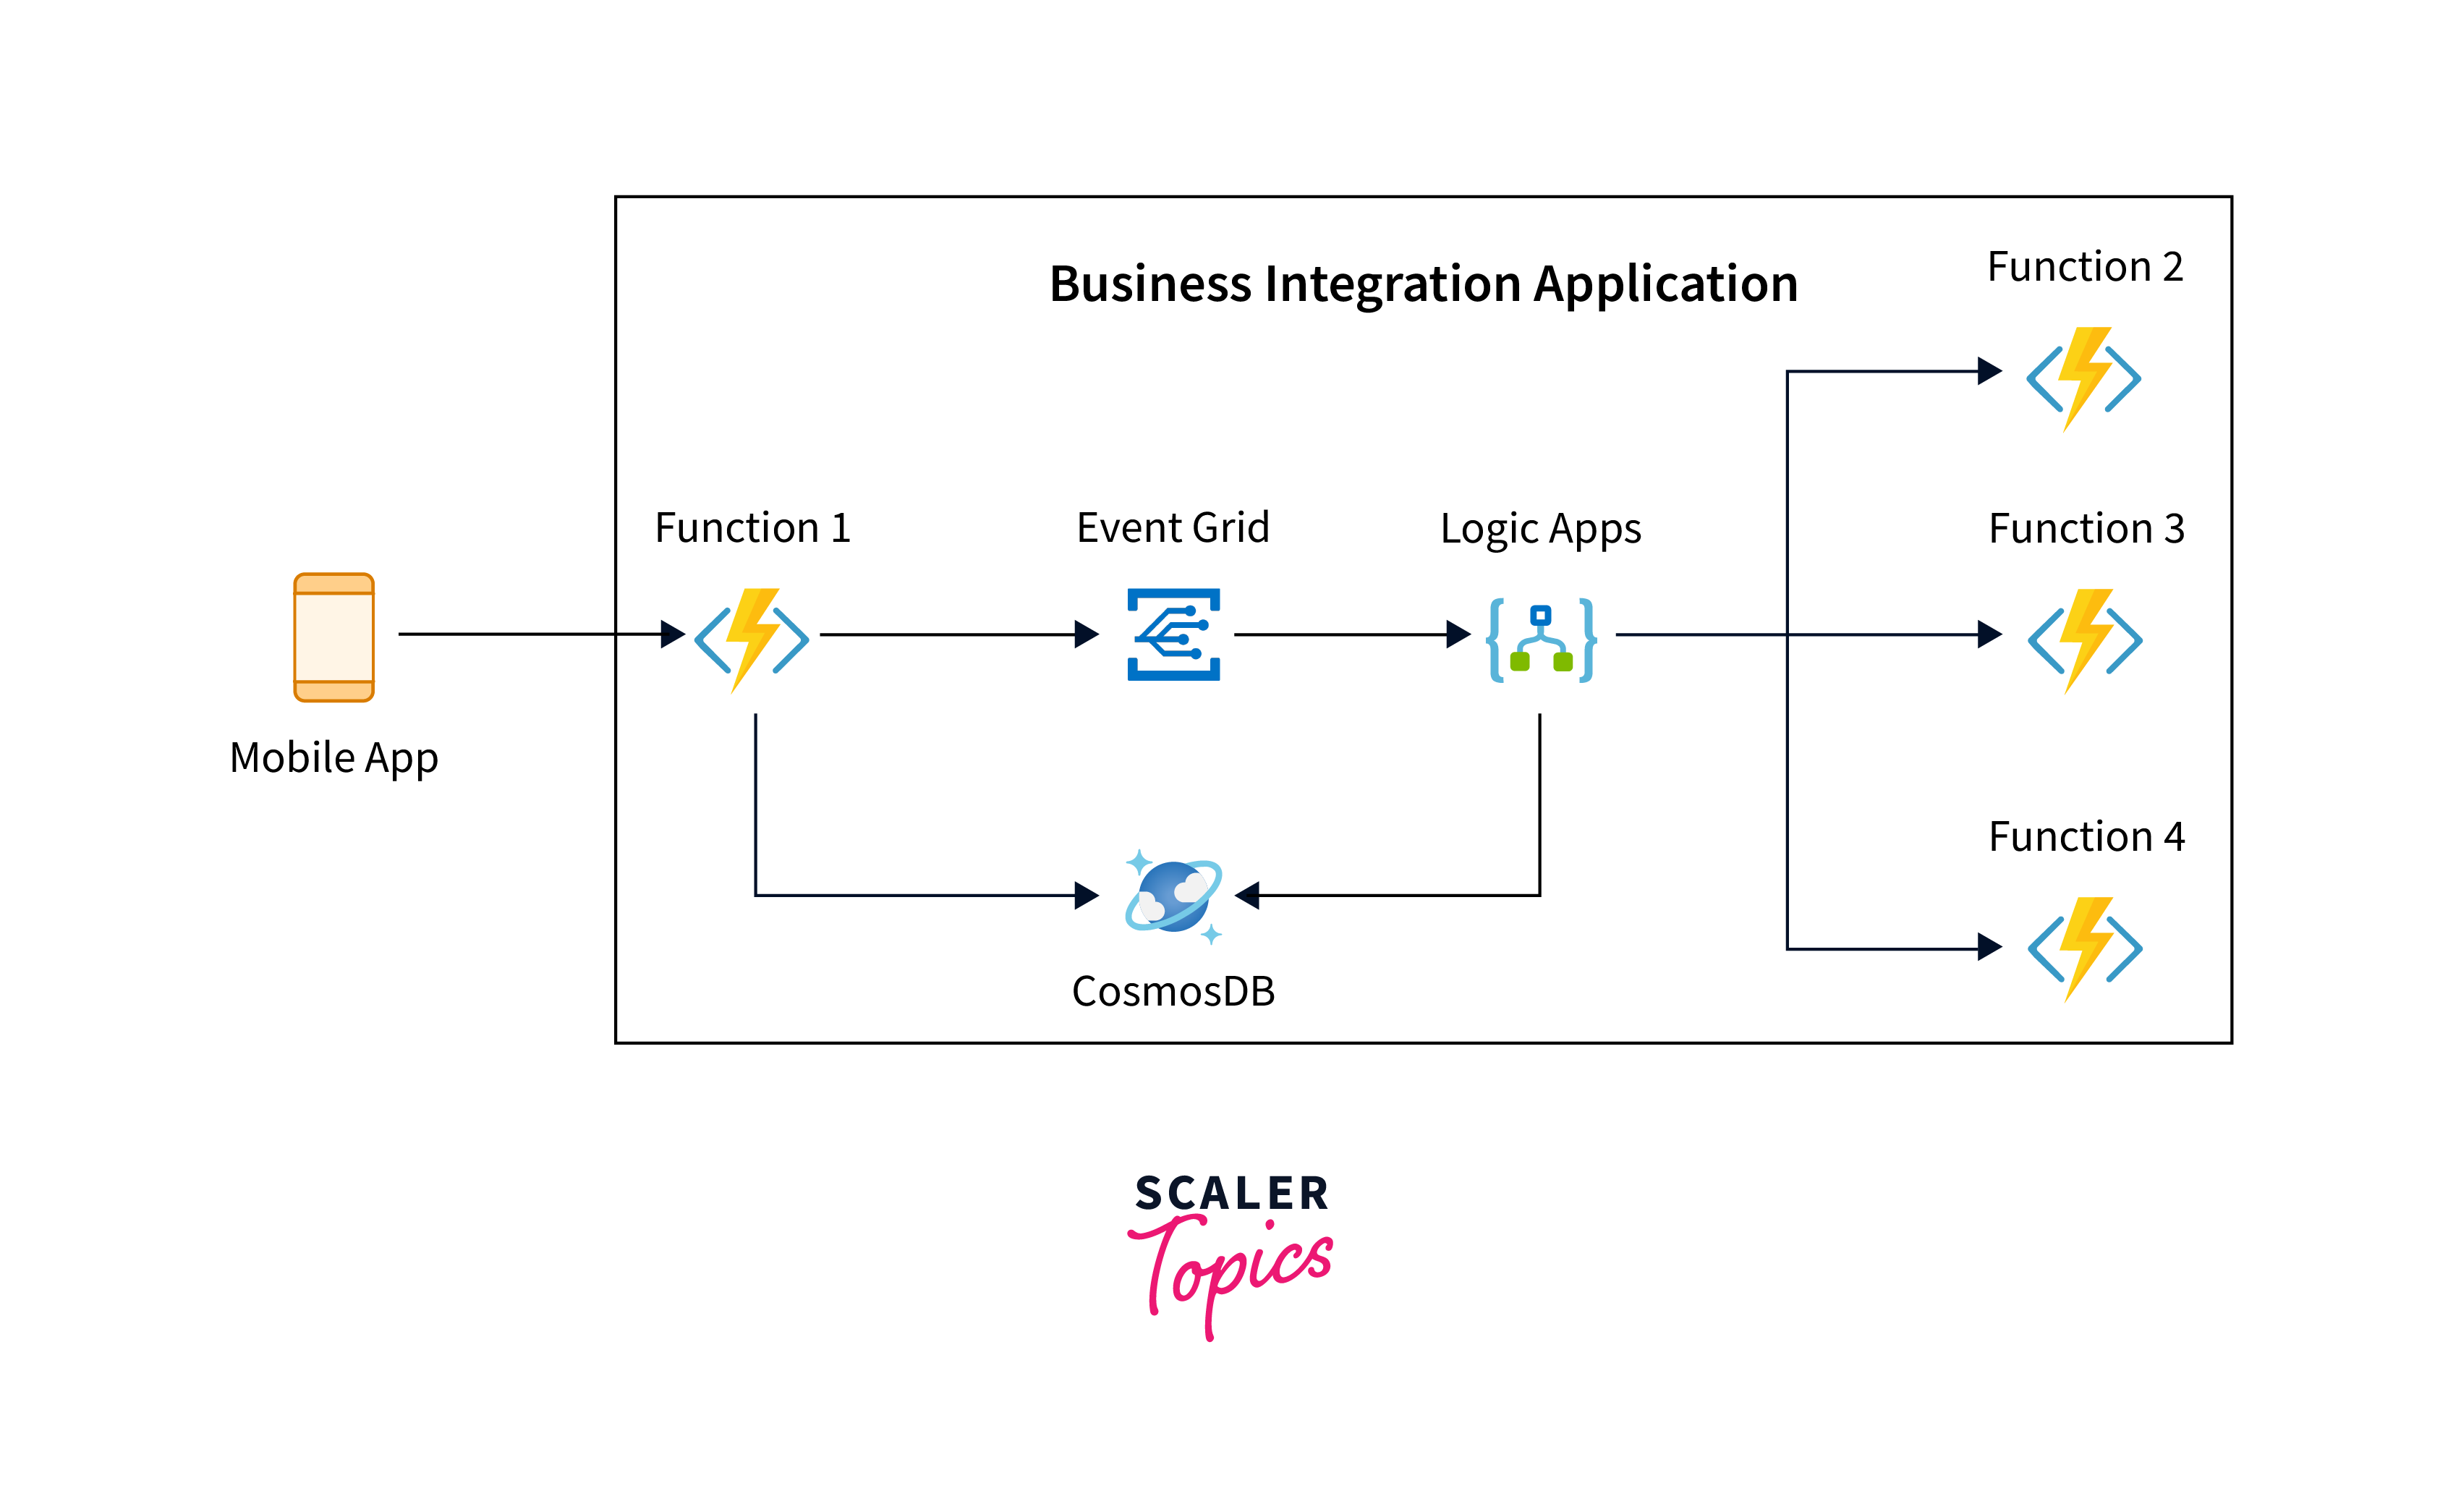
Azure Service Map is a tool in Microsoft Azure that provides dynamic, real-time mapping of application dependencies and network connections. It visually illustrates the relationships and dependencies between different components of an application, helping users understand the end-to-end communication flow. This map assists in troubleshooting, optimizing performance, and enhancing overall application reliability by offering insights into how services interact within a network. Service Map captures data using agents installed on virtual machines, allowing for a comprehensive view of the infrastructure.
What is an Azure Service Map?
Azure Service Map is a powerful tool within the Microsoft Azure ecosystem that provides dynamic and real-time dependency mapping for applications running in the cloud environment. By automatically discovering and mapping relationships between different components, such as virtual machines, applications, and services, Service Map offers a visual representation of the entire application architecture. This visualization aids in understanding complex dependencies, streamlines troubleshooting processes, and allows for efficient monitoring and optimization of application performance.
One of the key features of Azure Service Map is its cross-platform compatibility, seamlessly supporting both Windows and Linux environments. This makes it versatile and applicable to a wide range of operating systems. Integrated with Azure Monitor, Service Map enhances its capabilities by combining dependency mapping with other monitoring tools, offering a holistic approach to application management.
To utilize Azure Service Map, users need to install the Service Map Dependency Agent on each virtual machine they wish to monitor. Once installed, the agent automatically discovers dependencies and updates the visualization in real-time. The interactive map provides insights into the relationships within the application, making it a valuable resource for IT professionals and developers.
With detailed diagnostic data capture, Service Map goes beyond dependency mapping to offer insights into application behavior, potential issues, and performance optimization opportunities. This information is crucial for effective troubleshooting and decision-making.
Here are some key features and aspects of Azure Service Map:
-
Dependency Mapping:
Azure Service Map automatically discovers and maps dependencies among application components, whether they are running on-premises or in the Azure cloud. This mapping helps you understand the relationships between different services and how they interact. -
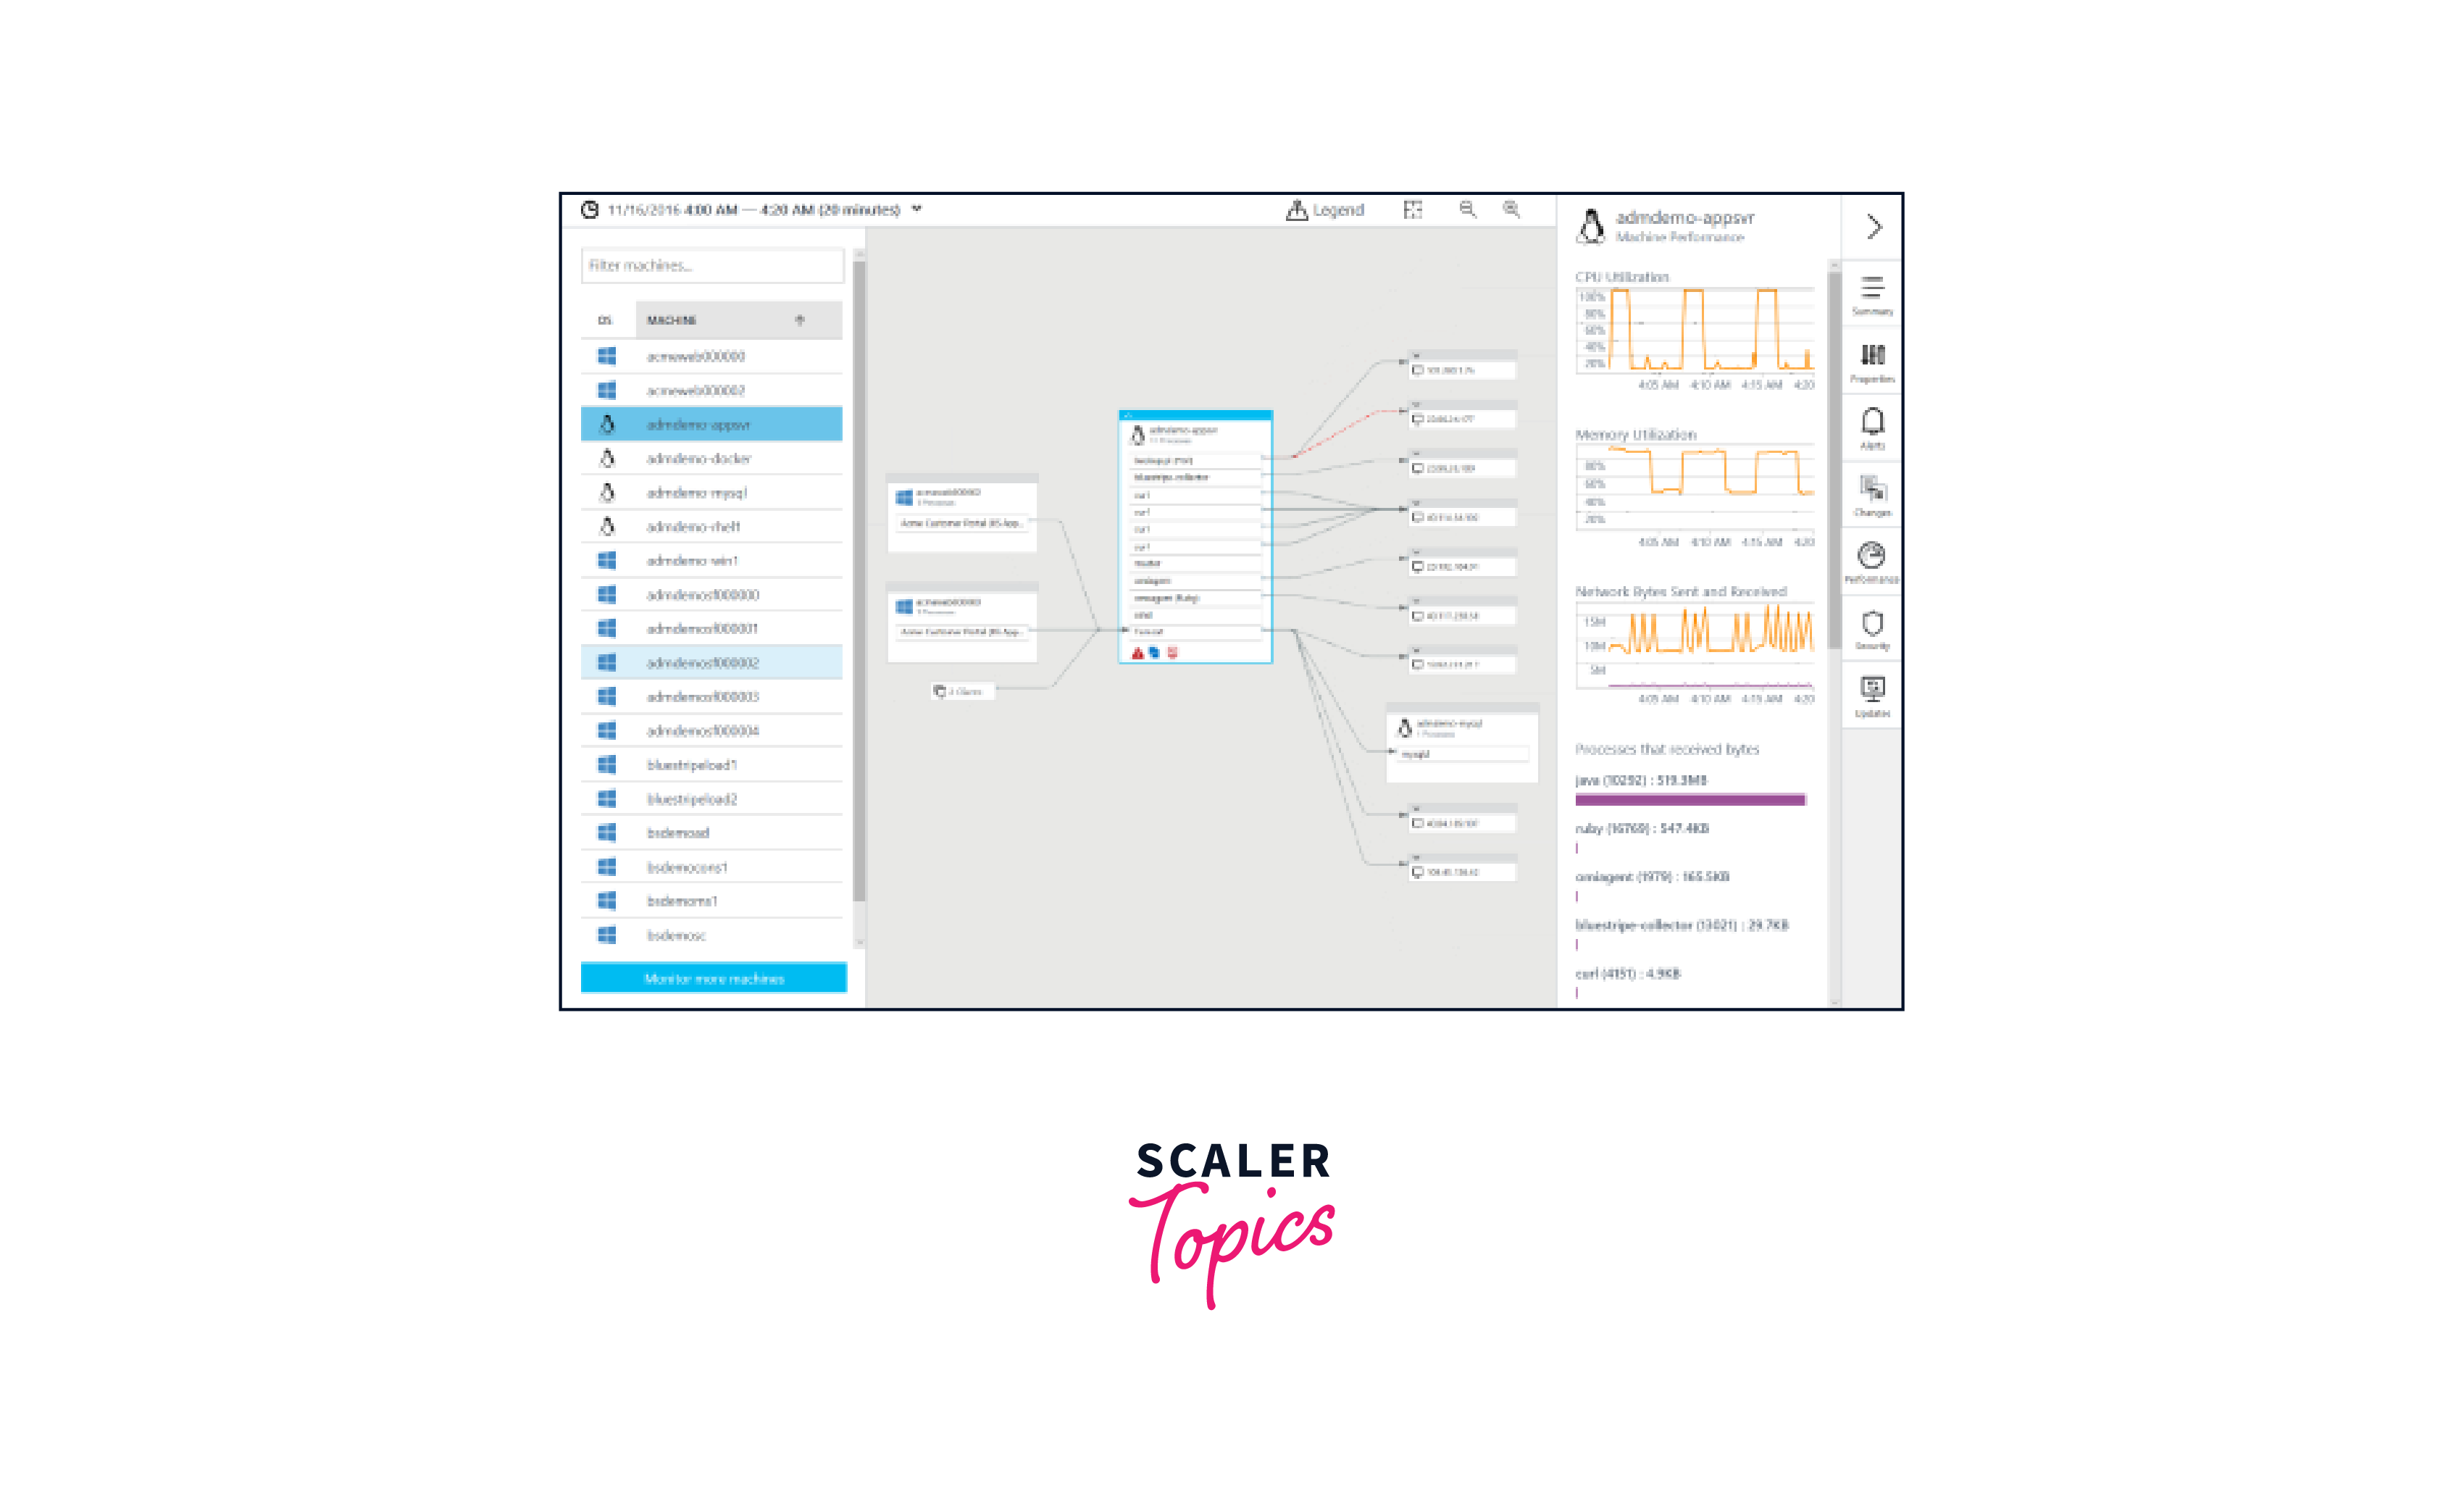
Real-time Monitoring:
It provides real-time monitoring of application components, helping you visualize the health and performance of your applications. This includes information on connections, processes, and dependencies. -
Integration with Azure Monitor:
Azure Service Map integrates with Azure Monitor, allowing you to correlate dependency information with other telemetry data and metrics collected by Azure Monitor. This integration provides a holistic view of your application's health and performance. -
Agent-Based Monitoring:
To use Azure Service Map, you need to install the Service Map Dependency Agent on the servers you want to monitor. The agent collects data about process execution, outbound network connections, and other relevant information to build the dependency map. -
Cross-Platform Support:
Azure Service Map supports monitoring of both Windows and Linux-based systems, allowing you to get a comprehensive view of your multi-platform applications. -
Application Insights Integration:
Azure Service Map can be integrated with Azure Application Insights, a service that helps you monitor the performance and usage of your applications.
Diagnostic and Usage Data
-
Definition:
- Diagnostic and usage data refers to information collected by software applications or systems to monitor their performance, identify issues, and gather insights into user behavior and system health.
-
Purpose:
- The primary purpose of collecting diagnostic and usage data is to improve software quality, enhance user experience, and aid in the efficient maintenance and troubleshooting of applications and systems.
-
Types of Data:
- Diagnostic Data:
- Focuses on information related to errors, crashes, and performance issues.
- Includes logs, error messages, stack traces, and debugging information.
- Usage Data:
- Involves information about how users interact with the software.
- Covers user actions, feature usage, and system resource utilization.
- Diagnostic Data:
-
Collection Methods:
- Automated Logging:
- Applications often include built-in mechanisms for automatically logging diagnostic events and errors.
- Telemetry:
- Telemetry is a method to collect usage data, capturing user interactions and patterns.
- User Feedback:
- Incorporating mechanisms for users to provide feedback or report issues contributes to diagnostic data.
- Automated Logging:
-
Privacy Considerations:
- Anonymization:
- Personal identifiers are often removed or anonymized to protect user privacy.
- Opt-in/Opt-out:
- Users may be given the option to opt-in or opt-out of data collection, respecting their preferences.
- Anonymization:
-
Importance in Software Development:
- Bug Identification:
- Diagnostic data helps developers identify and fix bugs and errors in the software.
- Performance Optimization:
- Usage data aids in optimizing software performance based on actual user interactions.
- Feature Improvement:
- Understanding user behavior guides the improvement and development of new features.
- Bug Identification:
-
Monitoring System Health:
- Proactive Issue Resolution:
- Continuous monitoring of diagnostic data enables proactive issue resolution before they impact users.
- Capacity Planning:
- Usage data helps in capacity planning by providing insights into resource utilization trends.
- Proactive Issue Resolution:
-
Troubleshooting and Debugging:
- Root Cause Analysis:
- Diagnostic data is invaluable for conducting root cause analysis during troubleshooting.
- Logging Levels:
- Different levels of logging, such as debug, info, warning, and error, help in narrowing down issues based on severity.
- Root Cause Analysis:
-
User Experience Enhancement:
- Usability Insights:
- Usage data provides insights into how users navigate through the application, helping improve usability.
- Feature Adoption:
- Understanding which features are frequently used or ignored helps in prioritizing enhancements.
- Usability Insights:
-
Continuous Improvement:
- Feedback Loop:
- The feedback loop created by diagnostic and usage data contributes to continuous improvement in software development.
- Agile Development:
- Agile methodologies leverage diagnostic and usage data for iterative development and rapid adaptation.
- Feedback Loop:
-
Security Monitoring:
- Anomaly Detection:
- Diagnostic data is essential for detecting anomalies or suspicious activities that might indicate security threats.
- Incident Response:
- In the event of a security incident, diagnostic data aids in incident response and forensics.
- Anomaly Detection:
-
Compliance and Regulations:
- GDPR Compliance:
- Adherence to data protection regulations like GDPR is crucial in the collection and use of diagnostic and usage data.
- Data Retention Policies:
- Establishing clear data retention policies ensures that data is stored and processed in compliance with legal requirements.
- GDPR Compliance:
-
Customization and Personalization:
- User Preferences:
- Usage data helps in understanding user preferences, leading to personalized user experiences.
- Adaptive Features:
- Applications can adapt and customize features based on user behavior, improving overall satisfaction.
- User Preferences:
-
Vendor and Third-Party Integration:
- Integration with Support Tools:
- Diagnostic data often integrates with customer support tools to streamline issue resolution.
- Collaboration with Third-Party Services:
- Sharing diagnostic data with third-party services may be necessary for specialized analysis or support.
- Integration with Support Tools:
-
Ethical Considerations:
- Transparency:
- Being transparent with users about data collection practices fosters trust.
- Data Minimization:
- Collecting only the necessary data minimizes the potential impact on user privacy.
- Transparency:
-
Continuous Monitoring and Adaptation:
- Dynamic Software Environment:
- The software environment is dynamic, and continuous monitoring and adaptation of diagnostic and usage data strategies are essential.
- Machine Learning Integration:
- Machine learning algorithms can be employed to analyze vast amounts of data, providing predictive insights for future issues.
- Dynamic Software Environment:
-
User Education:
- Informing Users:
- Educating users about the importance of diagnostic and usage data for improving software quality and user experience.
- Optimization Benefits:
- Demonstrating how diagnostic and usage data contribute to performance optimization and user-centric improvements.
- Informing Users:
- Comprehensive Reporting:
- Dashboard Analytics:
- Providing stakeholders with comprehensive dashboards and analytics based on diagnostic and usage data.
- Trend Analysis:
- Analyzing trends over time aids in making informed decisions about software development and user engagement strategies.
- Dashboard Analytics:
Steps to Create a Service Map
Creating a service map in Azure involves several steps to set up and configure the necessary components. Below are the key steps to create a service map:
-
Access Azure Portal:
- Log in to the Azure Portal using your credentials.
-
Navigate to Service Map:
- In the Azure Portal, navigate to the "Service Map" section. You can find it in the Monitoring + Management section or by using the search bar.
-
Enable Service Map:
- Enable Service Map for the desired resources. This typically involves selecting the specific virtual machines or servers for which you want to create a service map.
-
Install Service Map Dependency Agent:
- Install the Service Map Dependency Agent on each virtual machine or server that you want to include in the service map. The agent collects data about processes, connections, and dependencies.
-
Agent Configuration:
- Configure the Service Map Dependency Agent settings on each machine. Ensure that the agent is configured to communicate with the Azure portal.
-
Validate Connectivity:
- Verify that the virtual machines or servers with the installed agent can communicate with the Azure portal. Check for any connectivity issues that might prevent data from being sent to the portal.
-
Wait for Data Collection:
- Allow some time for the Service Map to collect data from the agents. The service map will dynamically update as data is collected in real-time.
-
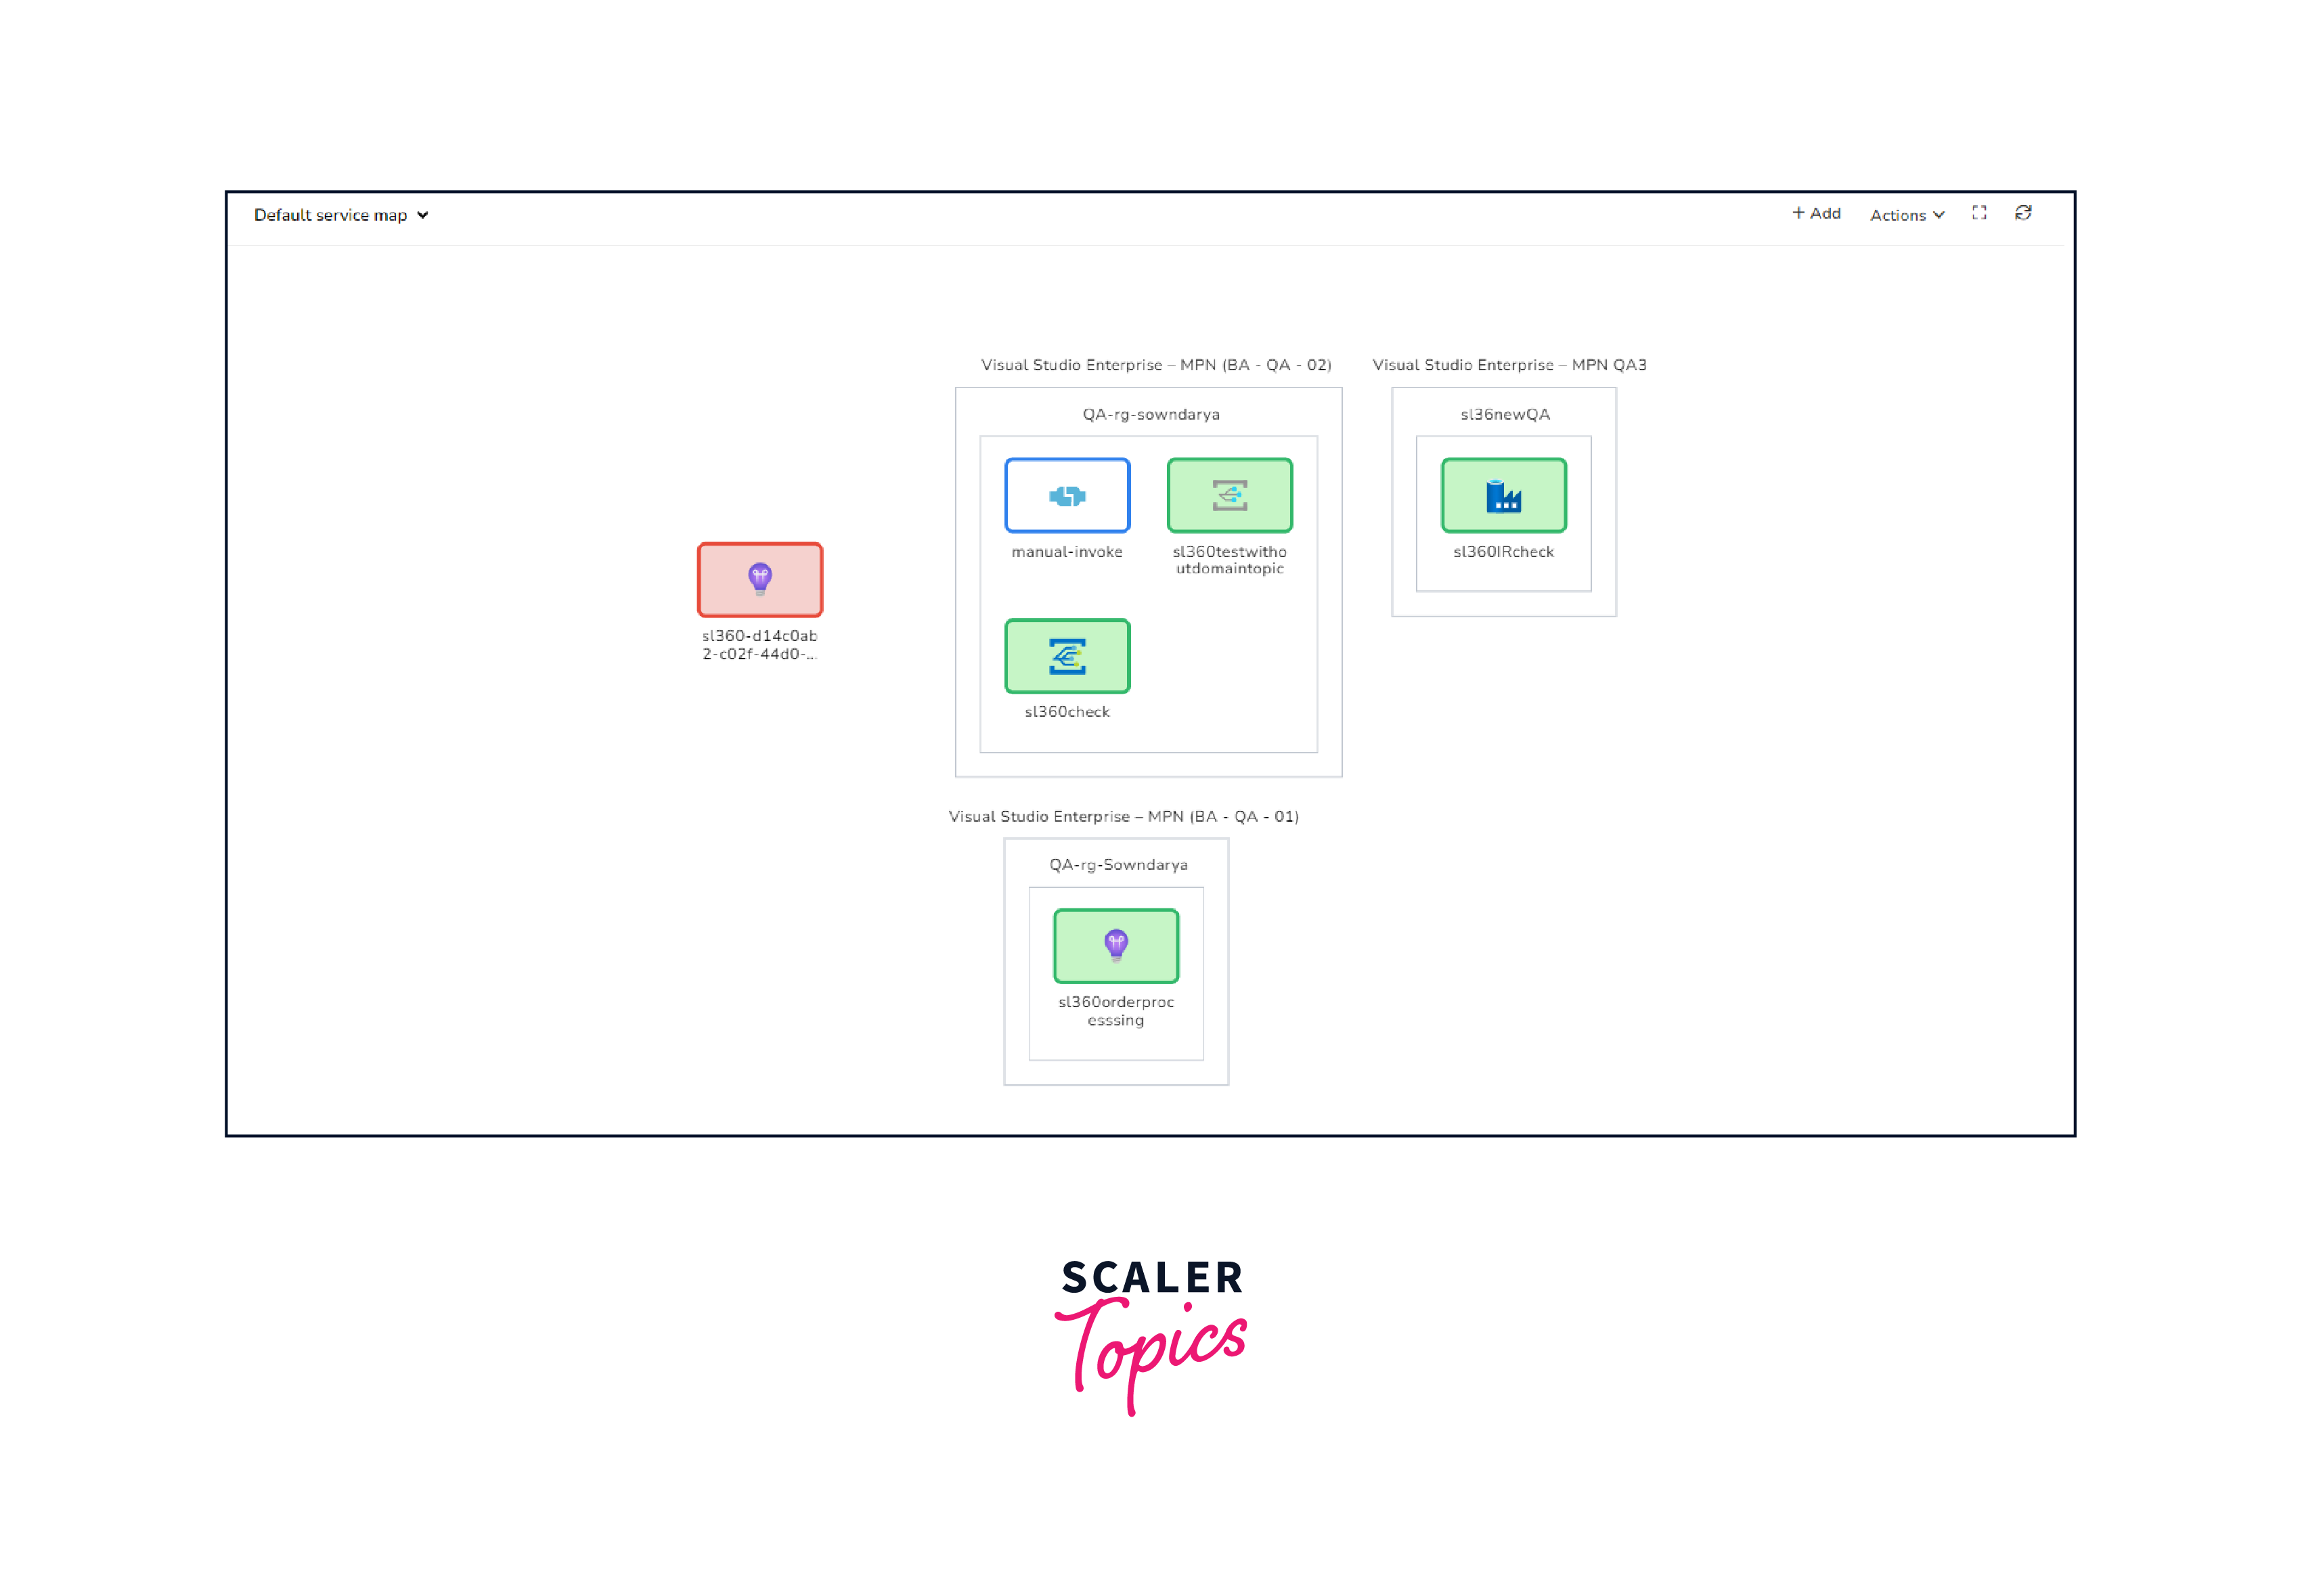
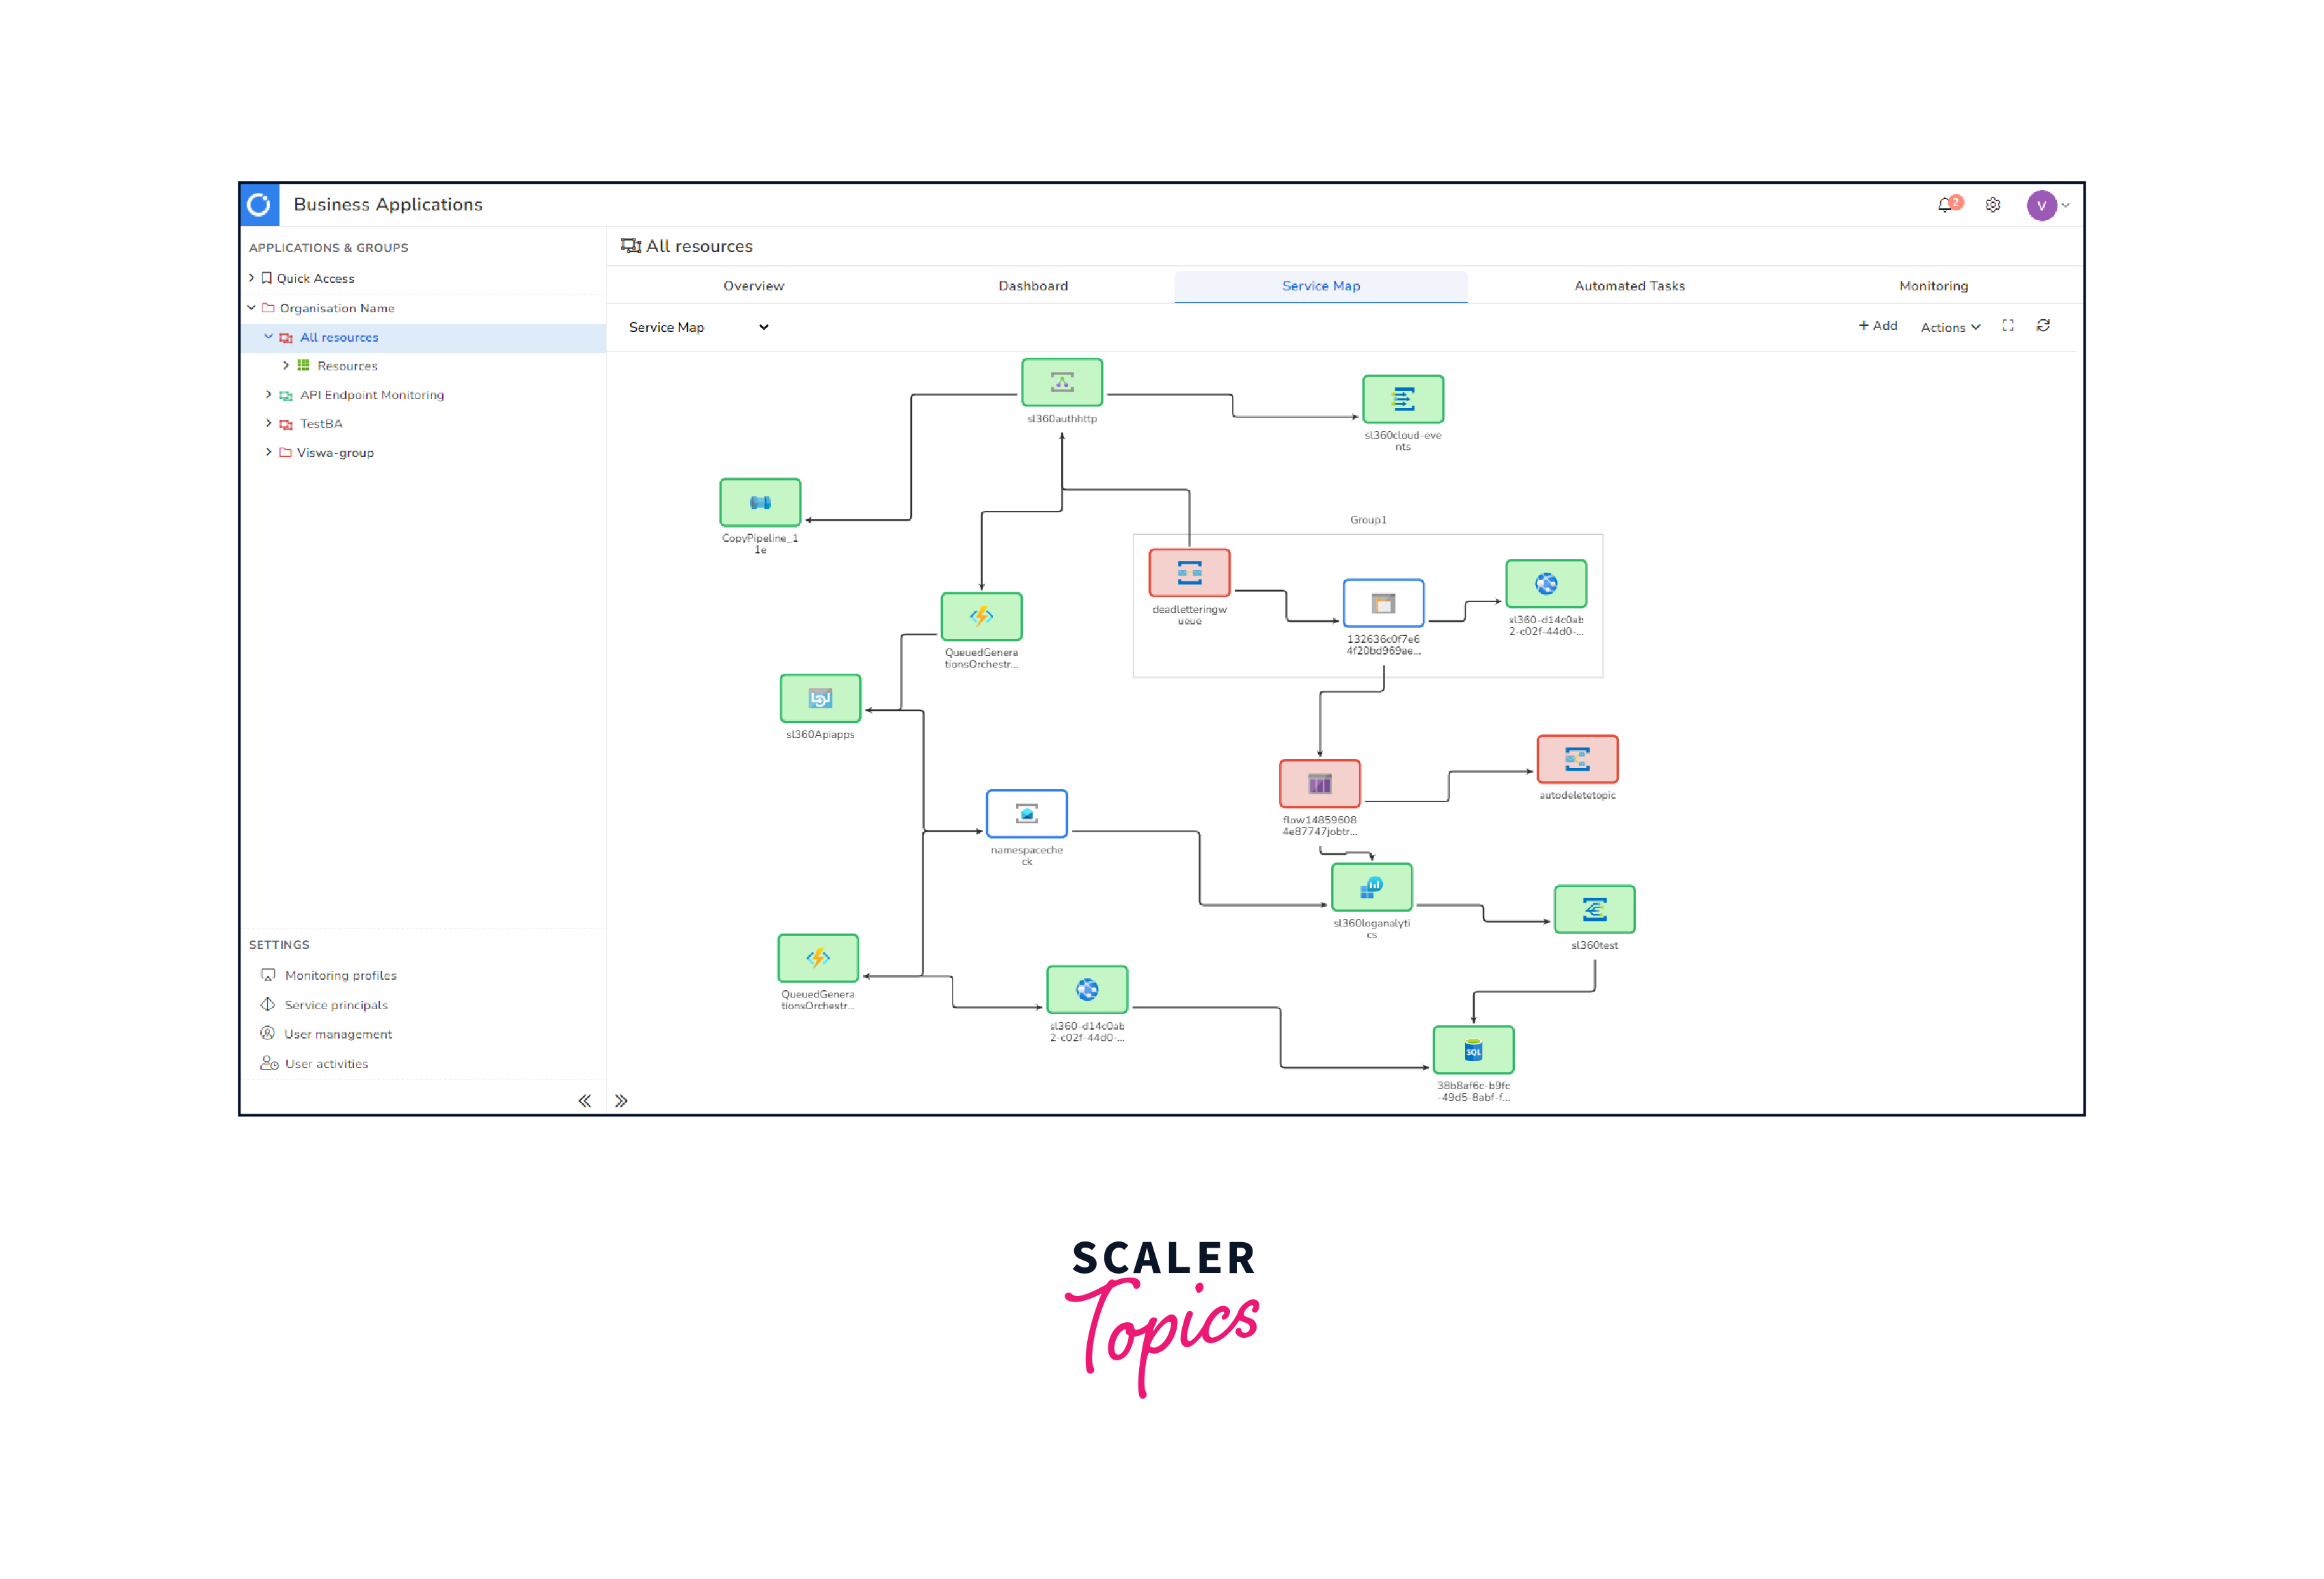
View Service Map:
- Once data collection has started, access the Service Map within the Azure Portal. Navigate to the Service Map section, and you should see an interactive map displaying the relationships and dependencies between the selected virtual machines or servers.
-
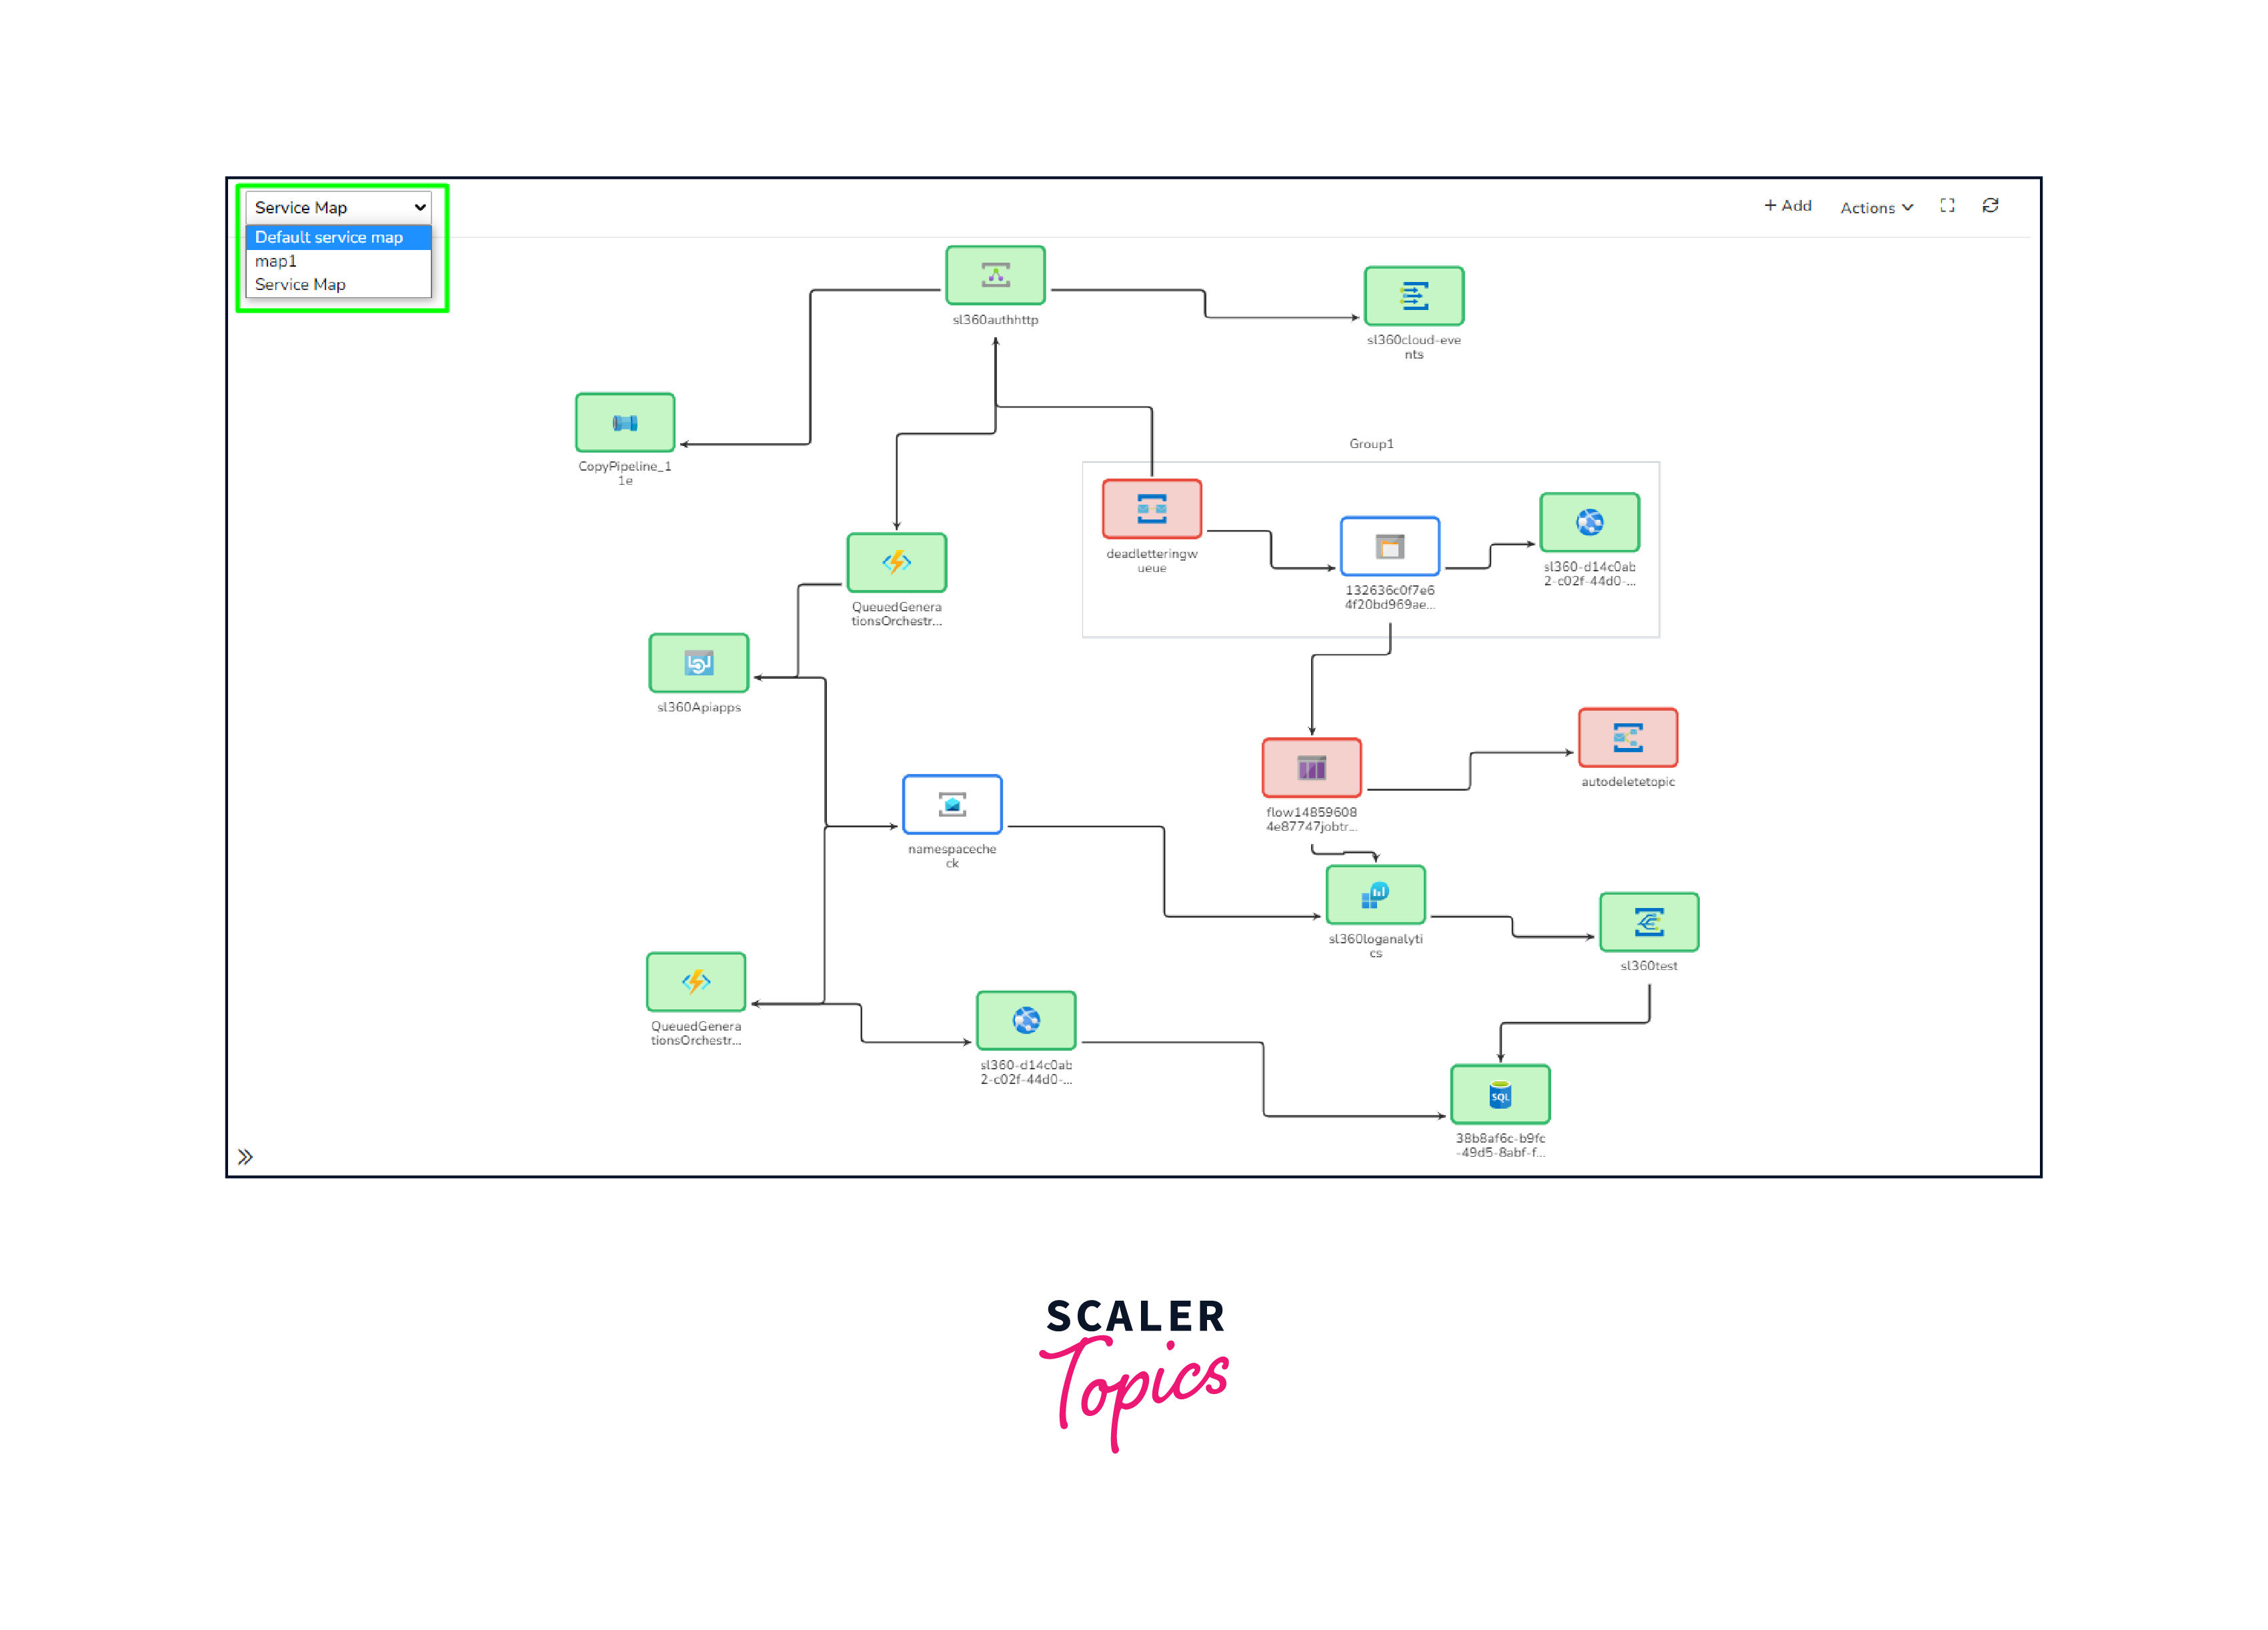
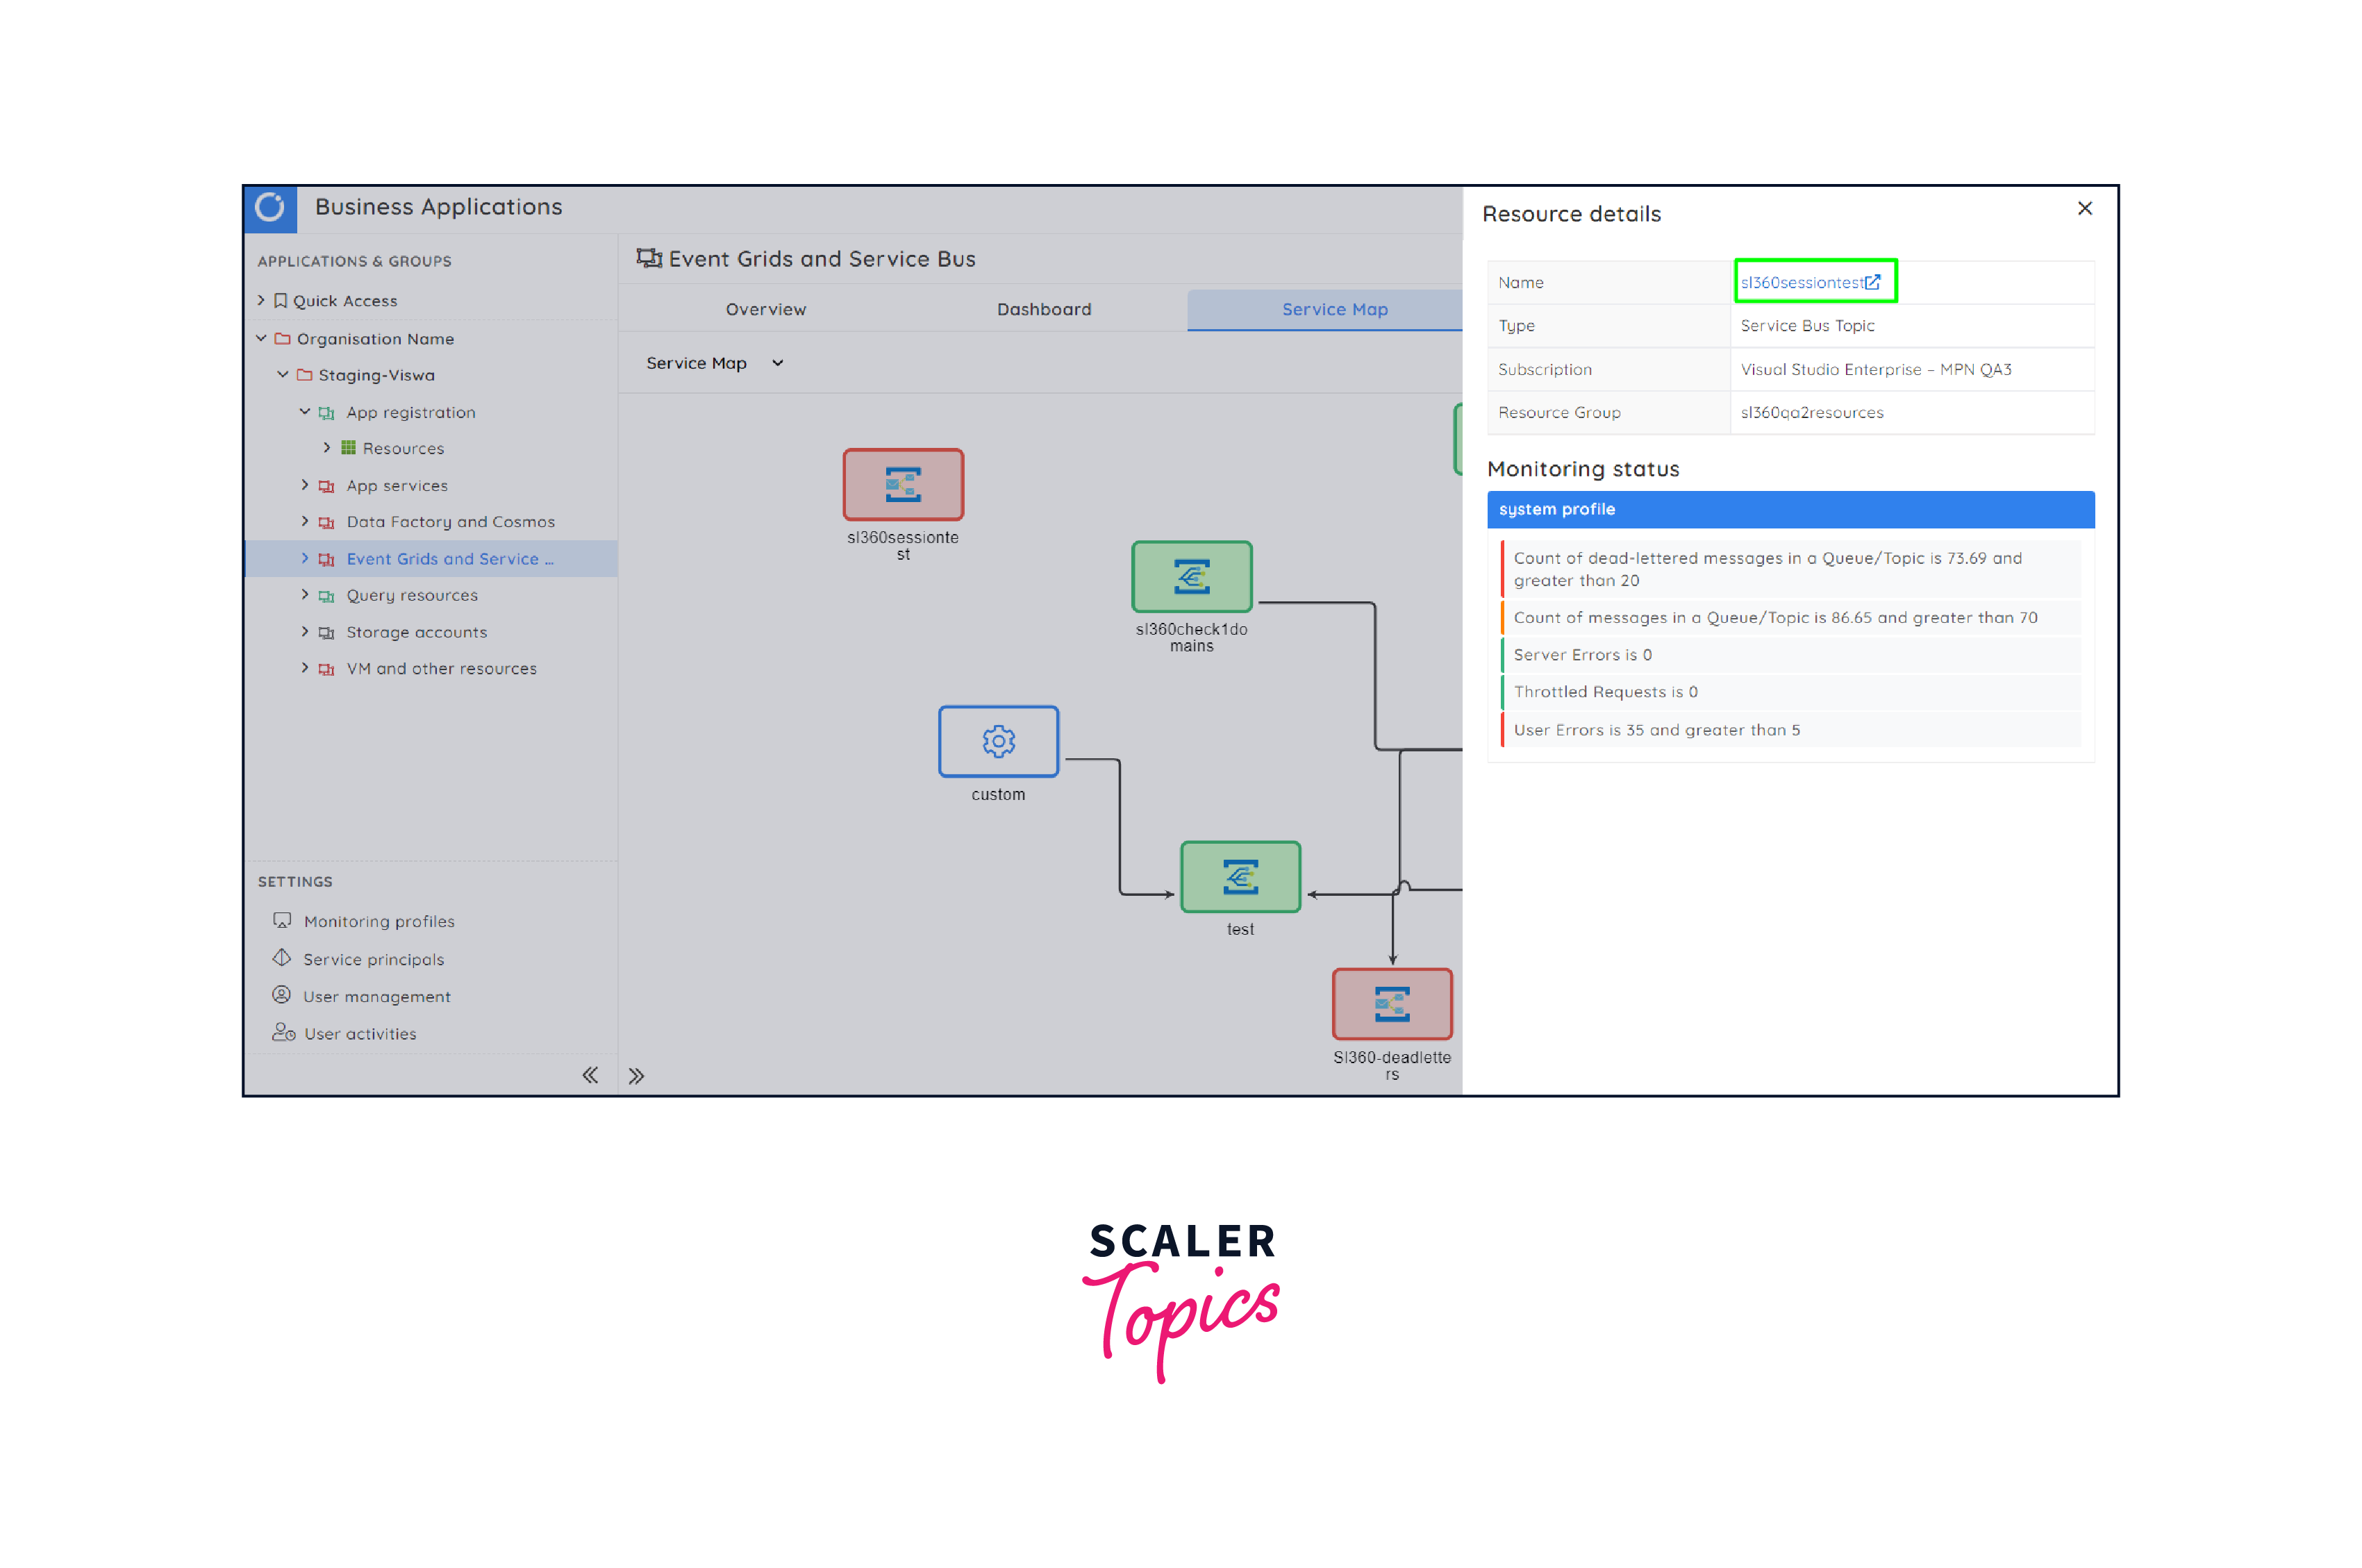
Explore Dependencies:
- Use the interactive map to explore dependencies between different components. Click on nodes to view detailed information about processes, connections, and dependencies.
-
Filter and Customize:
- Utilize filtering options to focus on specific aspects of the service map, such as particular machines, applications, or connection types. Customize the view based on your monitoring requirements.
-
Integrate with Azure Monitor:
- Leverage the integration with Azure Monitor to combine the insights from Service Map with other monitoring tools and metrics available in Azure. This provides a comprehensive view of the application's performance.
-
Set Alerts and Notifications:
- Configure alerts and notifications based on the insights gathered from the service map. This helps in proactively addressing issues and maintaining the health of your applications.
-
Regularly Review and Update:
- Regularly review the service map to stay informed about any changes in dependencies or performance issues. Update configurations and settings as needed to adapt to changes in your application.
-
Documentation and Knowledge Sharing:
- Document the service map configurations and dependencies. Share this knowledge with relevant teams to facilitate collaboration and troubleshooting.
-
Optimize and Scale:
- Use the insights gained from the service map to optimize the performance of your applications. Scale resources based on usage patterns and dependencies to ensure efficiency.
By following these steps, you can create and leverage a service map in Azure to gain valuable insights into the dependencies and relationships within your applications. This facilitates efficient monitoring, troubleshooting, and optimization of application performance.
Conclusion
- Azure Service Map simplifies the management of complex applications by providing a clear and visual representation of dependencies.
- The real-time monitoring and diagnostic capabilities empower users to efficiently troubleshoot issues and optimize application performance.
- Integration with Azure Monitor enhances the overall monitoring experience, allowing for a unified approach to application management.
- By understanding user behavior through usage data, Service Map contributes to enhancing the overall user experience.
- Service Map aids in security monitoring and ensures compliance with data protection regulations through anonymization and user opt-in/opt-out options.
- Transparent data collection practices and user education build trust and encourage user participation in providing diagnostic and usage data.
- The dynamic software environment requires continuous monitoring and adaptation of diagnostic and usage data strategies for effective application management.