Chrome Developer Tools CSS

Overview
In this article, we will learn about chrome Dev Tools CSS extension used to assist you with troubleshooting and to develop your website. Even we will cover some advanced-level stuff, including identifying potential improvements and unused CSS.
Introduction
Sometimes working with CSS is painful and even debugging CSS is stressful for most novice developers because CSS does not show errors directly.
To make it easy for all the developers, Google Chrome introduced developer tools also known as DevTools to help with troubleshooting and debugging CSS. DevTools is a collection of various tools like inspecting an element, editing, and viewing CSS styles.
There are a lot of things you can easily do with DevTools like CSS live-editing, layout testing, debug diagnostics, temporary editing.
Accessing Chrome Developer Tools
- Open the Google Chrome browser on your computer.
- Navigate to the website you want to inspect.
- You have several ways to open DevTools, and below I have shown you all the ways,
- Press the F12 key.
- Open the Menu tab, select More Tools and click on Developer Tools (Alternatively you can use the keyboard shortcut Ctrl+Shift+i to open DevTools.)

- Right-click on an element on your website and select Inspect, this way you can easily access DevTools.
Now you know how to use DevTools and it's time to go through all its features and modify live CSS with inspecting elements.
DevTools looks like this
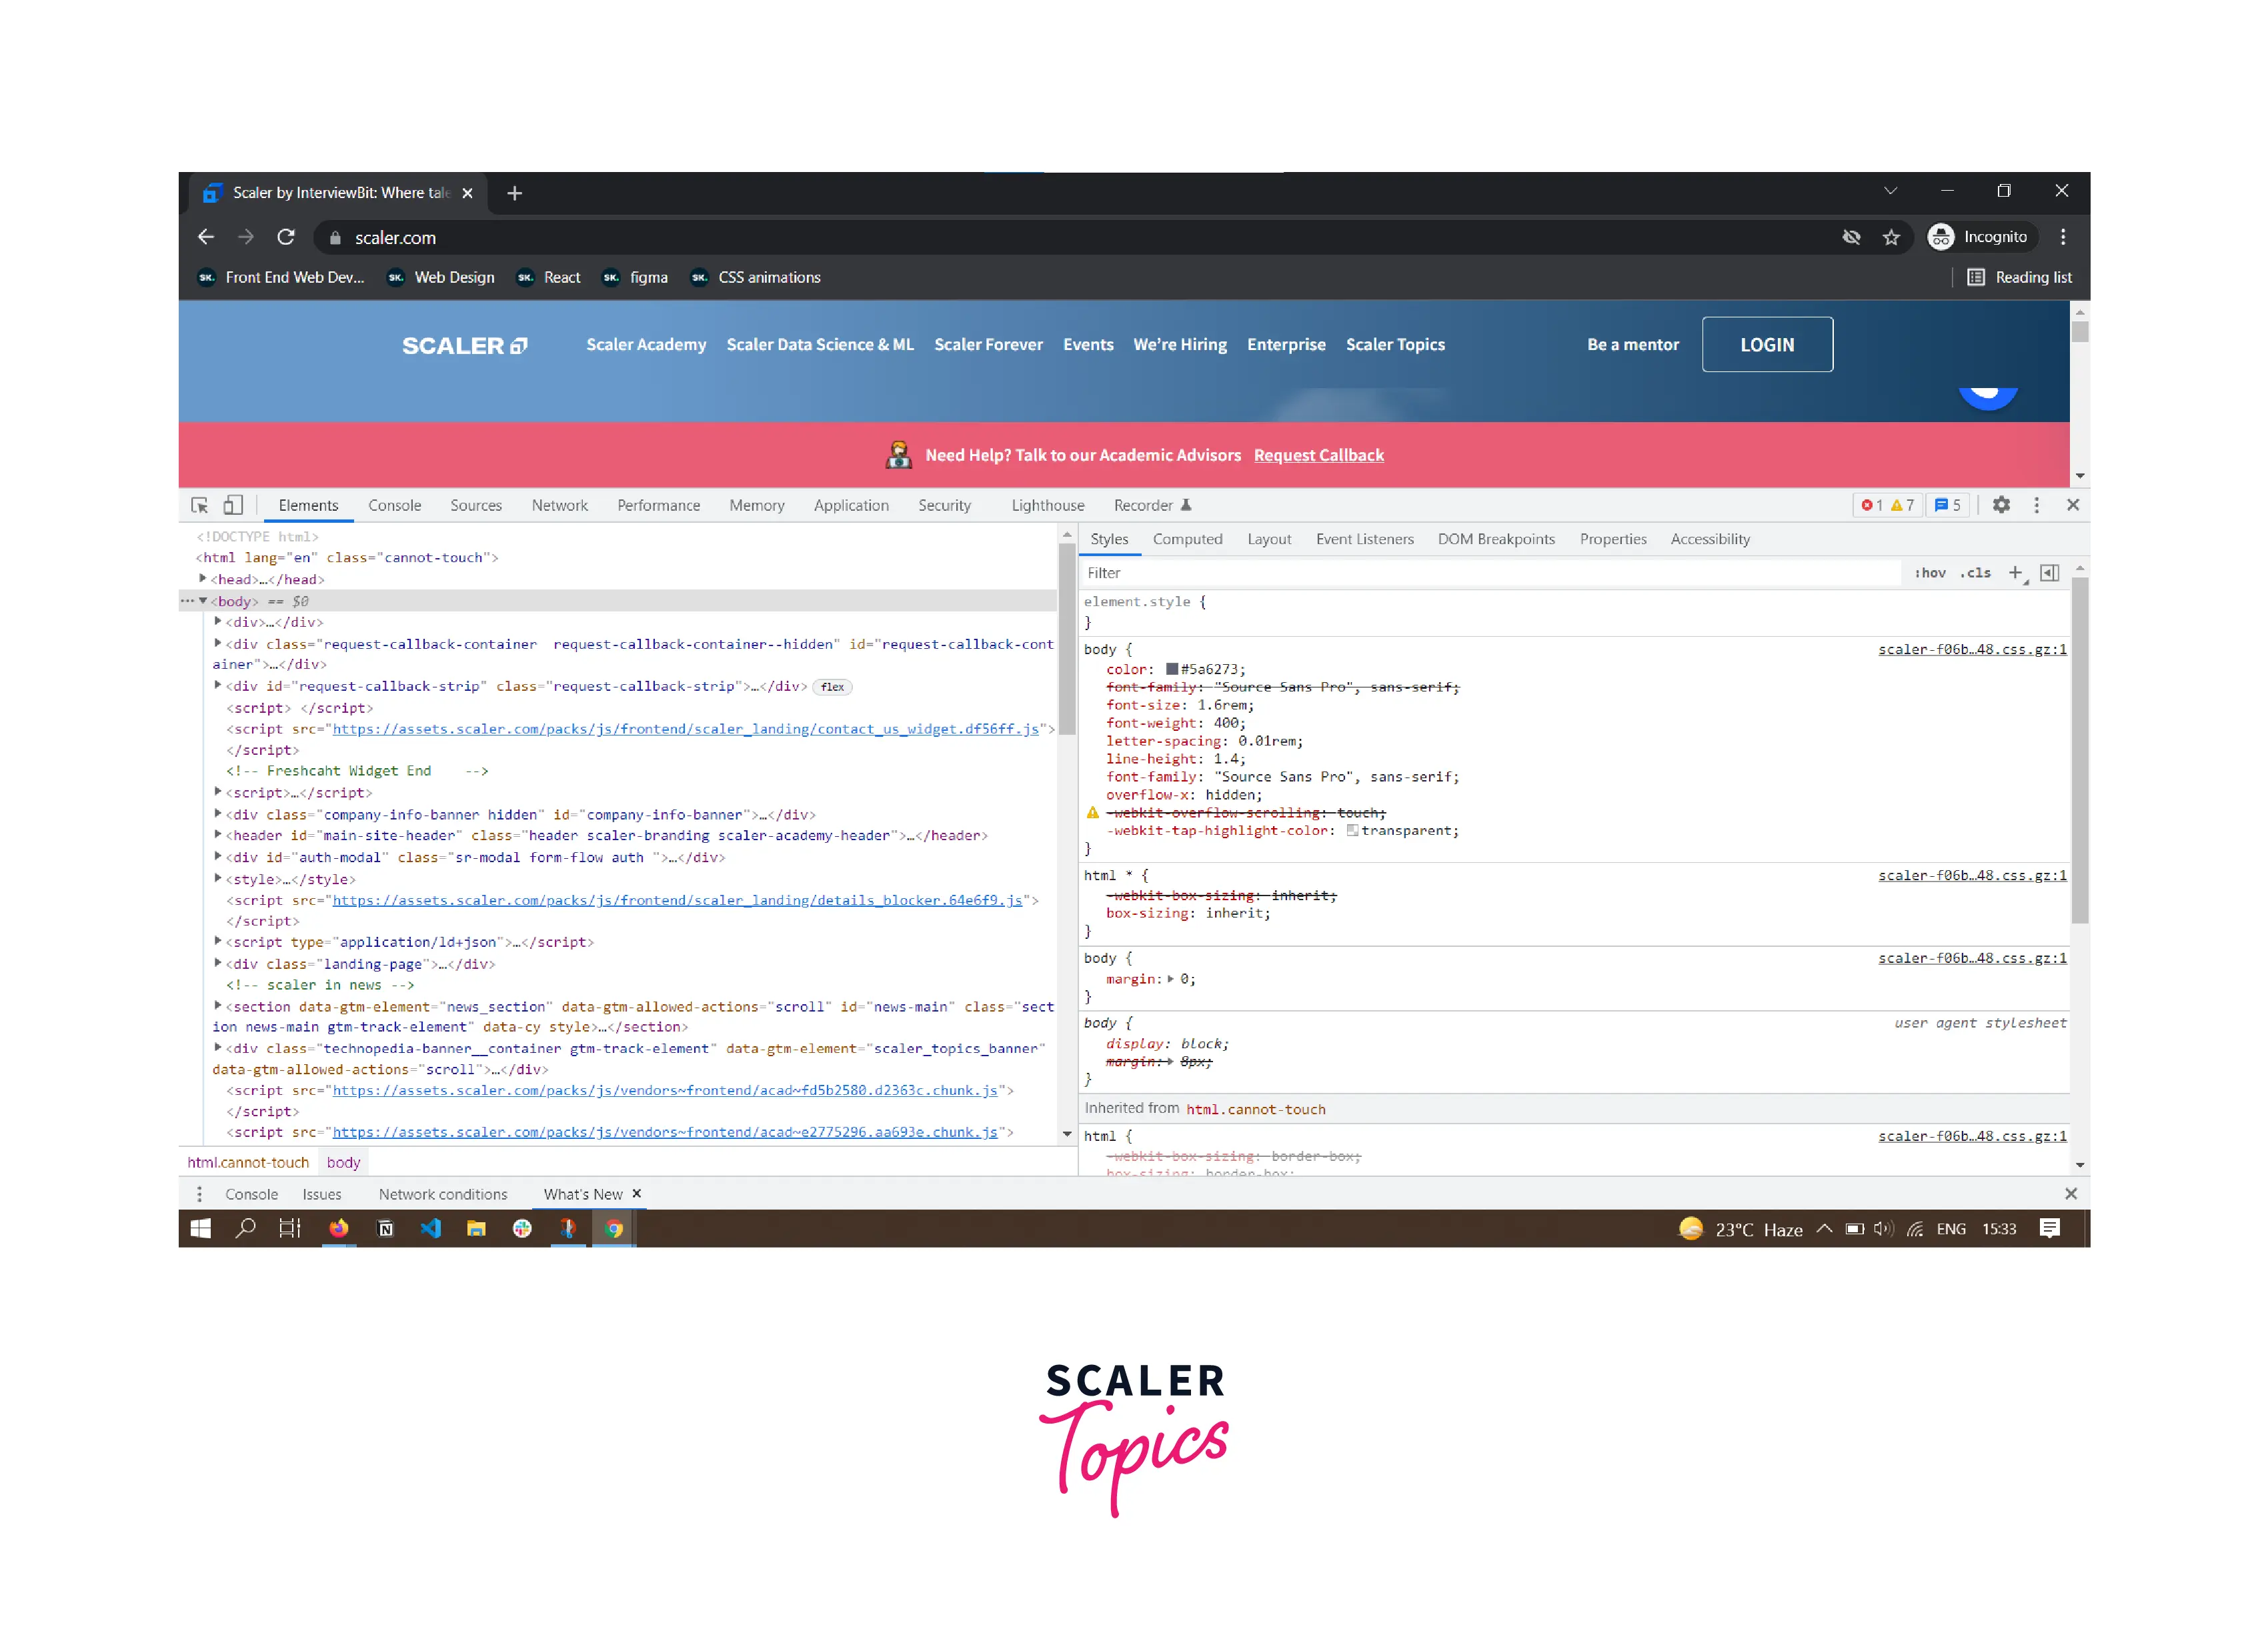
Inspect an Element
To inspect an element you just need to open DevTools and it shows the default element tab along with the HTML DOM tree of the inspected page.
When you scroll down the HTML DOM tree and hover over an element, it is highlighted on the page.
Also, notice the HTML DOM tree and the highlighted div in the image below.
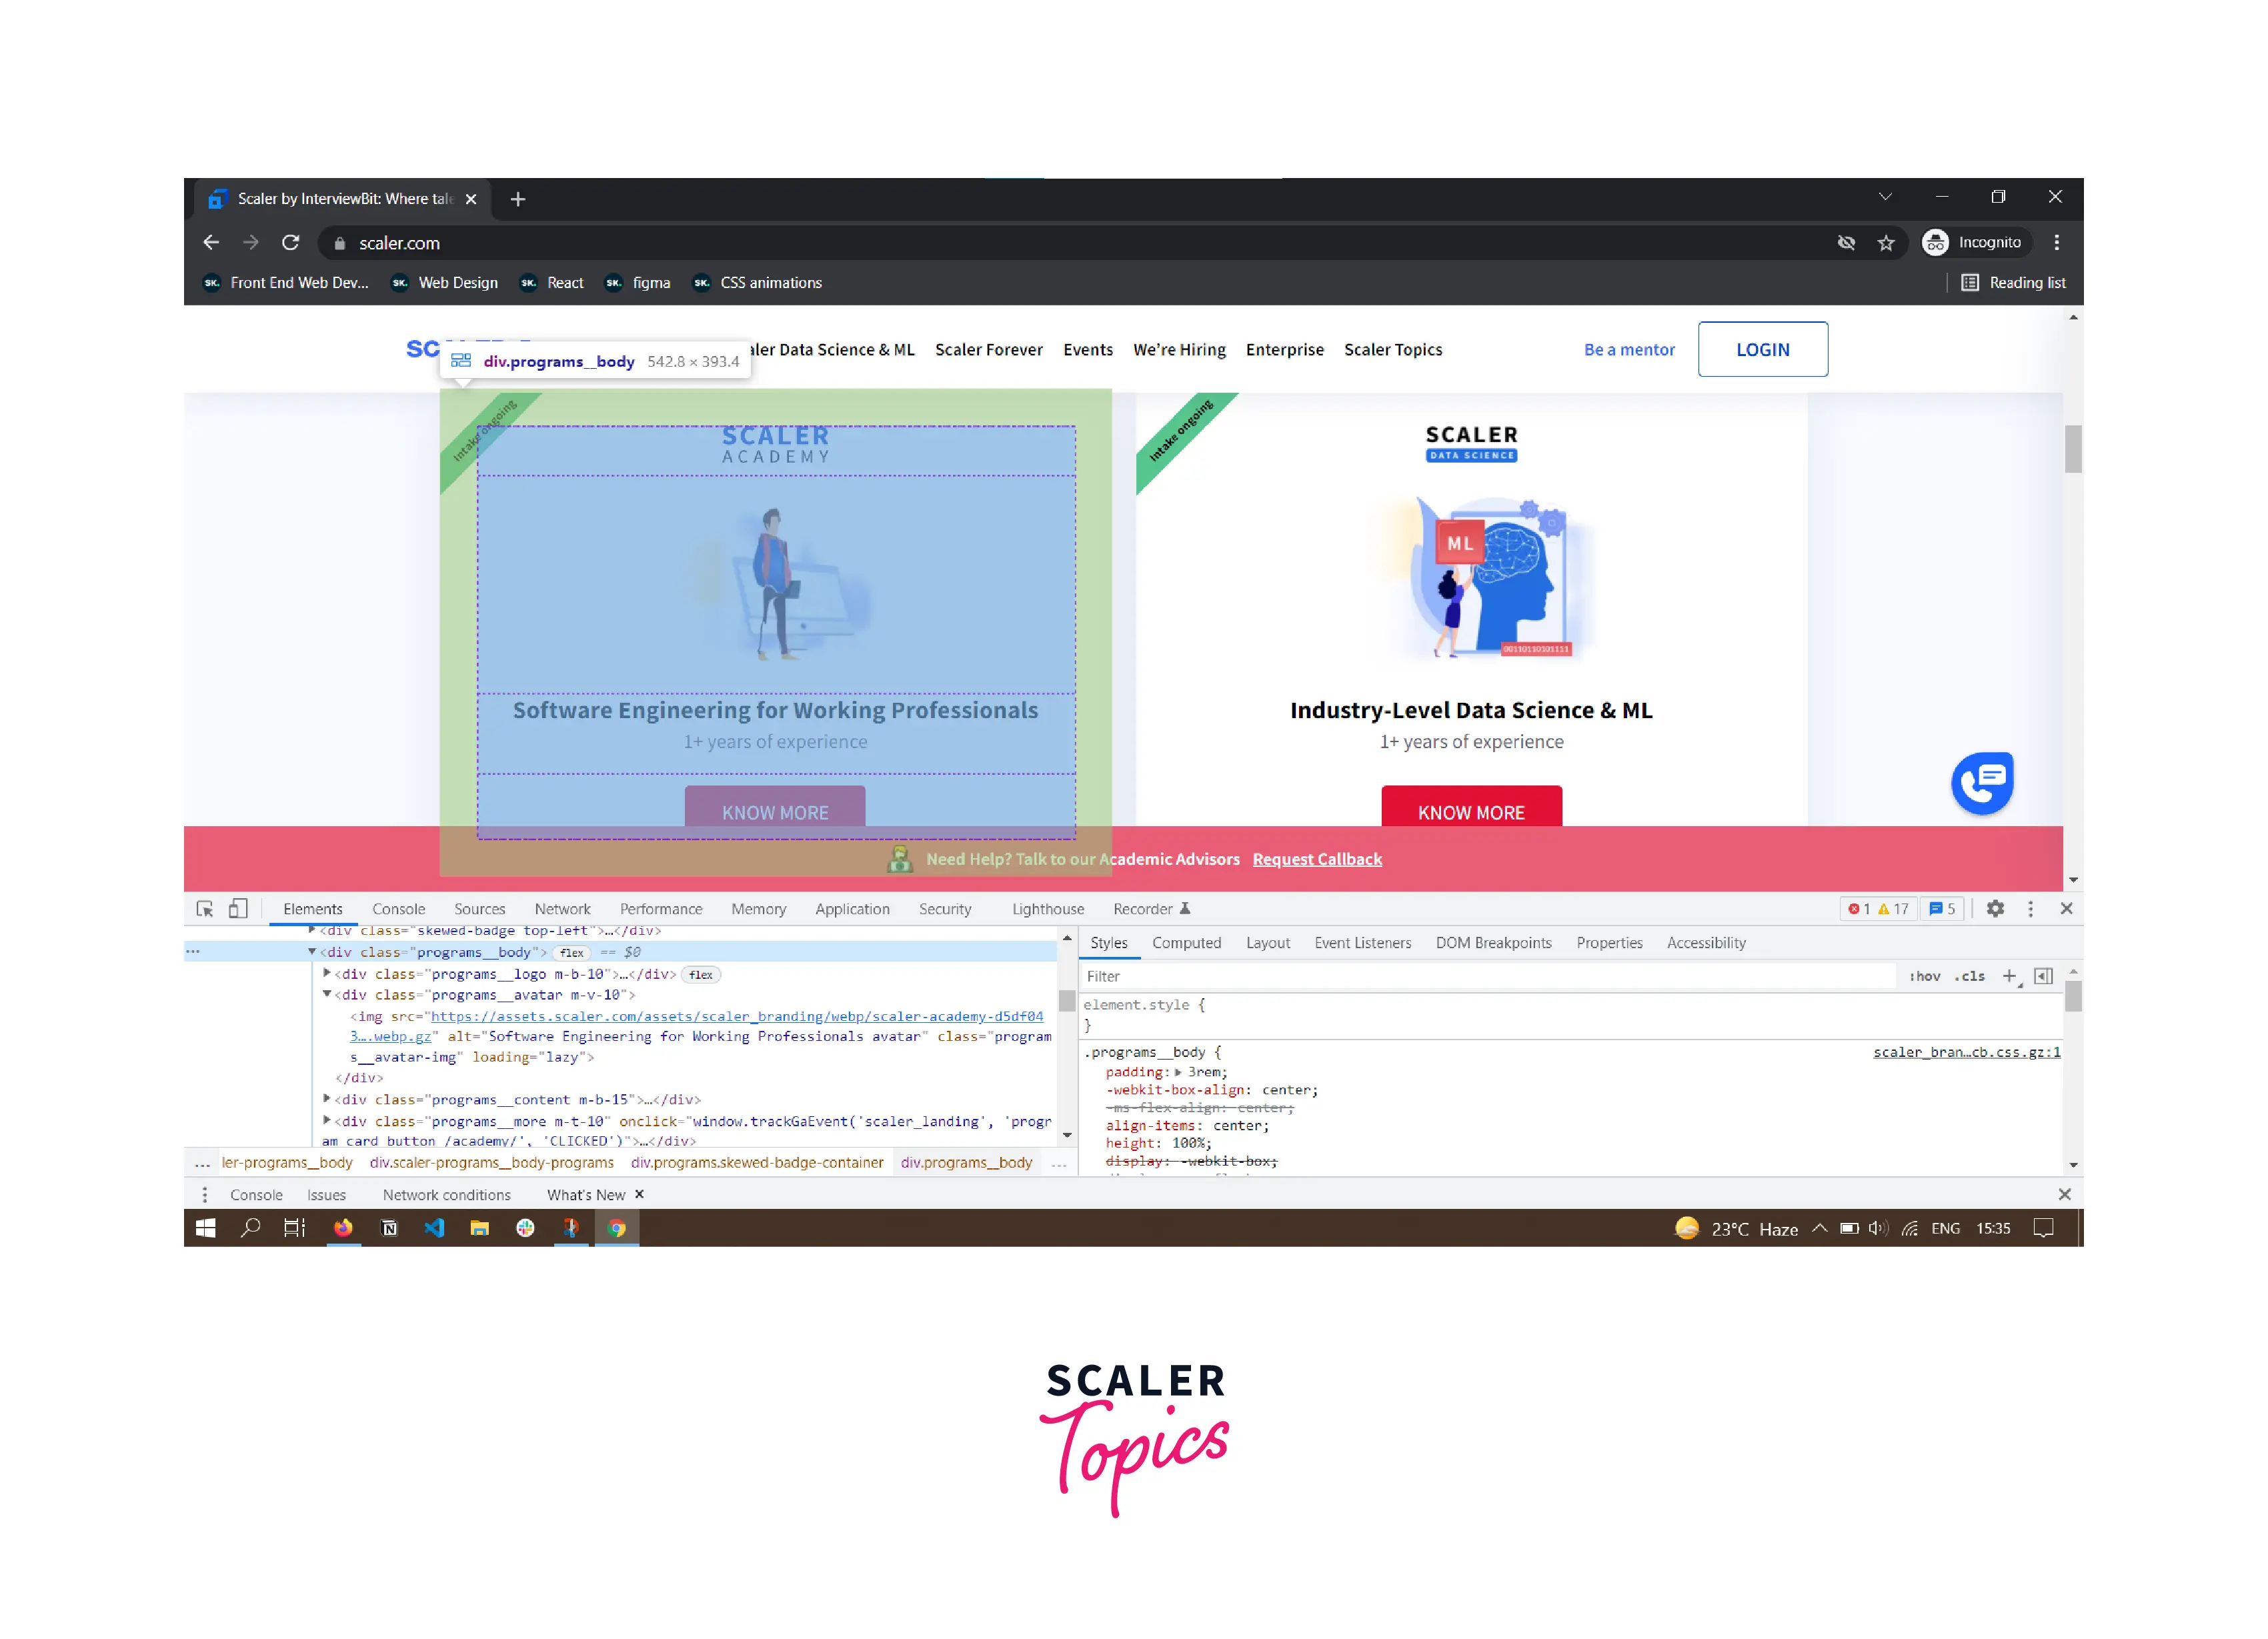
You will be able to inspect the elements, now let's look at the CSS styles of the elements.
View an Element CSS
Google Chrome provides the ability to view CSS styles and even make live changes to CSS styles.
To view the styles of an element you just need to open DevTools or inspect the element -
- Inspect the Element and open DevTools.
- Hover over the HTML element whose style you want to view.
When you hover over the HTML element, you can easily see the style near the DOM tree on the right side.

The Styles tab shows all applicable styles of a particular HTML element, but these are not the final styles of the Element. And Even you can able to see in the above image that some style declarations are crossed or not applied.
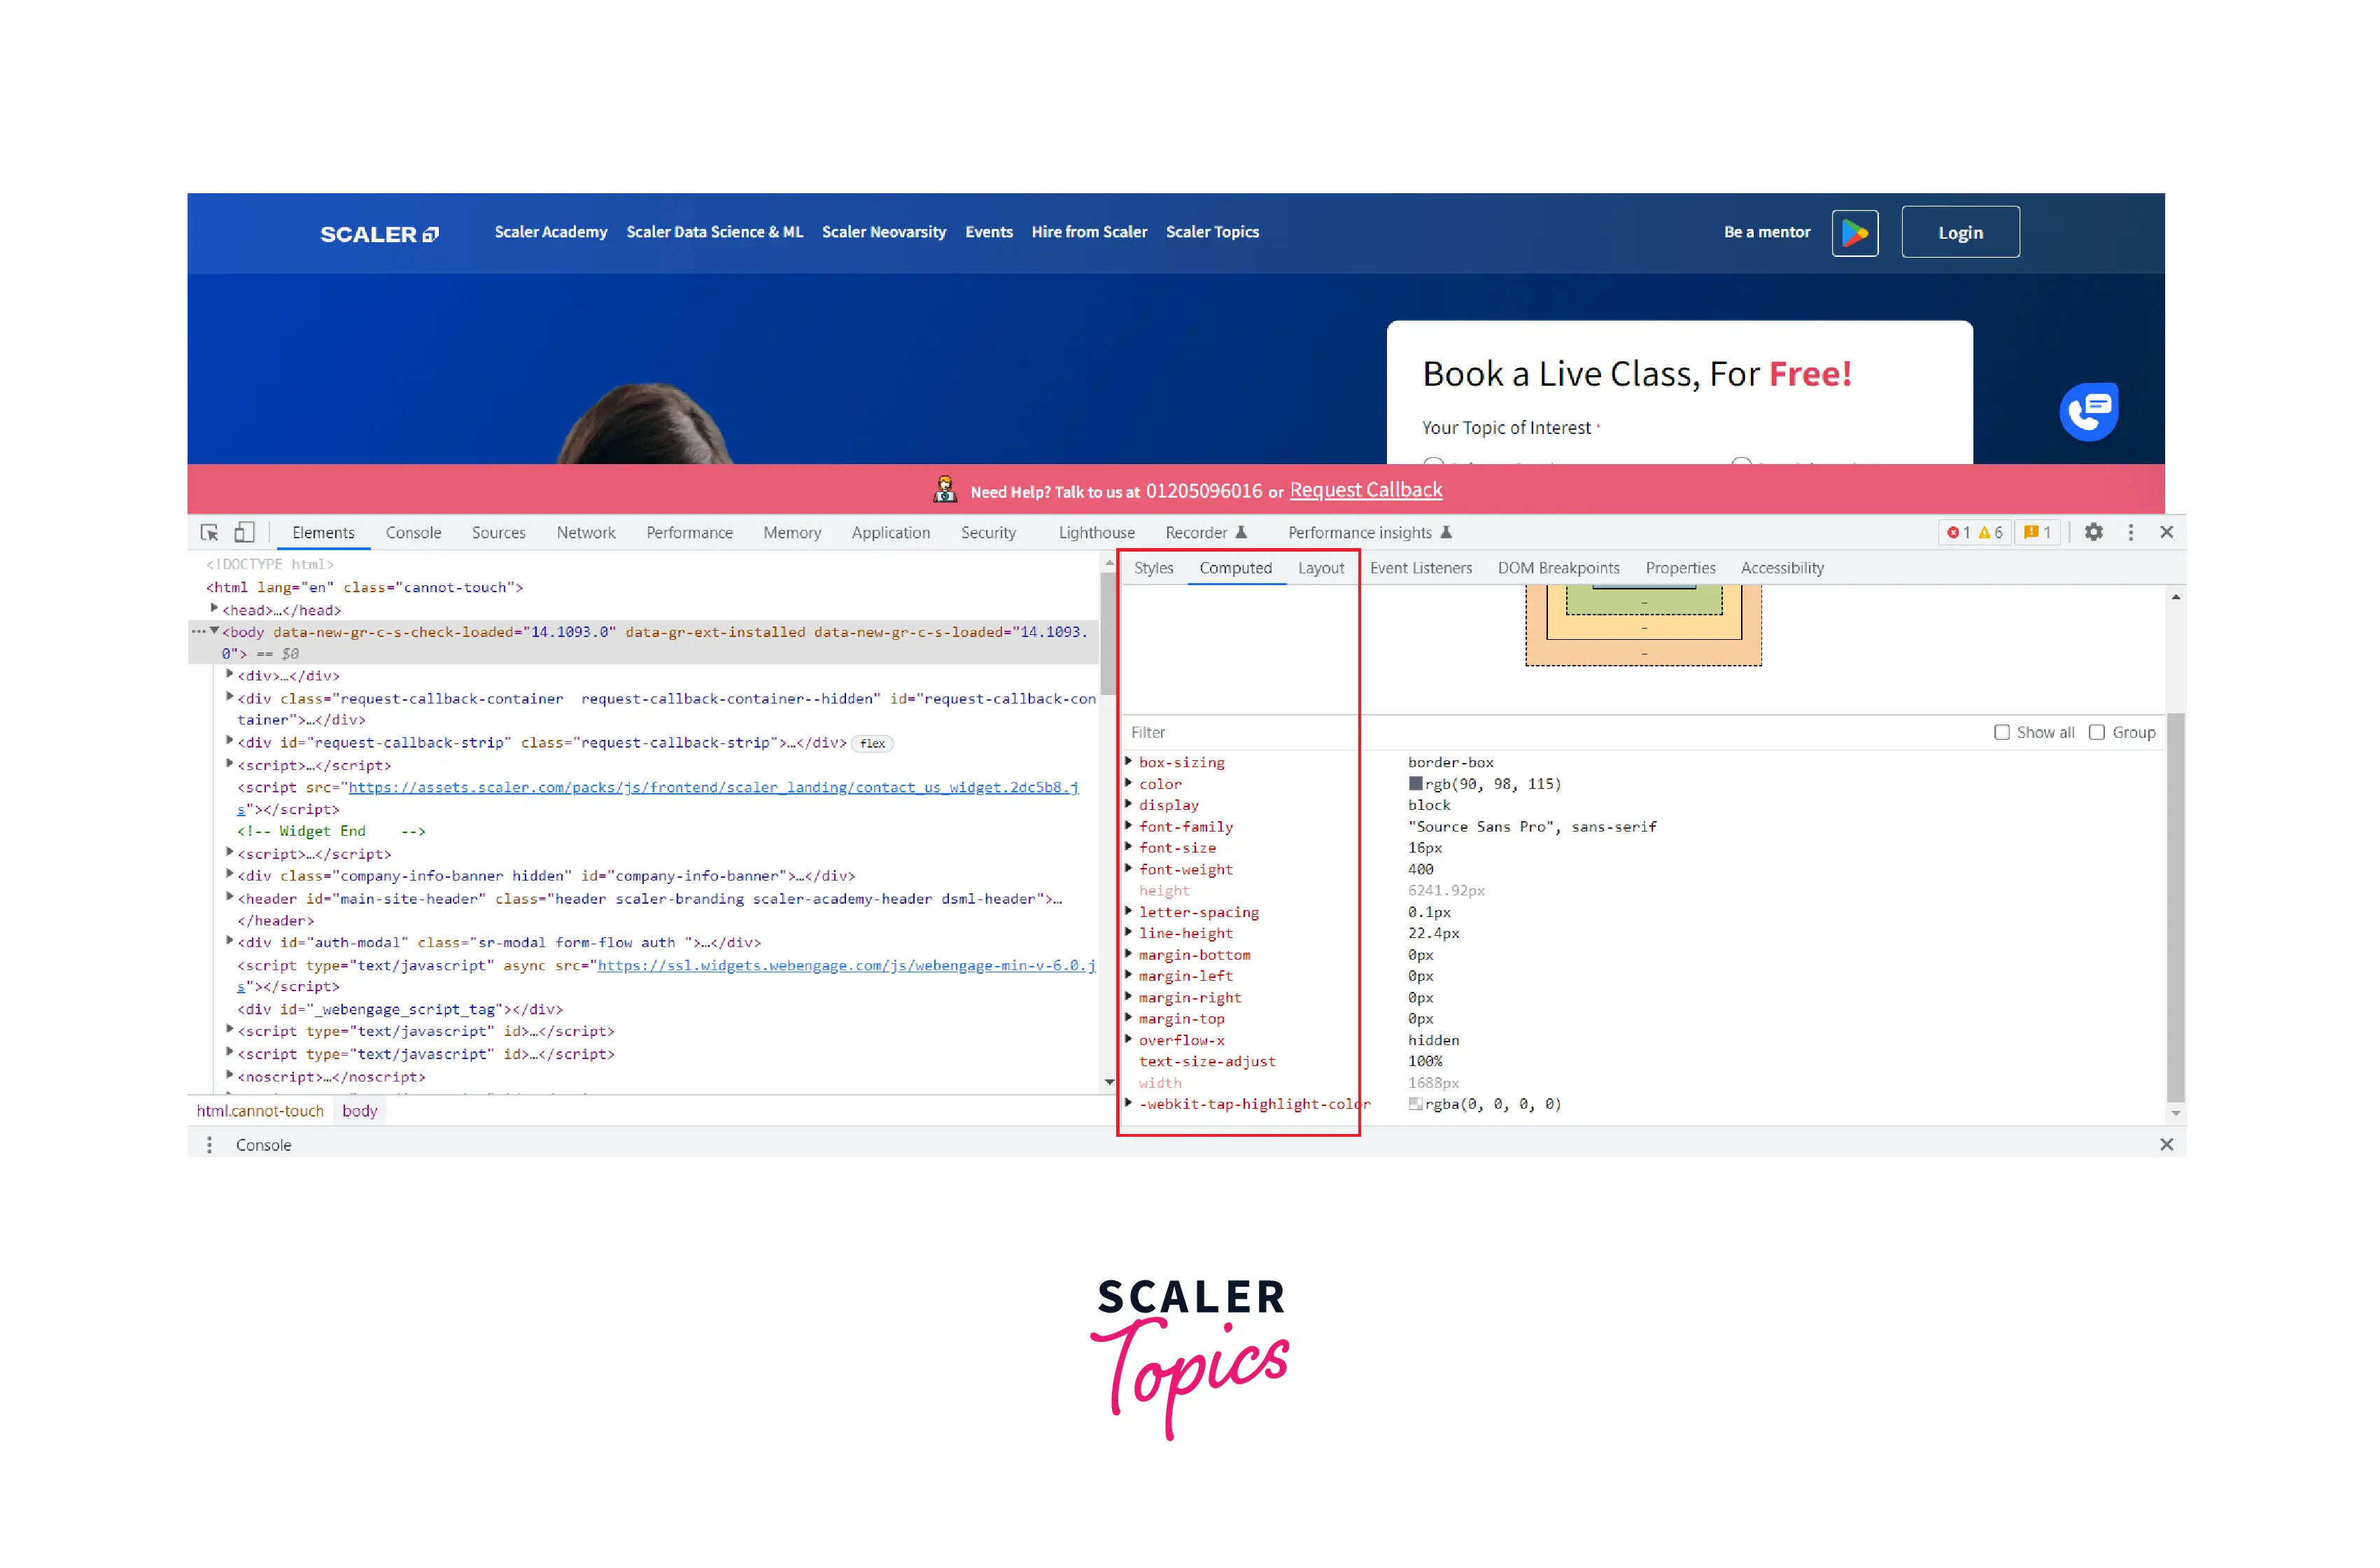
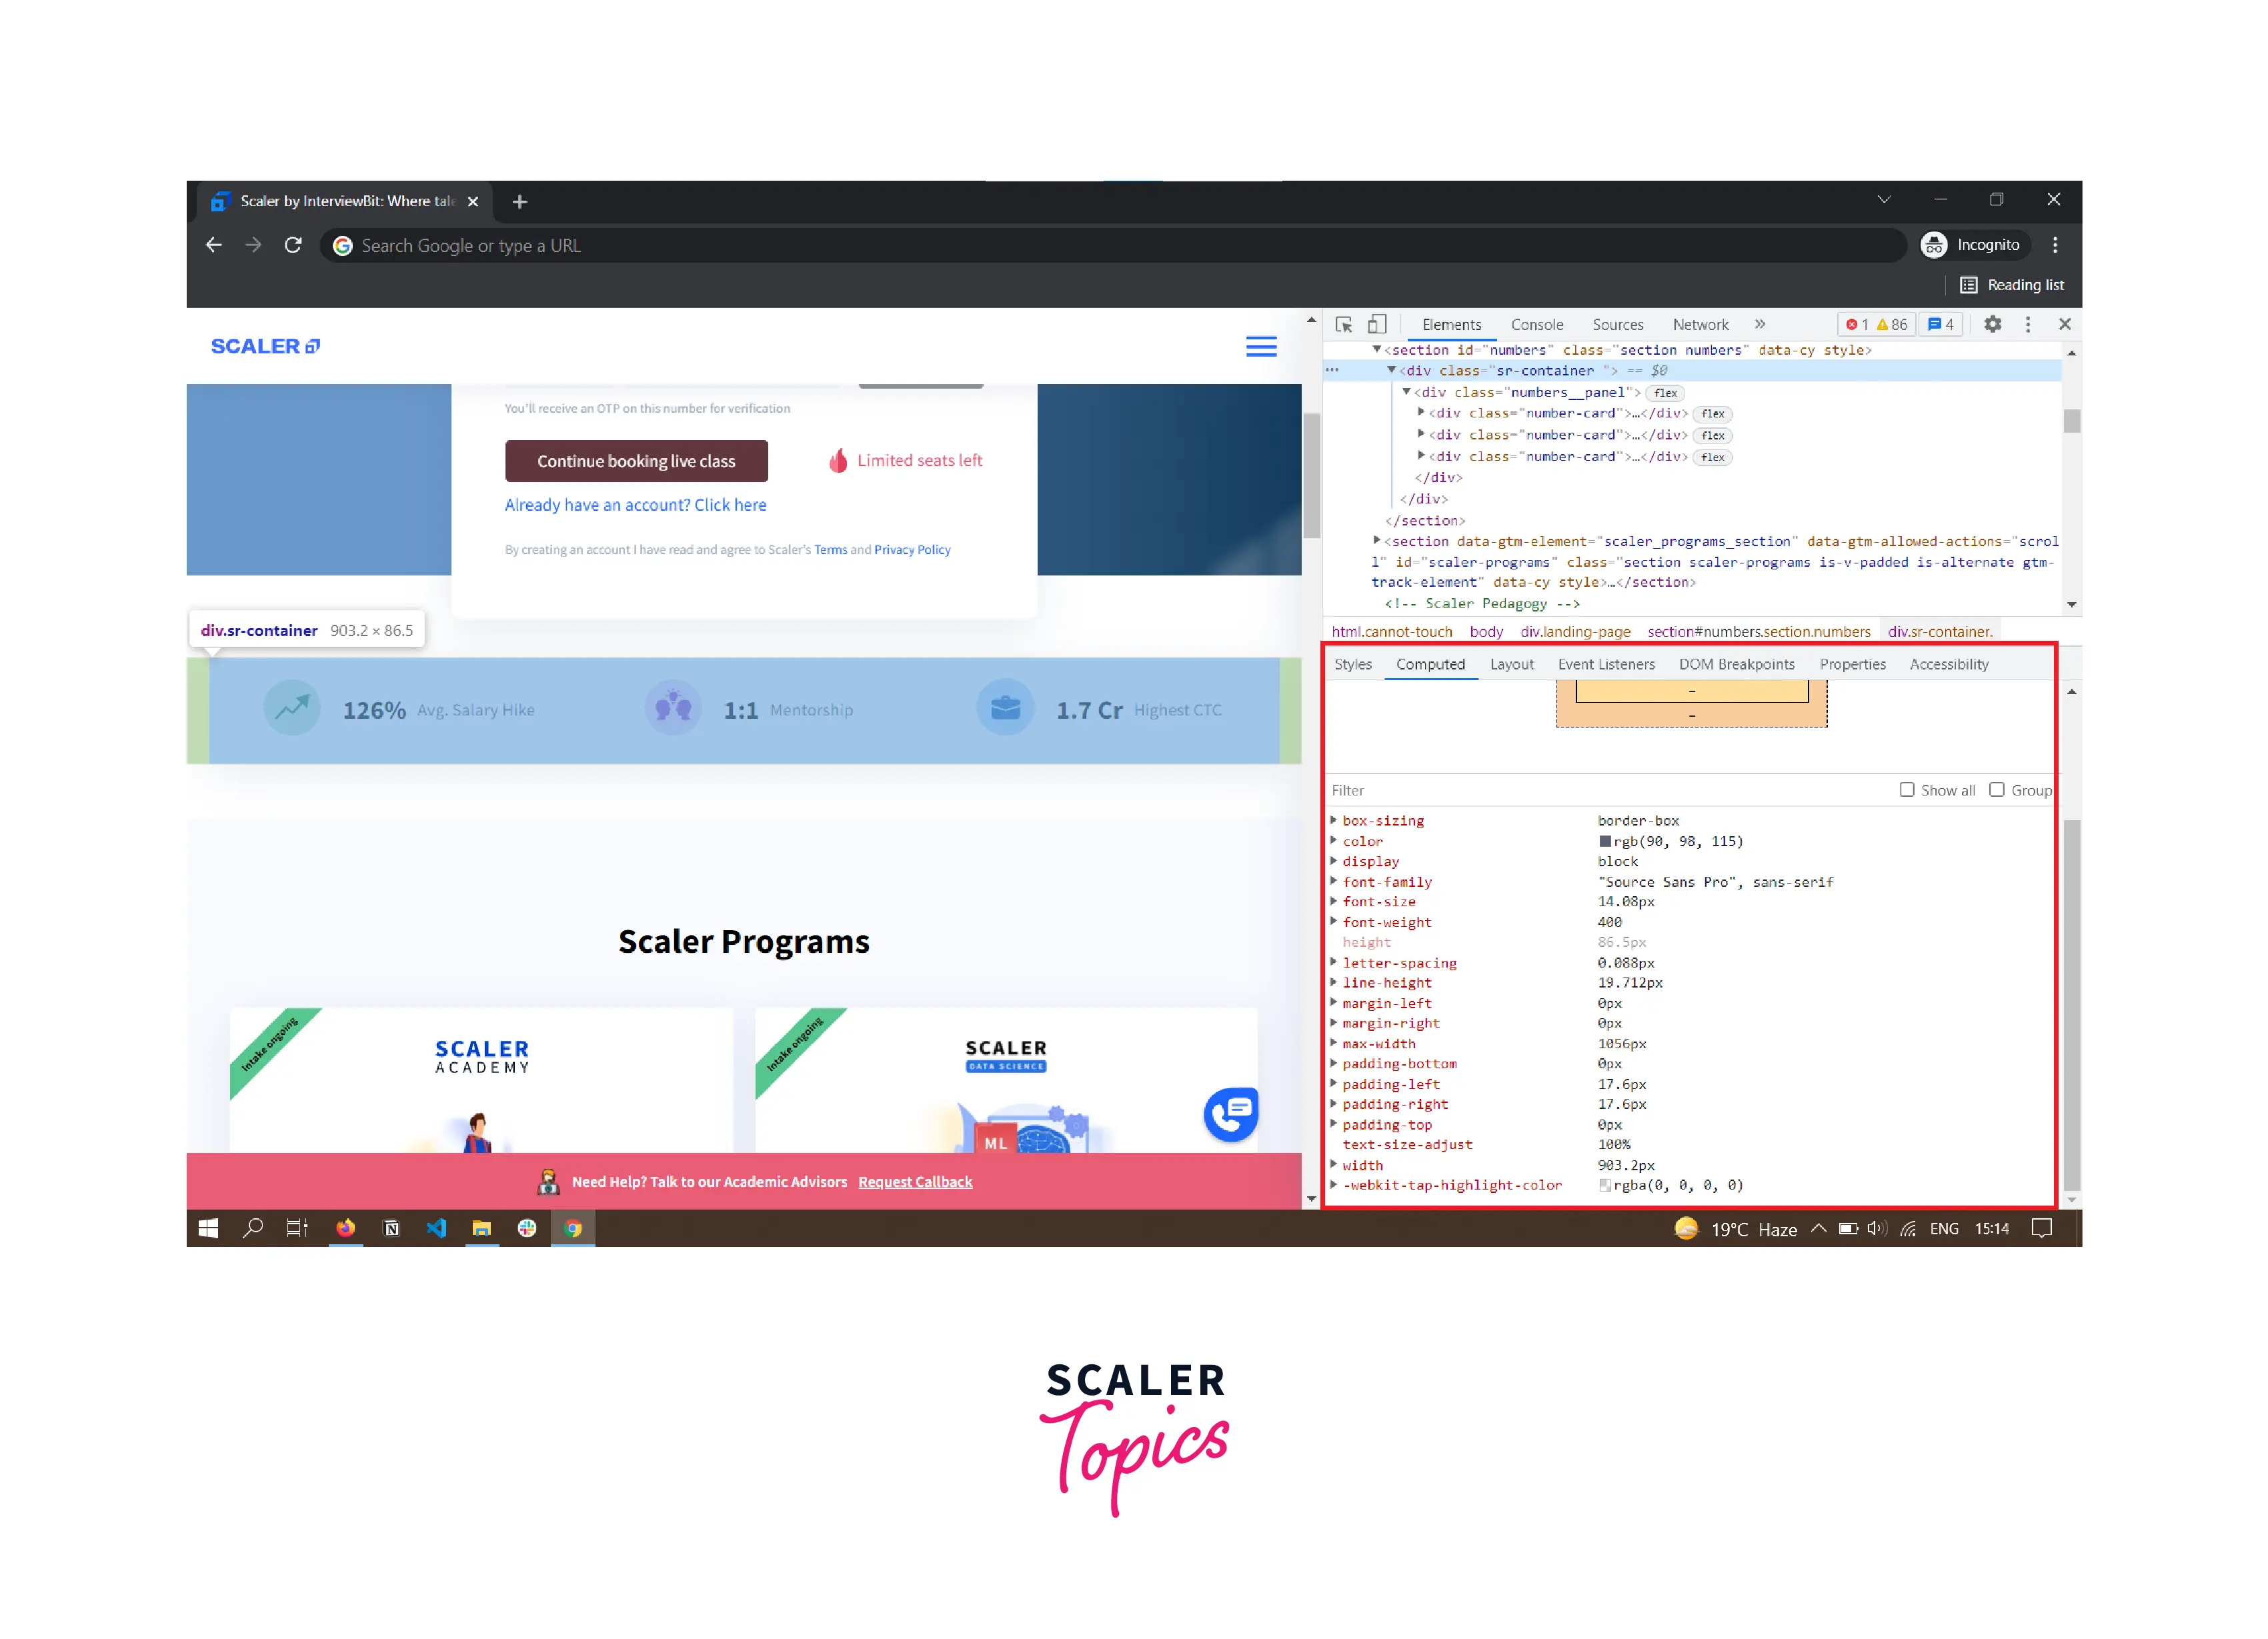
If you want to see the final styles or the computed styles by the browser of an element.
Open the DevTools and click on the Computed tab to see all the computed styles of an element.
Now that you are familiar with how to view CSS styles, it's time to modify CSS styles using DevTools.
Add a CSS Declaration to an Element
Chrome DevTools provides a way to modify CSS styles in the browser without affecting the main styles because when we add a CSS declaration to the browser it is applied in real-time, And when we reload the browser all the changes are lost.
Using DevTools for live CSS testing also ensures that your live website's actual code remains unchanged. Follow the below instructions to add a CSS declaration to an element.
- Inspect the element and click on the Styles tab.
- You can see the applied class name of that element.
- Now we are adding the background color to the element as yellow.

See the real-time effect on the image above after adding CSS style declaration in DevTools.
Remember:- CSS styles applied in the browsers are temporary when we reload the browser all the changes were lost and the original code remains unchanged.
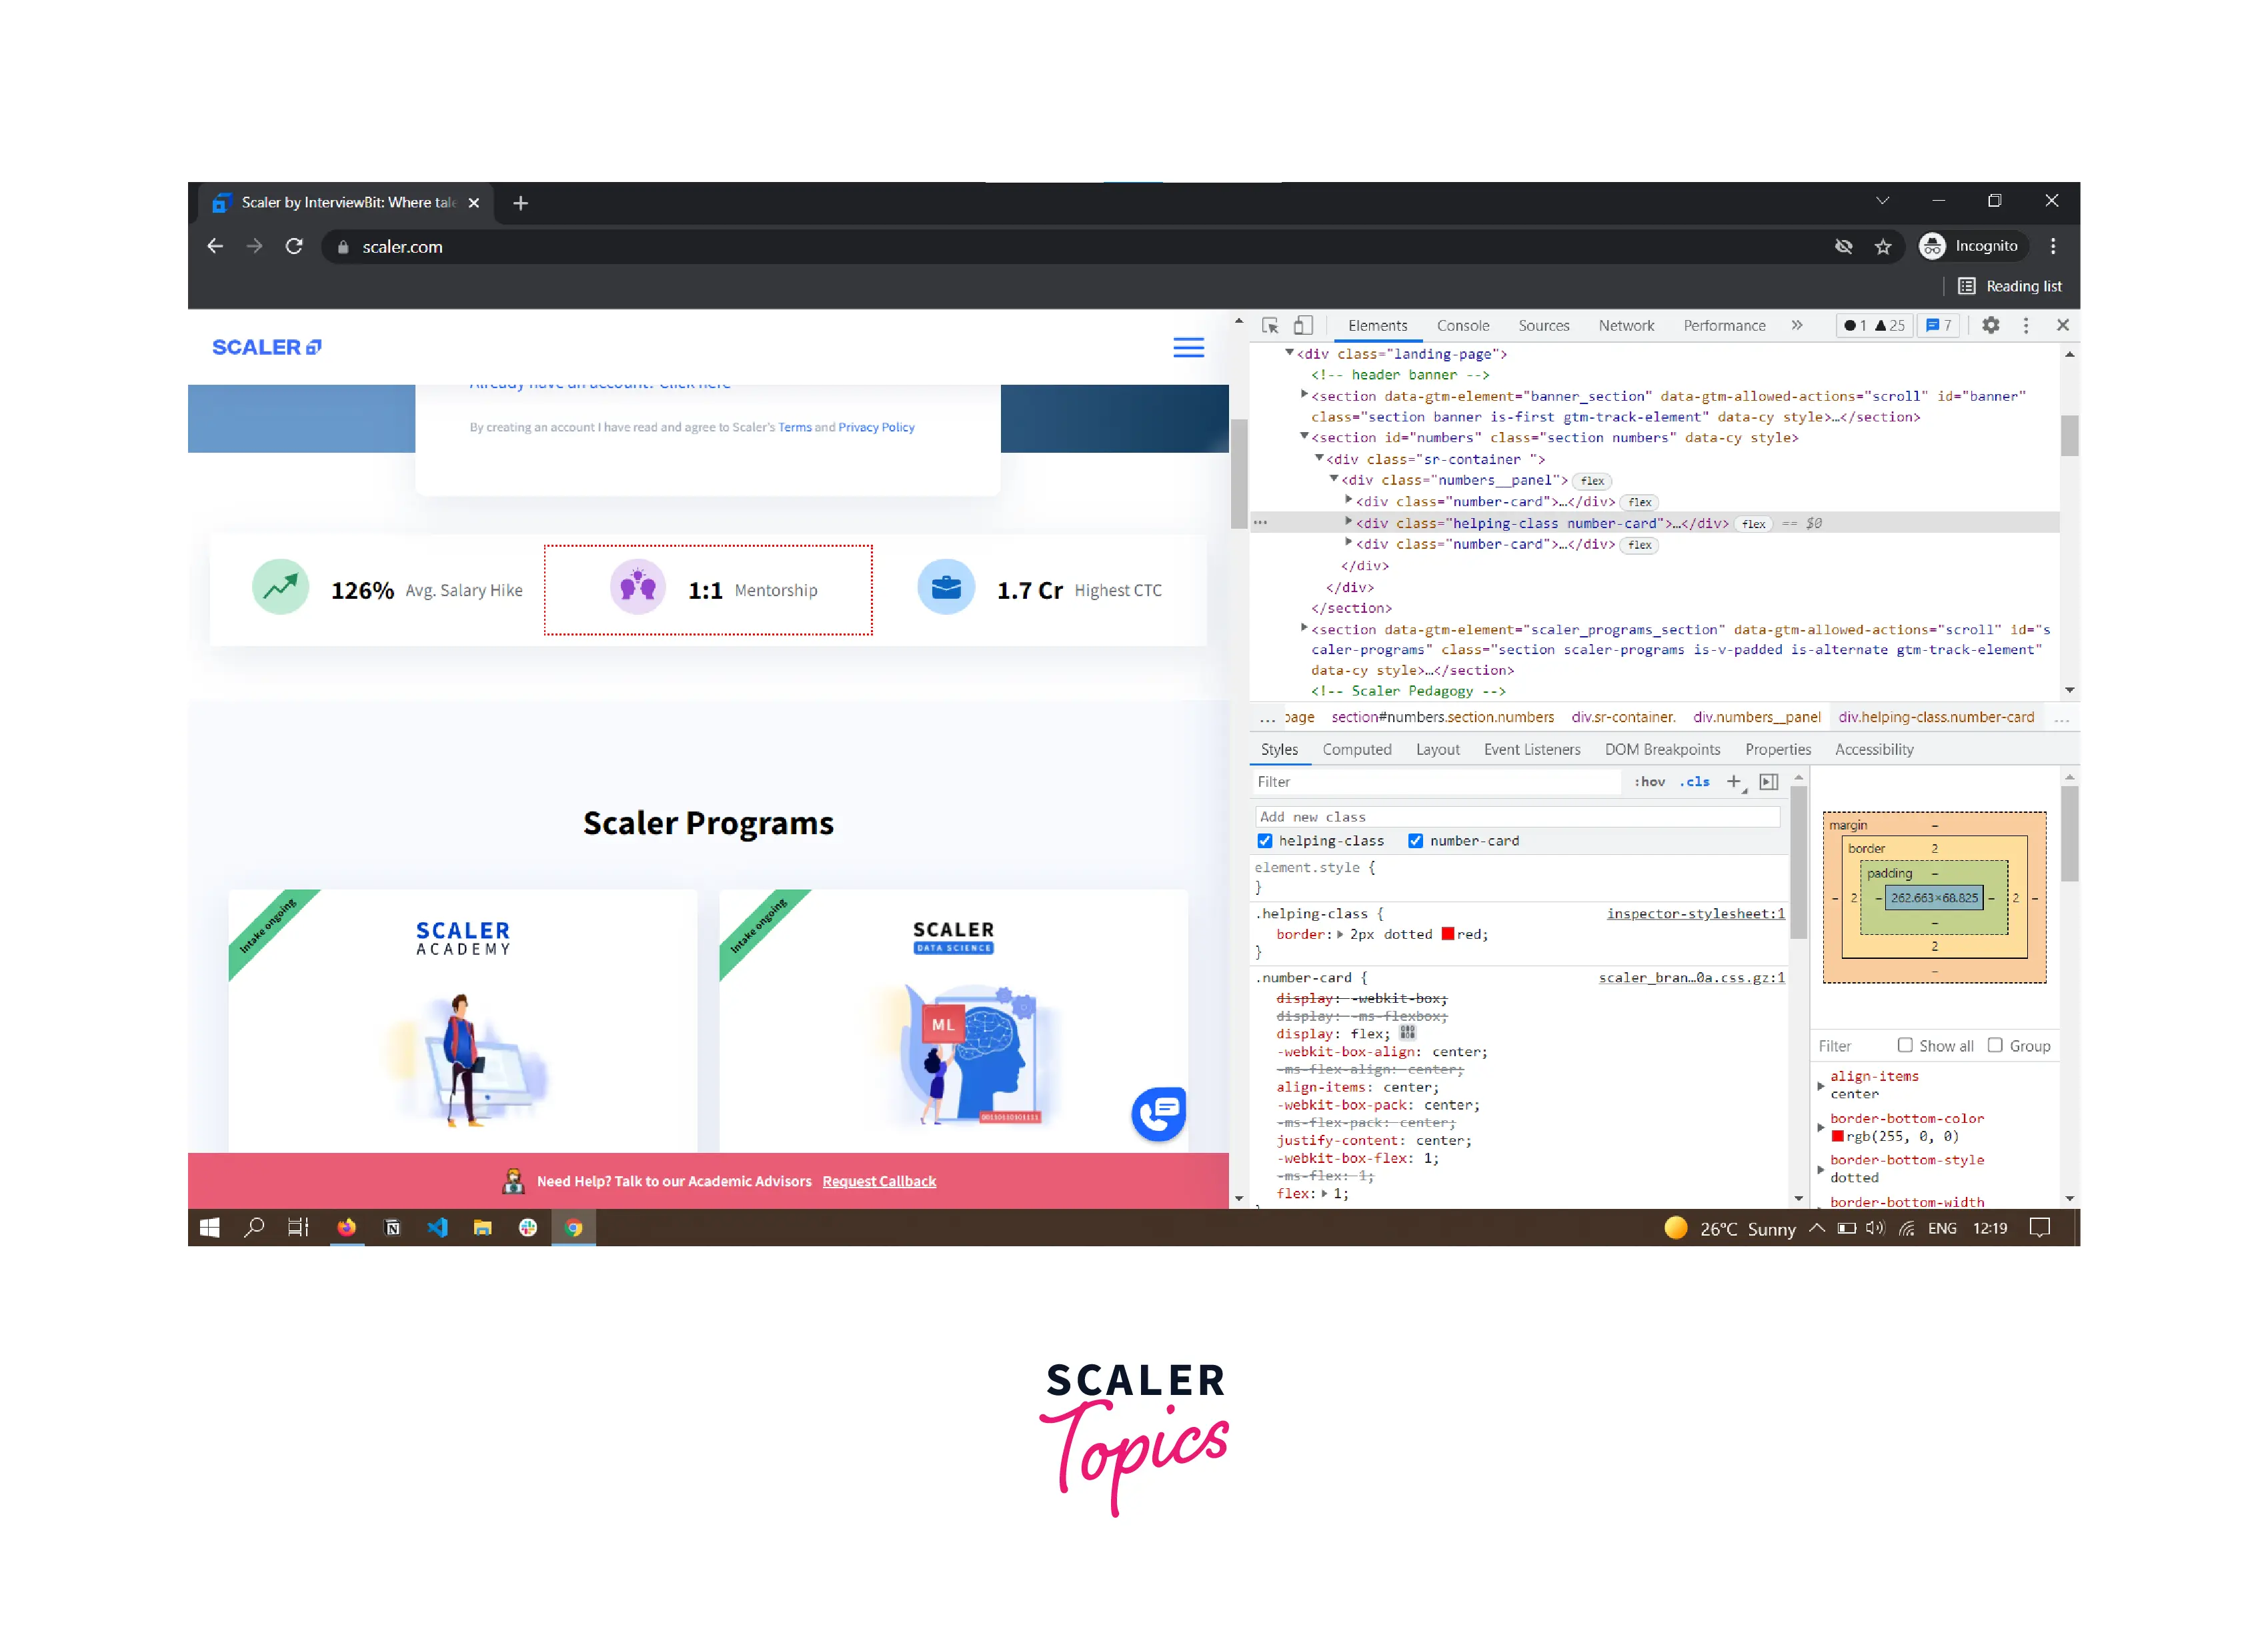
Add a CSS Class to an Element
Adding and removing CSS style classes from an element is the easiest way to see an element with or without a style.
- Open DevTools and select the Styles tab and click on the .cls option.
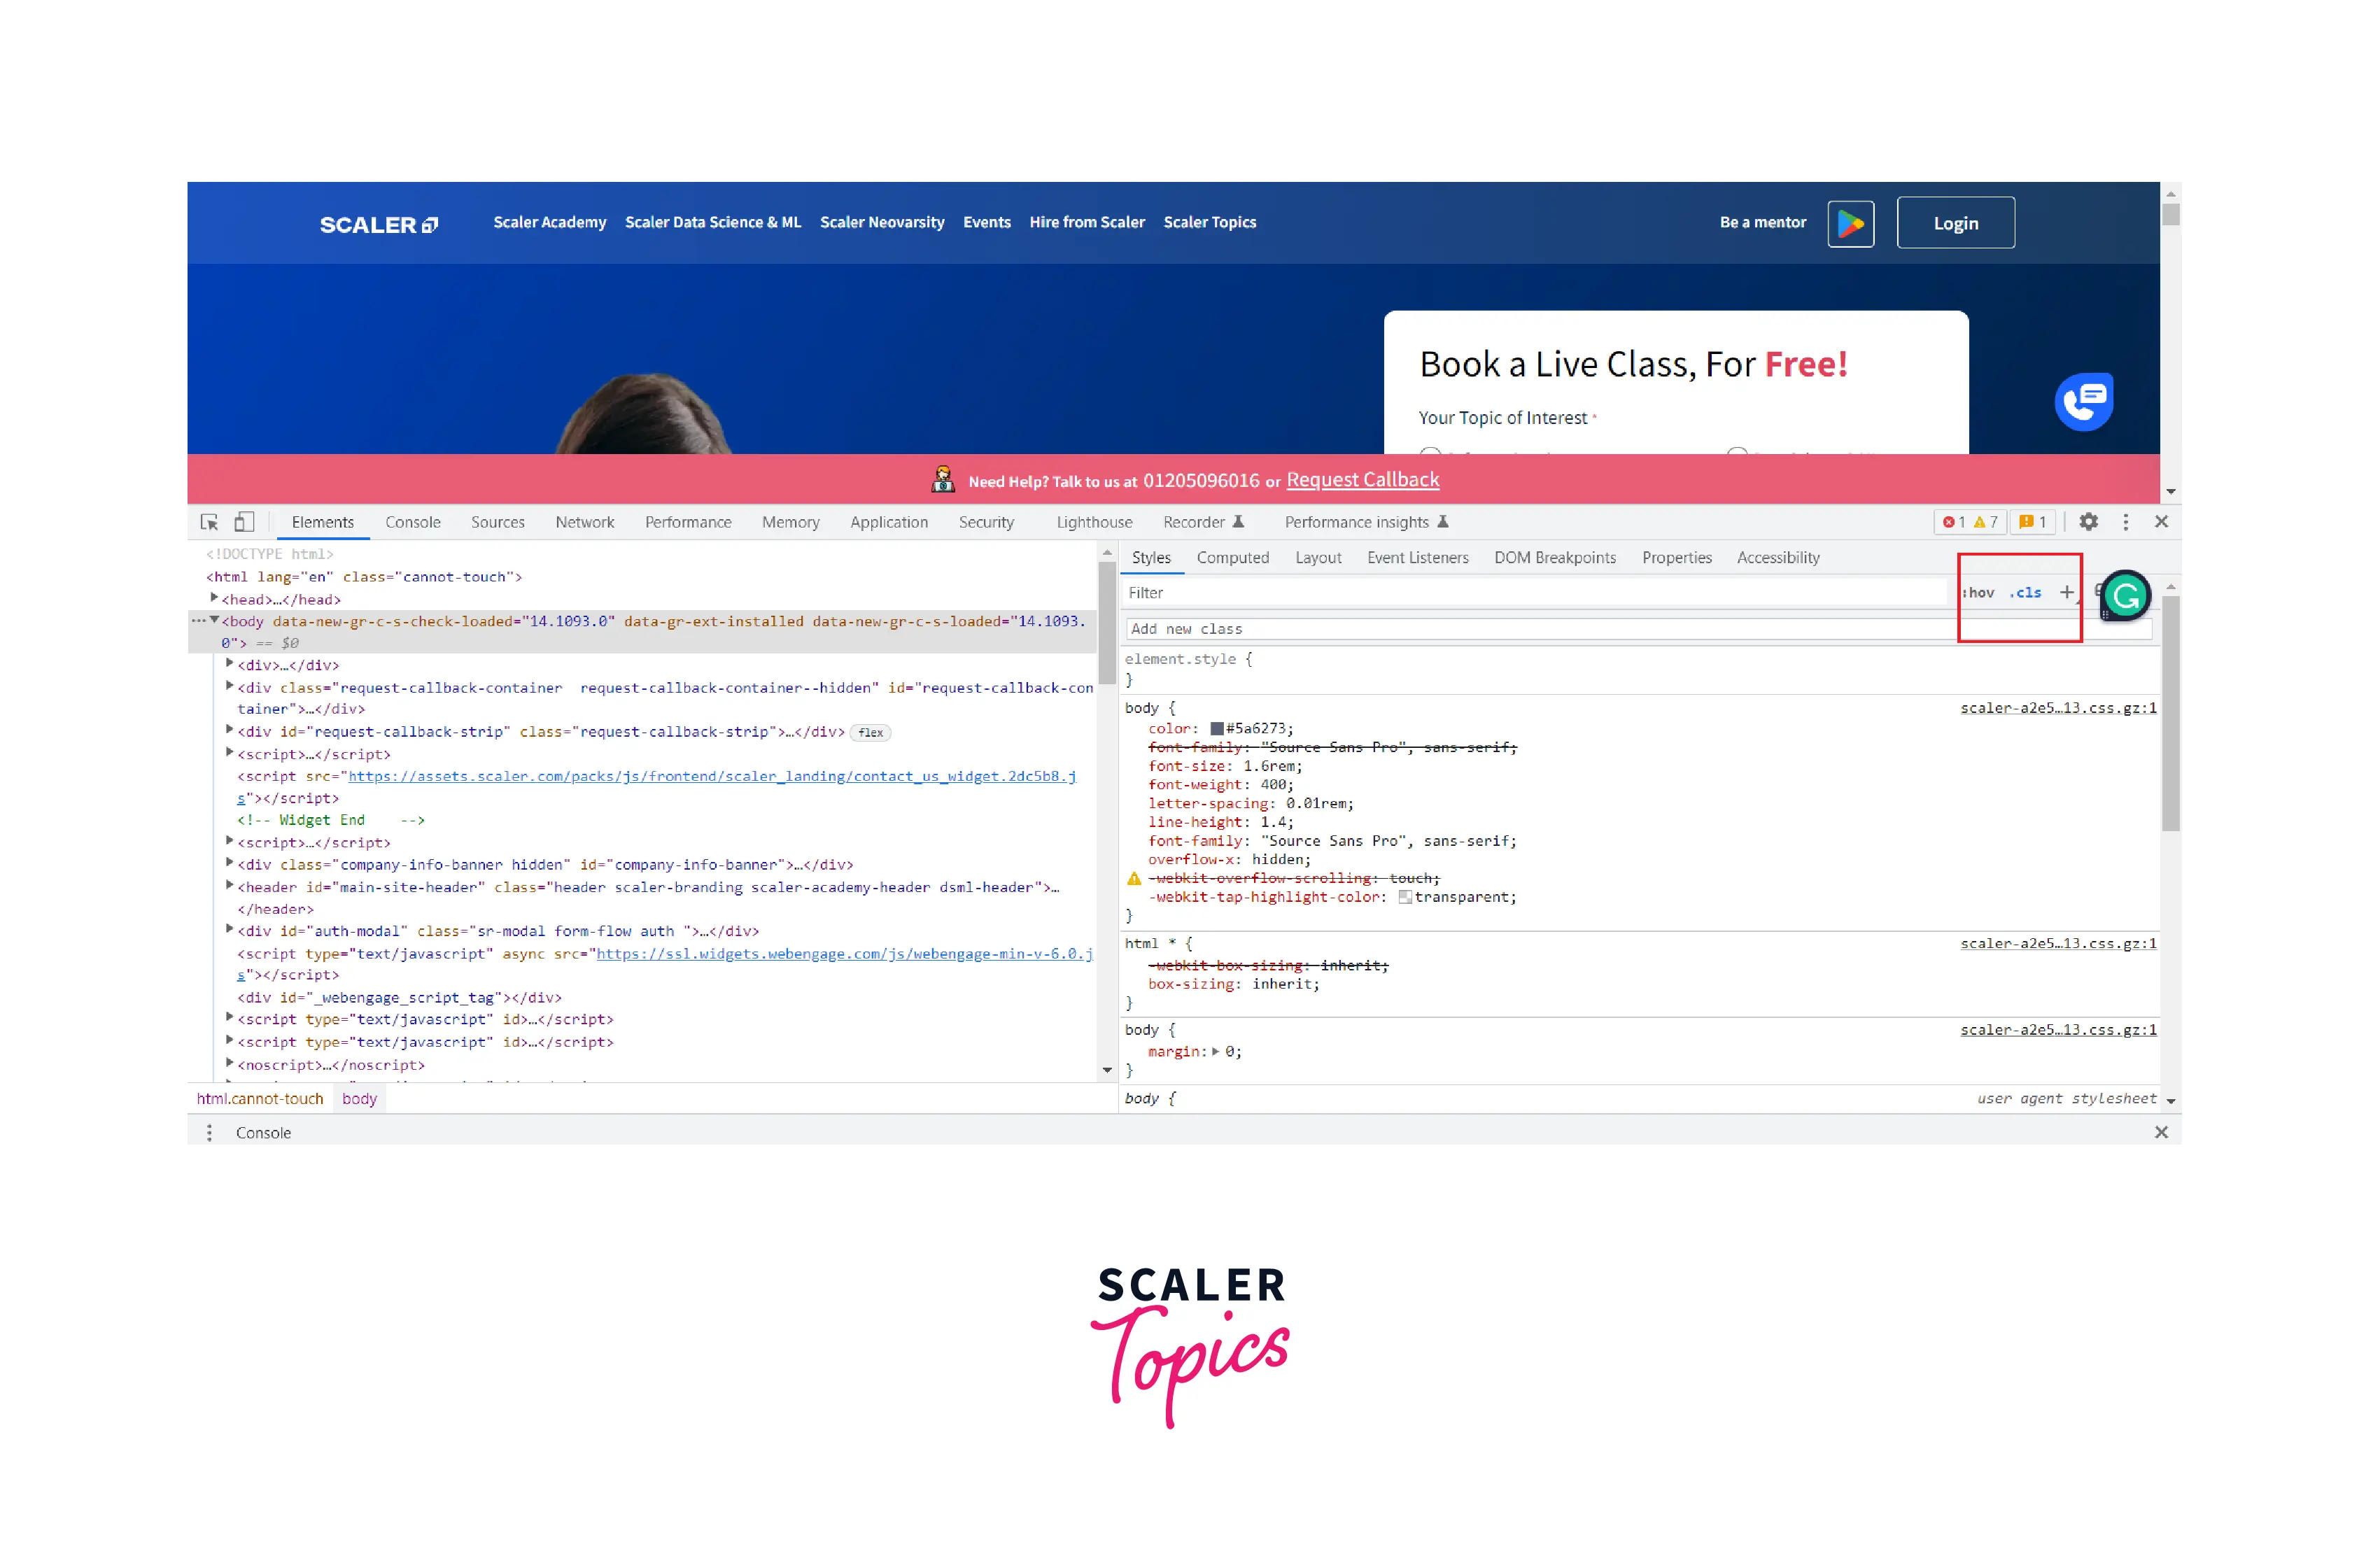
- When you click on .cls it shows a text box where you can add classes to the selected element.
 You can see the class applied to that element. Click on the checkbox in front of the class name to remove the class.
 - Type the class name in the text box and press Enter to add the class style to the element.
You are familiar with all the basic usage of DevTools, now let's learn some intermediate stuff to become more proficient in DevTools.
Add a Pseudostate to a Class
Pseudo state is a special state of an element such as how elements show on the hover. With help of DevTools, We can apply pseudo state on an element permanently.
All you need to do is click on :hov in the Styles tab to open the Pseudostate tab.
The login button is transparent on the scalar website but when we hover it turns white in a background color.
When we check the hover box it becomes the permanent white background color state of the button.
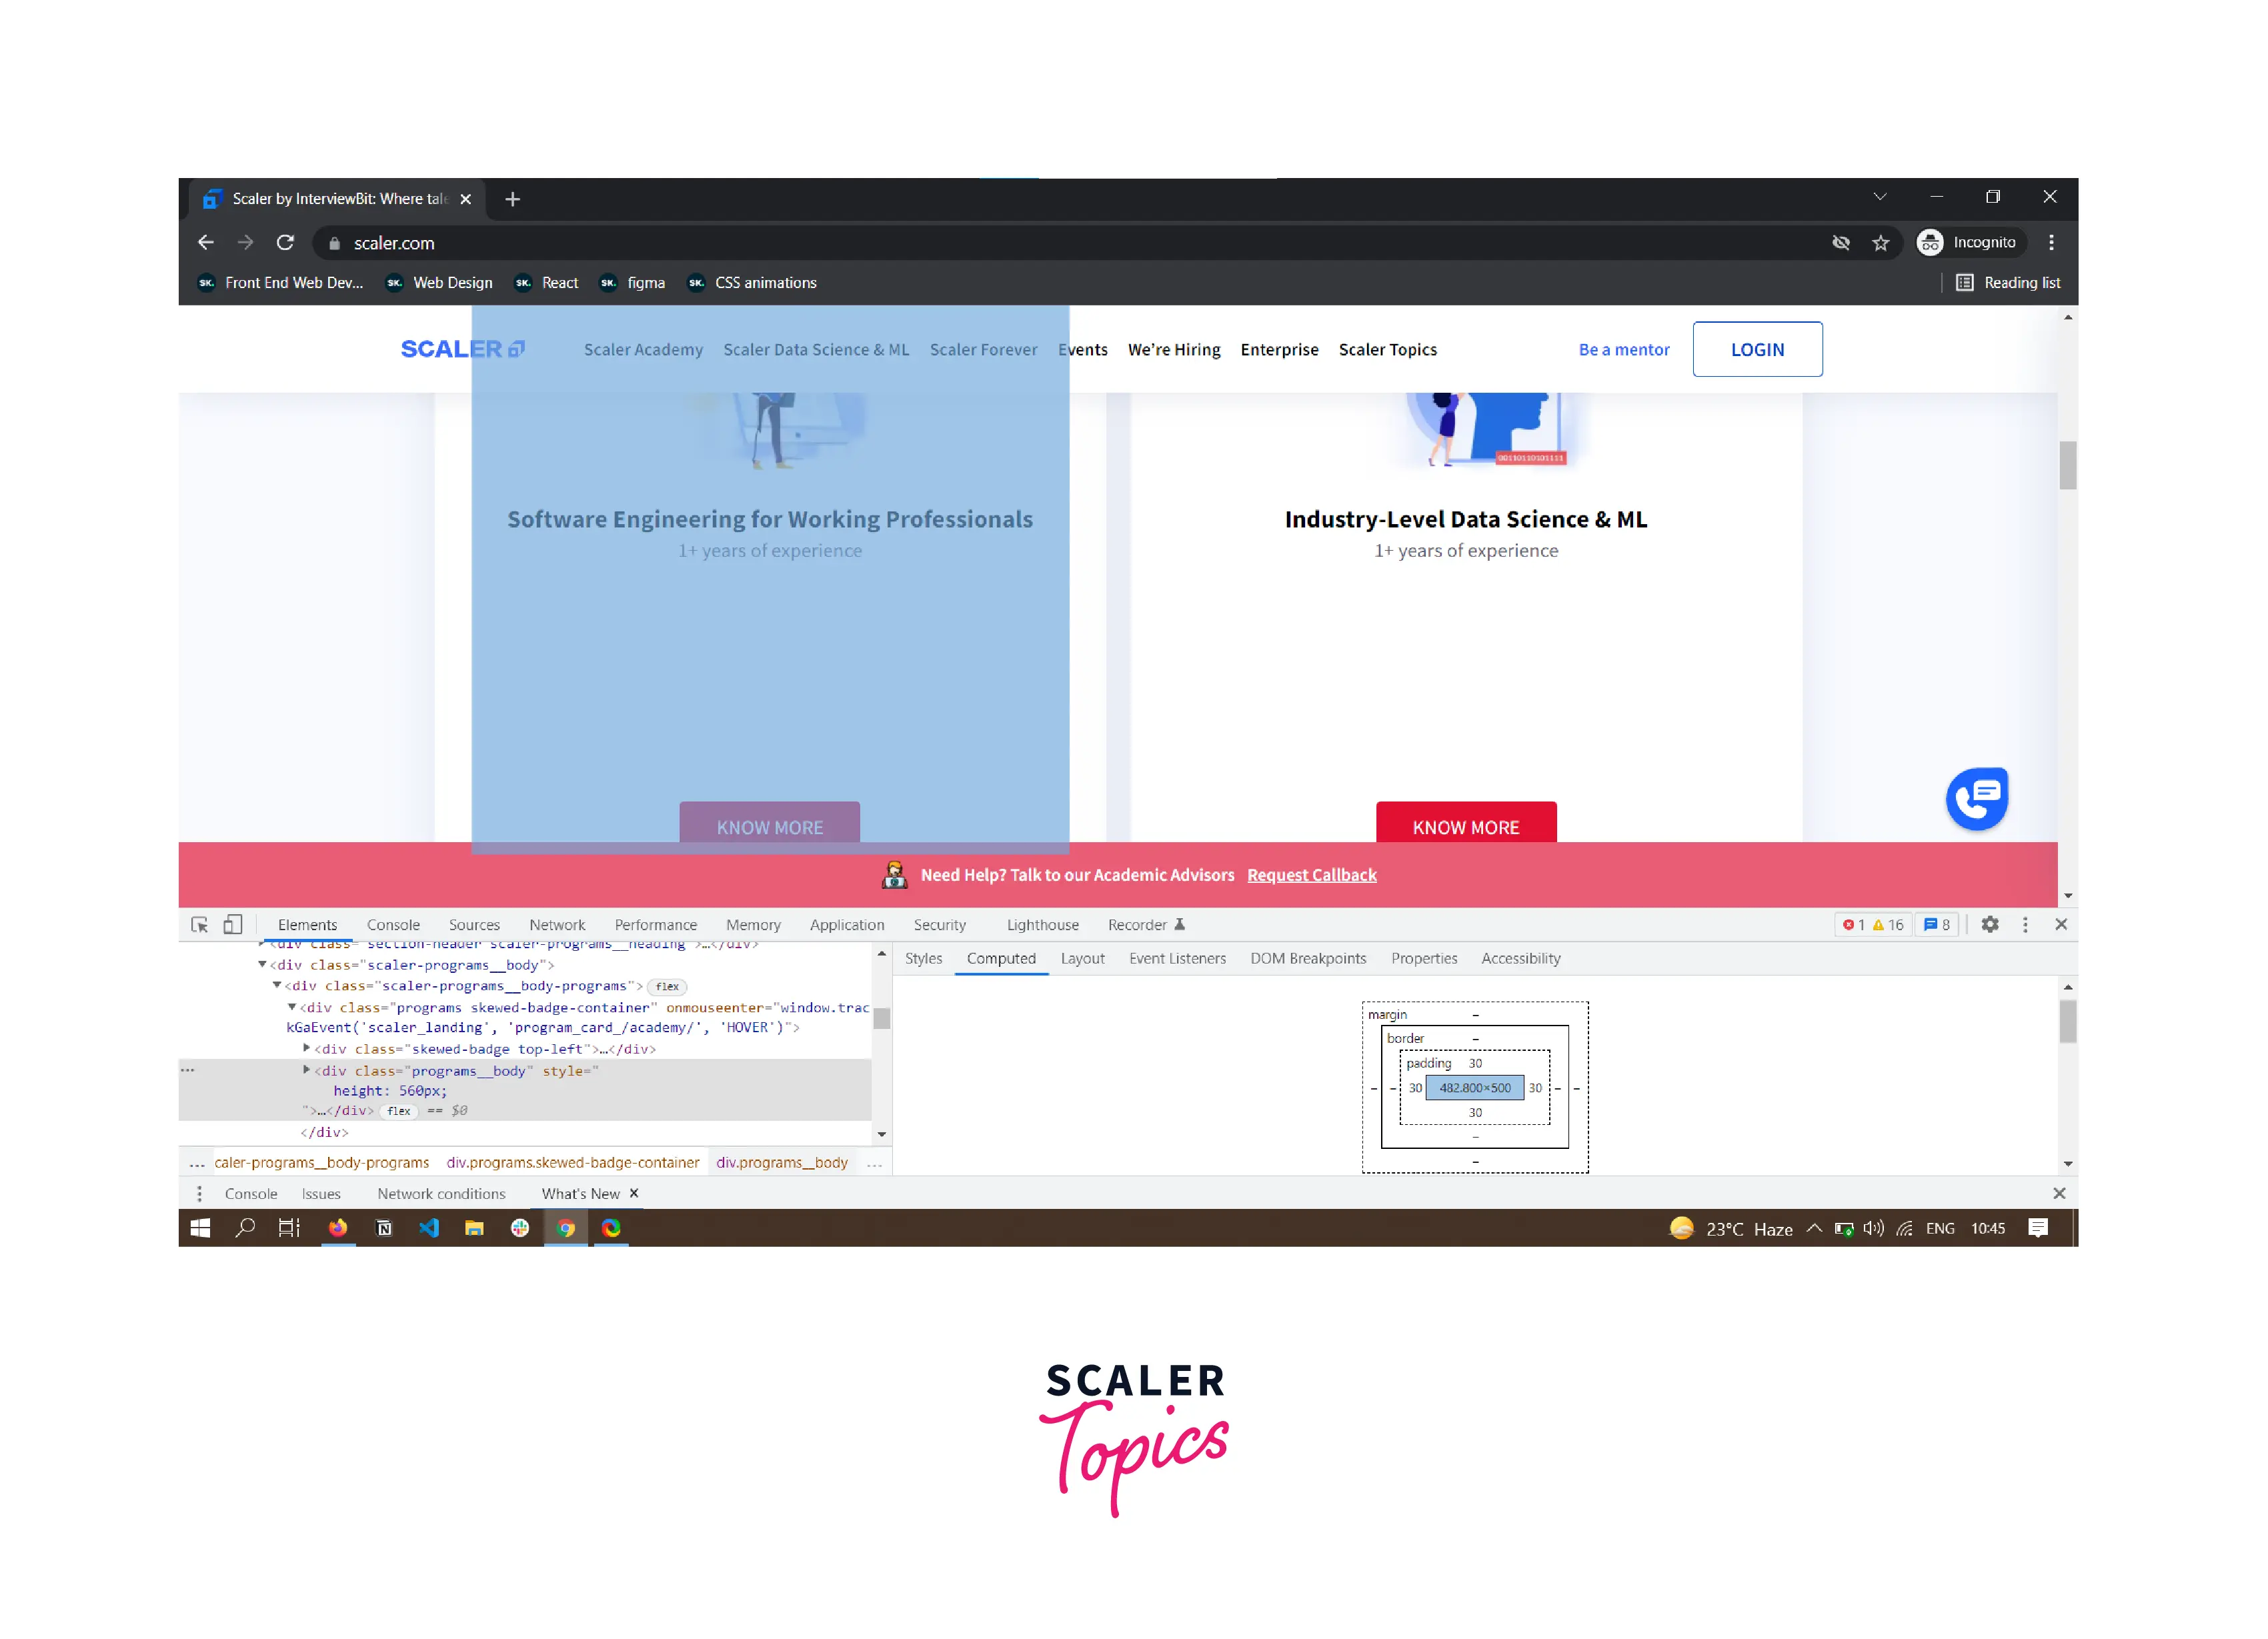
Change the Dimensions of an Element
Box model diagram is one of the amazing features of DevTools as it gives the power to change the dimensions (height and width), even we can change the padding and margin of the elements.
To open Box Model click on the computed tab and it shows the box model with inspect element height, width, padding, and margin.
When we hover over the box model layers it highlights that part on the browser.
To change the value double click on the value it shows the text box and then type the value you want and press enter.
In the example below I have changed the height of the box from 333px to 500px.
New Workflows for Viewing and Changing CSS
DevTools provides a lot of tools so let's reveal some of the most important workflows to make working with CSS and debugging CSS easier.
Select an Element
Inspecting a page and finding an element in the DOM tree is not the best way as it is time-consuming and confusing, but instead of searching in the DOM tree, the best way is to select the particular element.
All you have to do is, hover over an element on the page and right-click on the mouse, and click Inspect. It opens DevTools, selects the particular element, and highlights it in blue in the Elements panel. All CSS styles of the element appear in the Styles panel.
The highlighted blue element in the DOM Tree is the Selected Element, and on the right side below, you can easily see the styles panel that contains all the styles of that element.
View CSS
View the External Stylesheet Where a Rule is Defined
To view the external stylesheet, you have to select or inspect the element and open the styles panel, where you can see the link next to the defined rule.
Click on it, and you will be redirected to the external stylesheet.
You can see the scaler_branding-.css.gz link address in the below image marked in red color.

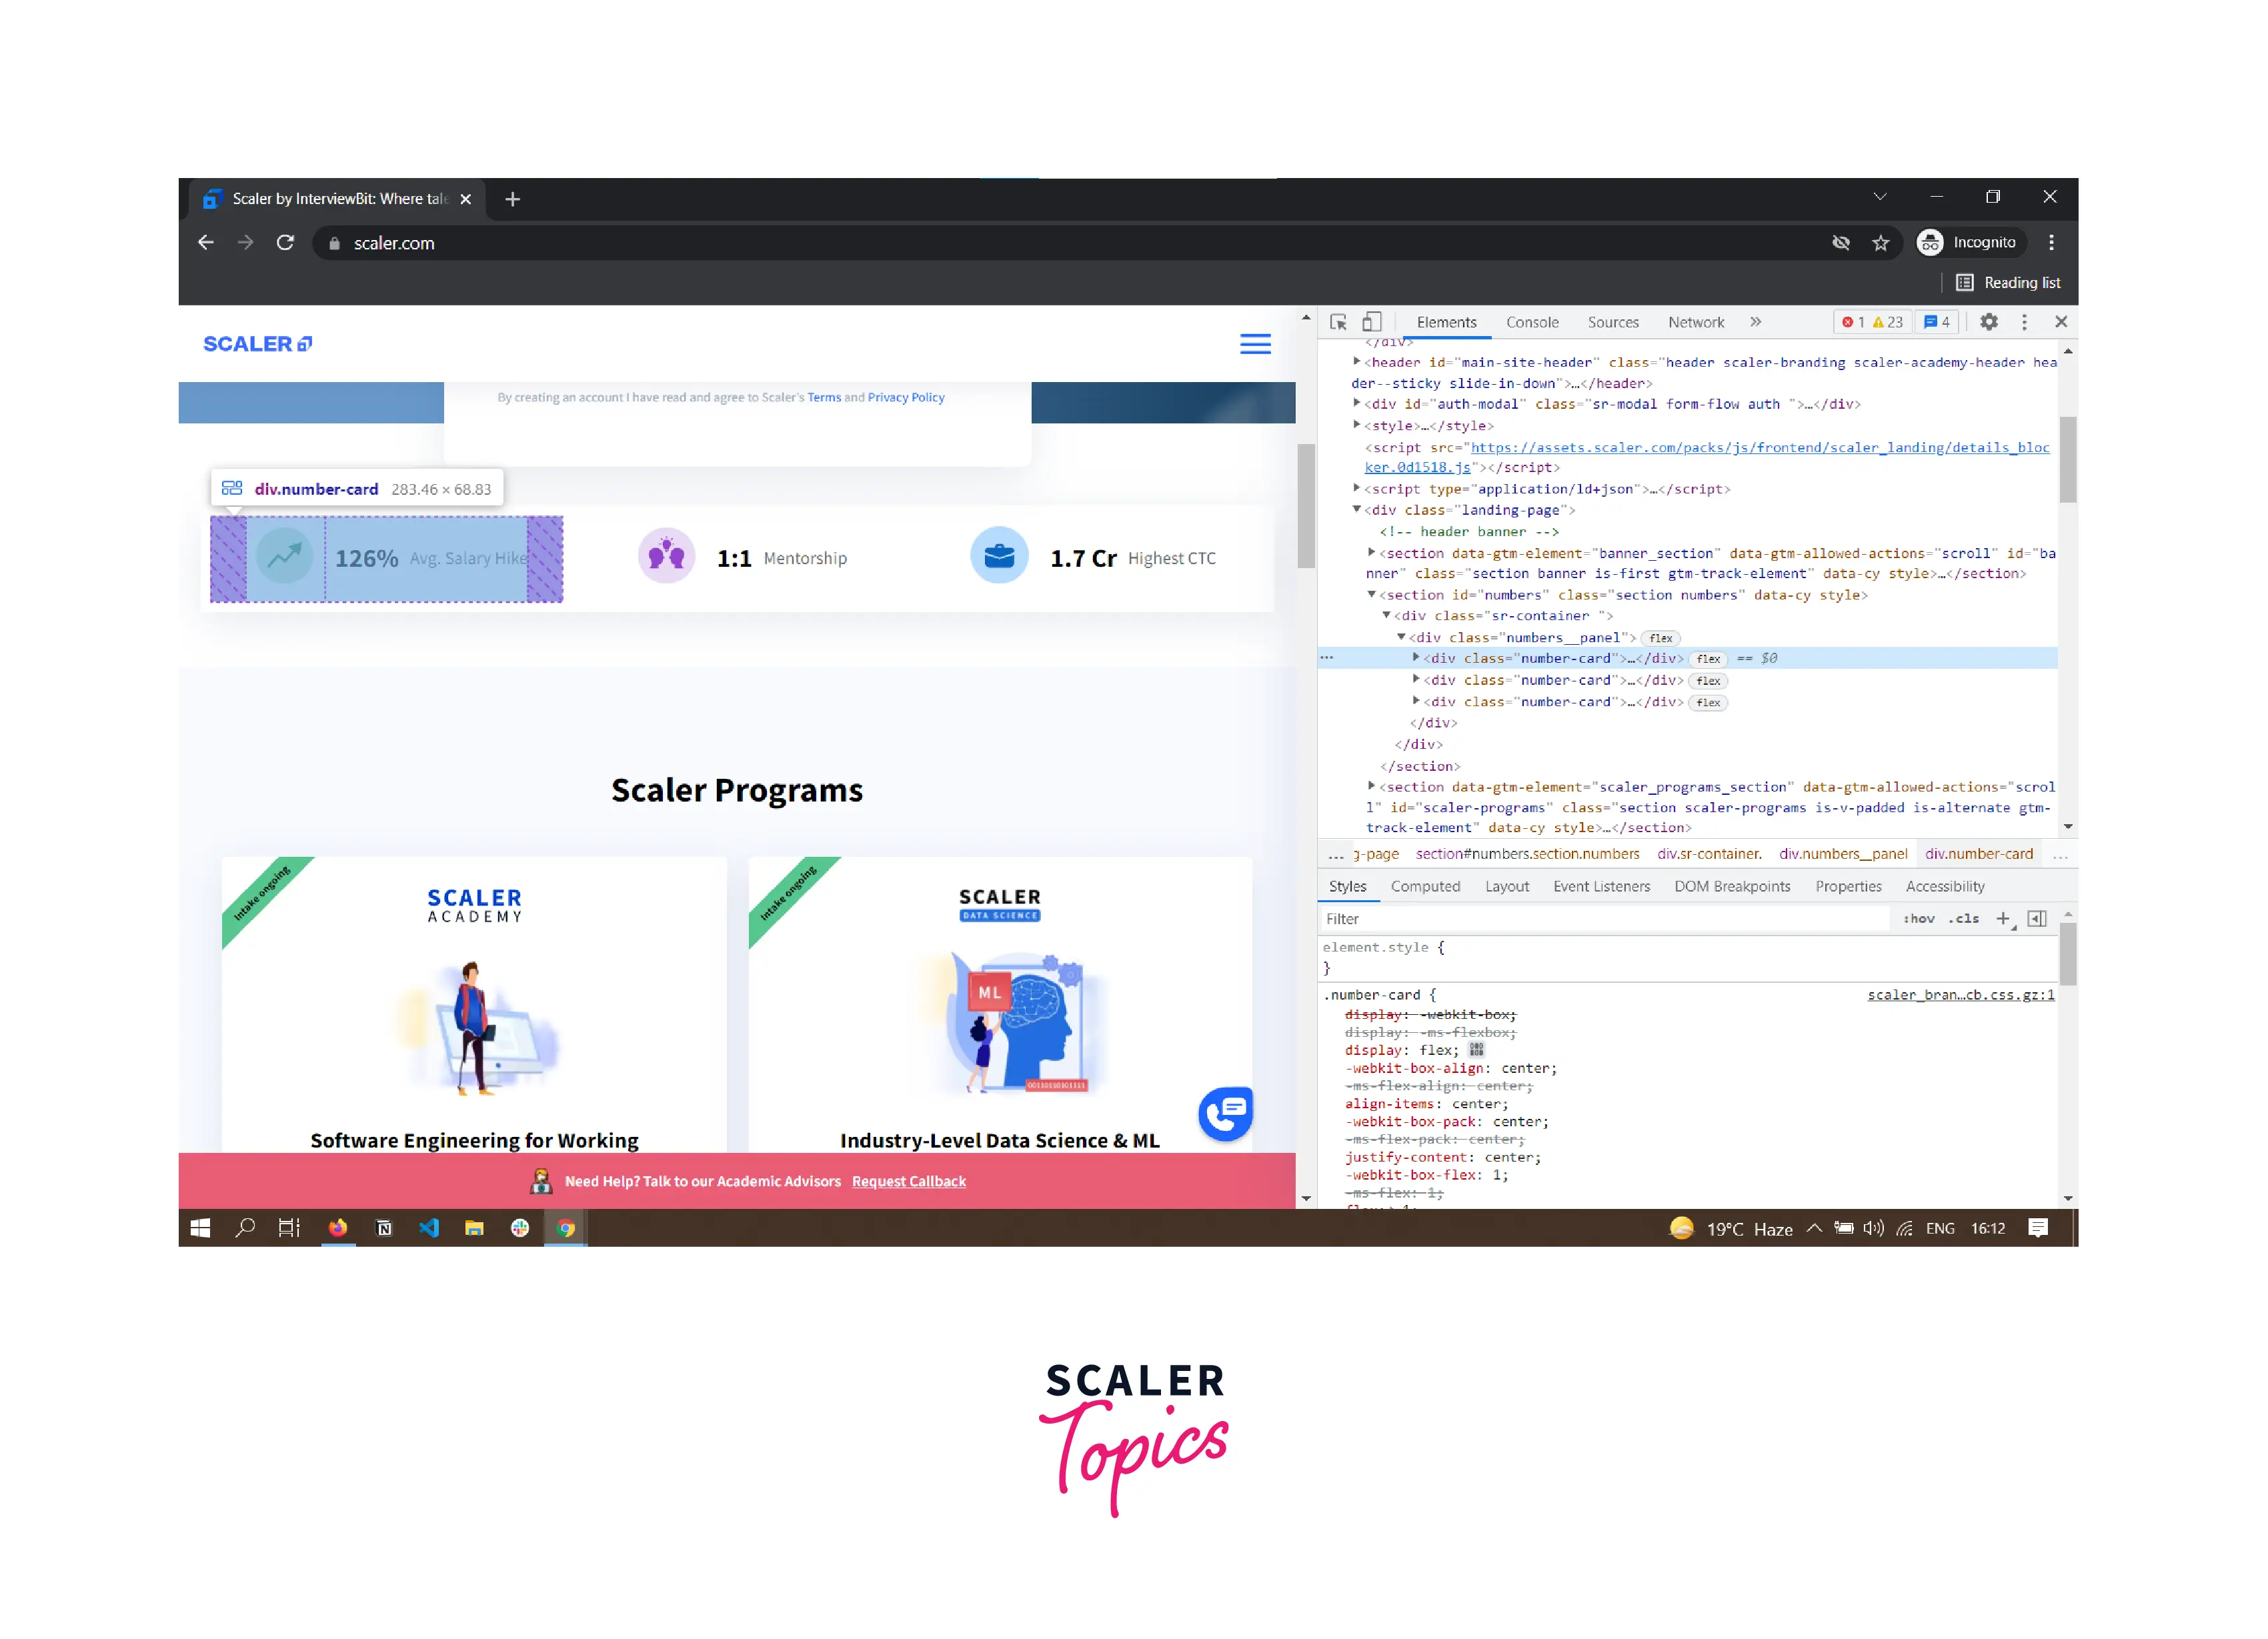
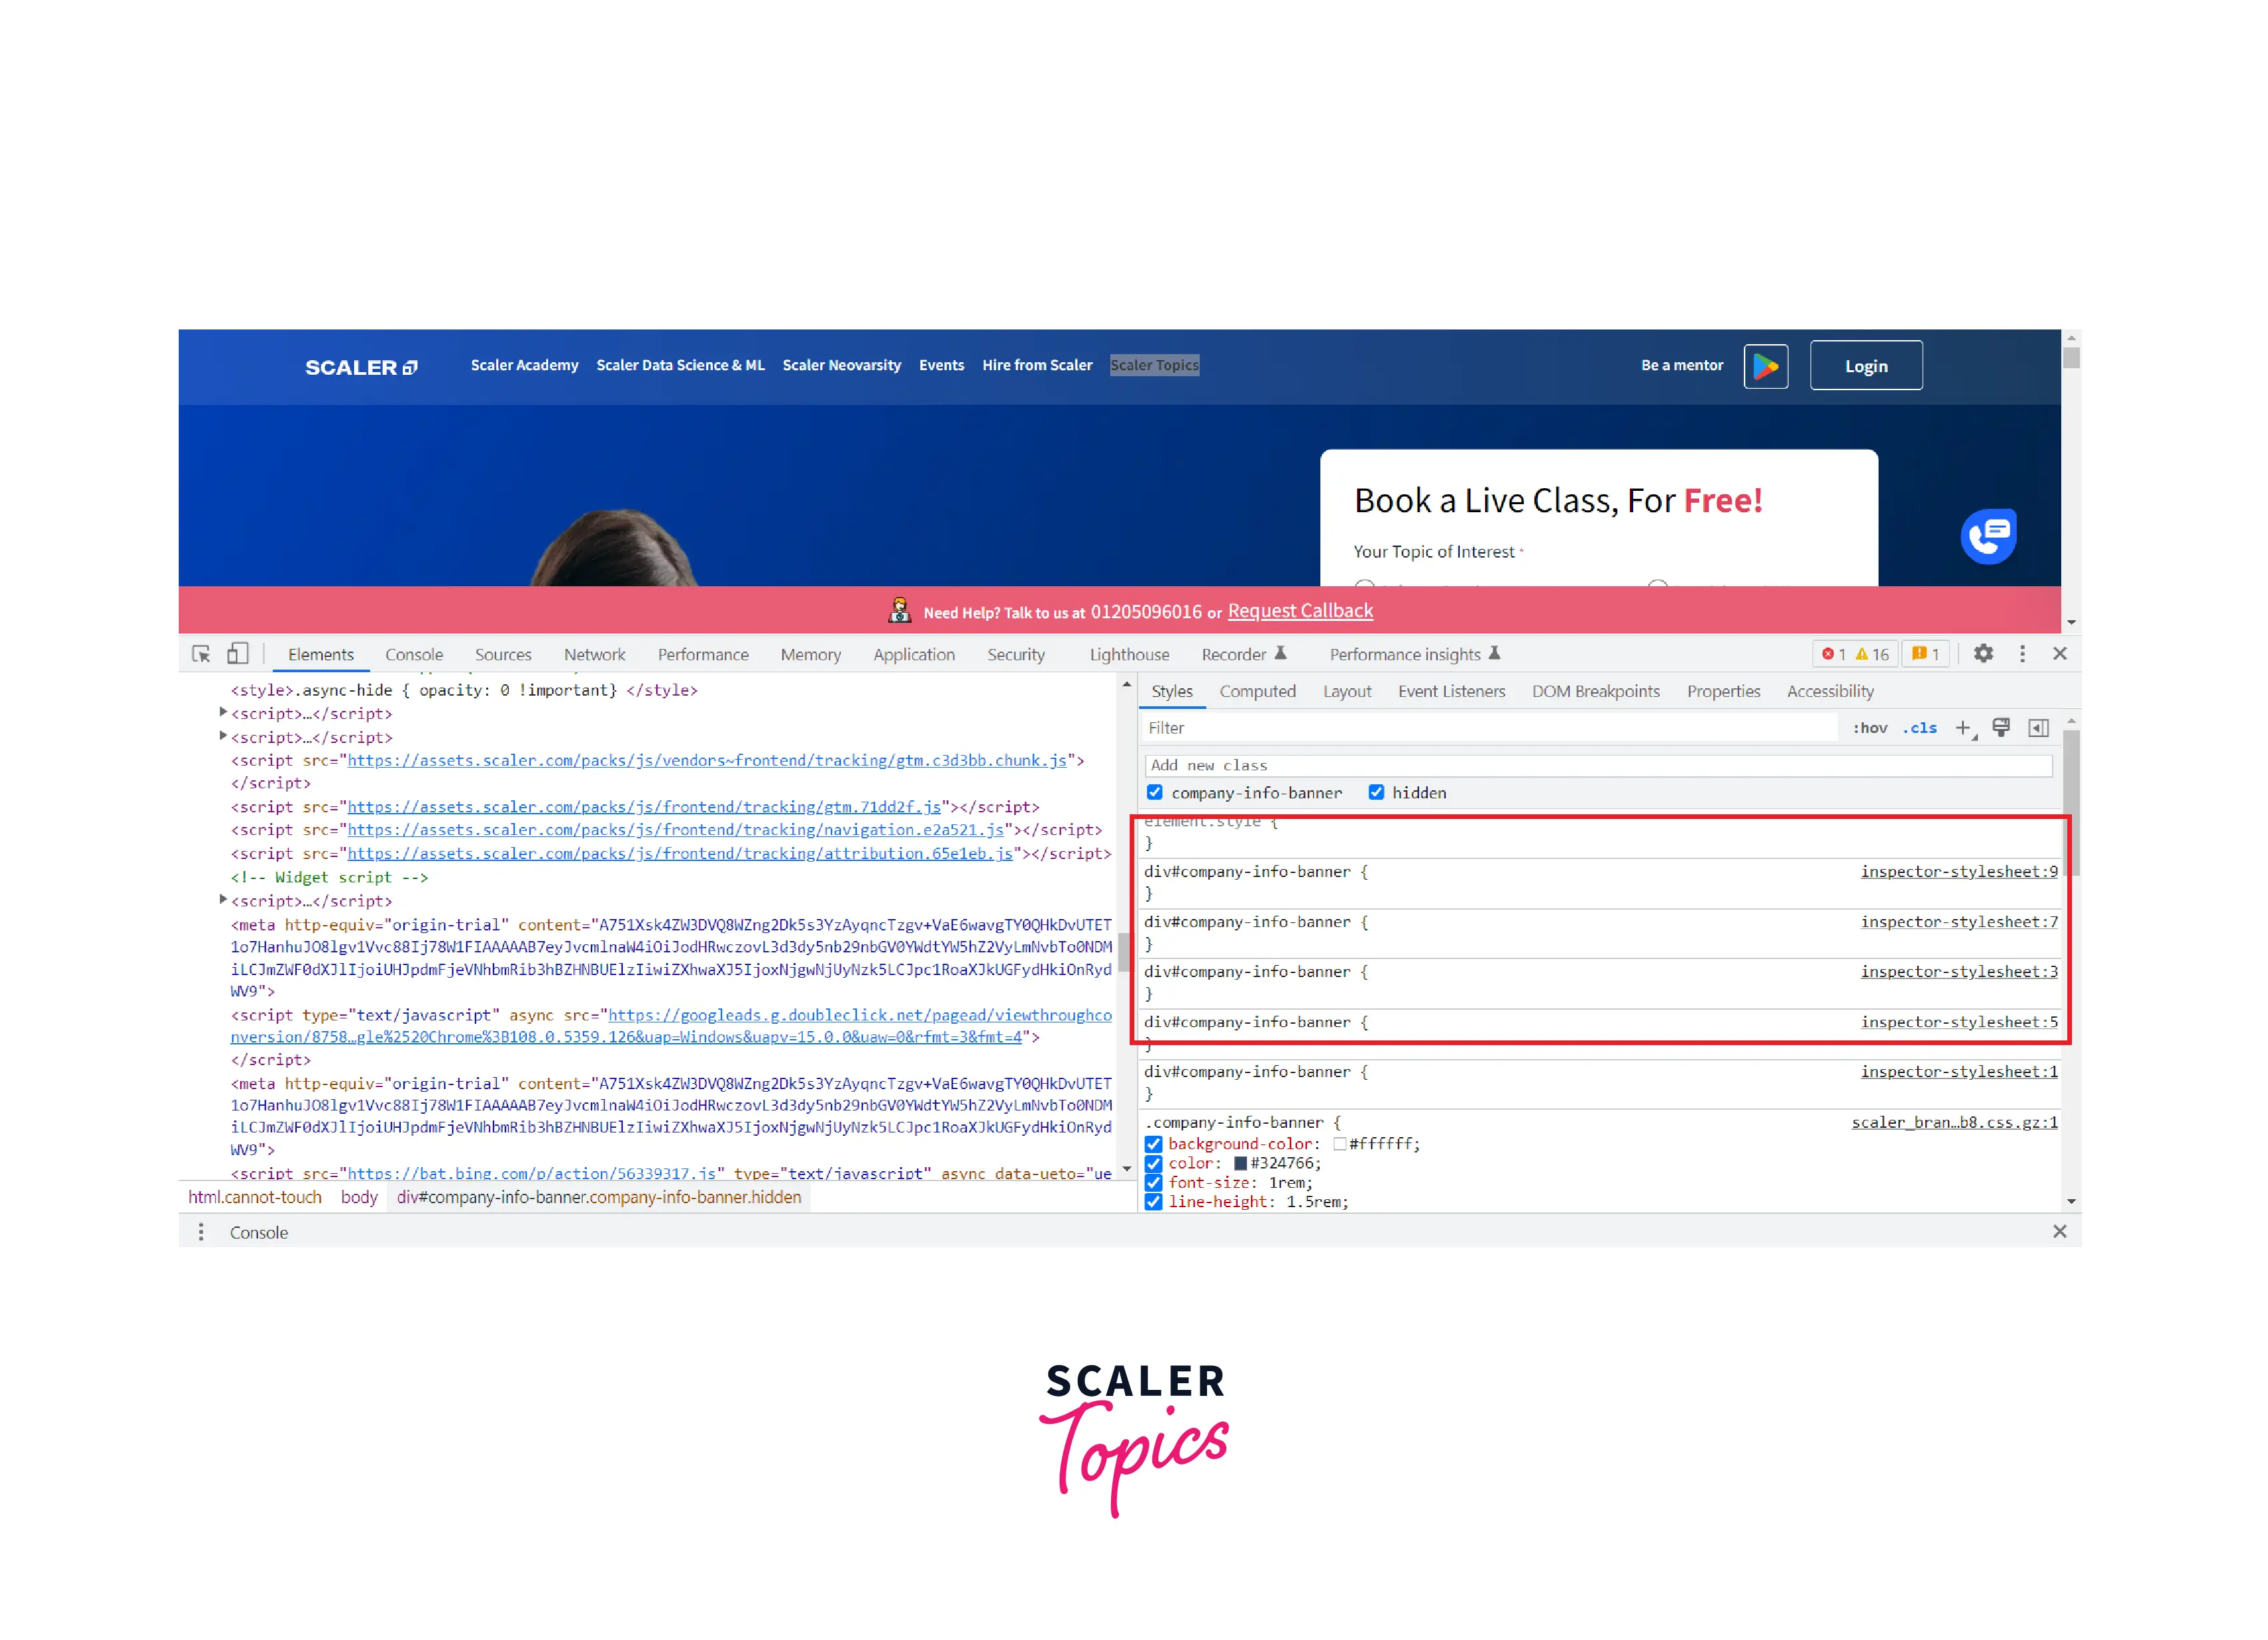
View Only the CSS that's Actually Applied to an Element
The styles tab shows you all the CSS rules applied to an element, including the declaration that is overwritten by the more specific declaration.
To view the applied CSS of an element, you need to open Computed Tab, and follow the below instructions to learn how to open the Computed Tab.
- Inspect an Element
- Open Computed tab in the Elements panel.
View CSS Properties in Alphabetical Order
You have to select an element, open the computed tab and tick the Show All checkbox to view all the CSS properties in alphabetical order.

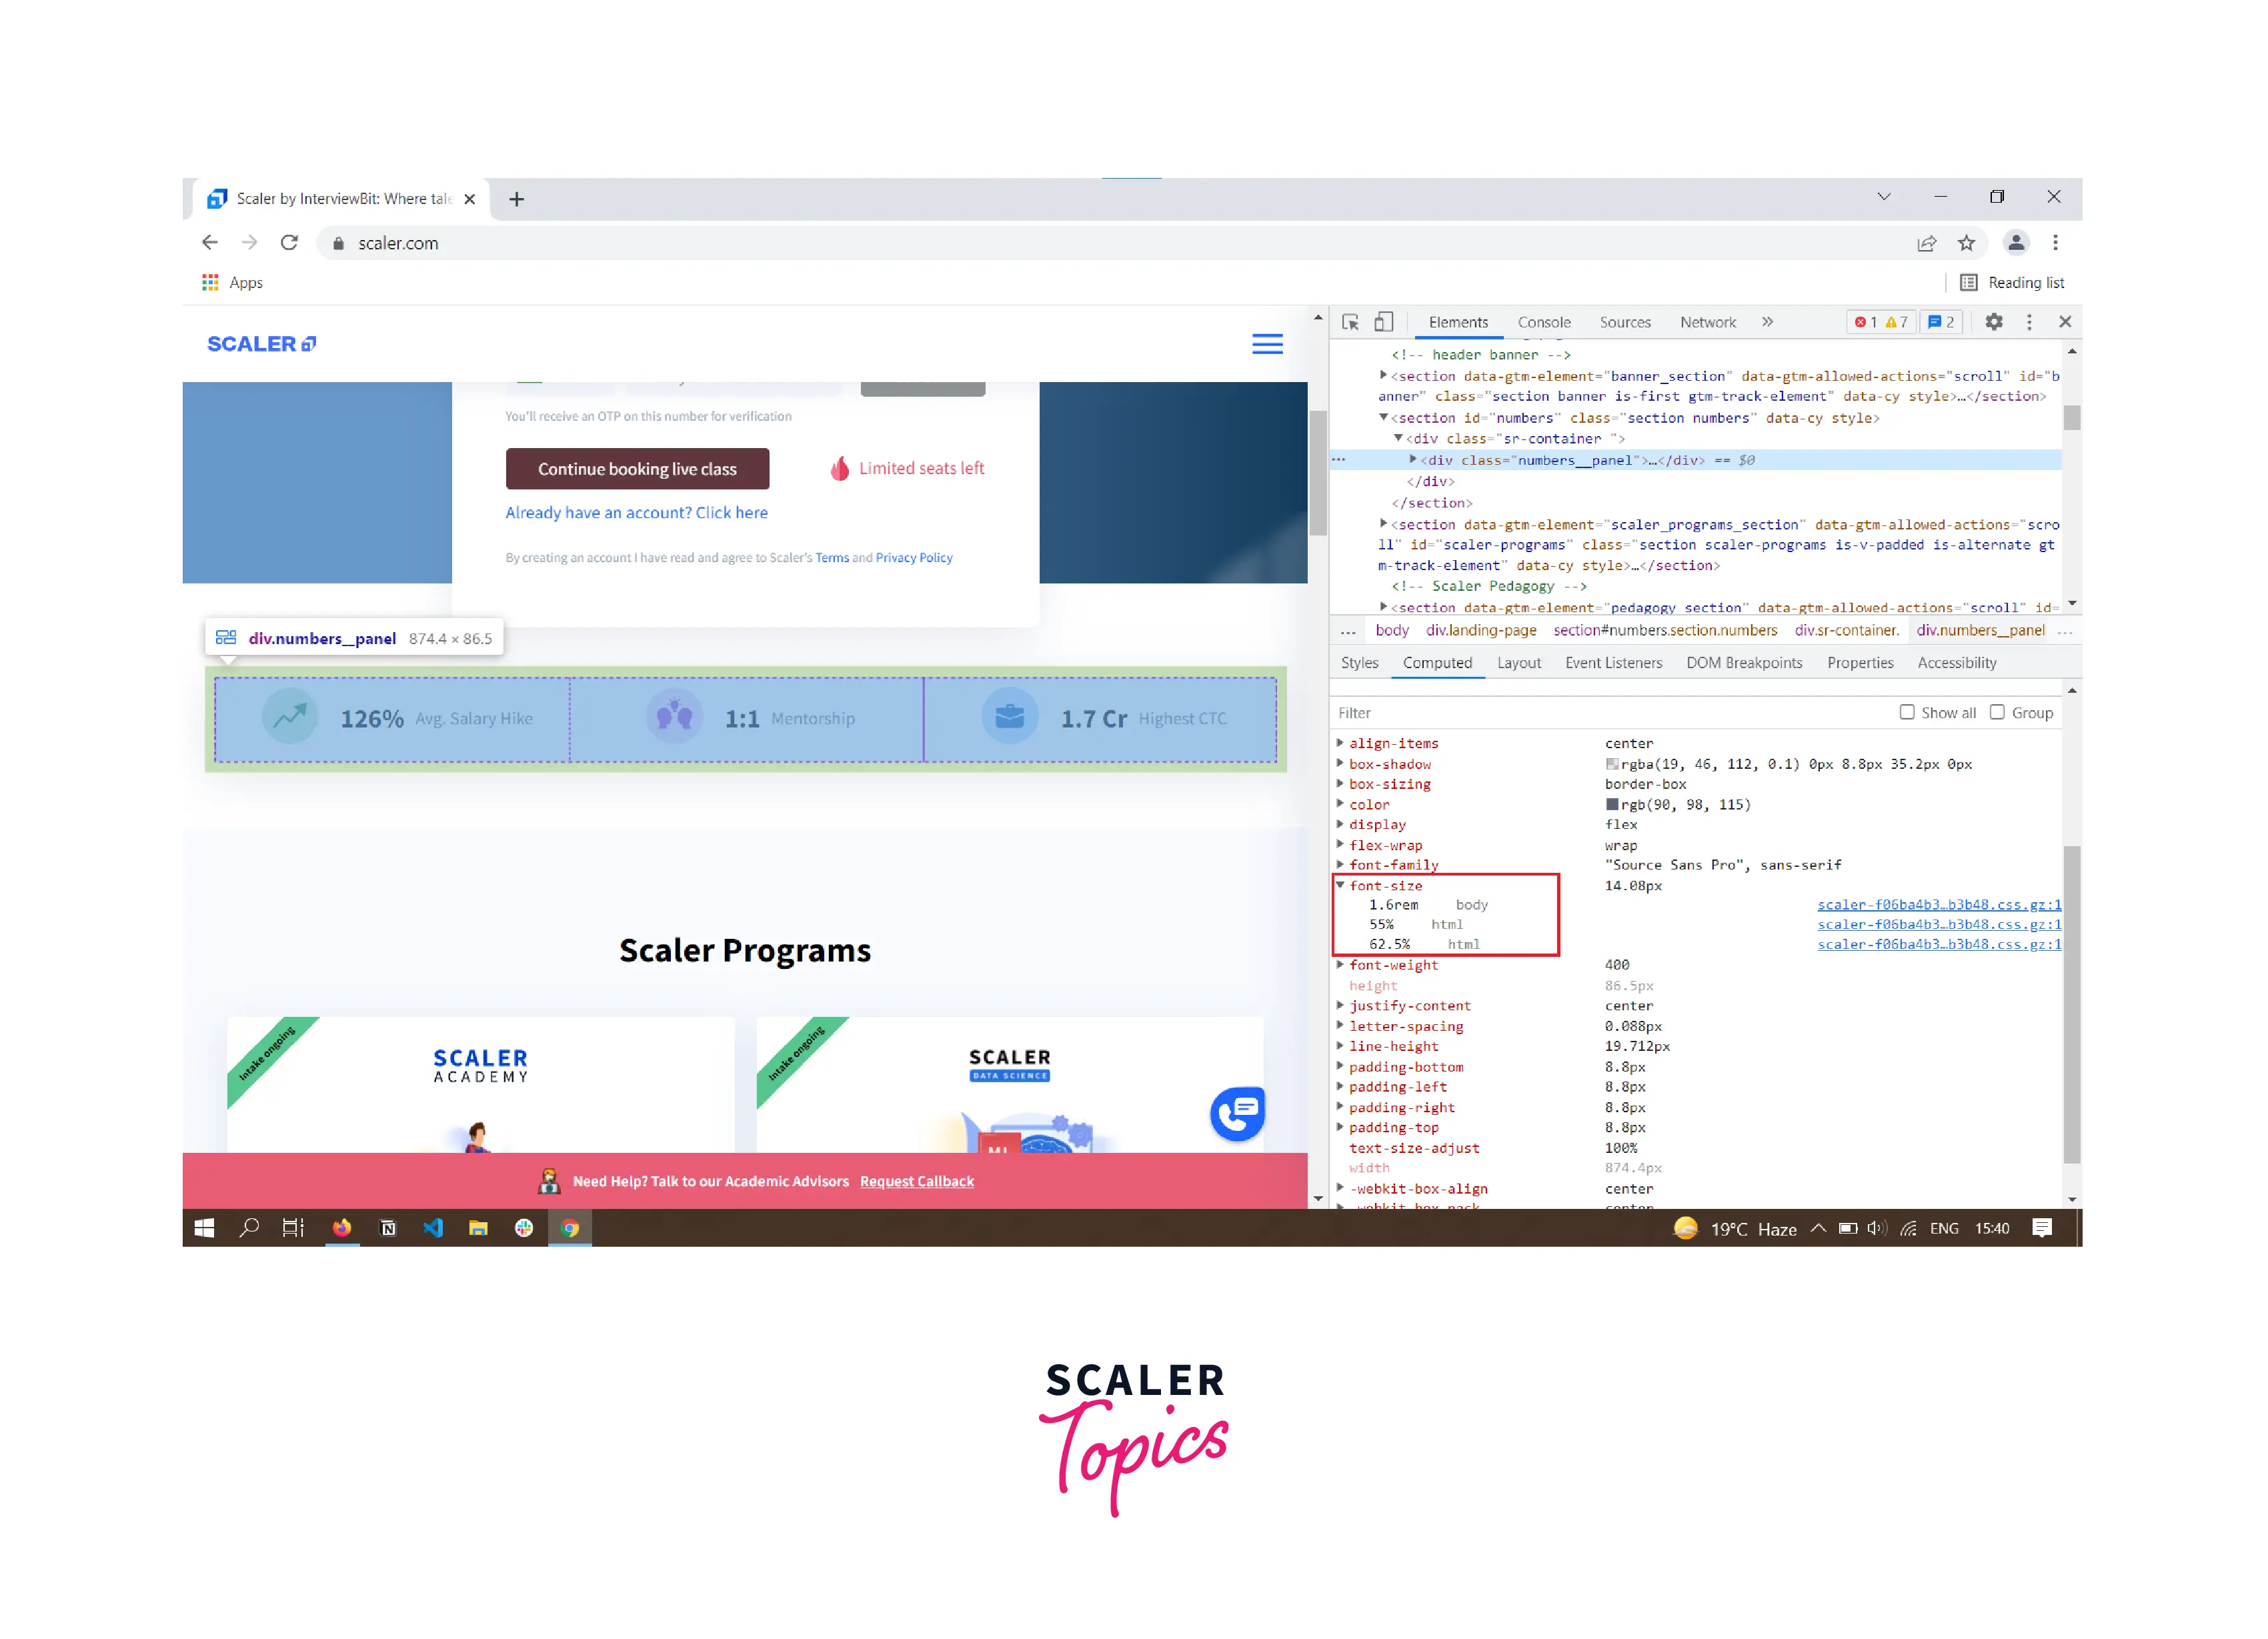
View Inherited CSS Properties
Select an element and open the computed tab. It shows the applied CSS with its value, but it shows all the inherited values when you click on a particular CSS declaration.
When you tick Show All, it shows all inherited properties, even the default values of all those properties.
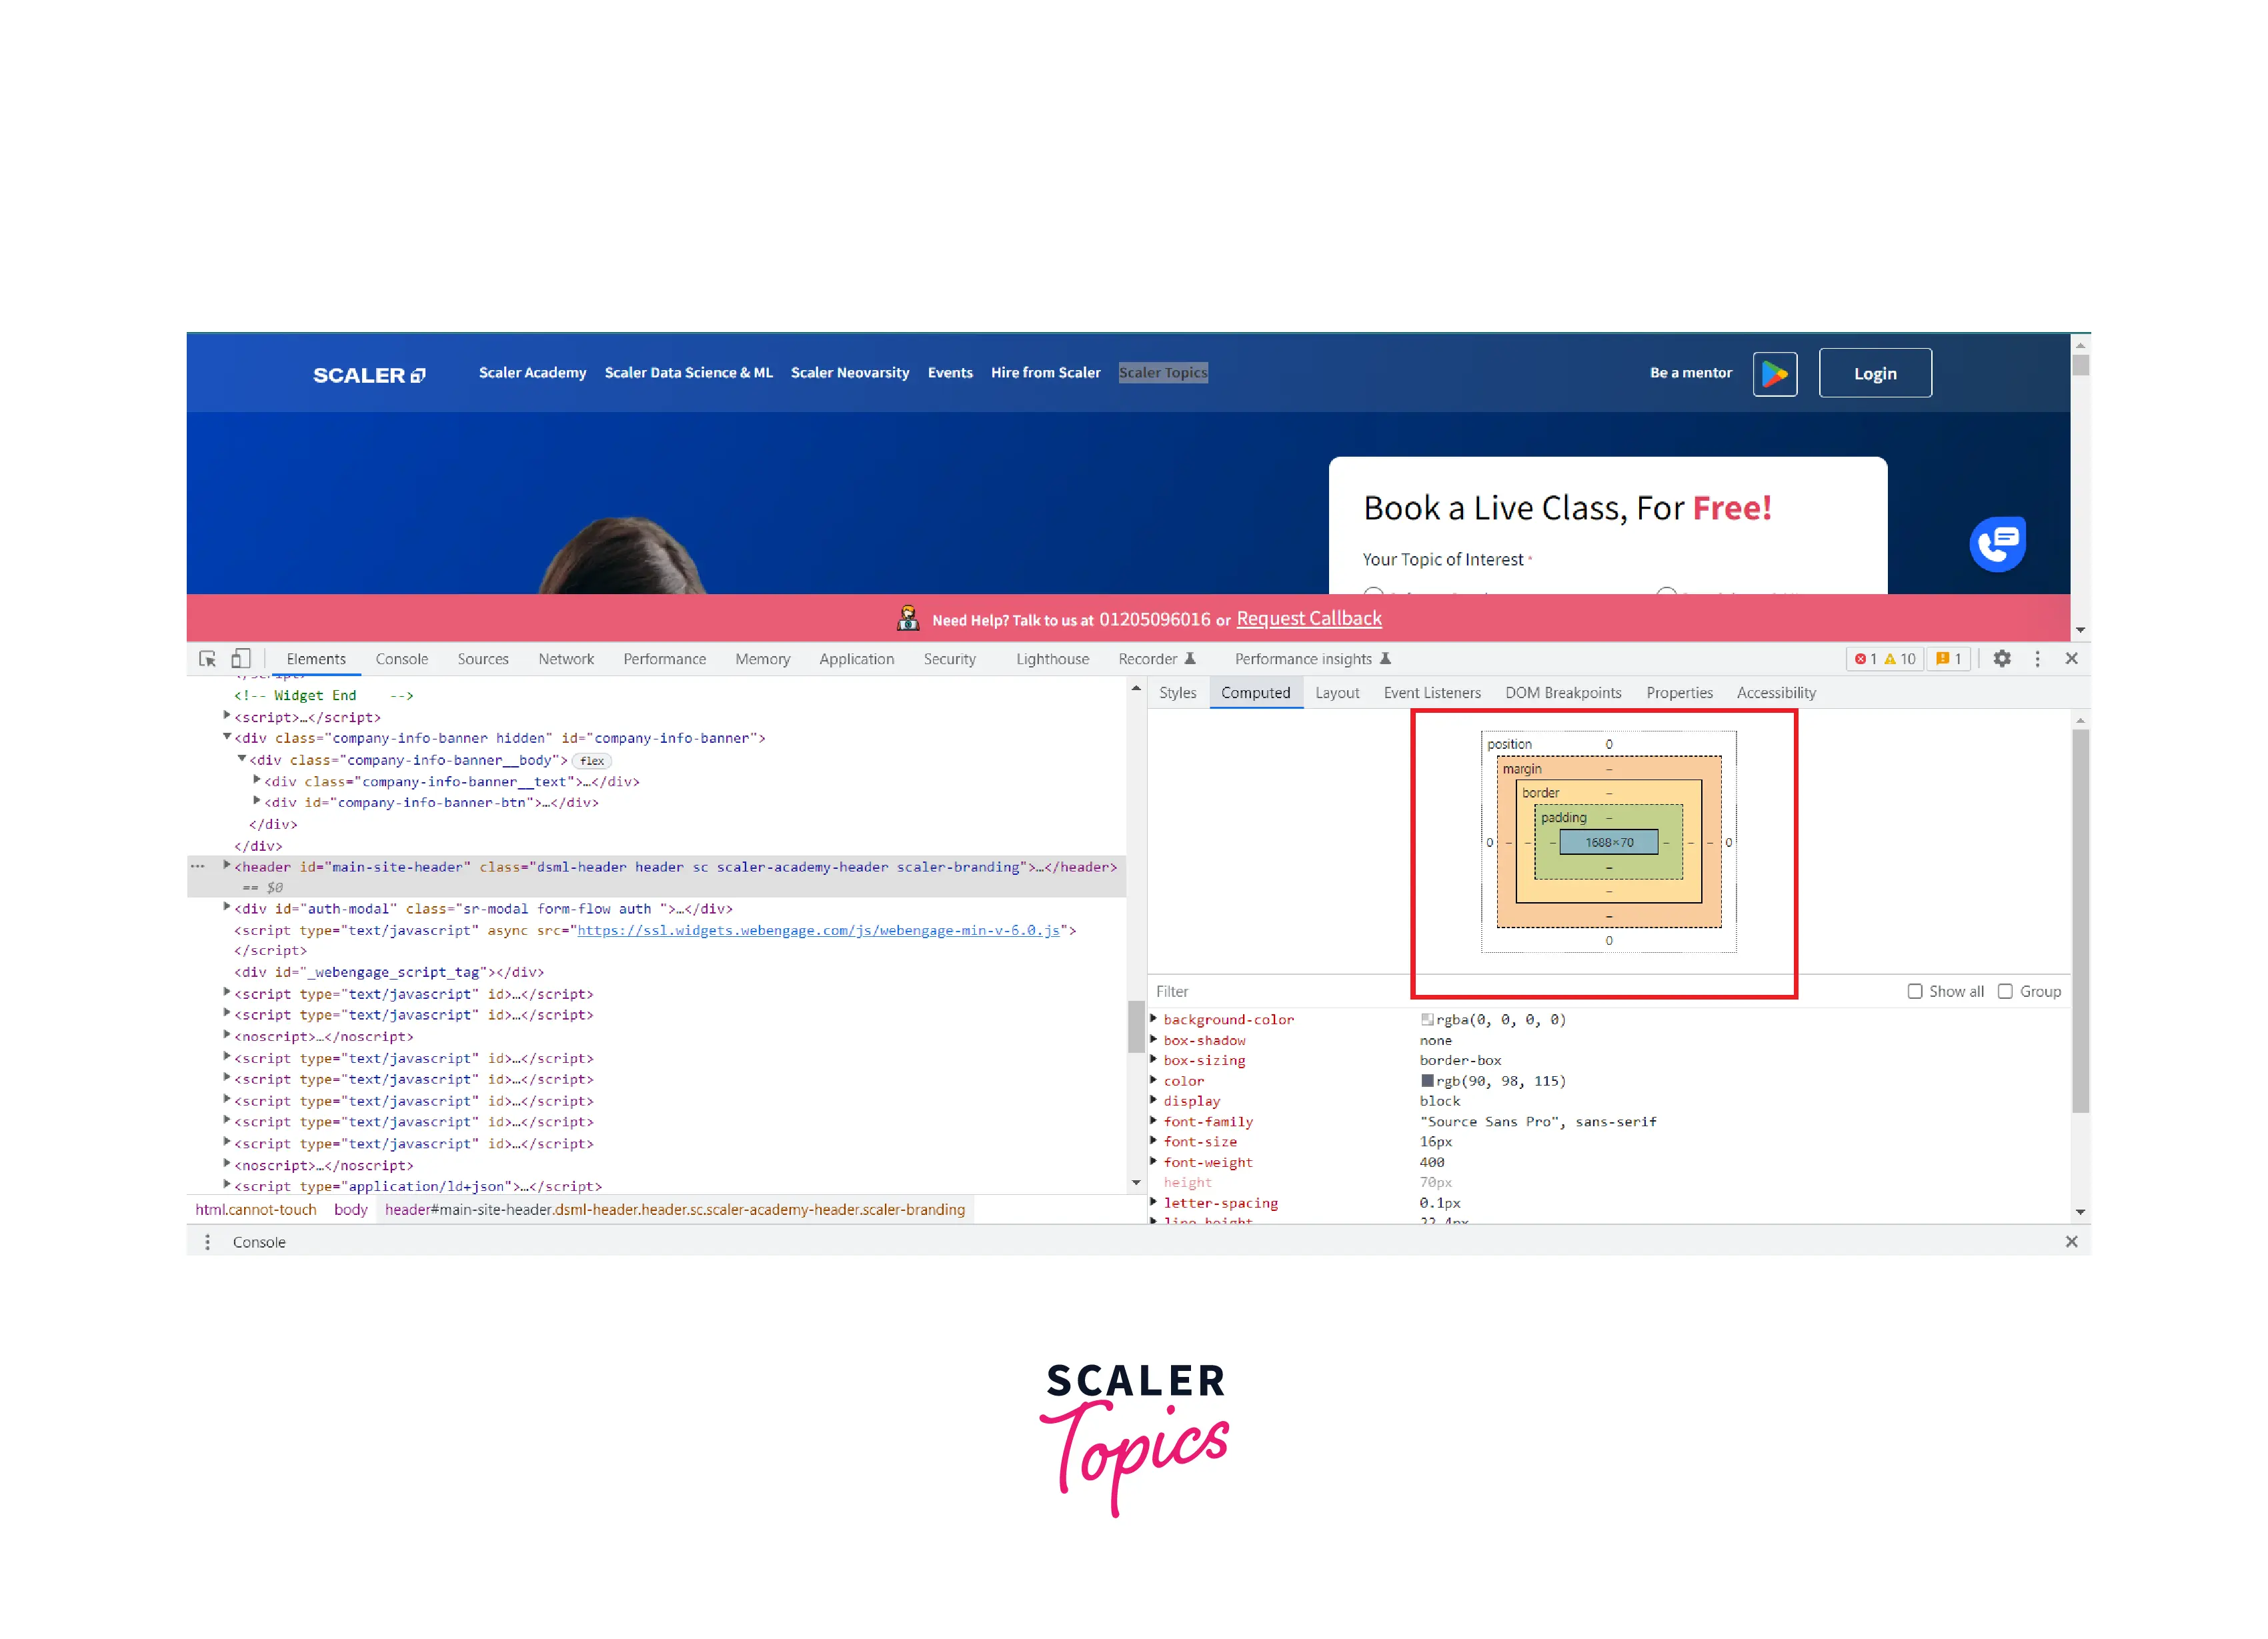
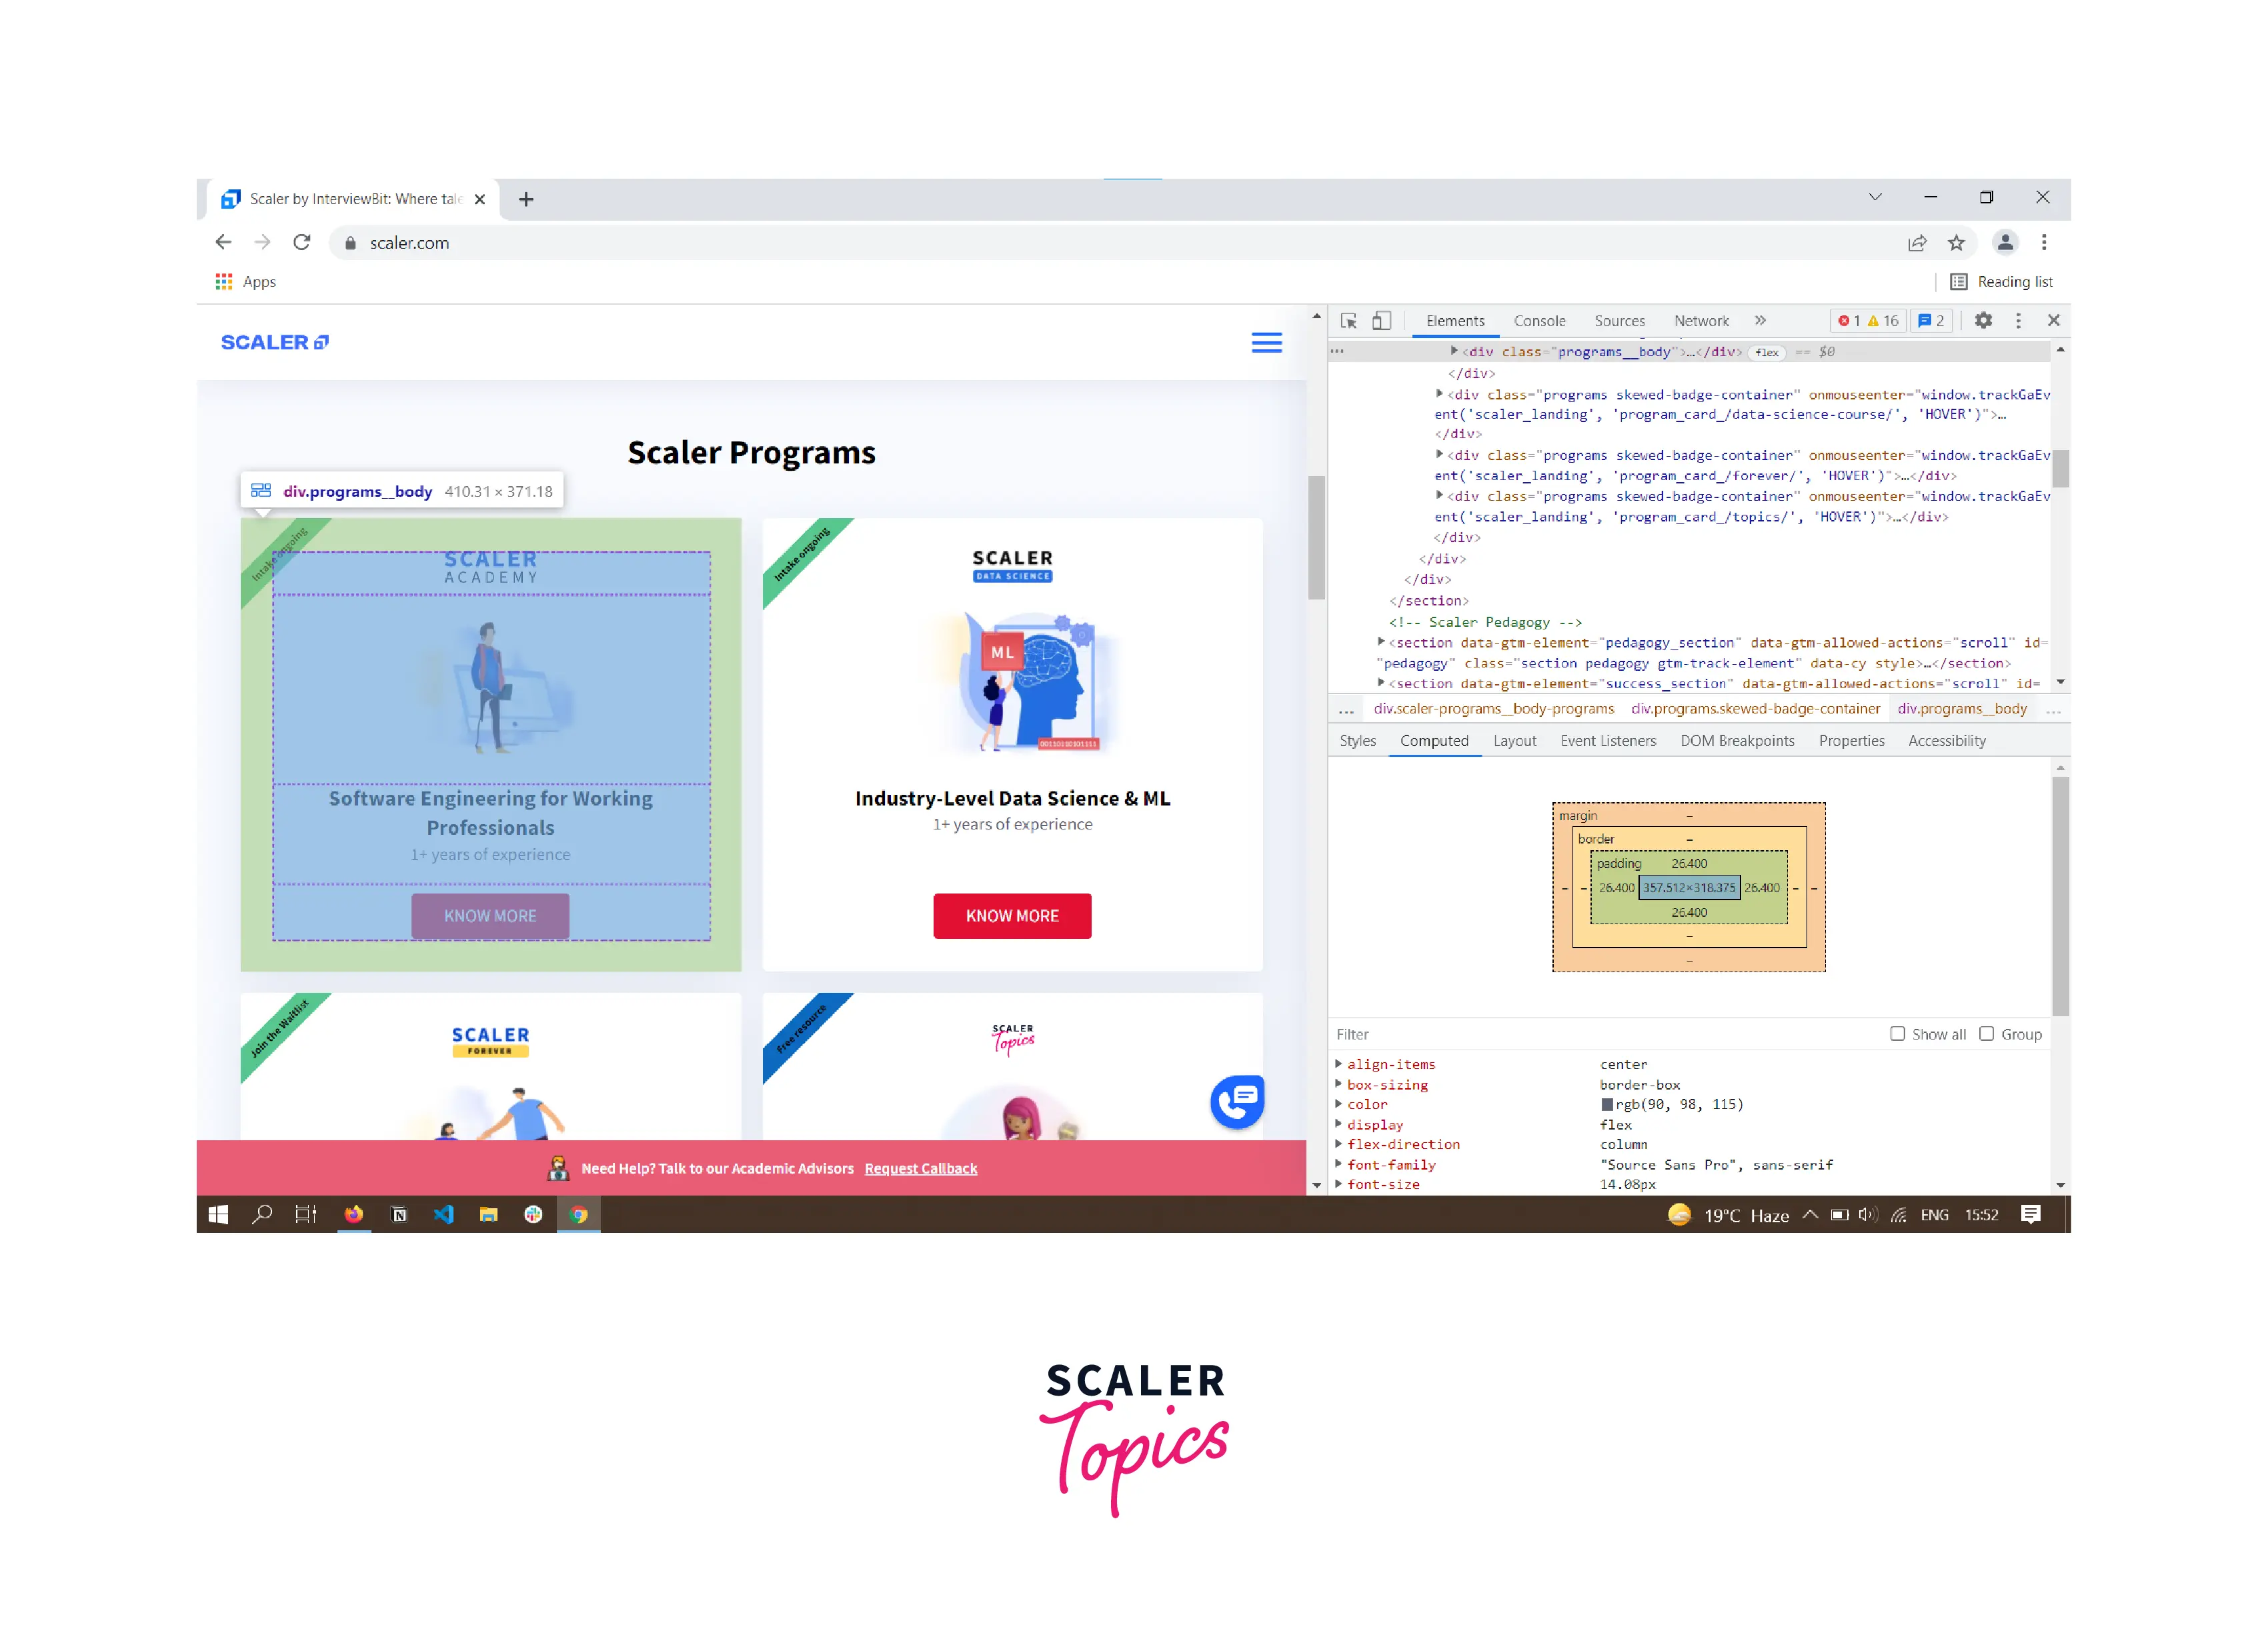
View an Element's Box Model
The box model displays information about the values of elements such as width, height, margin, and padding.
There are two ways to view the box model diagram after selecting an element. Let's know about both the methods in the points given below.
- Open the Styles tab, and move to the bottom of the Styles tab.
- Go to the Computed tab, and you can see the box model at the top.
You can see the box model opened via the second way in the image below.
Search and Filter an Element's CSS
Open the Styles and Computed tab and use the Filter text box to search and filter an element's CSS properties or values.
You can see the Filter text box with the word padd so it highlights all the associated CSS properties.

Toggle a pseudo-class
To toggle a pseudo-class of an element like :active, :focus, :hover, :visited, :focus-within or :focus-visible, use the styles tab.
Follow the below instructions to toggle a pseudo-class.
- Select an Element and open the styles tab.
- Click on the :hov option right to the filter box.
- Check the pseudo-class you want to enable or see.
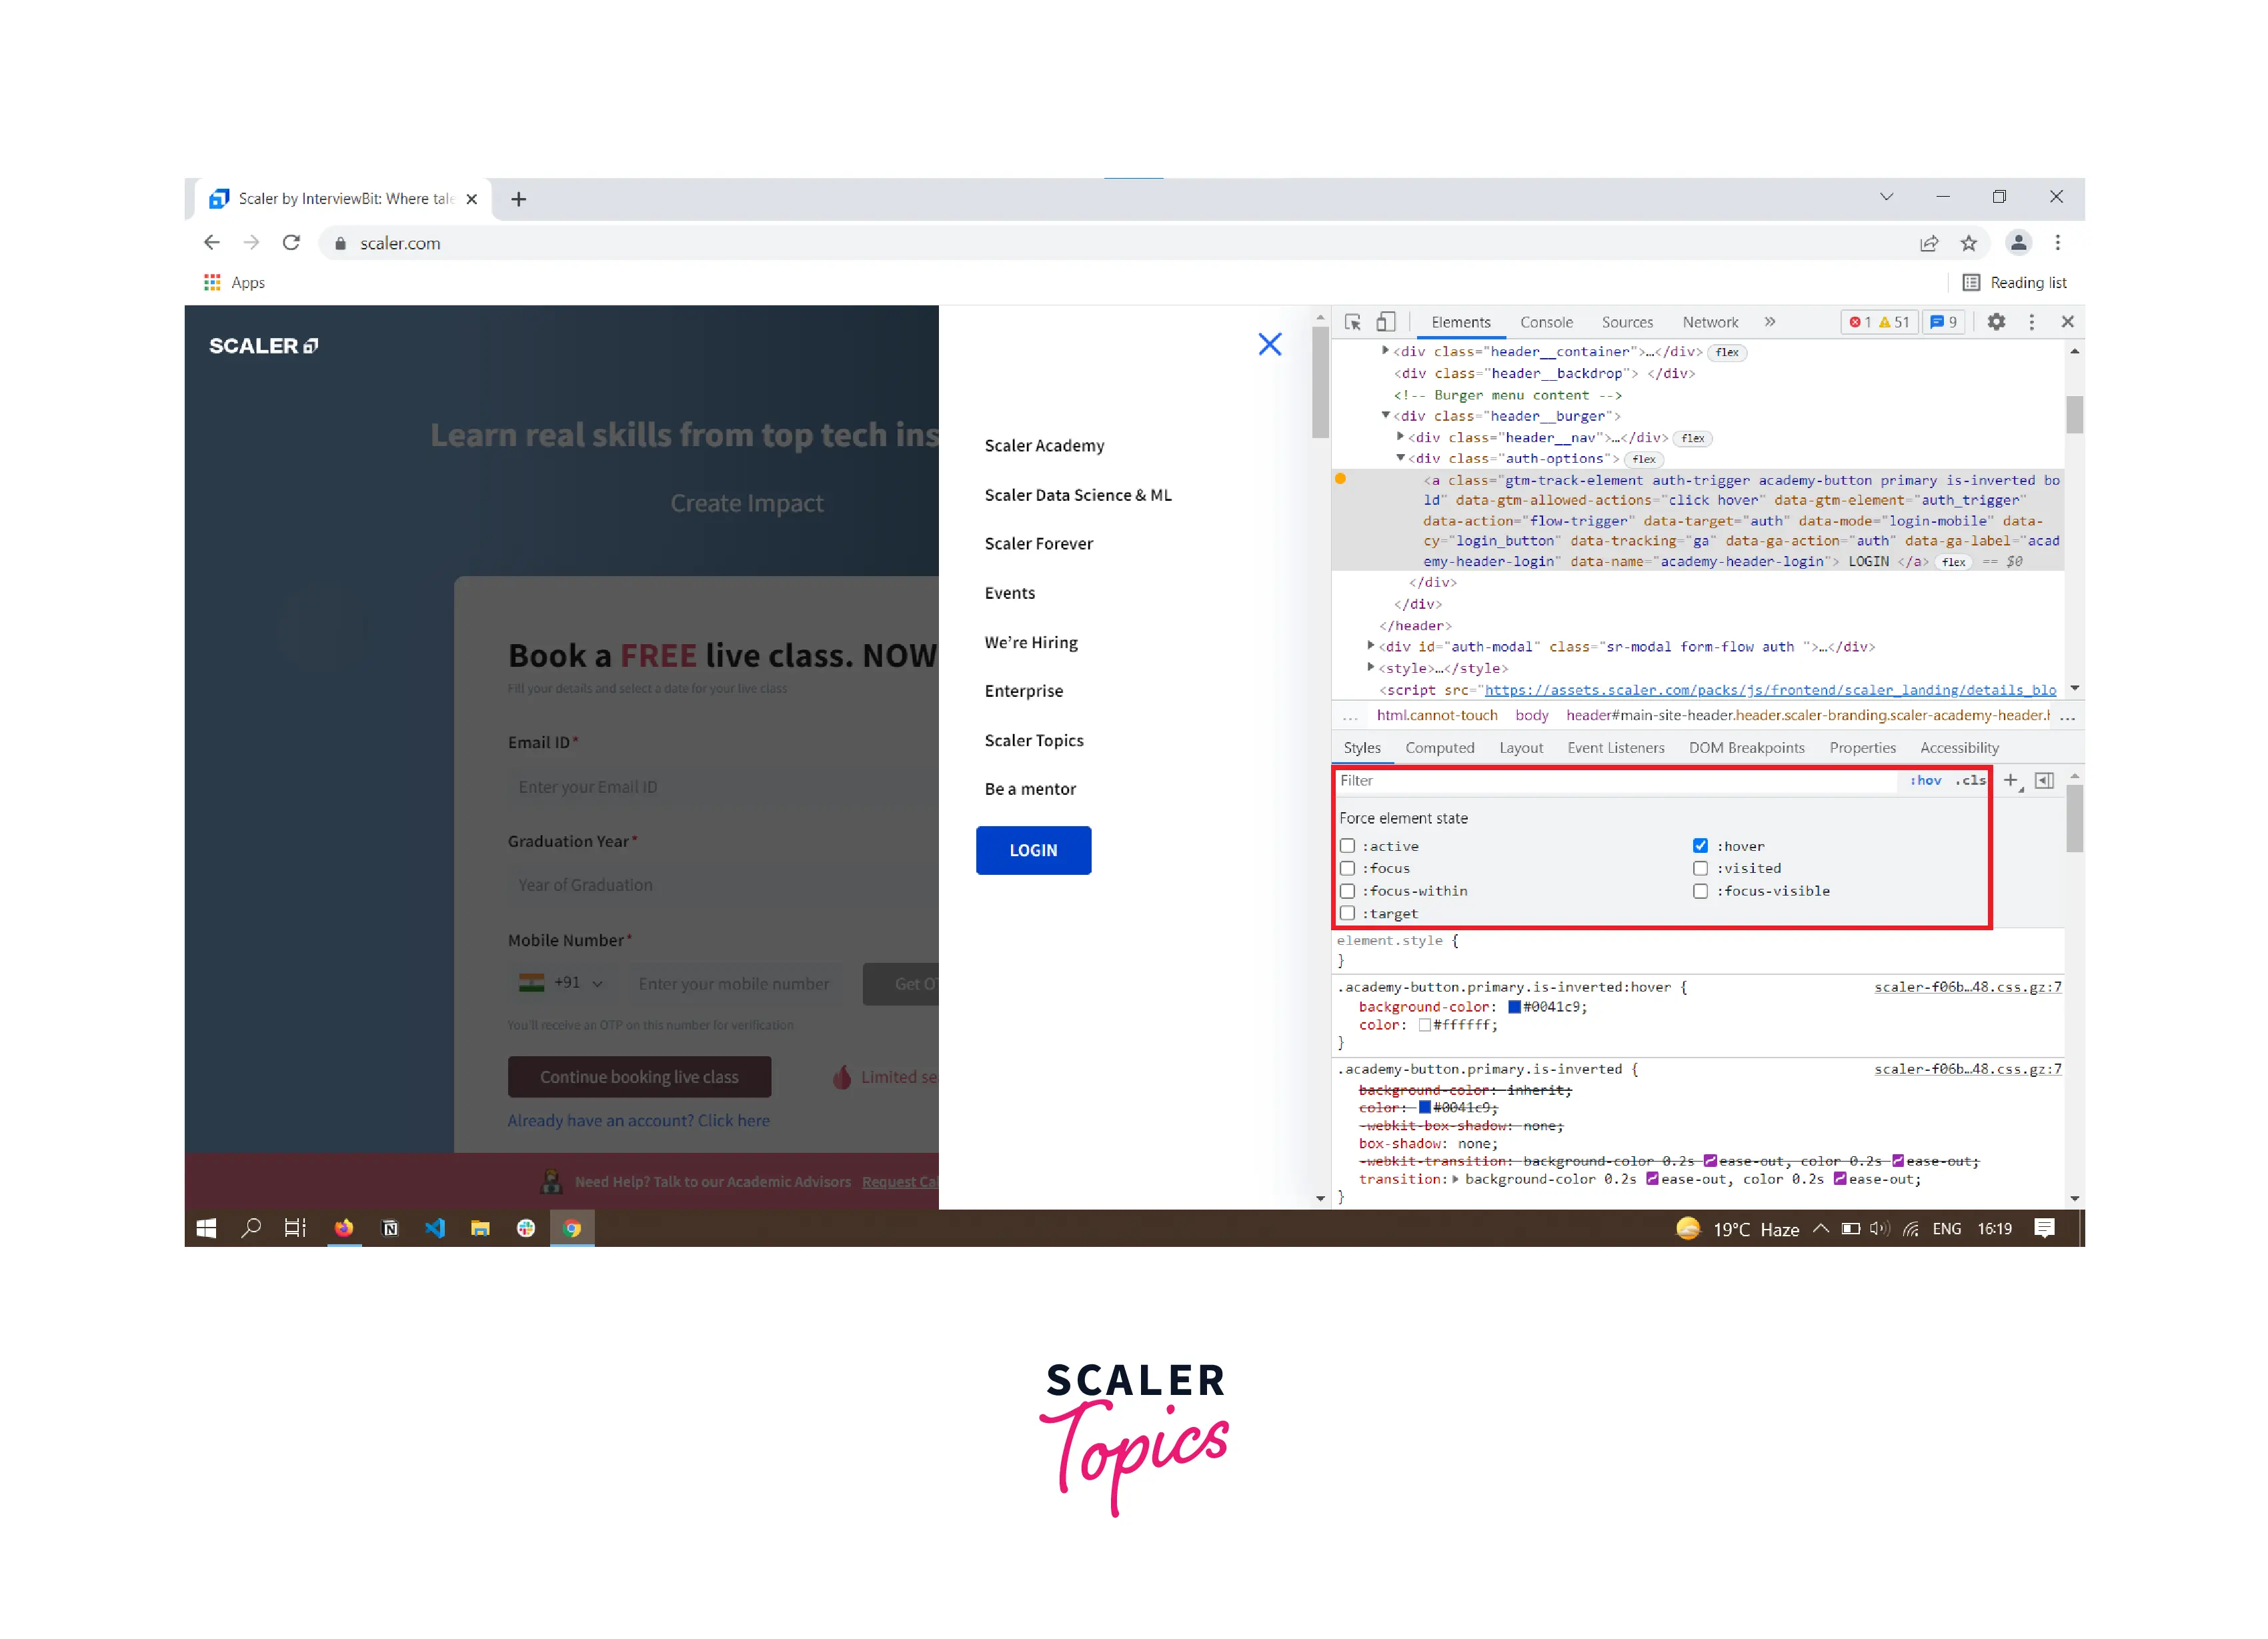
After toggling the element pseudo-class as a hover, you can see the blue color applied to the button. And even we are not hovering over the button.
View Used and Unused CSS with the Coverage Tab
Knowing how much CSS is actually in use and knowing about unused CSS is important to make our web page faster. DevTools provides a Coverage tab for viewing used and unused CSS. To open the Coverage Tab, Follow the below instructions.
- Open DevTools, Press Control+Shift+P (Windows) or Command+Shift+P (Mac) to open the Command Menu.

- Start typing "coverage" or "show coverage" in the text box, and click on the Show Coverage.
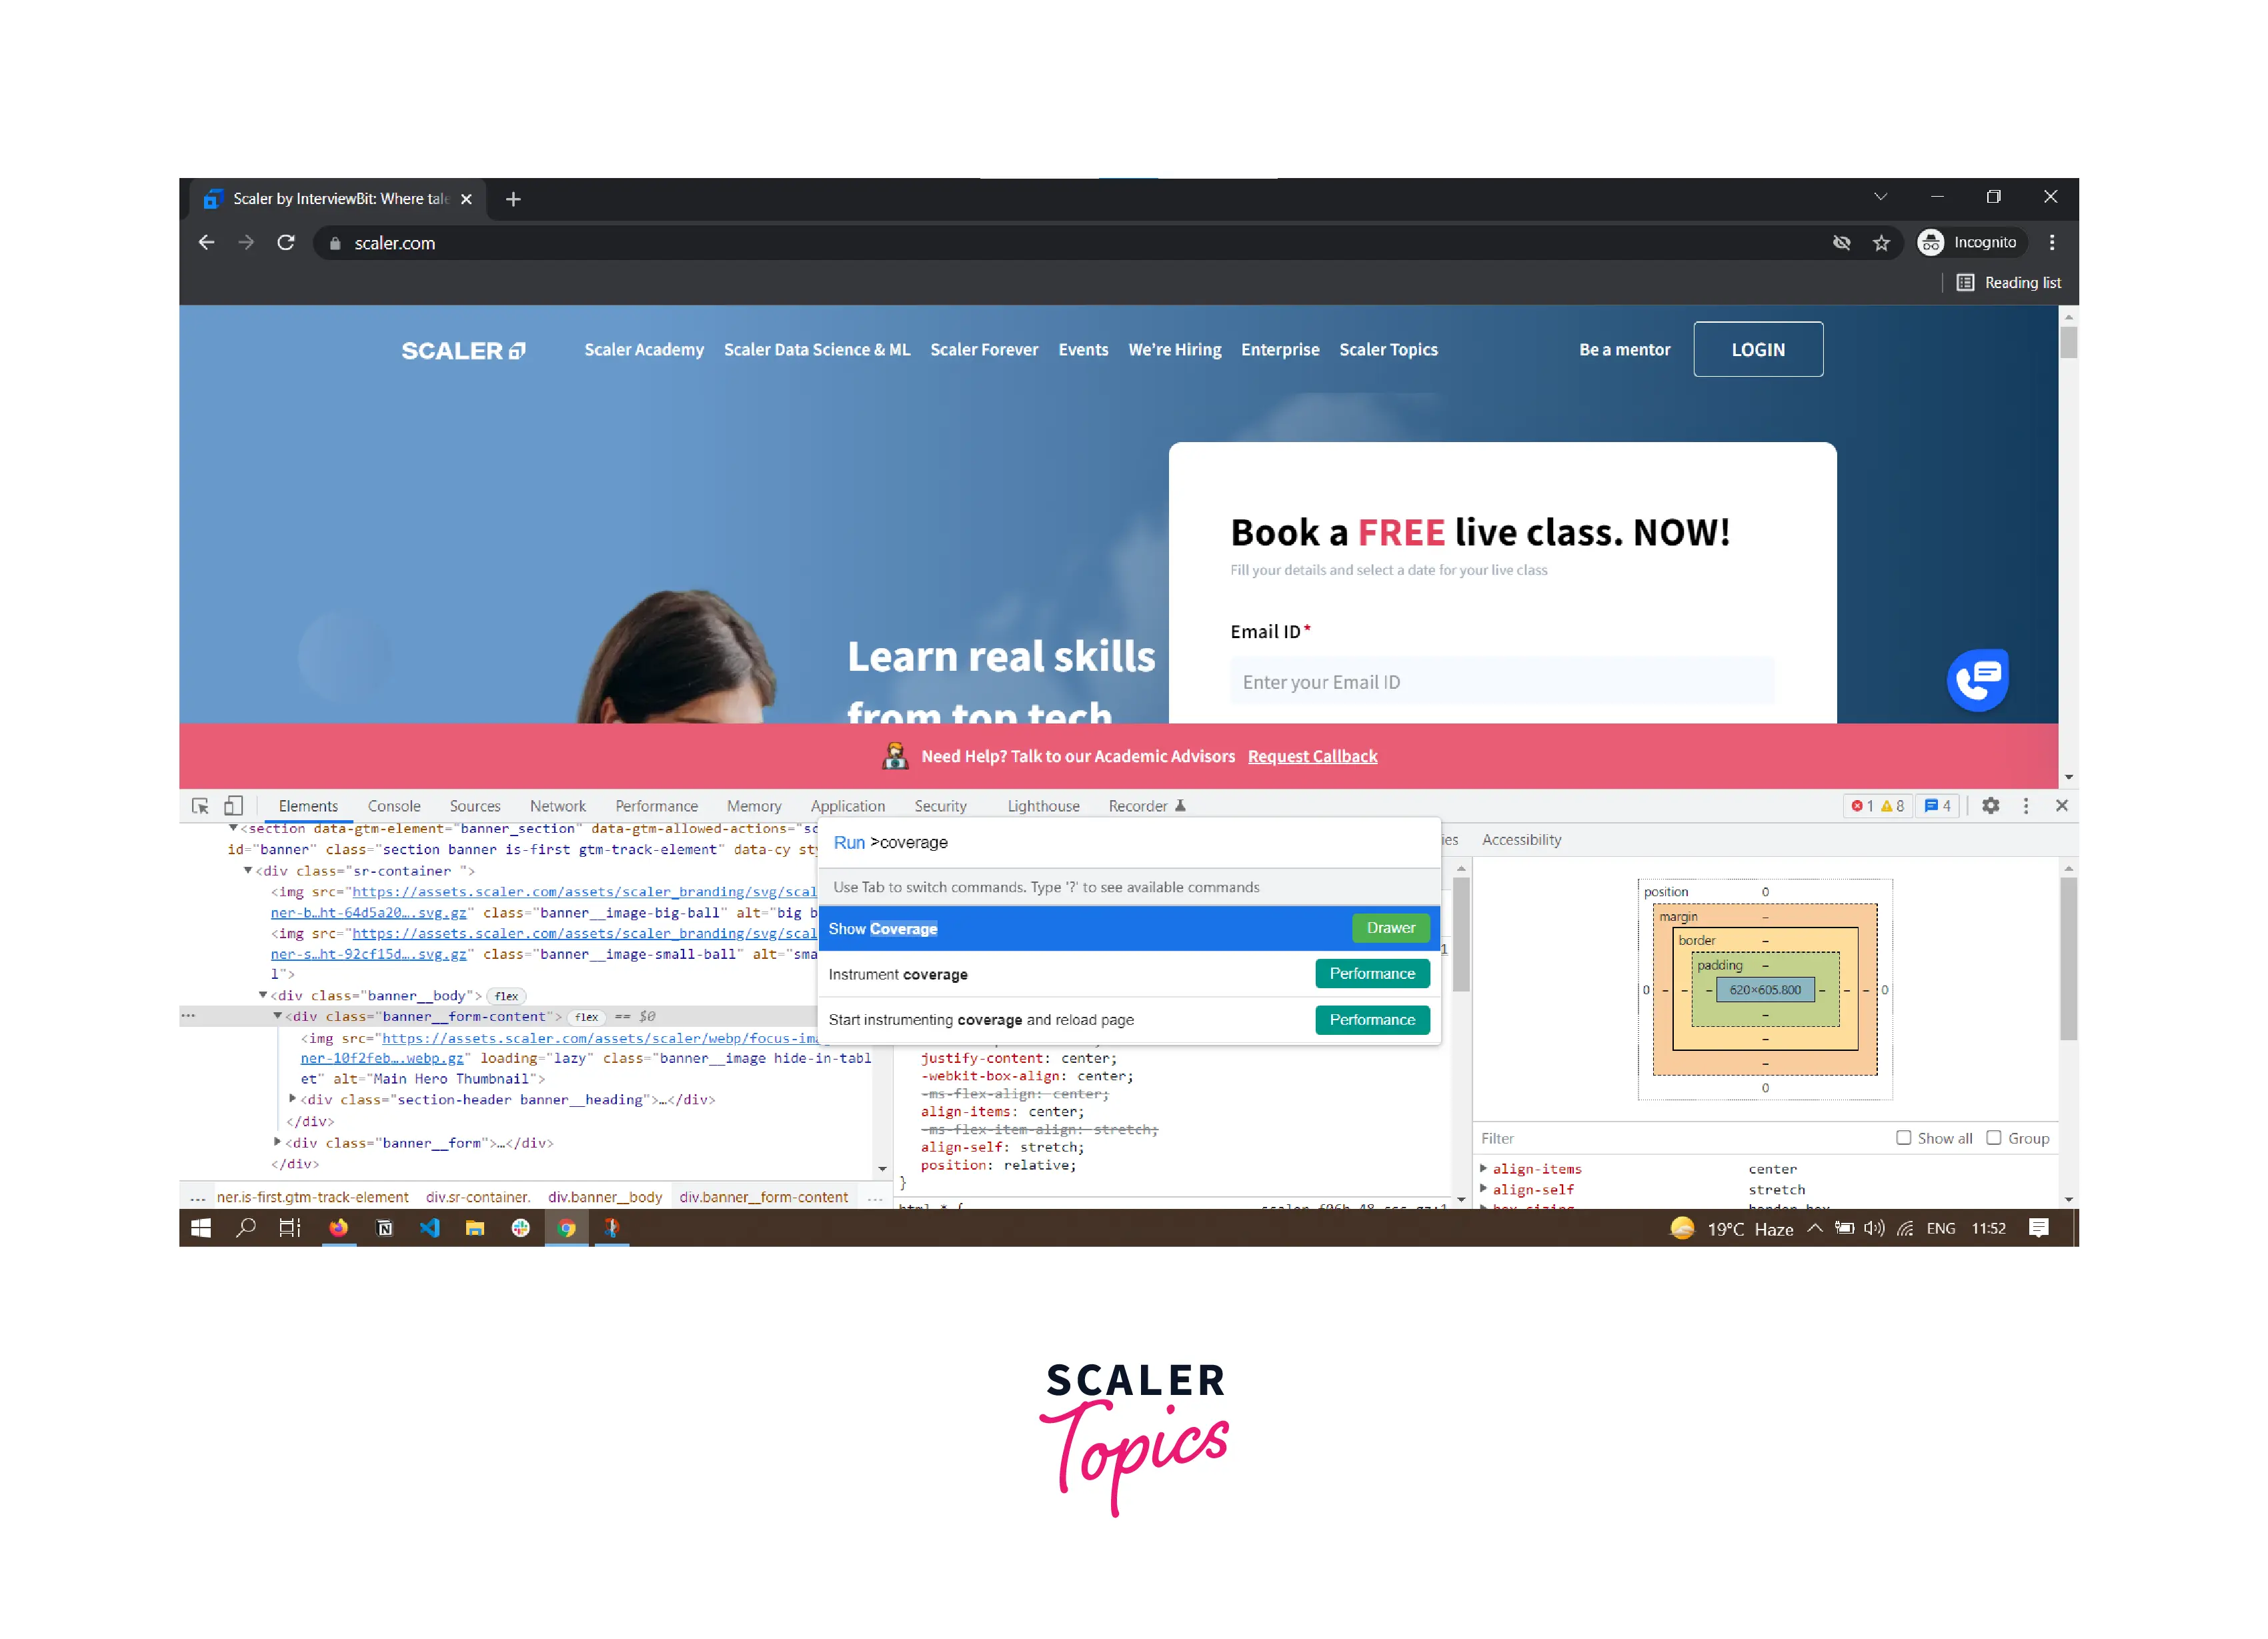
- When you click on the Show Coverage option, it opens the Coverage tab like this.
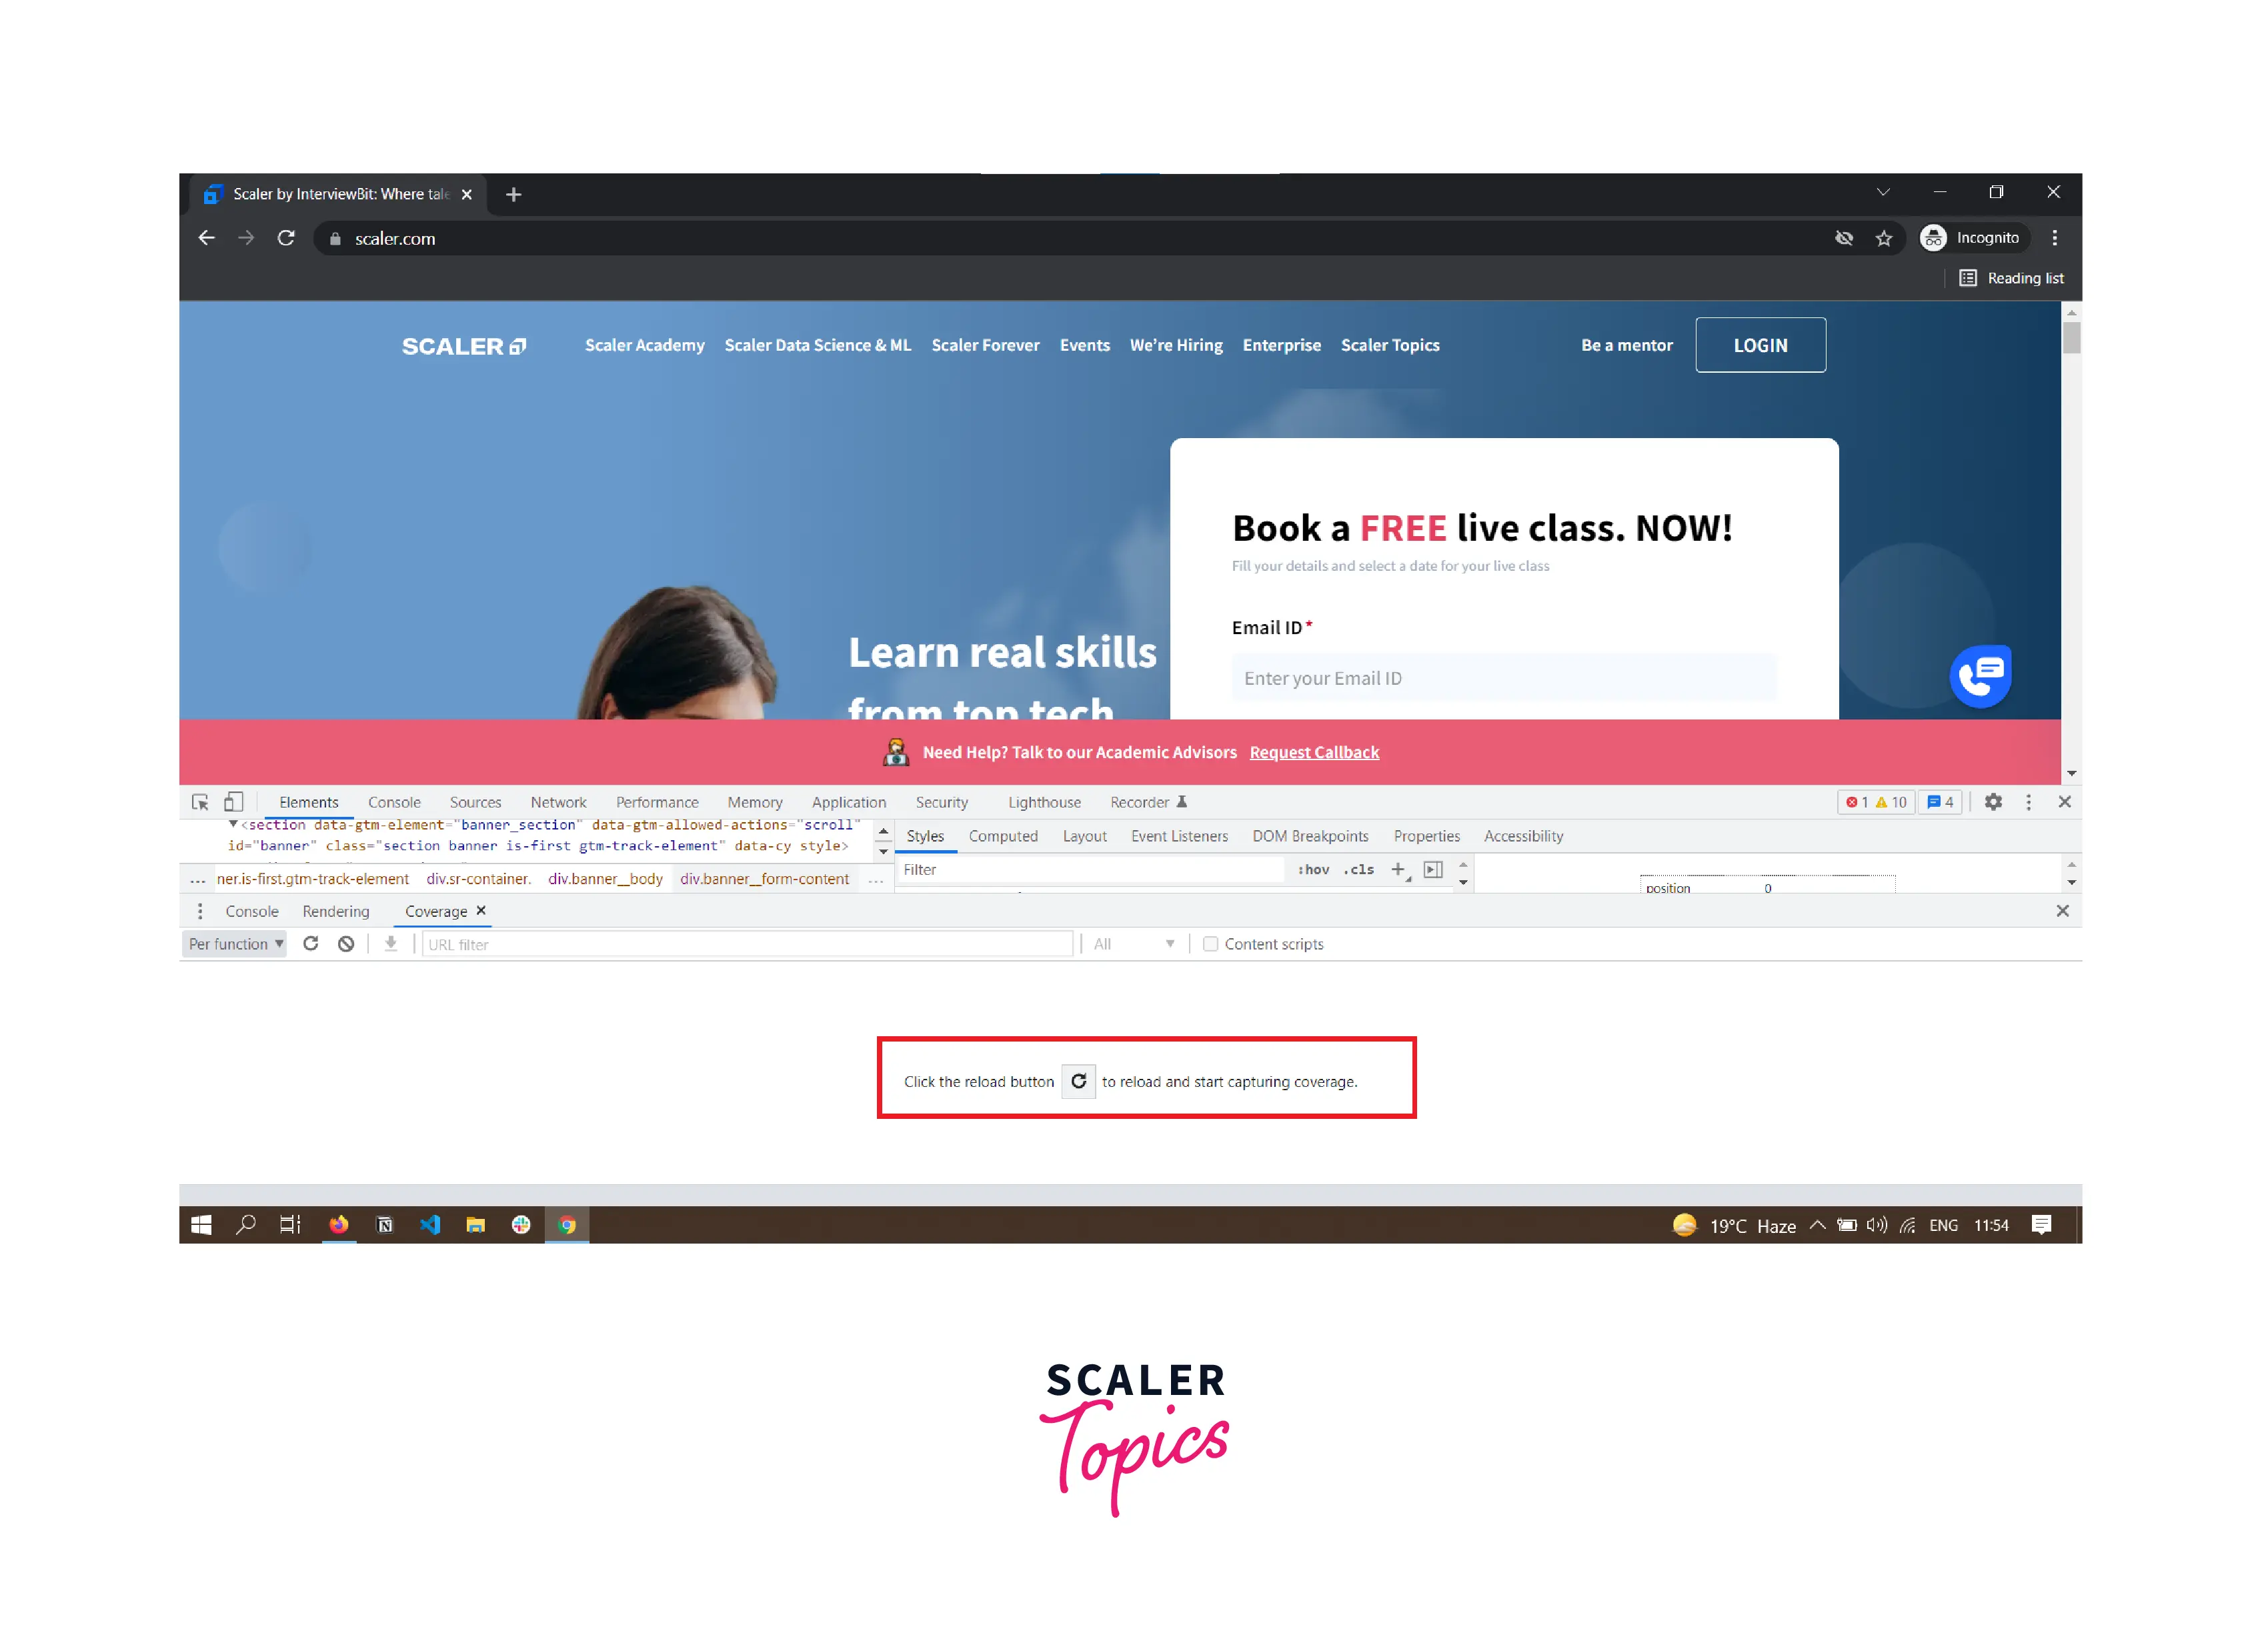
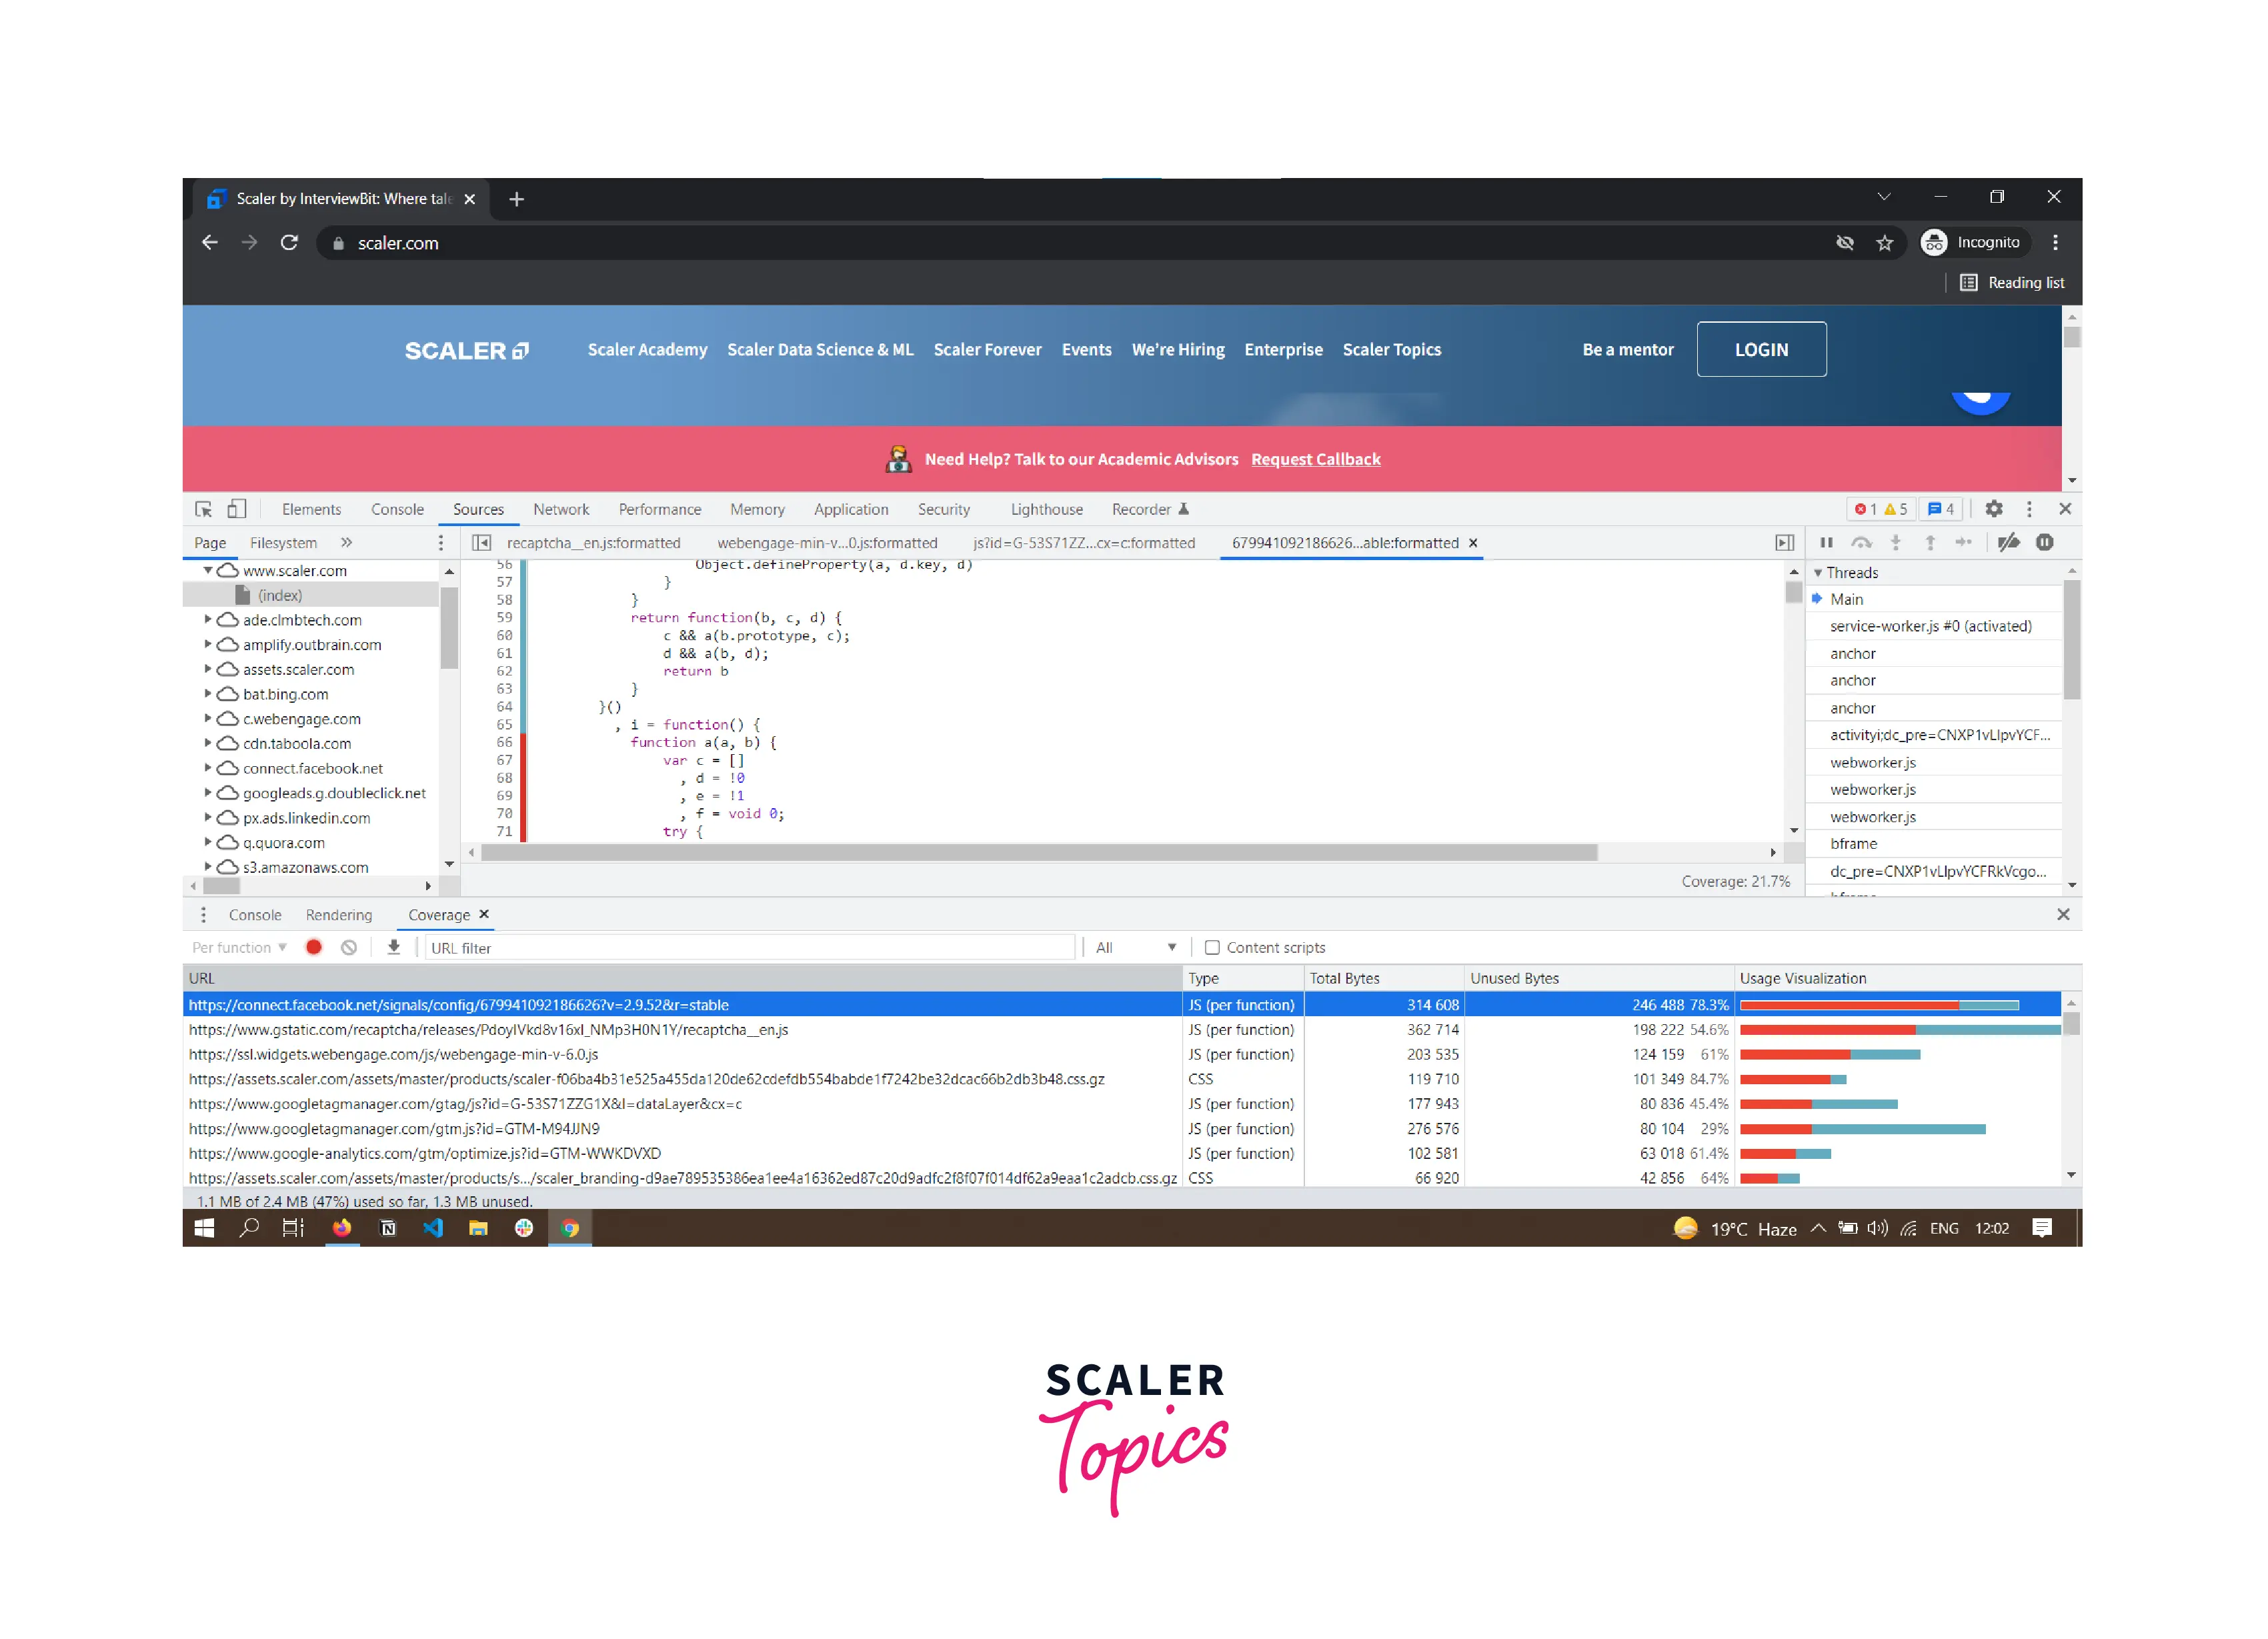
- Click on the Reload option, and the coverage tab provides the information about how much CSS ( javascript too) is used and how much CSS is unused. You can see the usage visualization graph in two colors, green and red, where Green represents used CSS and Red represents unused CSS.

- When you click on a CSS file, you can see the line-by-line breakdown of used and unused CSS with both color differentiation.
View a Page in Print Mode
To view a page in print mode, Follow the below instructions :-
- Open the Command line and type the Rendering and select Show Rendering.
- For the Emulate CSS Media type dropdown, select print.

Force Print Preview Mode
To force a print preview mode follow this instruction
Change CSS
Add a CSS Declaration to An Element
We mostly try to change or add a new CSS style to an element during the debugging. There are two ways to add CSS declaration in DevTools.
- Inline Declaration or inline-style
- external declaration or external style rule
Since, the order of the CSS style declaration affects the final style of an element, we have to use both ways carefully and consciously. For most scenarios, you'll use the inline style because it has higher specificity than the external style and ensures that the applied style takes effect as you expect. But if you are debugging a specific element style, then changing or adding that element external style rule is the safest way to find the perfect solution for your problem.
Inline Declaration or Inline-style
Follow the below instructions to add an inline declaration :-
- Open DevTools and Select the element.
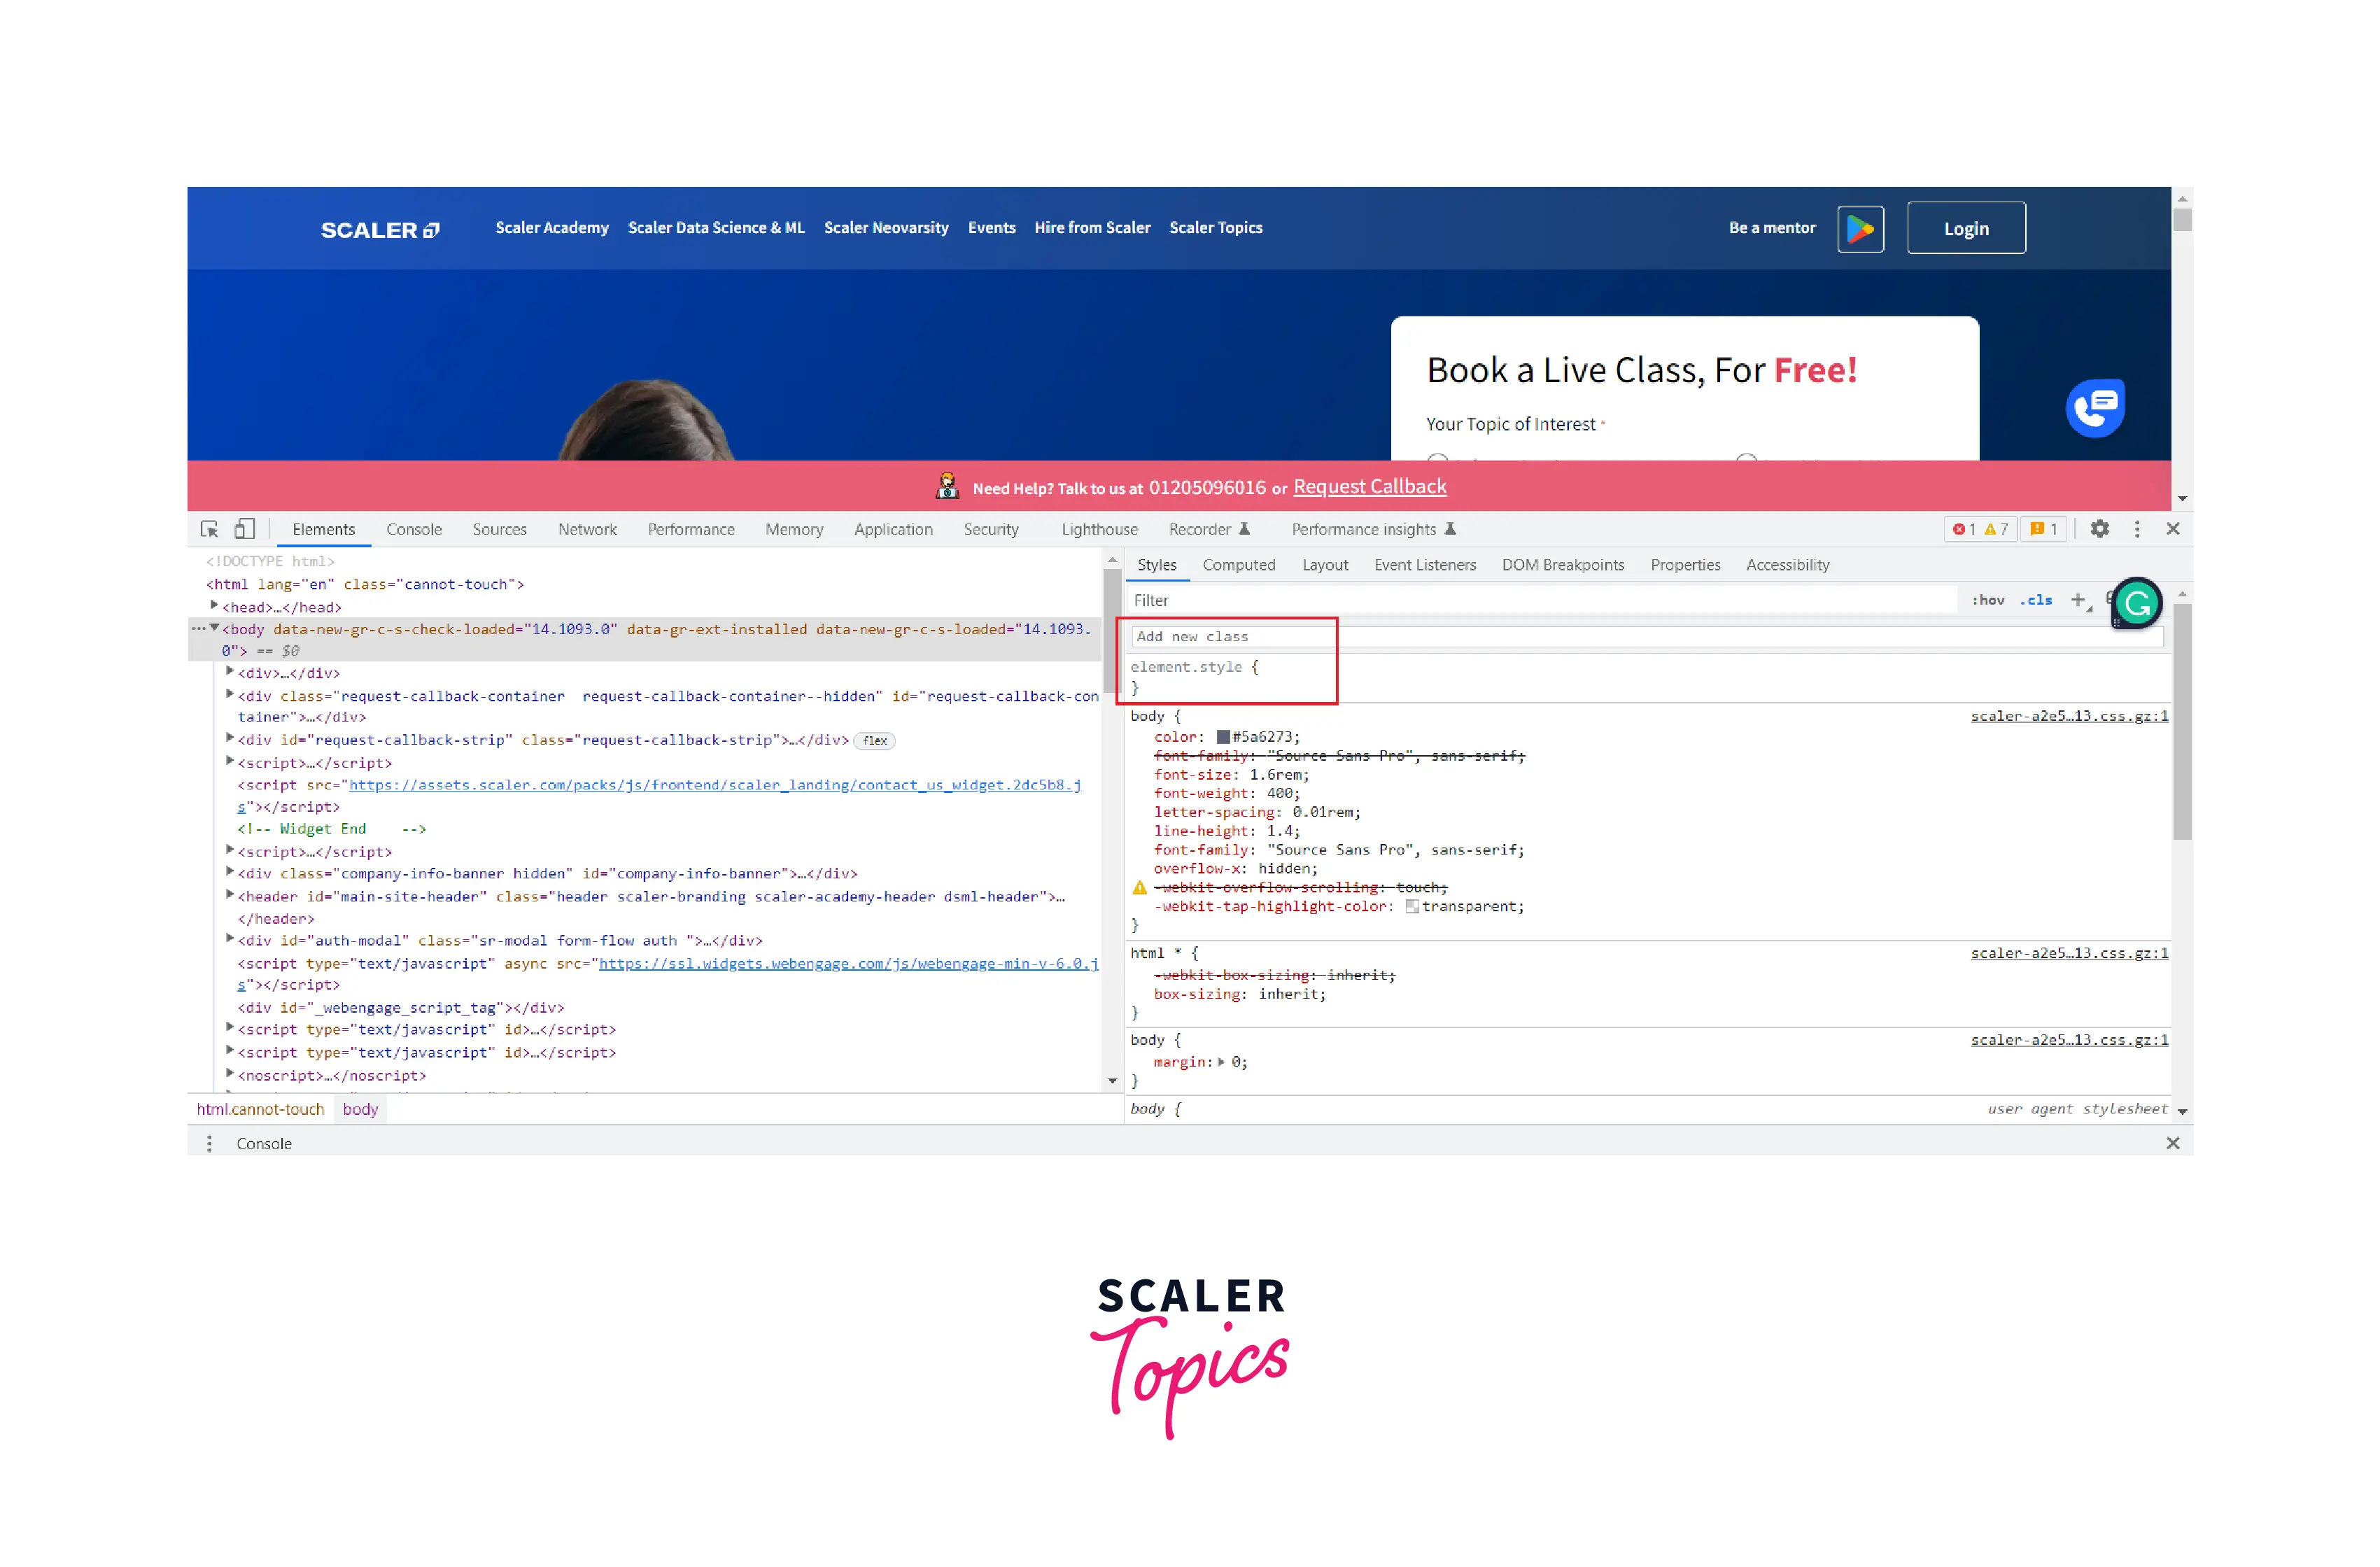
- Open the Styles panel, and click between the brackets of the element.style (just below the filter box). The cursor starts blinking and allowing you to enter text.
- Enter a property name and its value and press Enter.
- You can see the applied style on the selected element in the DOM Tree with the style attribute.

You can see in the above image that the background color and border properties have been applied to the selected element.
External Declaration or External Style Rule
To add external declaration, just follow the instructions :-
- Open DevTools and Select the element.
- Open the Styles panel, and click between the brackets of the style rule or class name ( or the id selector ) you want to change. The cursor starts blinking and allowing you to enter text.
- Enter a property name and its value and press Enter.

I have added a background-color property with a deep pink value in the .section-header__title style rule.
Change a Declaration Name or Value
To change a declaration name or its value, you have to double click on it in the Styles panel.
Change Declaration Values with Keyboard Shortcuts
When changing the value of a declaration in the DevTools, you can use various shortcuts. Let's go through some of the most common shortcuts :-
- Alt+Up (Windows, Linux) or Option+Up (Mac)to increment by 0.1.
- Up Key to increment the value by 1, and Down Keytto decrement the value by 1.
- Shift+Up to increment by 10 and Shift+Up to decrement by 10.
Add a Class to An Element
To add a class to an element :-
- Open DevTools and Select the Element.
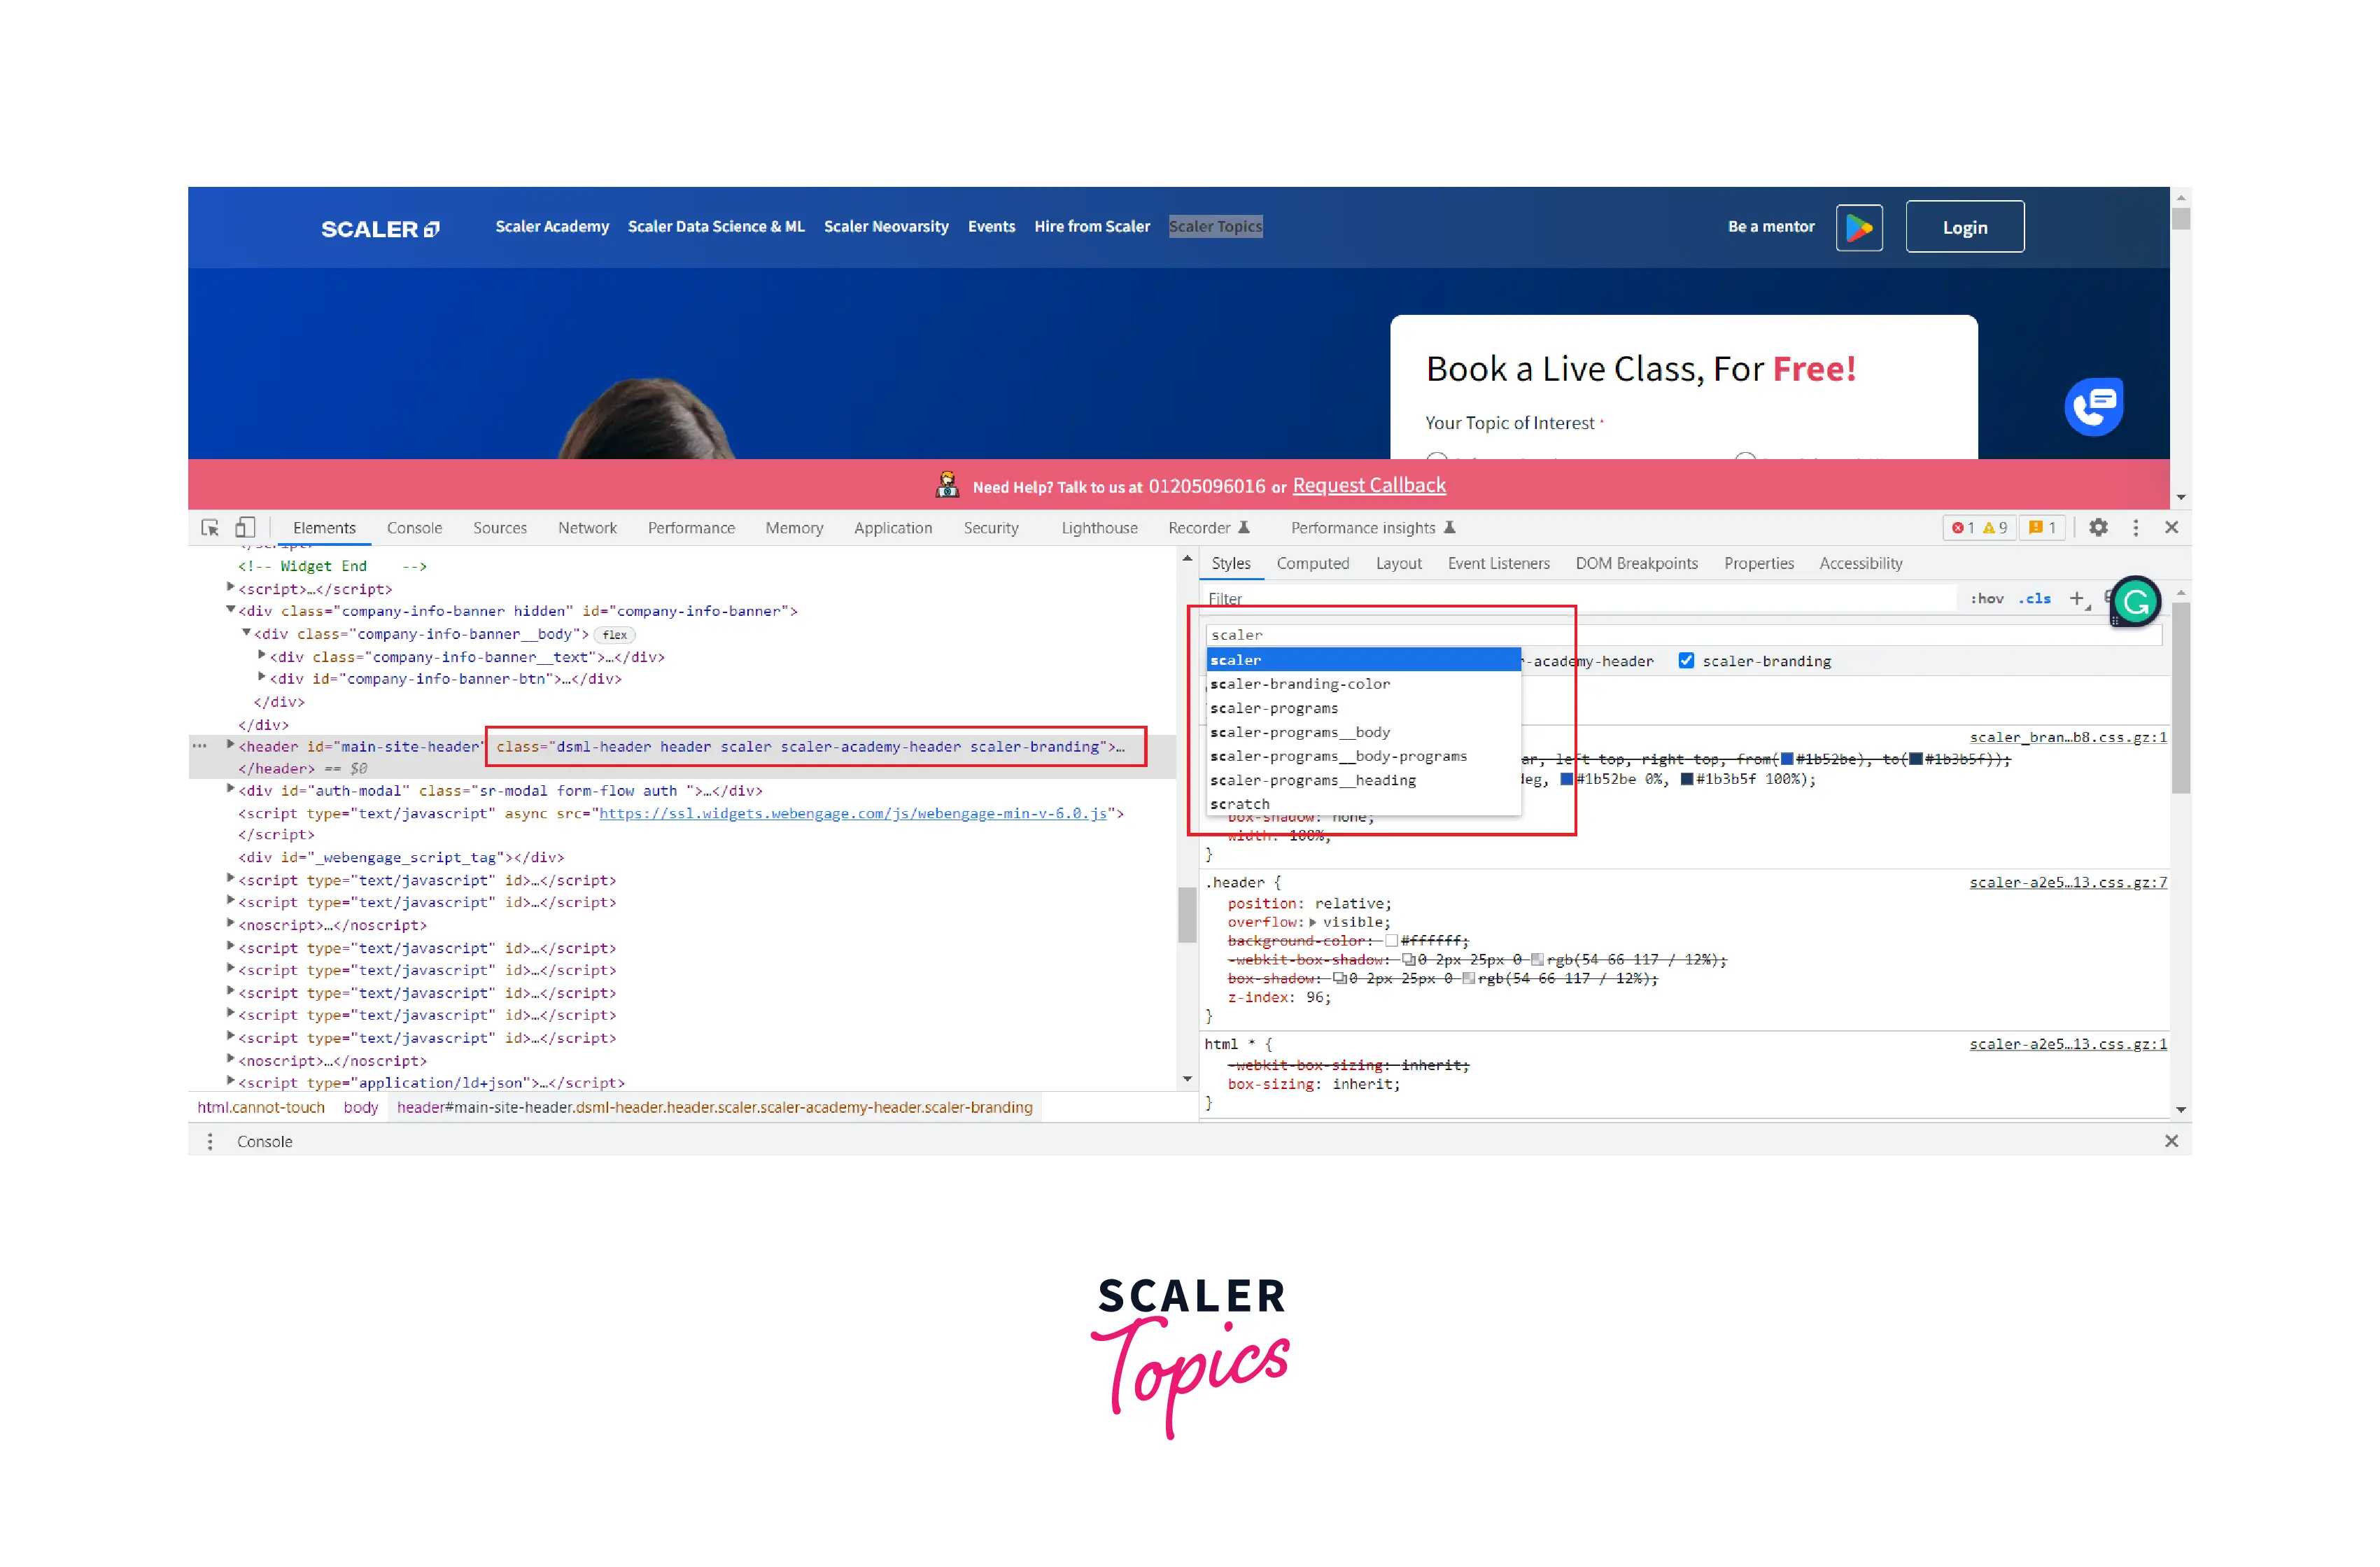
- in styles panel, click on .cls, and a text box appeared with " add new class" message.
- Type the class name you want to add and press enter.
Toggle a Class
To toggle a class on an element.
- Select the Element.
- Click on the .cls in the styles panel.
- It shows a text box, and below it shows all applied classes.
- You can see the checkbox in front of applied classes, and toggle them to enable or disable a class.
Add a Style Rule
What if you want a particular style rule of any element. You can do so by following the instructions given below:-
- Select an element.
- In the Styles panel, click on New Style Rule + (plus icon).
- it inserts a new style rule just below the element.style.
Toggle a Declaration
To toggle a declaration :-
- Select an element.
- Open the styles panel and search the style rule applied on the element.
- hover over the CSS declaration, and a blue checkbox appears.
- click on it and check and uncheck it to toggle a declaration.
In the above example, I am checking and unchecking the padding declaration.
Change Colors with The Color Picker
Color Picker is a GUI tool provided by DevTools. It is used to change the color value of the CSS declaration, such as color, background-color. To use the Color Picker :-
- Select an element.
- open the styles panel find the style rule with Color value declaration.
- you can see the small square preview of color value on the left side.
- click on it, and it opens the Color Picker Tool.
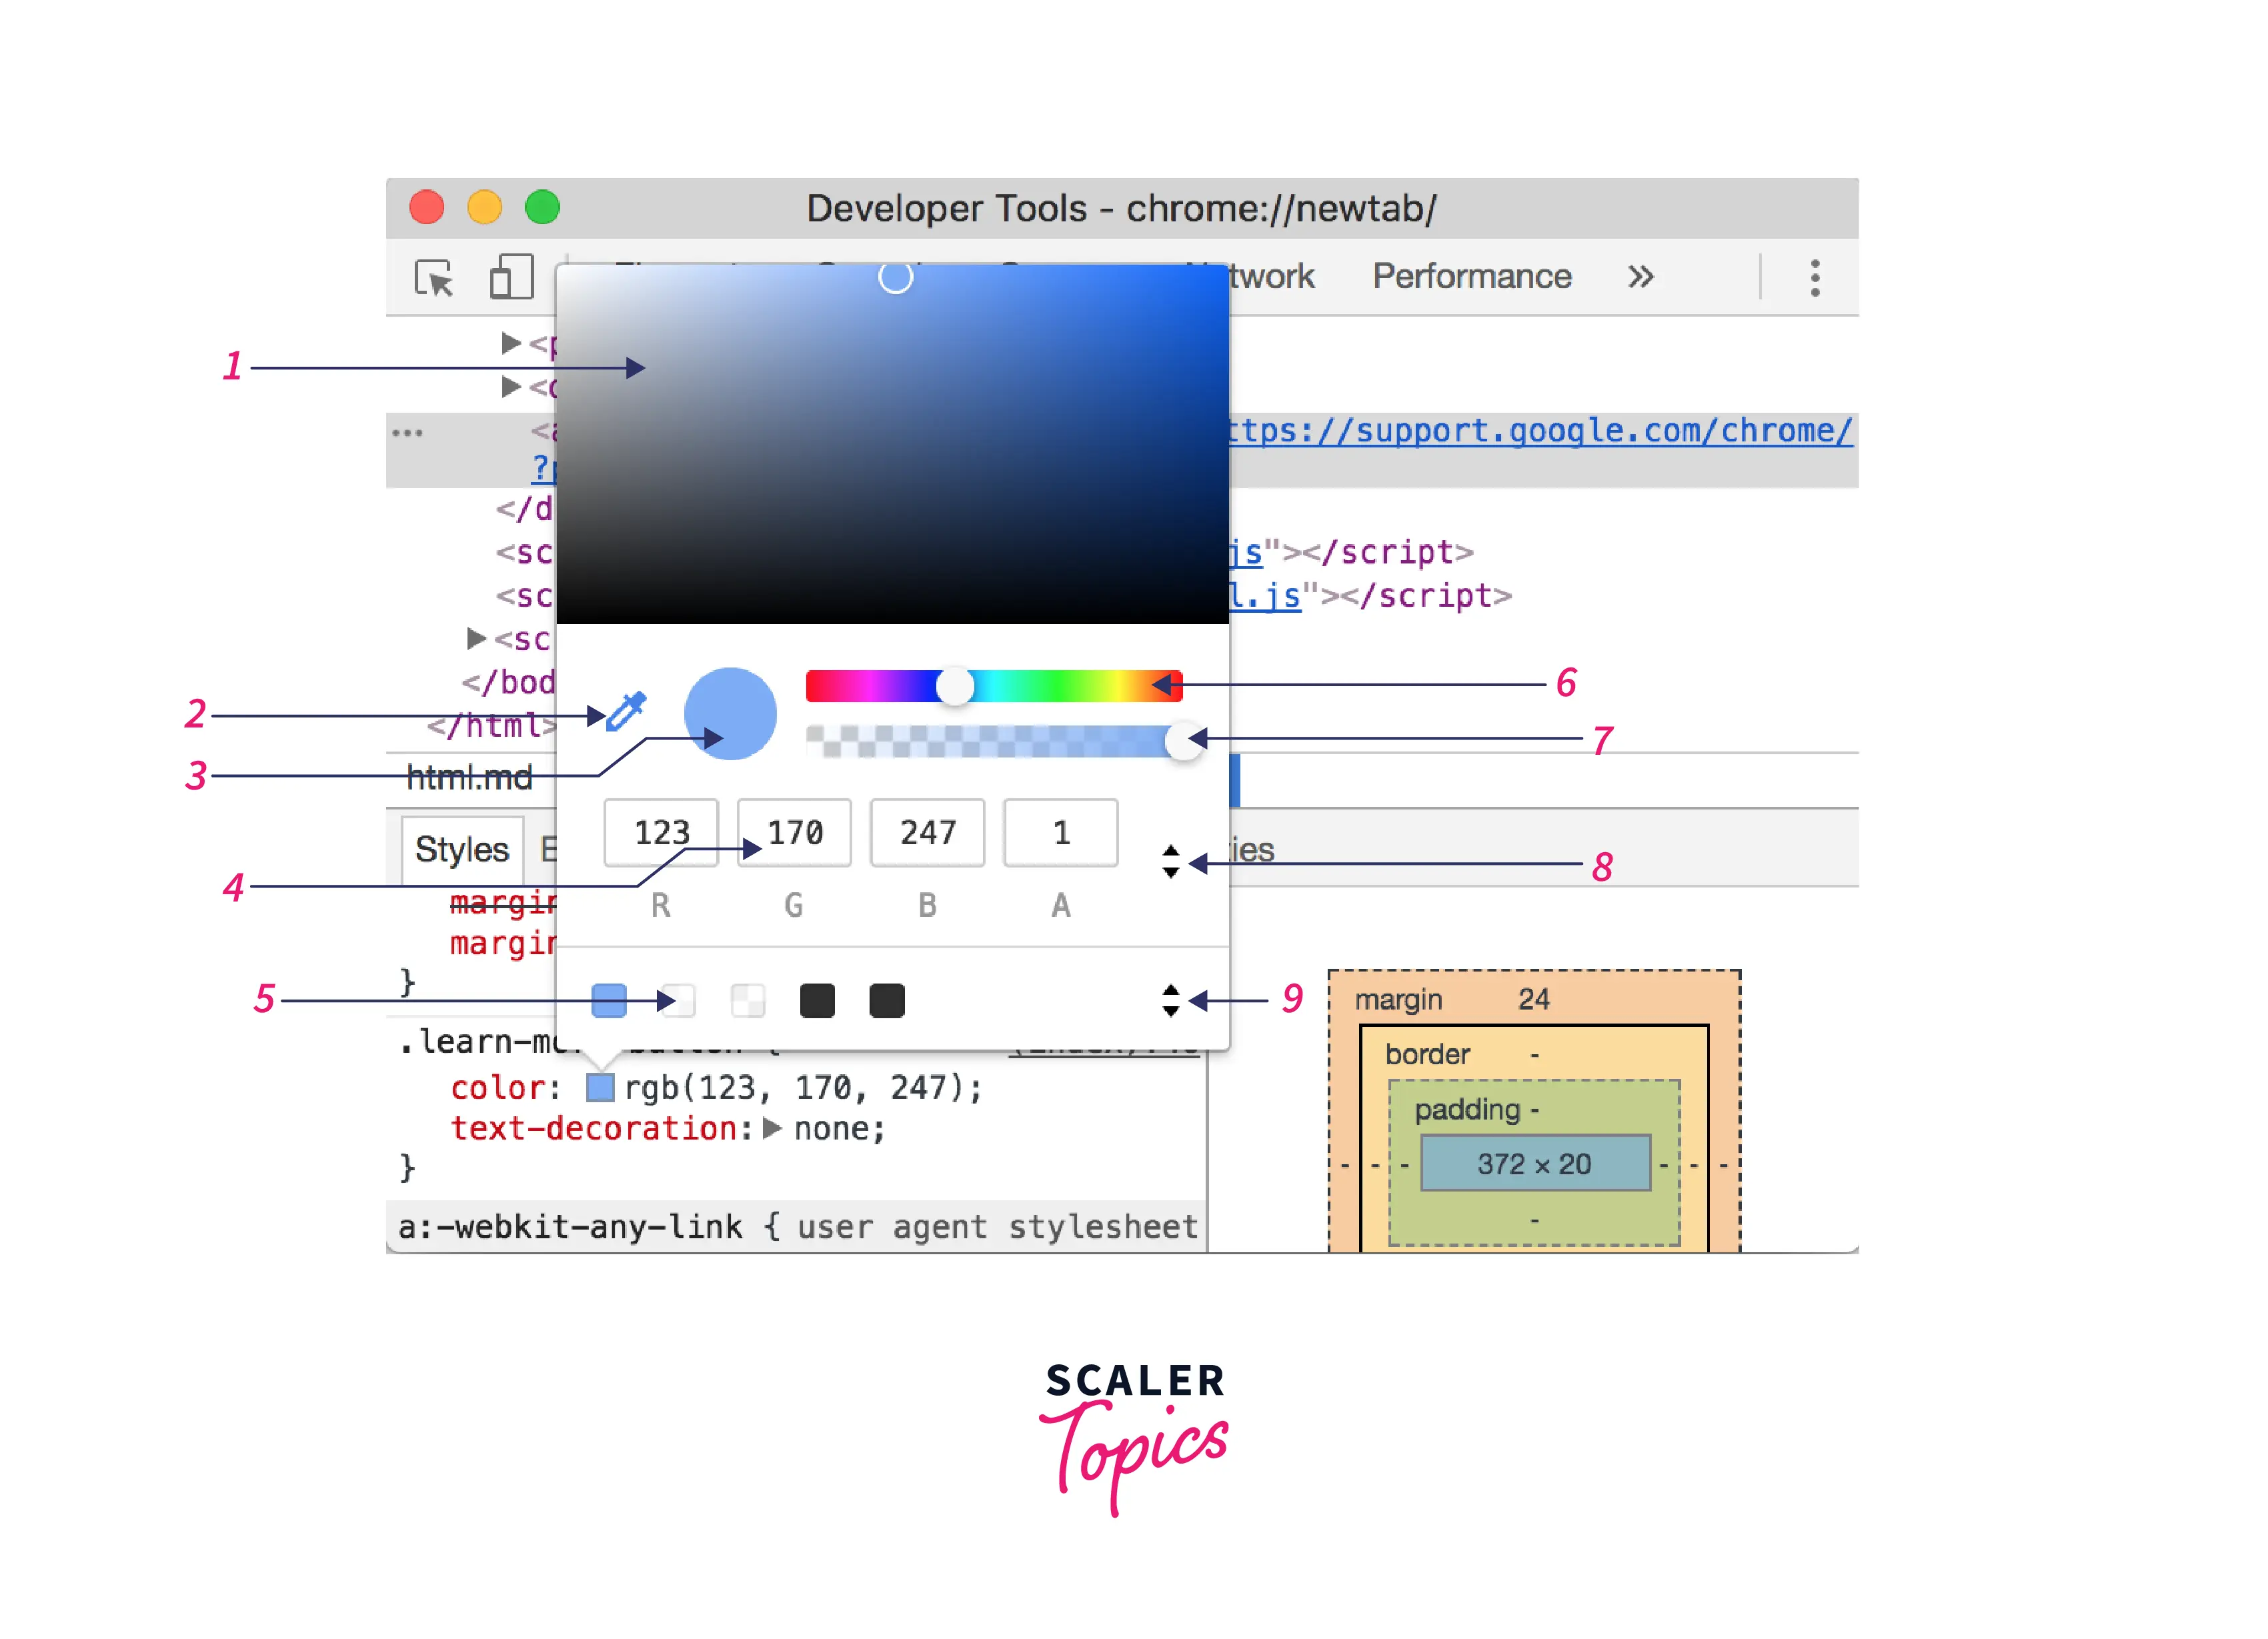
Color picker contains various tools to play with color value. Let's understand each of the UI elements of Color Picker.
- Shades:
It is beneficial to pick the various shades of any color. - Eyedropper:
It's on default when you open the Color Picker, hover over the color you want, and click to select the color. - Copy To Clipboard:
Click and Copy the Color Value to your clipboard. - Display Value:
It represents color in three formats RGBA, HSLA, and Hex - Color Palette:
You can use any one of these by clicking on that square. - Hue:
It is Used to manage Hue of Color. - Opacity:
You can change the opacity of the color. - Display Value Switcher:
Toggle between the current color's Hex, HSLA, and RGBA representations. - Color Palette Switcher:
it is used to Toggle between the Design Palette, Custom Palette, or Page Color Palette. DevTools generates a page color palette based on the colors encountered in your stylesheet.
Change Angle Value with the Angle Clock
The Angle Clock is another impressive GUI provided by DevTools. It is used to change the angle values of CSS declarations. To change the angle value with the help of the angle clock, follow the below instructions :-
- Select an element.
- open the styles panel find the style rule with angle value declaration.
- you can see the Small Clock Preview of angle value on the left side.
- click on it, and it opens the Angle Clock Tool.
- Change the angle value of the declaration by clicking on the angle clock.
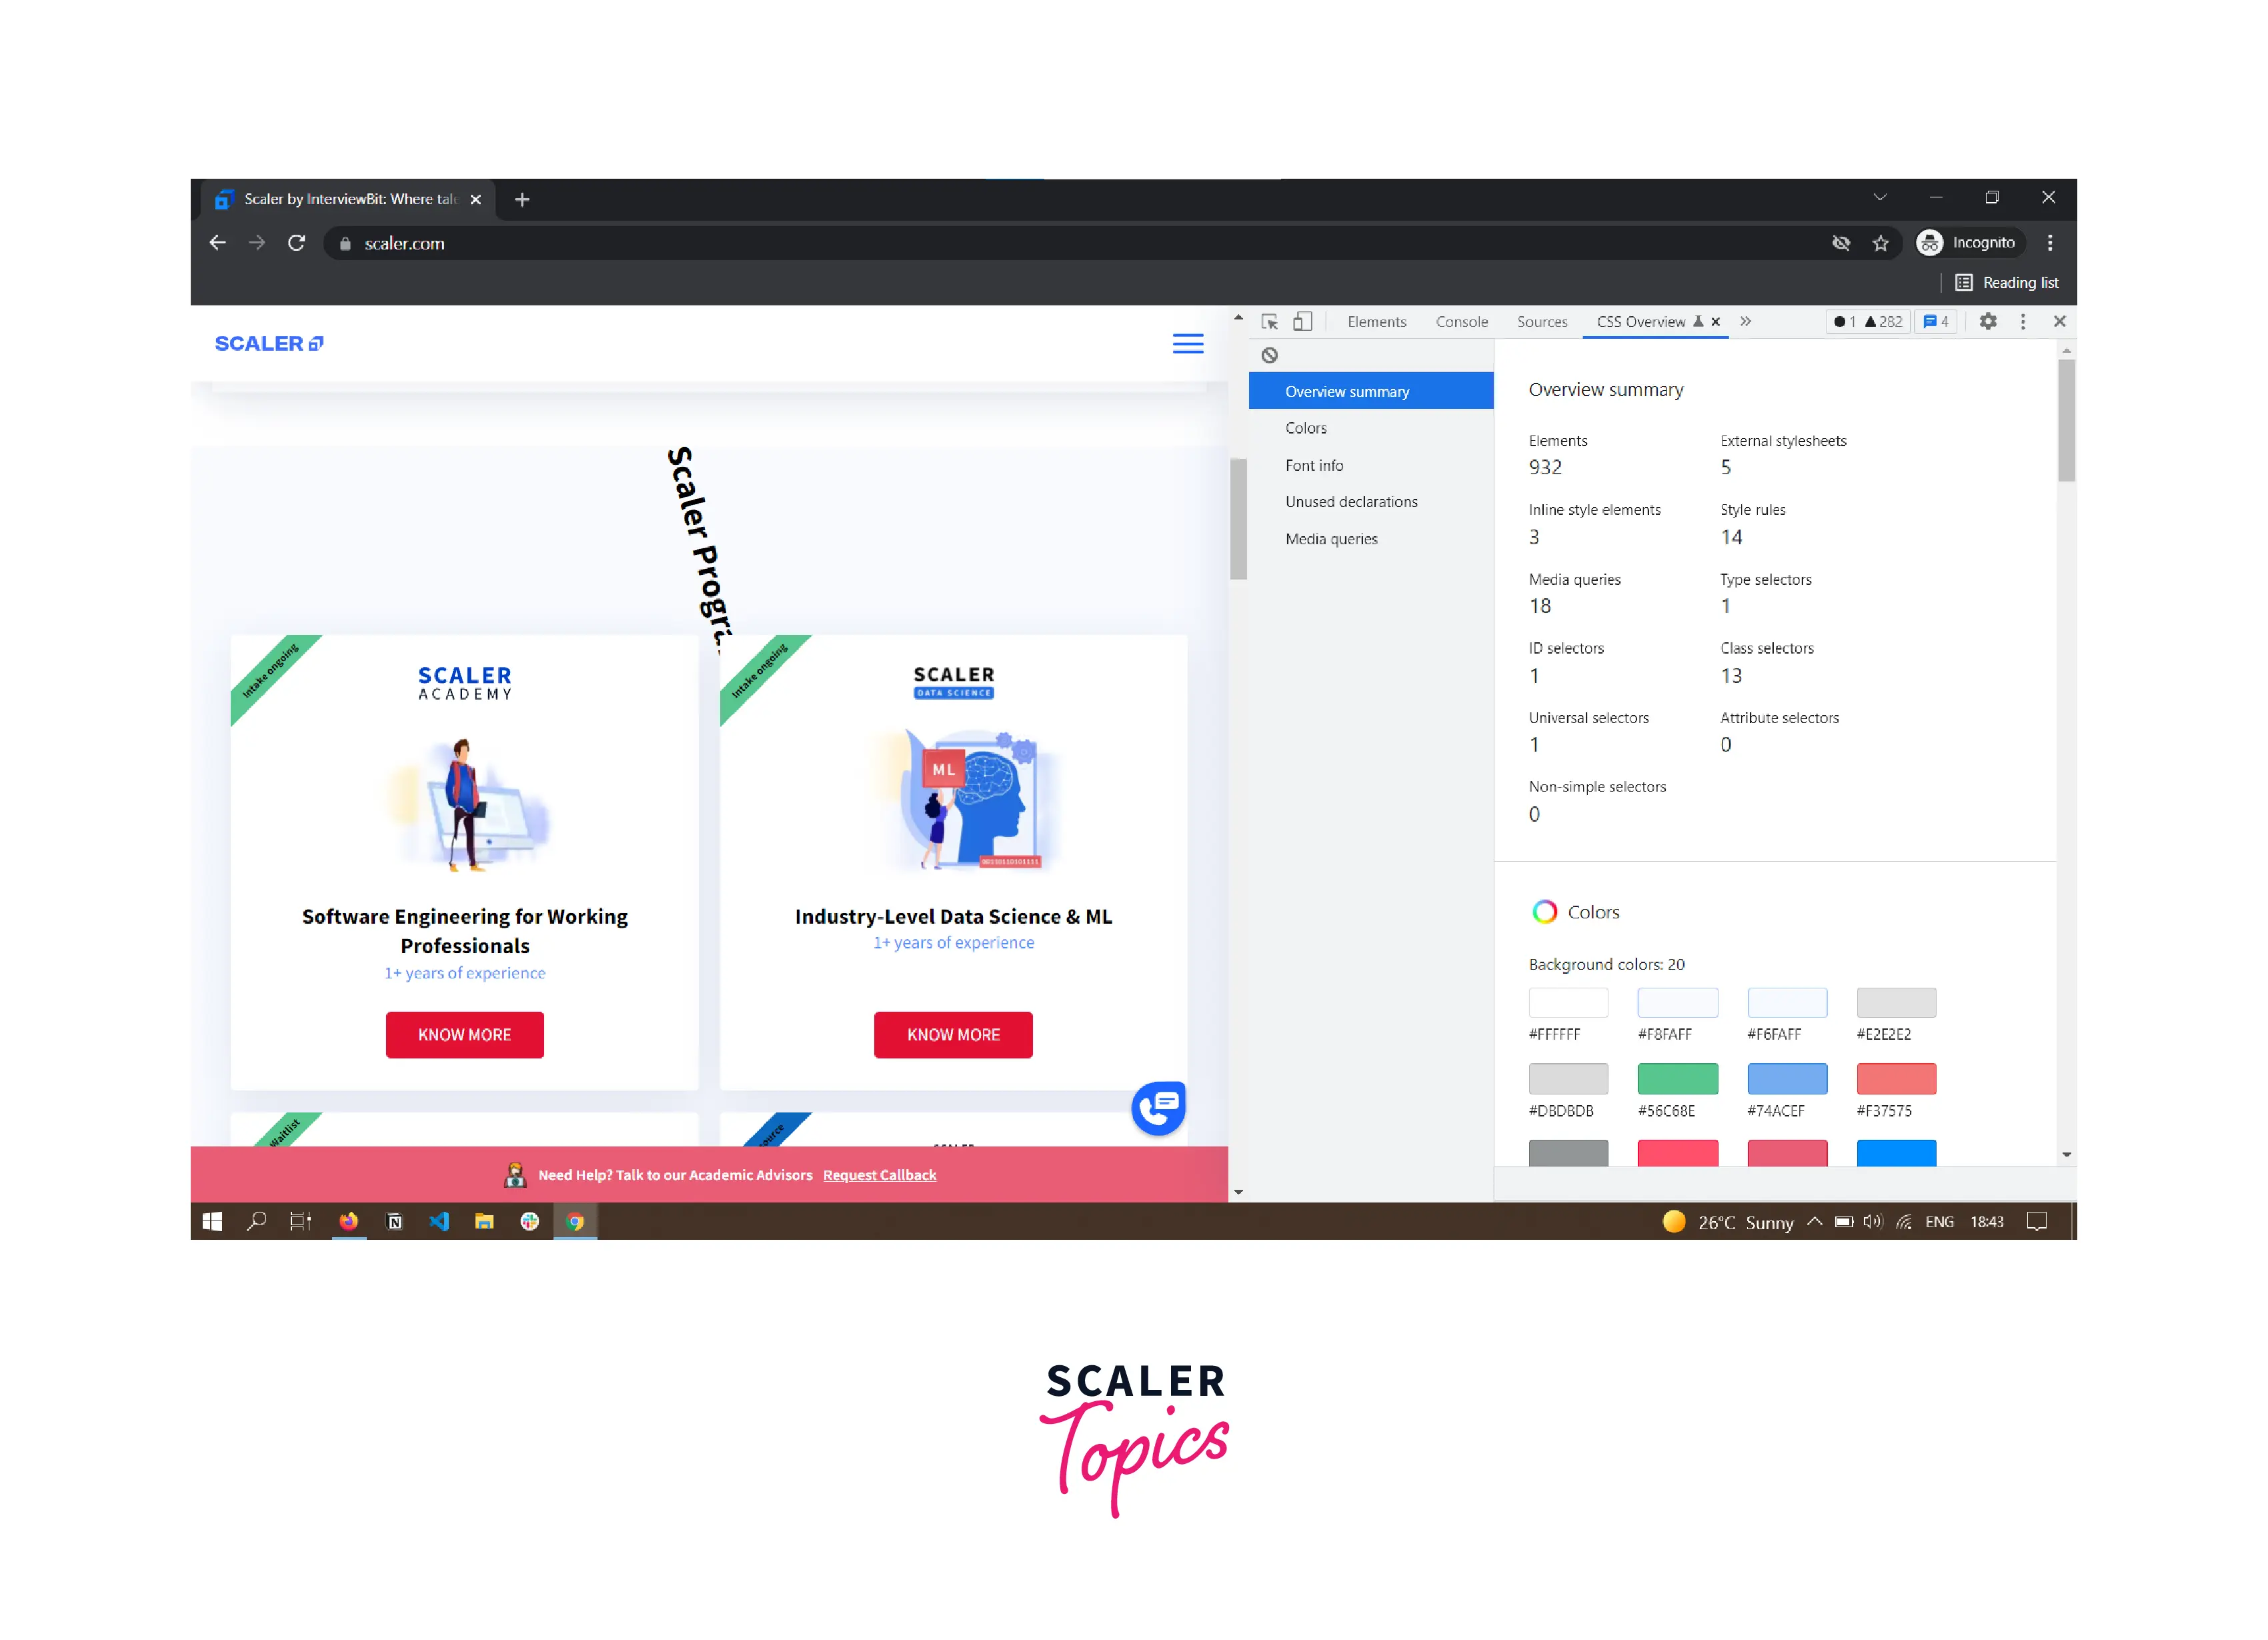
CSS Overview Panel
The CSS overview panel is an impressive tool provided by DevTools. It scans the page CSS styles, identifies potential improvements, and shows a detailed page overview.
The summary contains detailed information about Elements and style rules, colors, fonts, unused CSS, and media queries.
Open the CSS Overview Panel
Open DevTools on the target page to open the CSS overview panel.
There are two ways to open CSS Overview Panel -
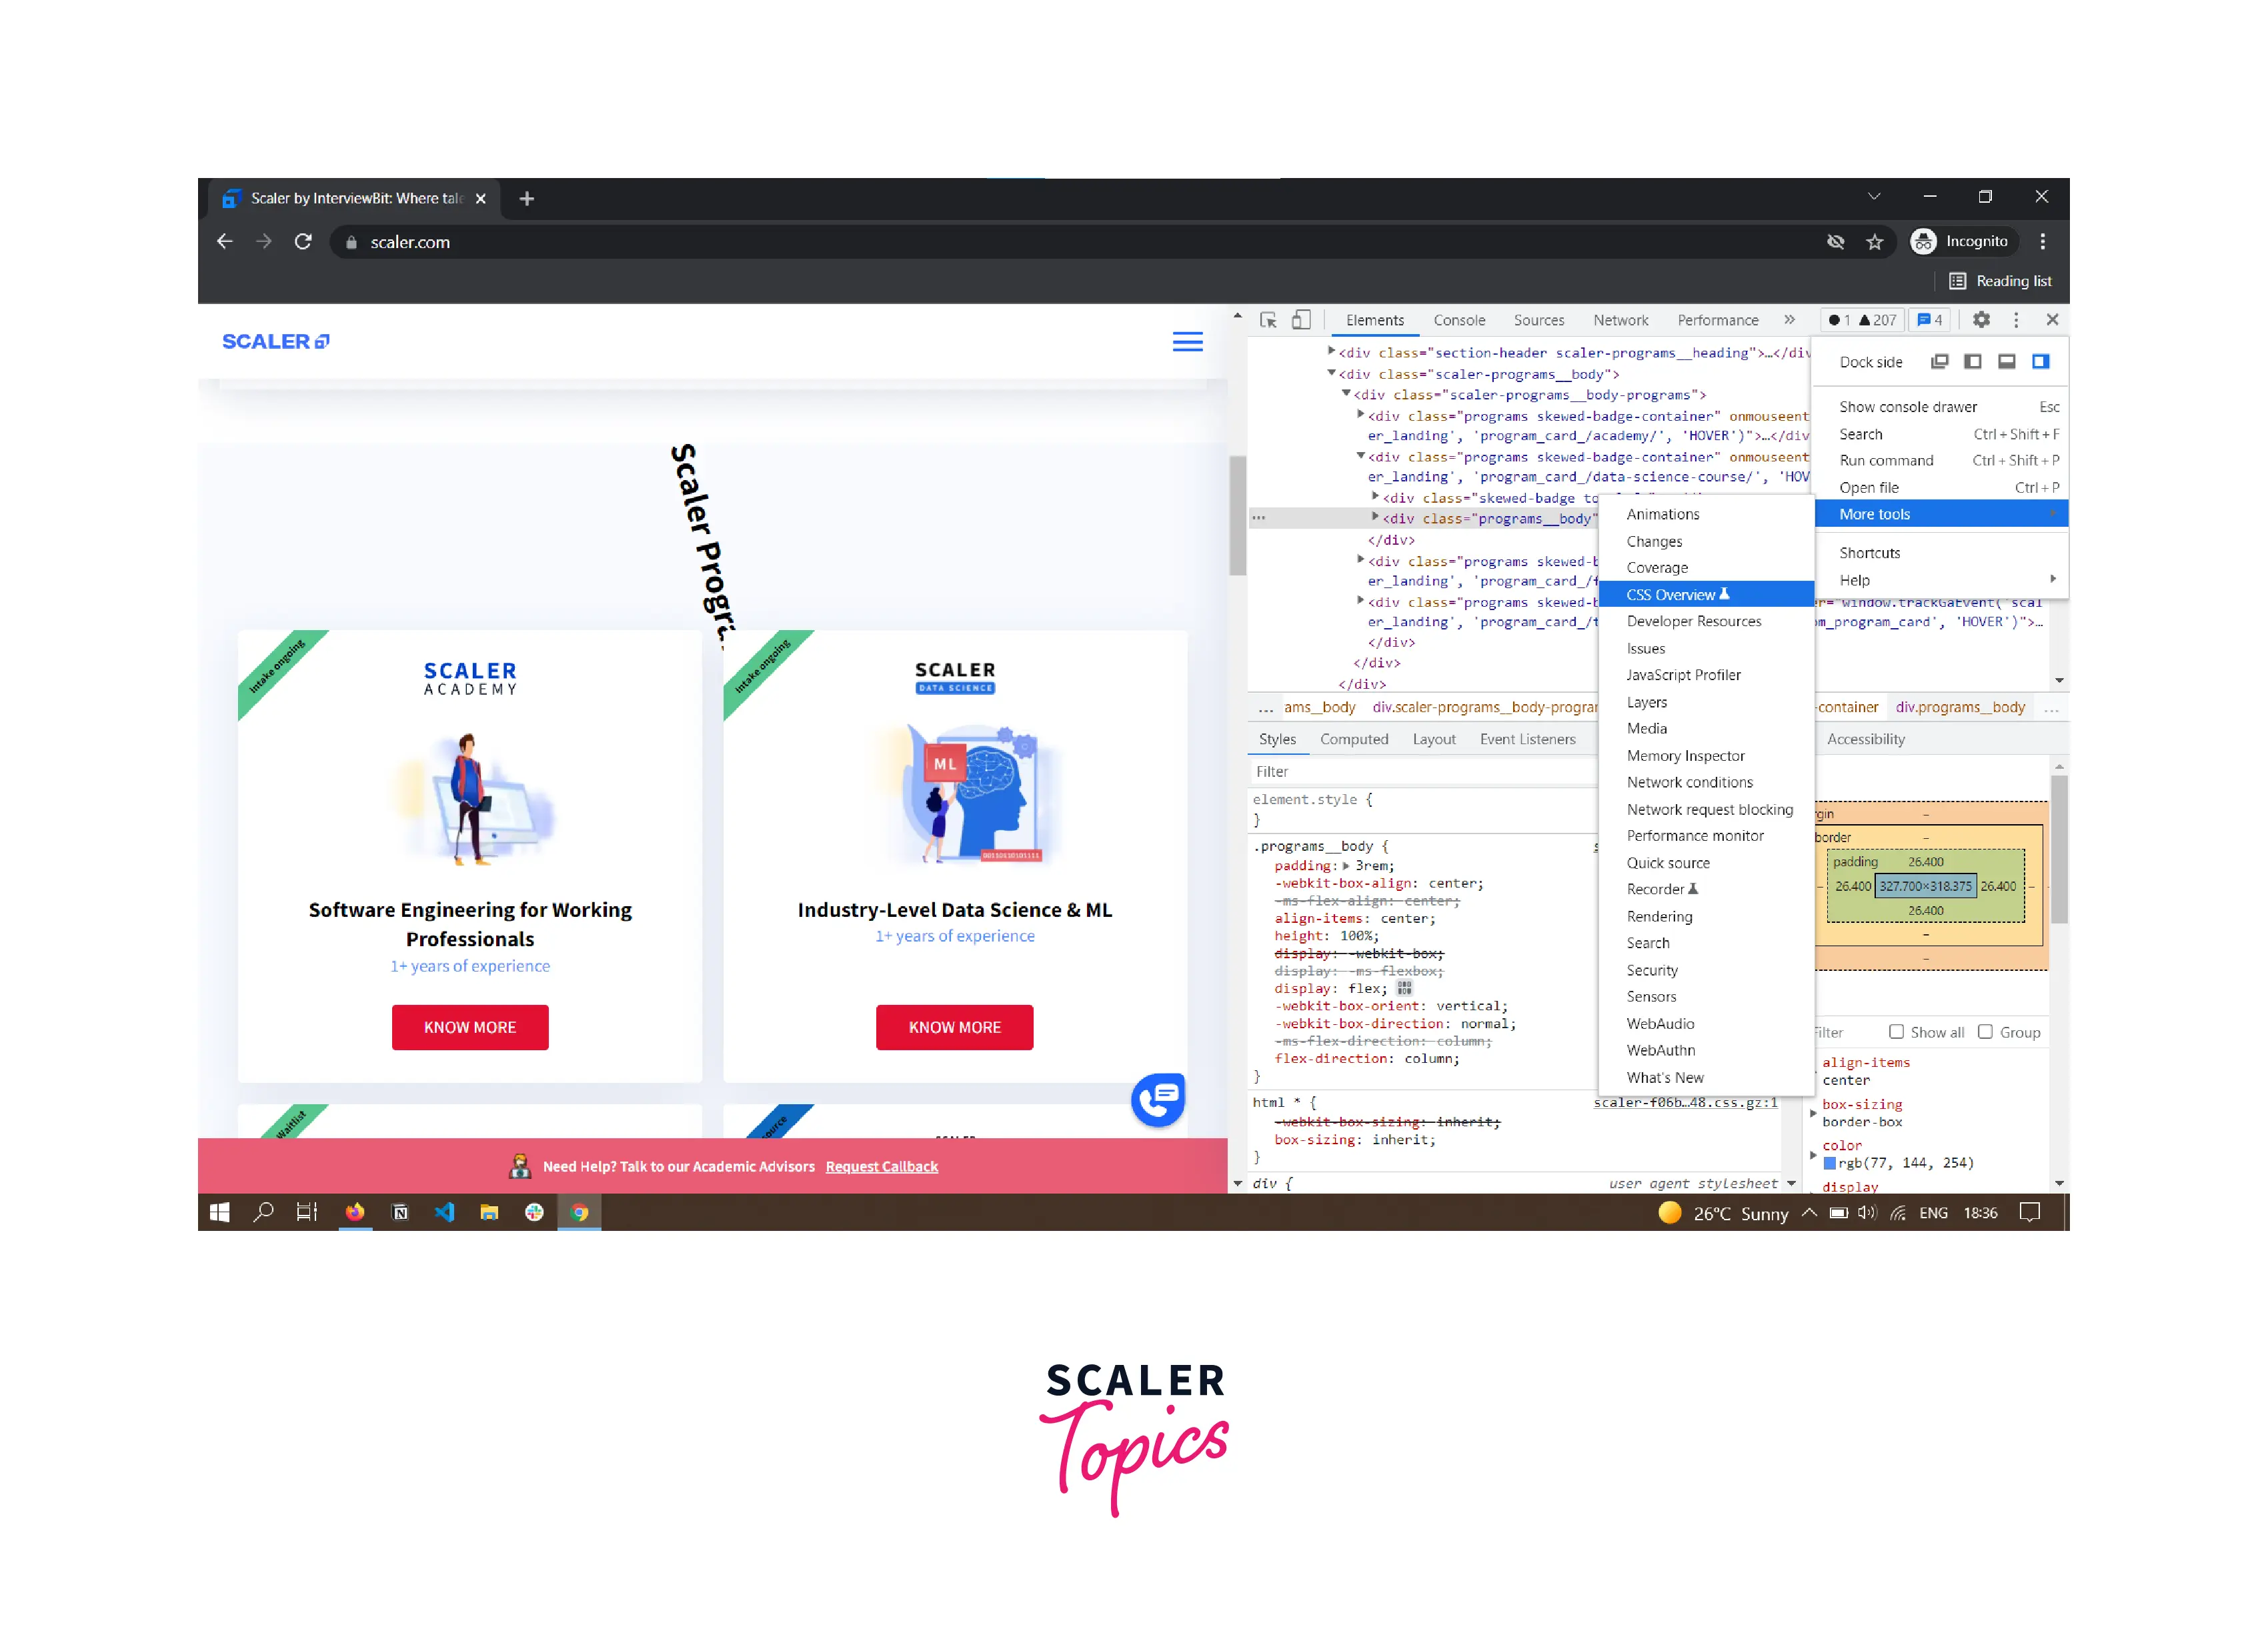
- Click on More options or Three Dots > More tools > CSS Overview.
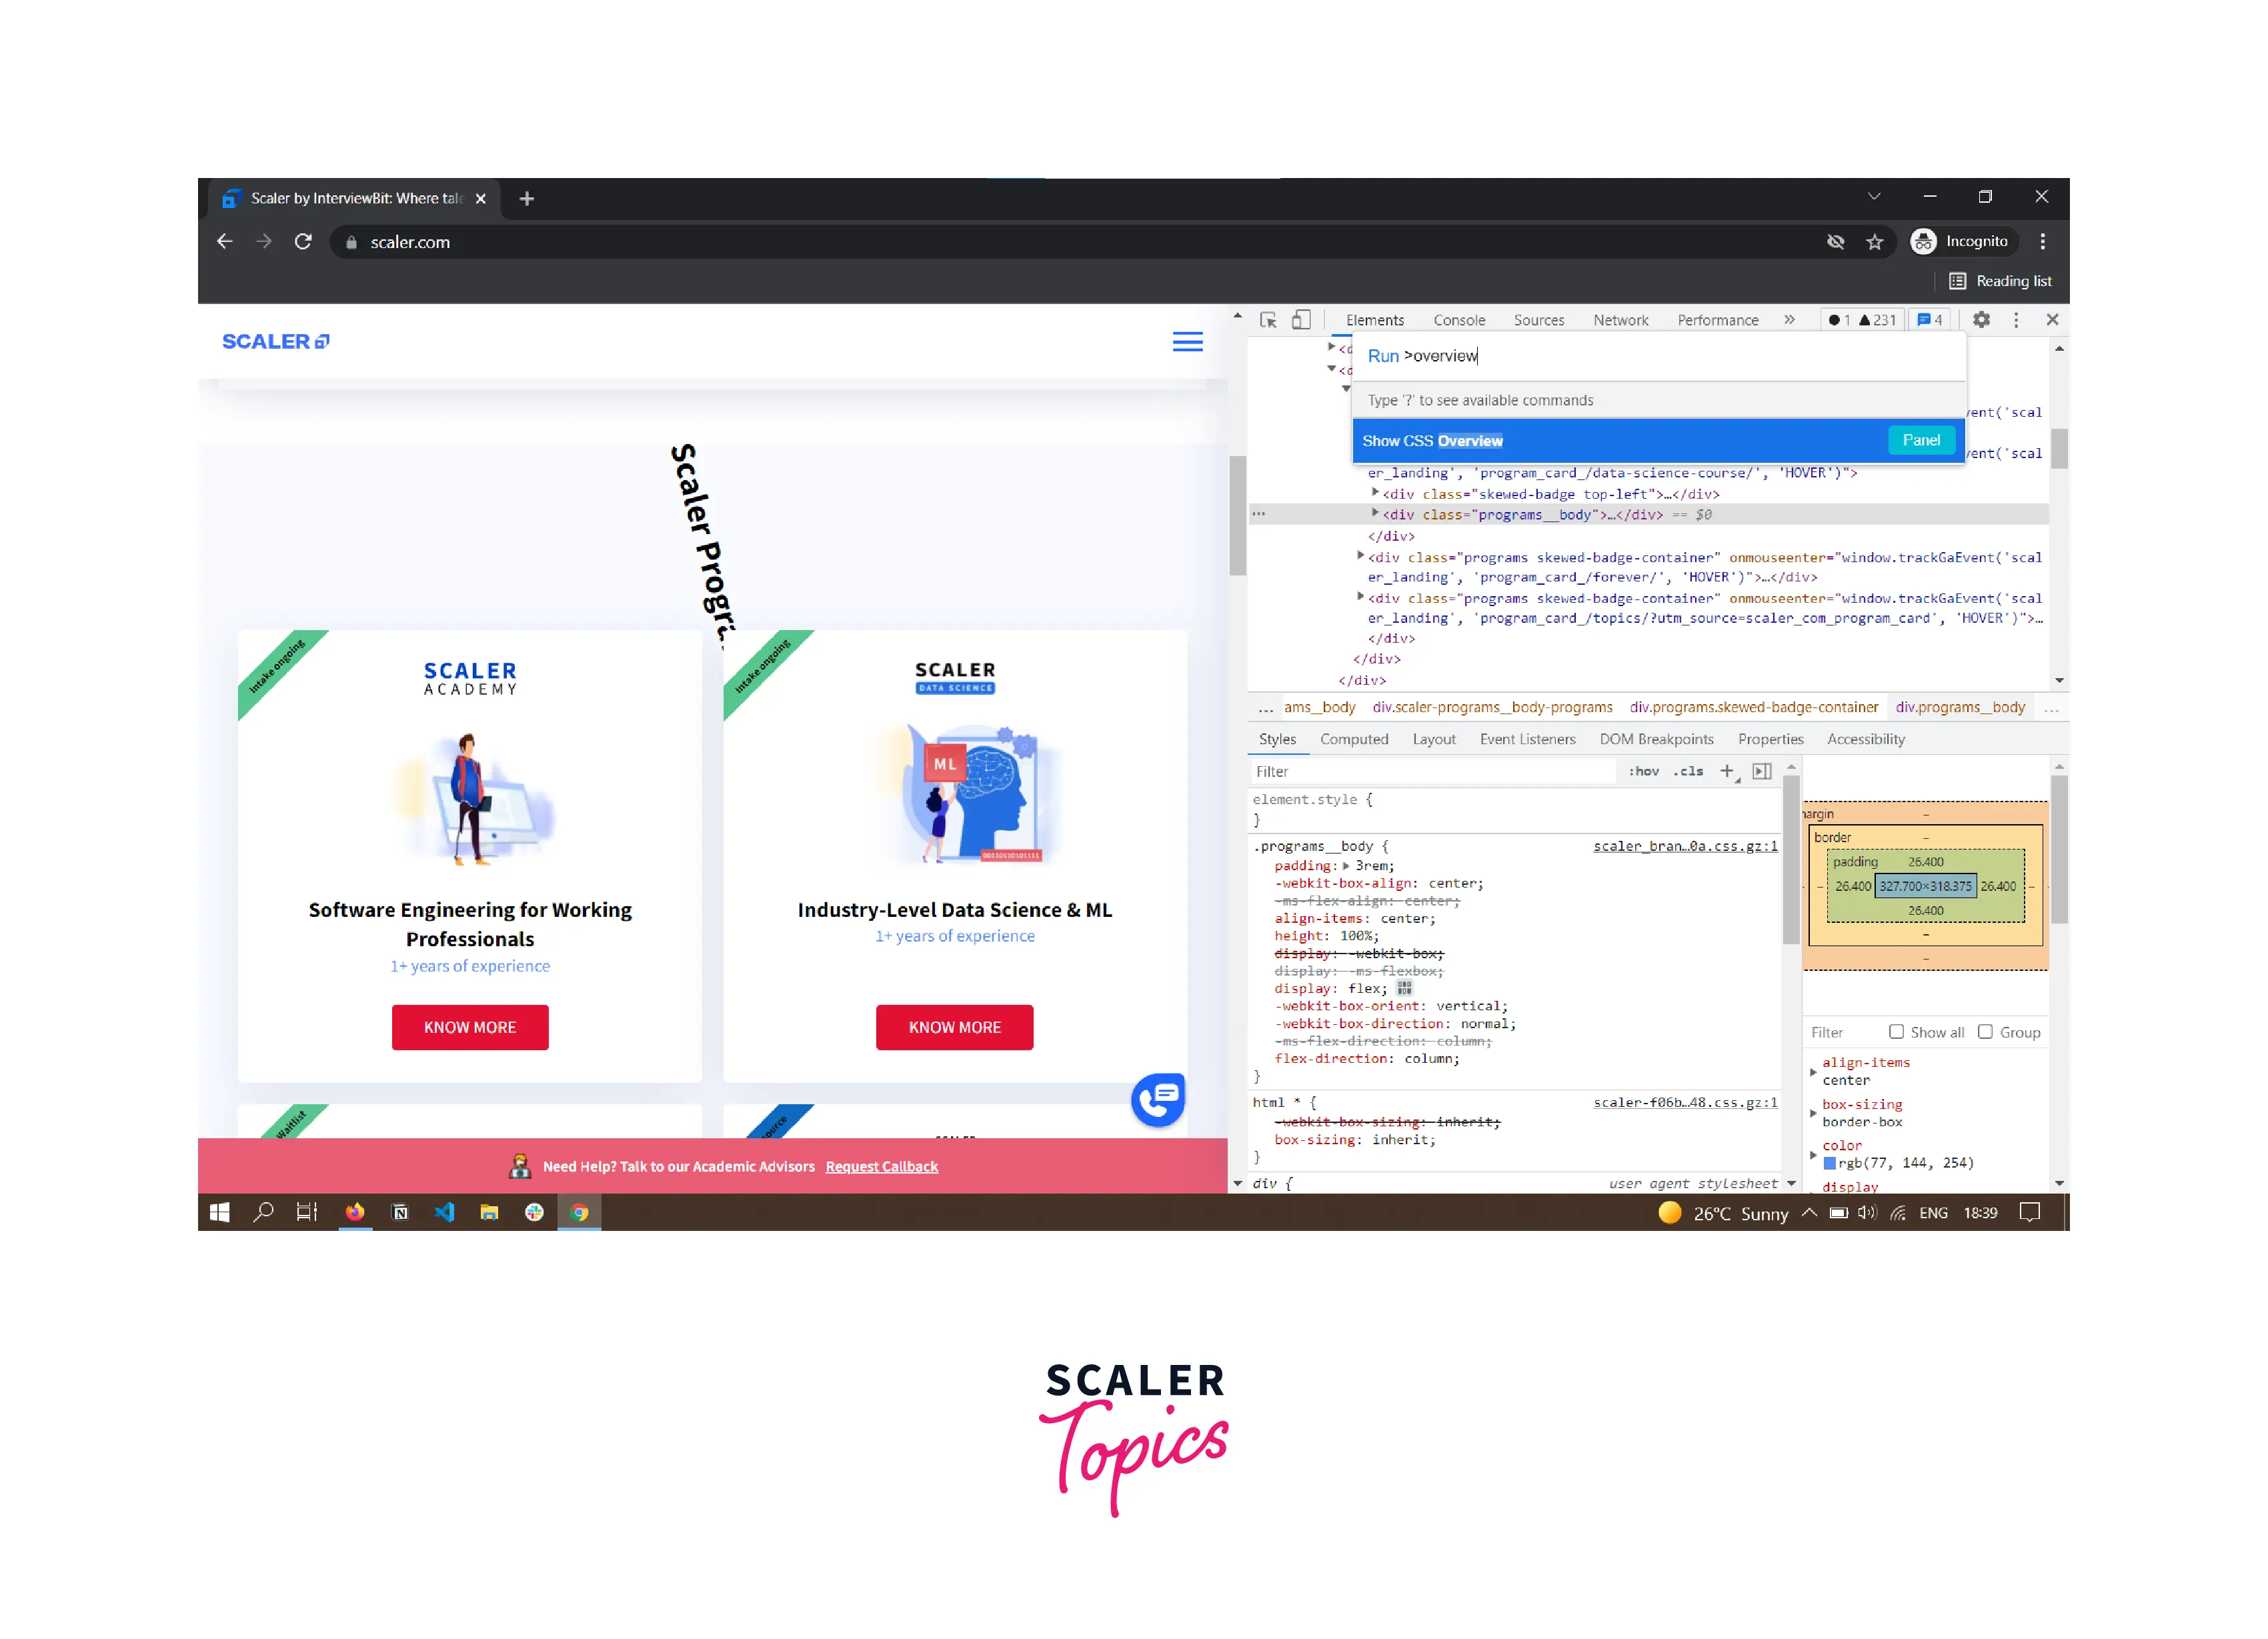
- Alternatively, open the command menu and type Overview, and click on show CSS Overview.
Run and re-run a CSS Overview Report
To Re-run the CSS Overview Panel :-
- To identify potential CSS improvements, you need to run the CSS Overview panel. Click on Capture Overview to run the tool.
- To clear the panel or Re-run the CSS overview tool, you have to click on clear icon on the left side, again follow the first step to re-run the tool.
Understand the CSS Overview Report
CSS Overview report contains several sections, and each section contains a detailed report of your website CSS. Let's go through each section in deep:-
- Overview summary:
It contains a high-level summary of the whole page, including total elements, selectors, style rules, external stylesheets, etc.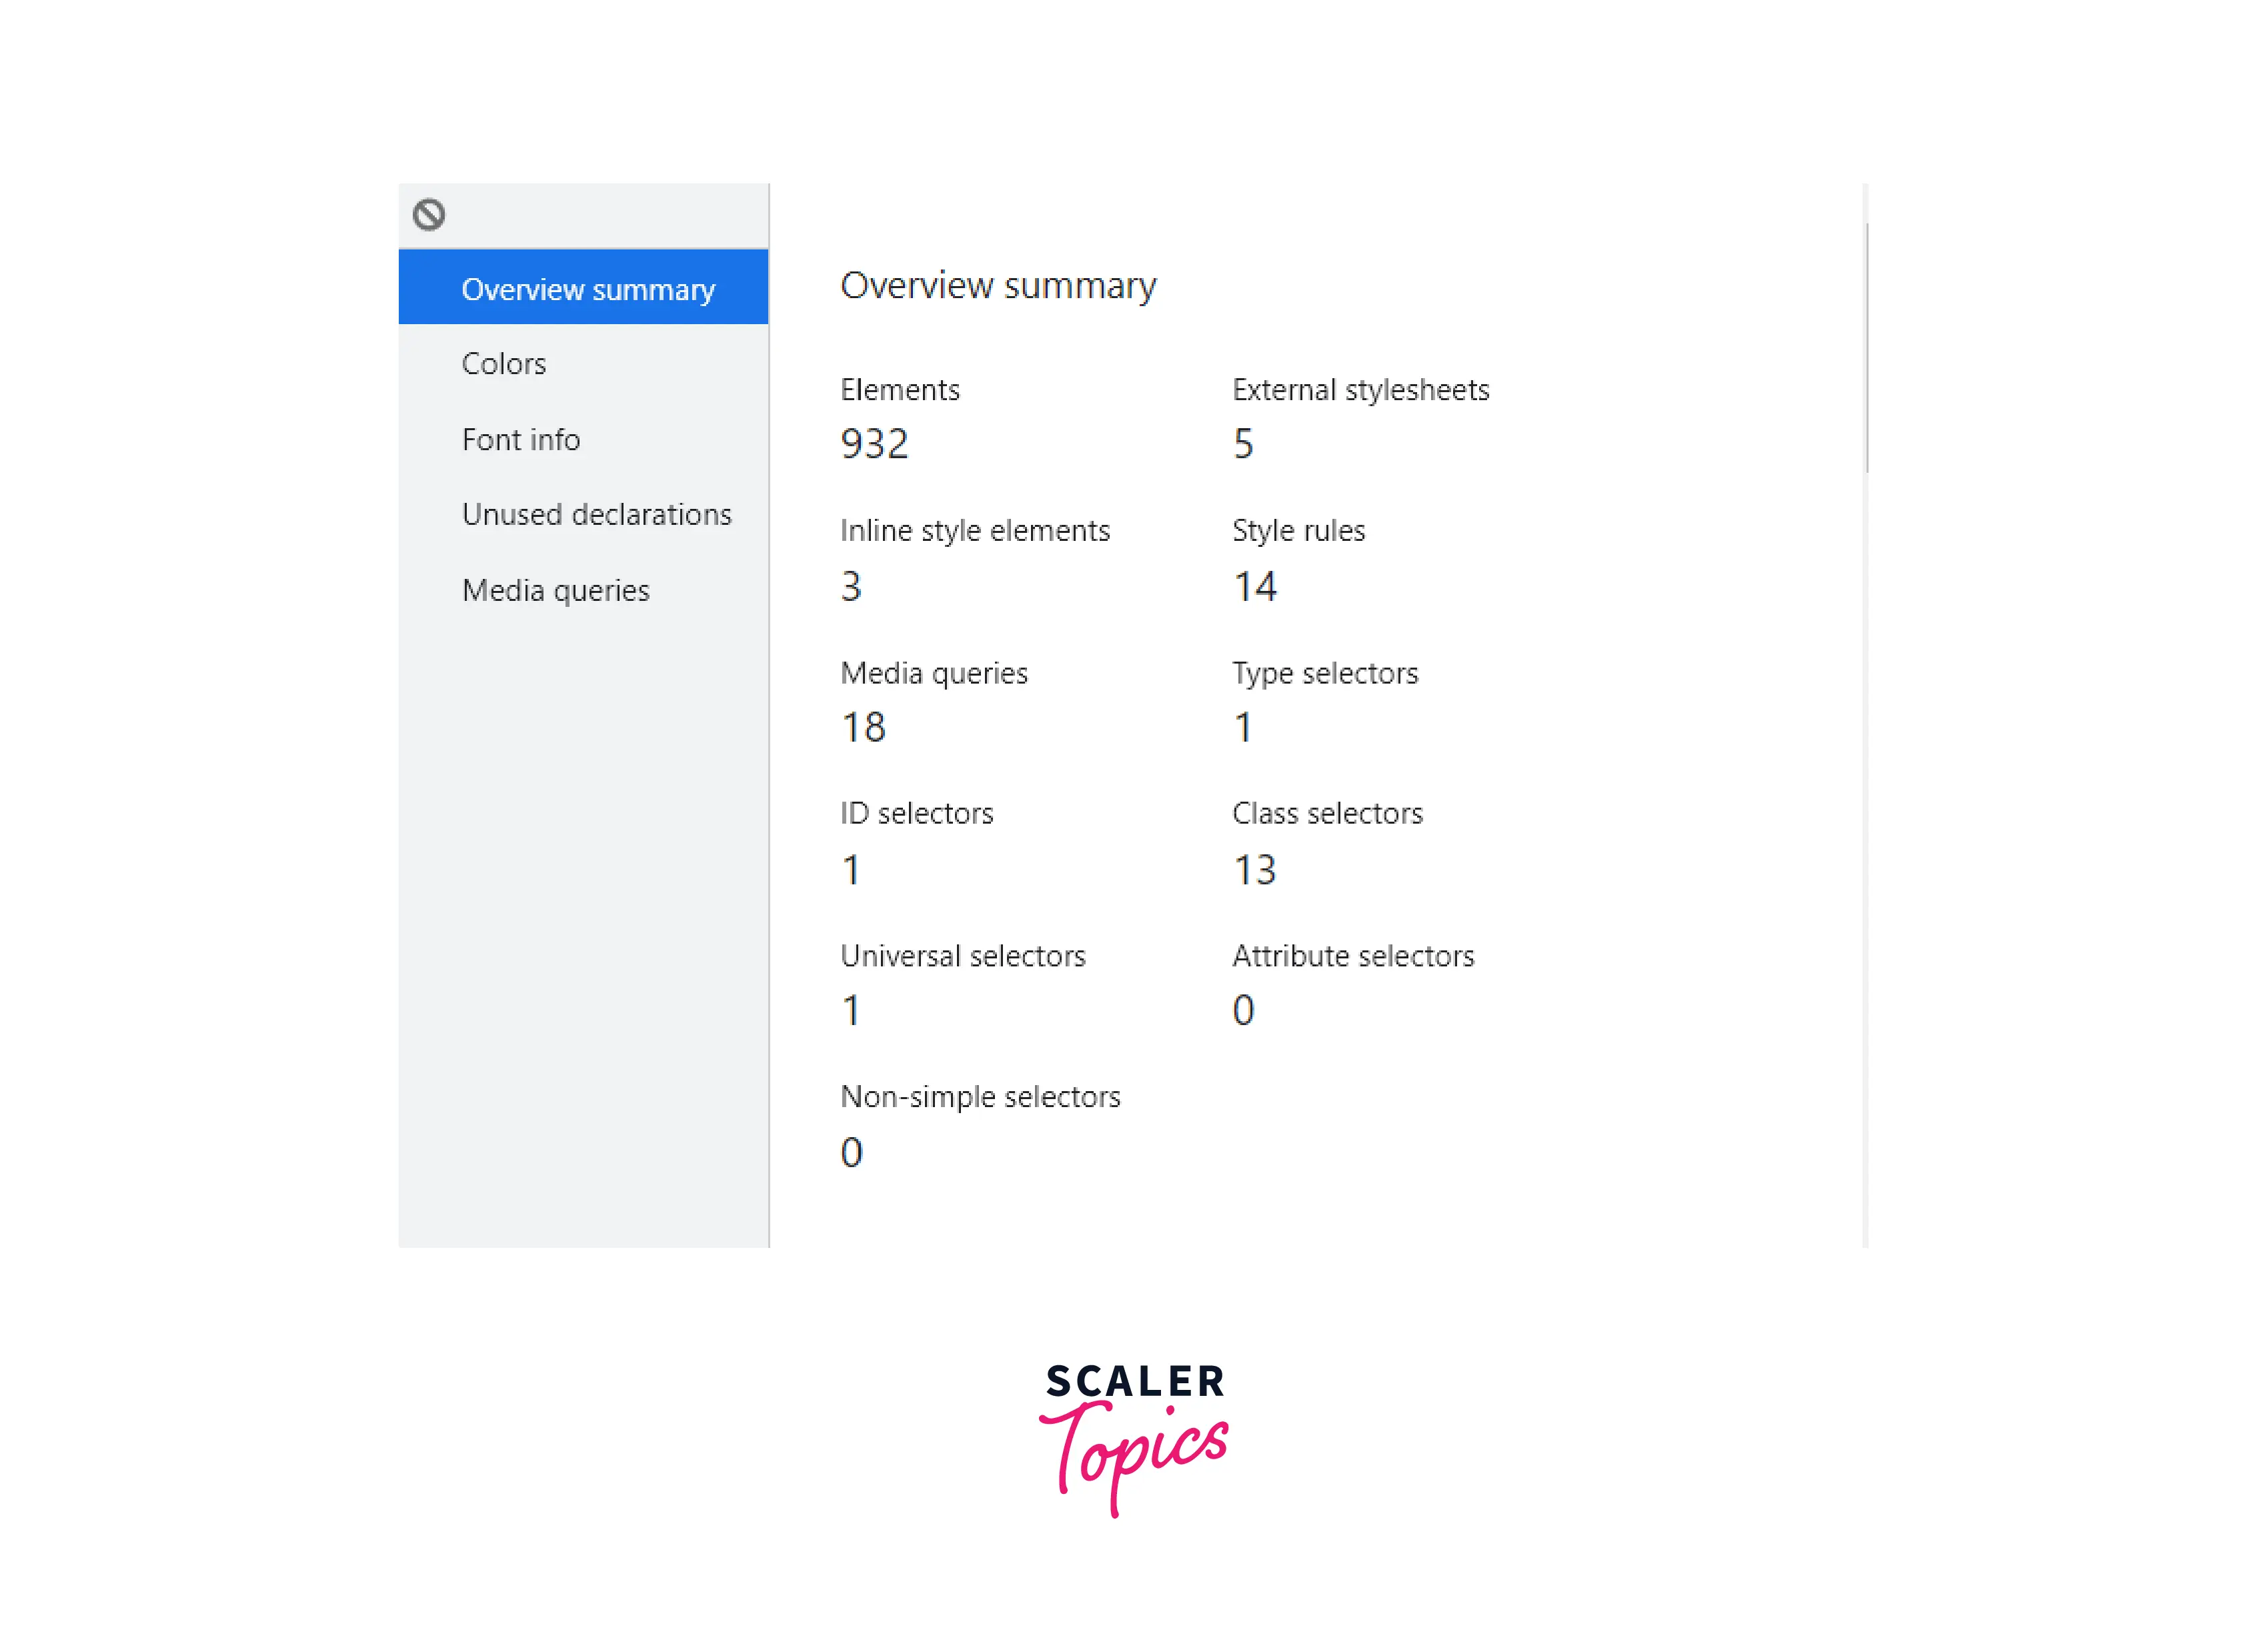
- Colors:
This section contains all the colors used on the page. All the Colors are grouped by usage such as background color, text color, border color, fill color, etc. It also shows you text that has less contrast issues.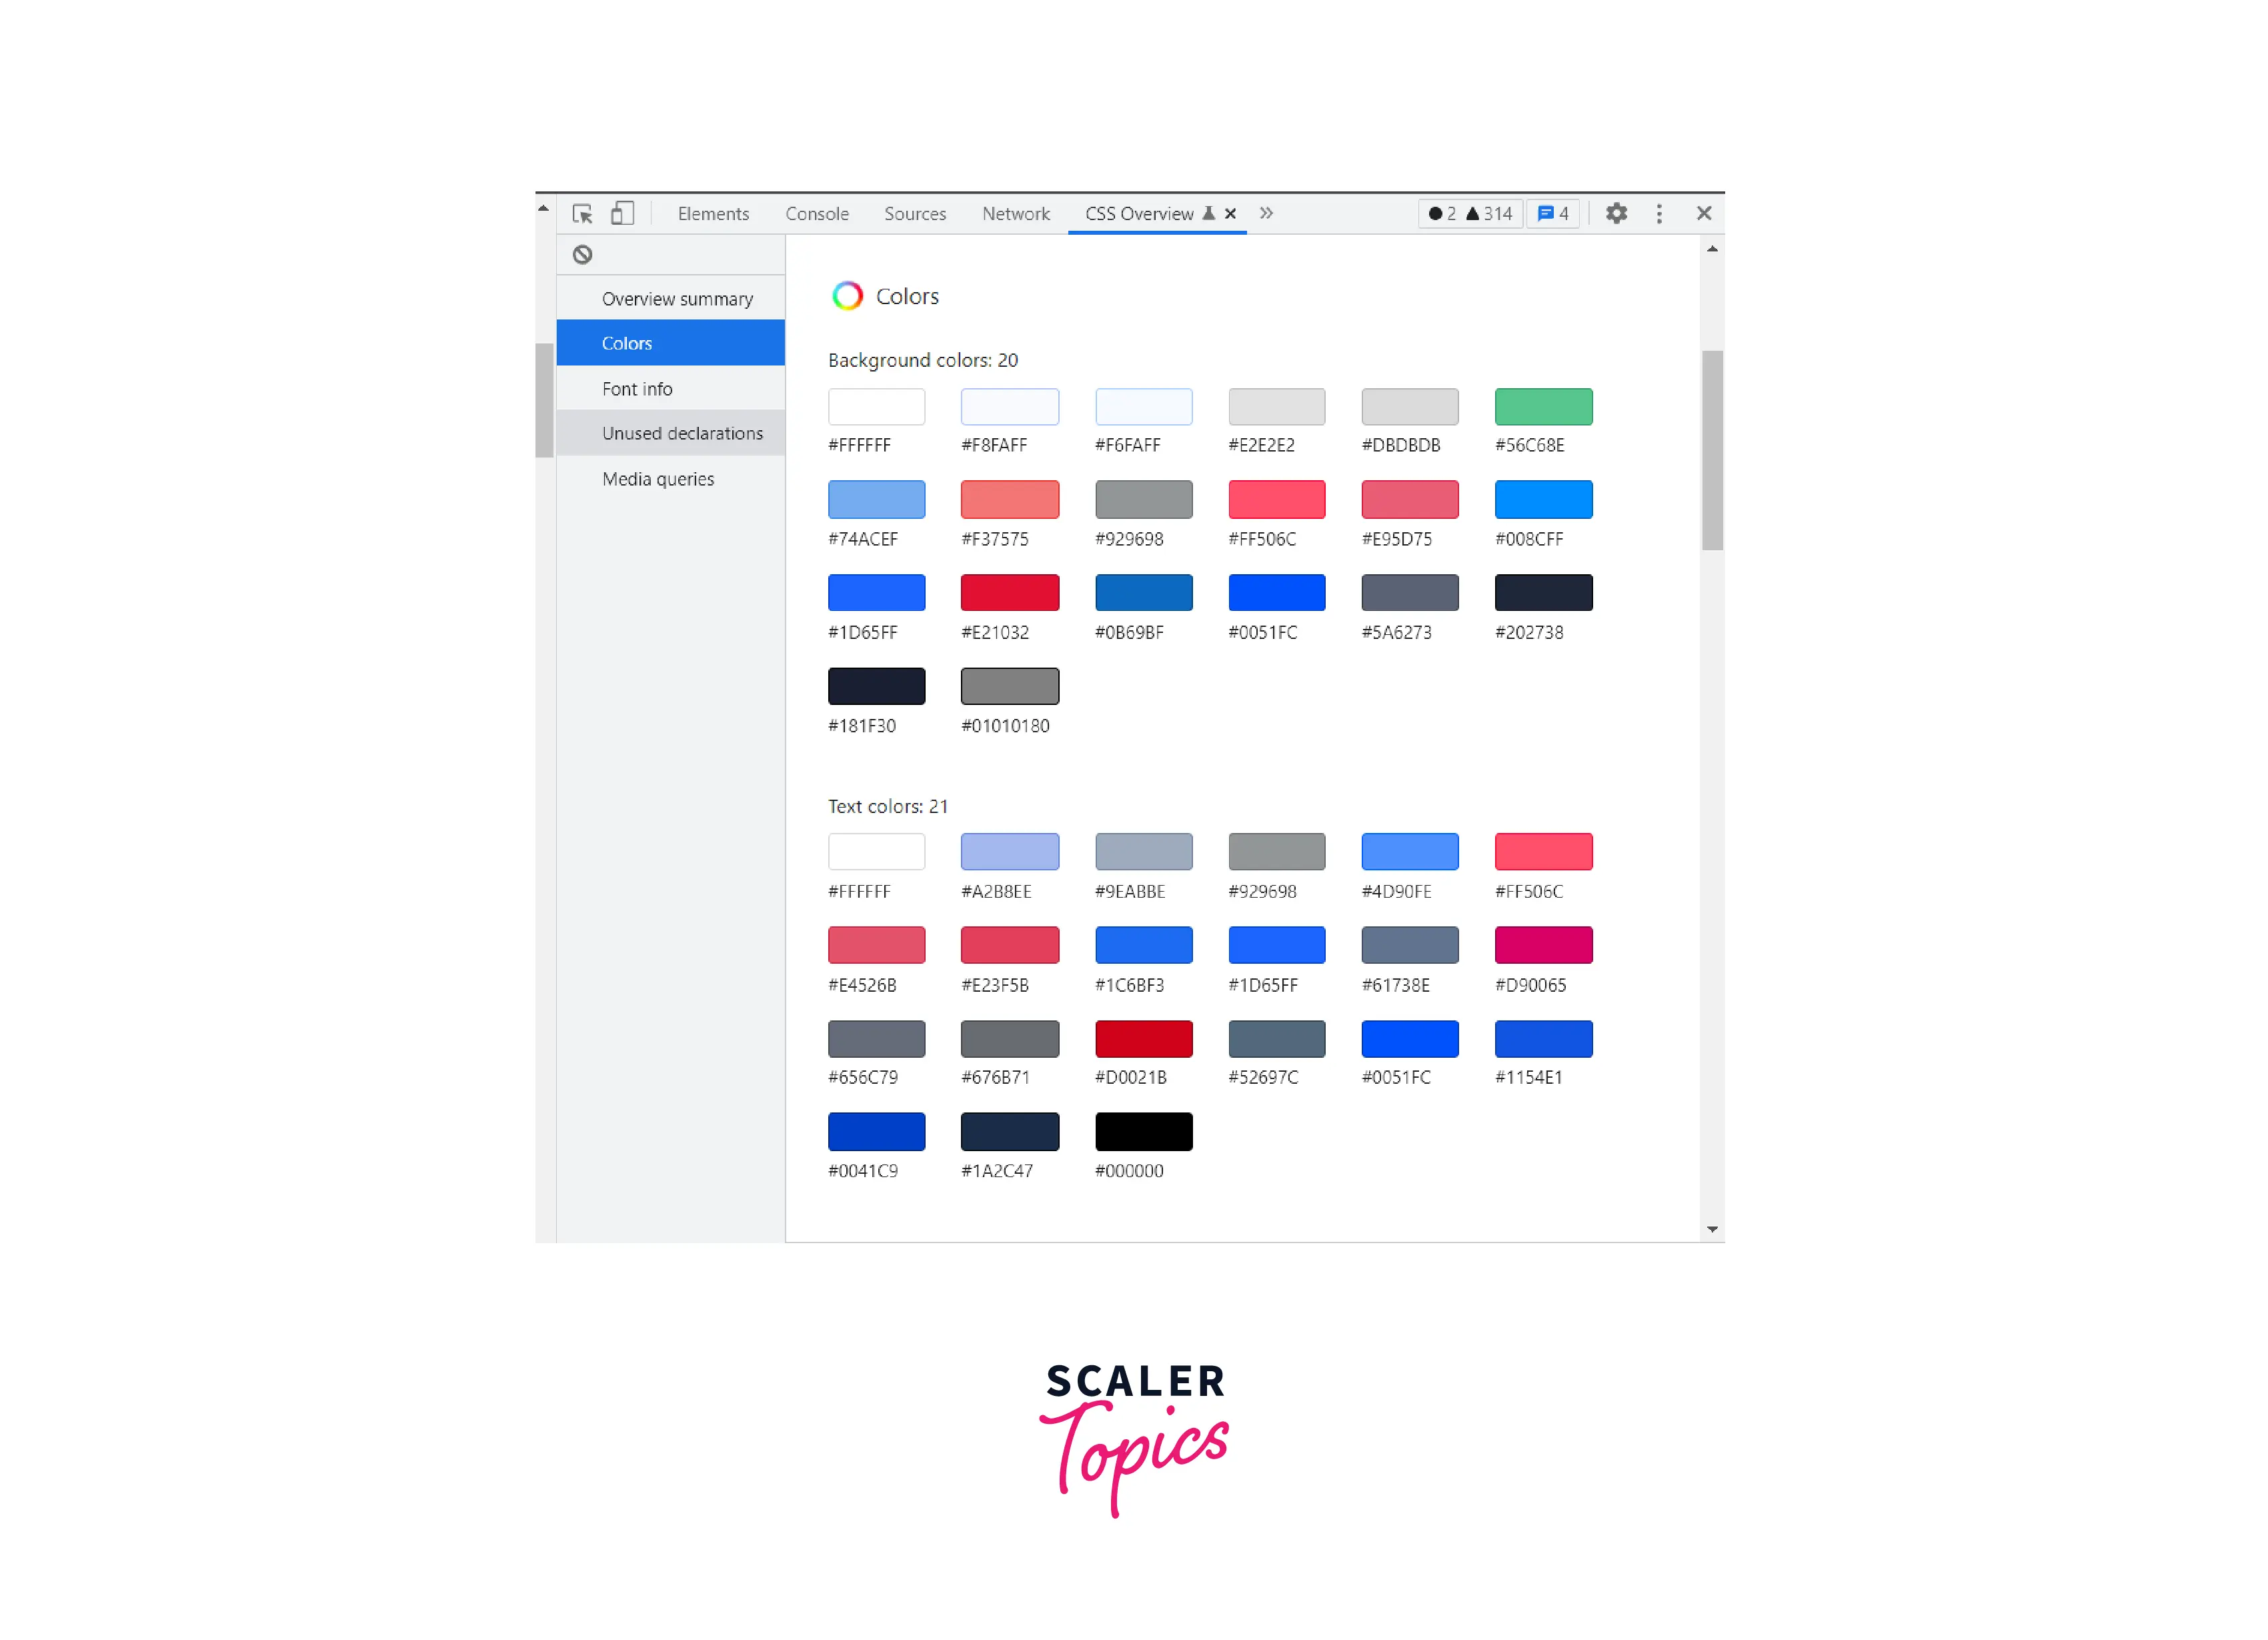 All the shown color are clickable, and when you click on anyone, it shows a list of elements that uses that color.
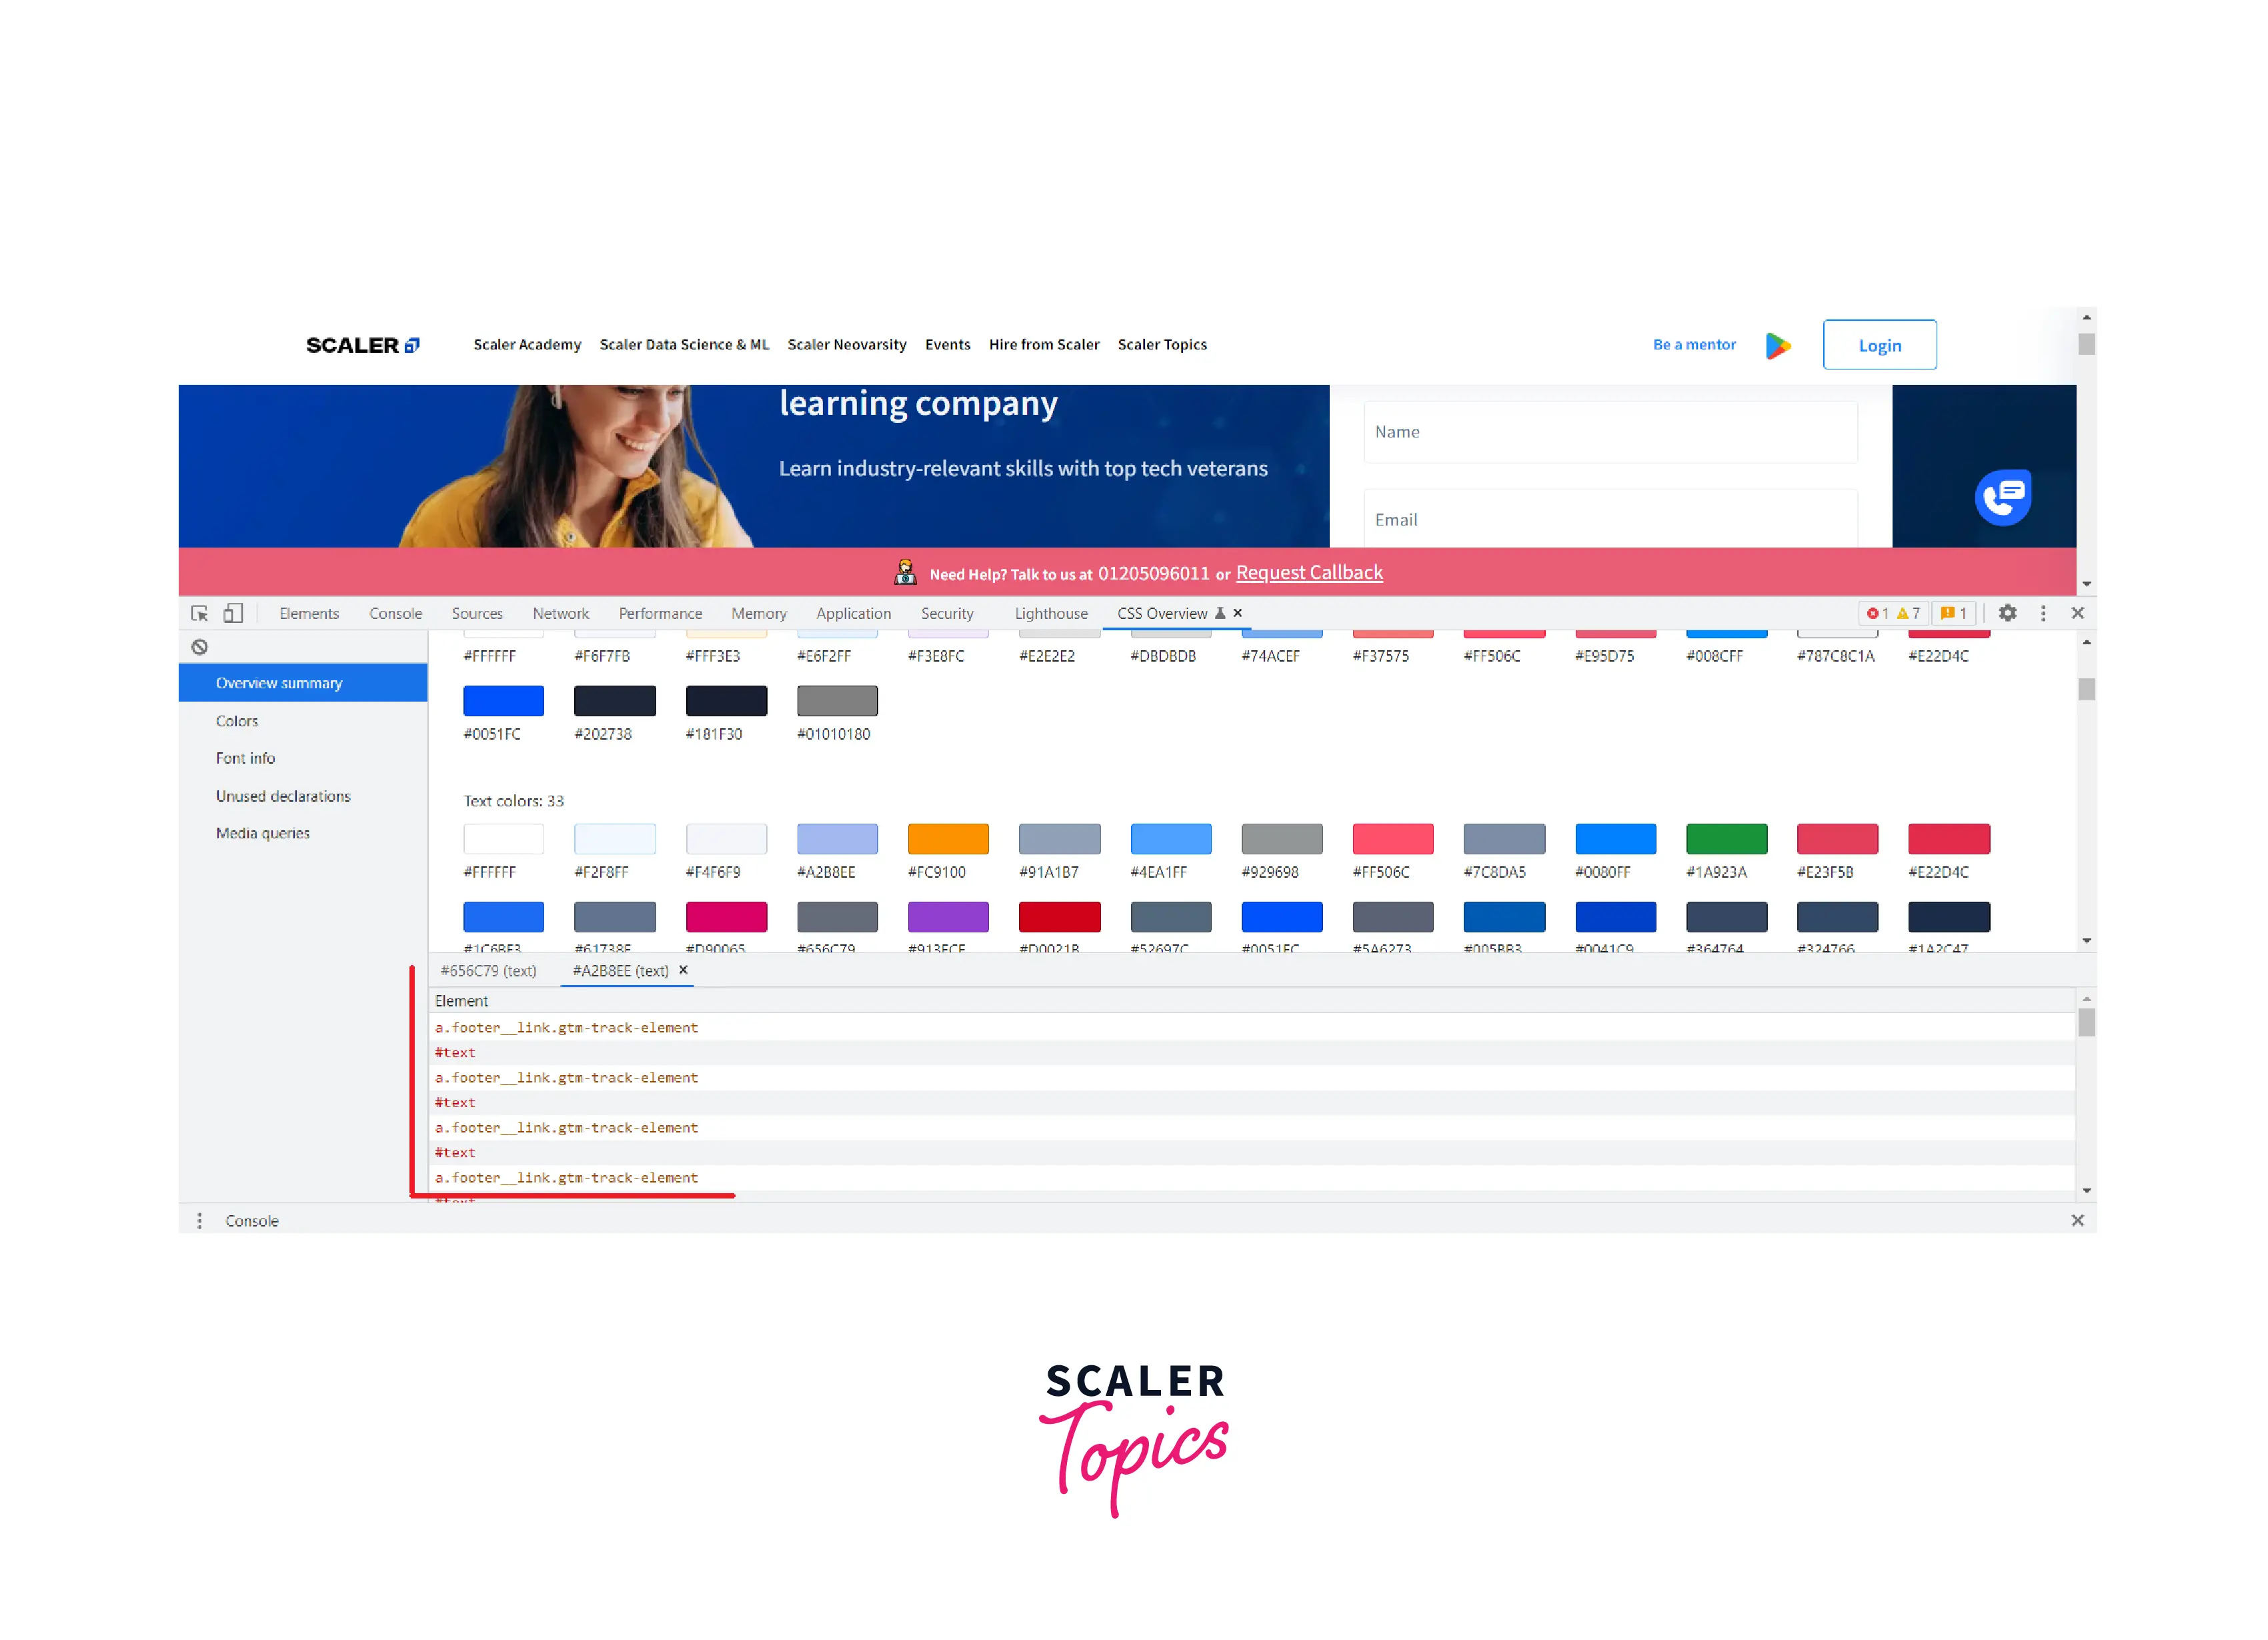 And when you click on any element from the list, it redirects you to the styles panel, where you can easily make changes.
 - Font info:
All the fonts on your page and their occurrences are grouped by different font sizes, font weight, and line height. Like the Colors section, you can click on the occurrences to view the list of affected elements.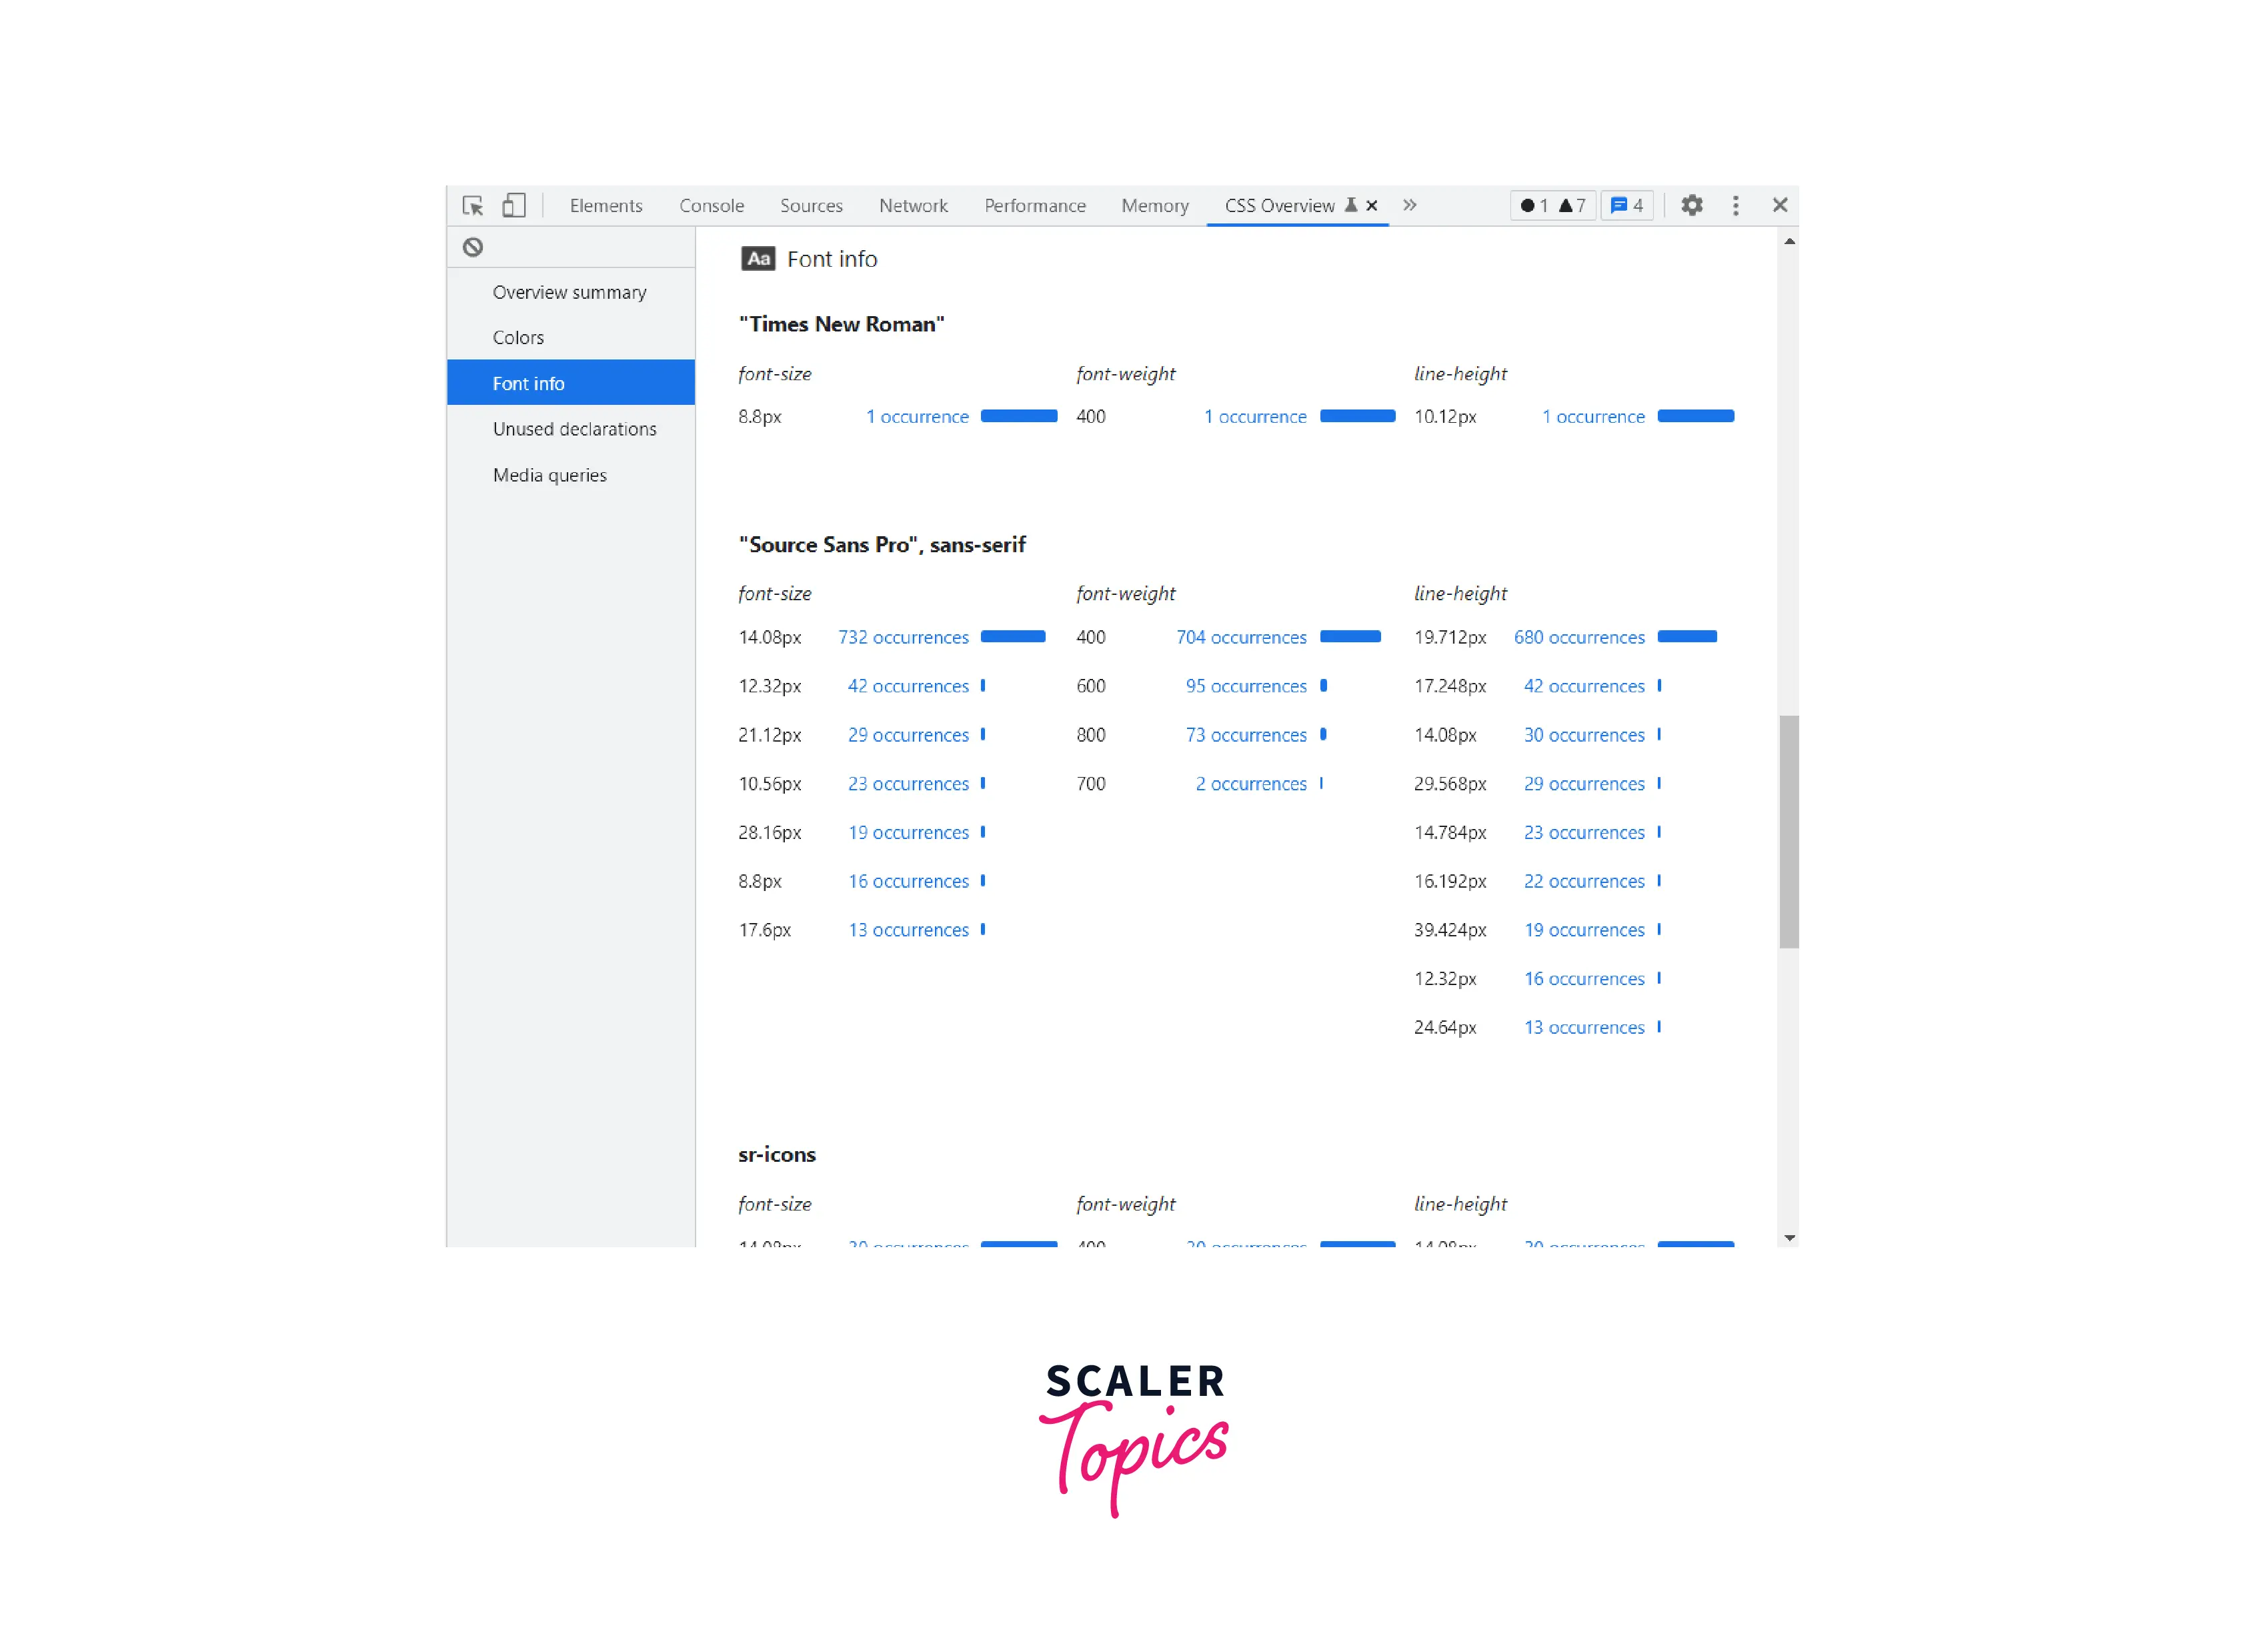
- Unused declarations:
This section contains all the styles which do not affect the page, and all are grouped by reason.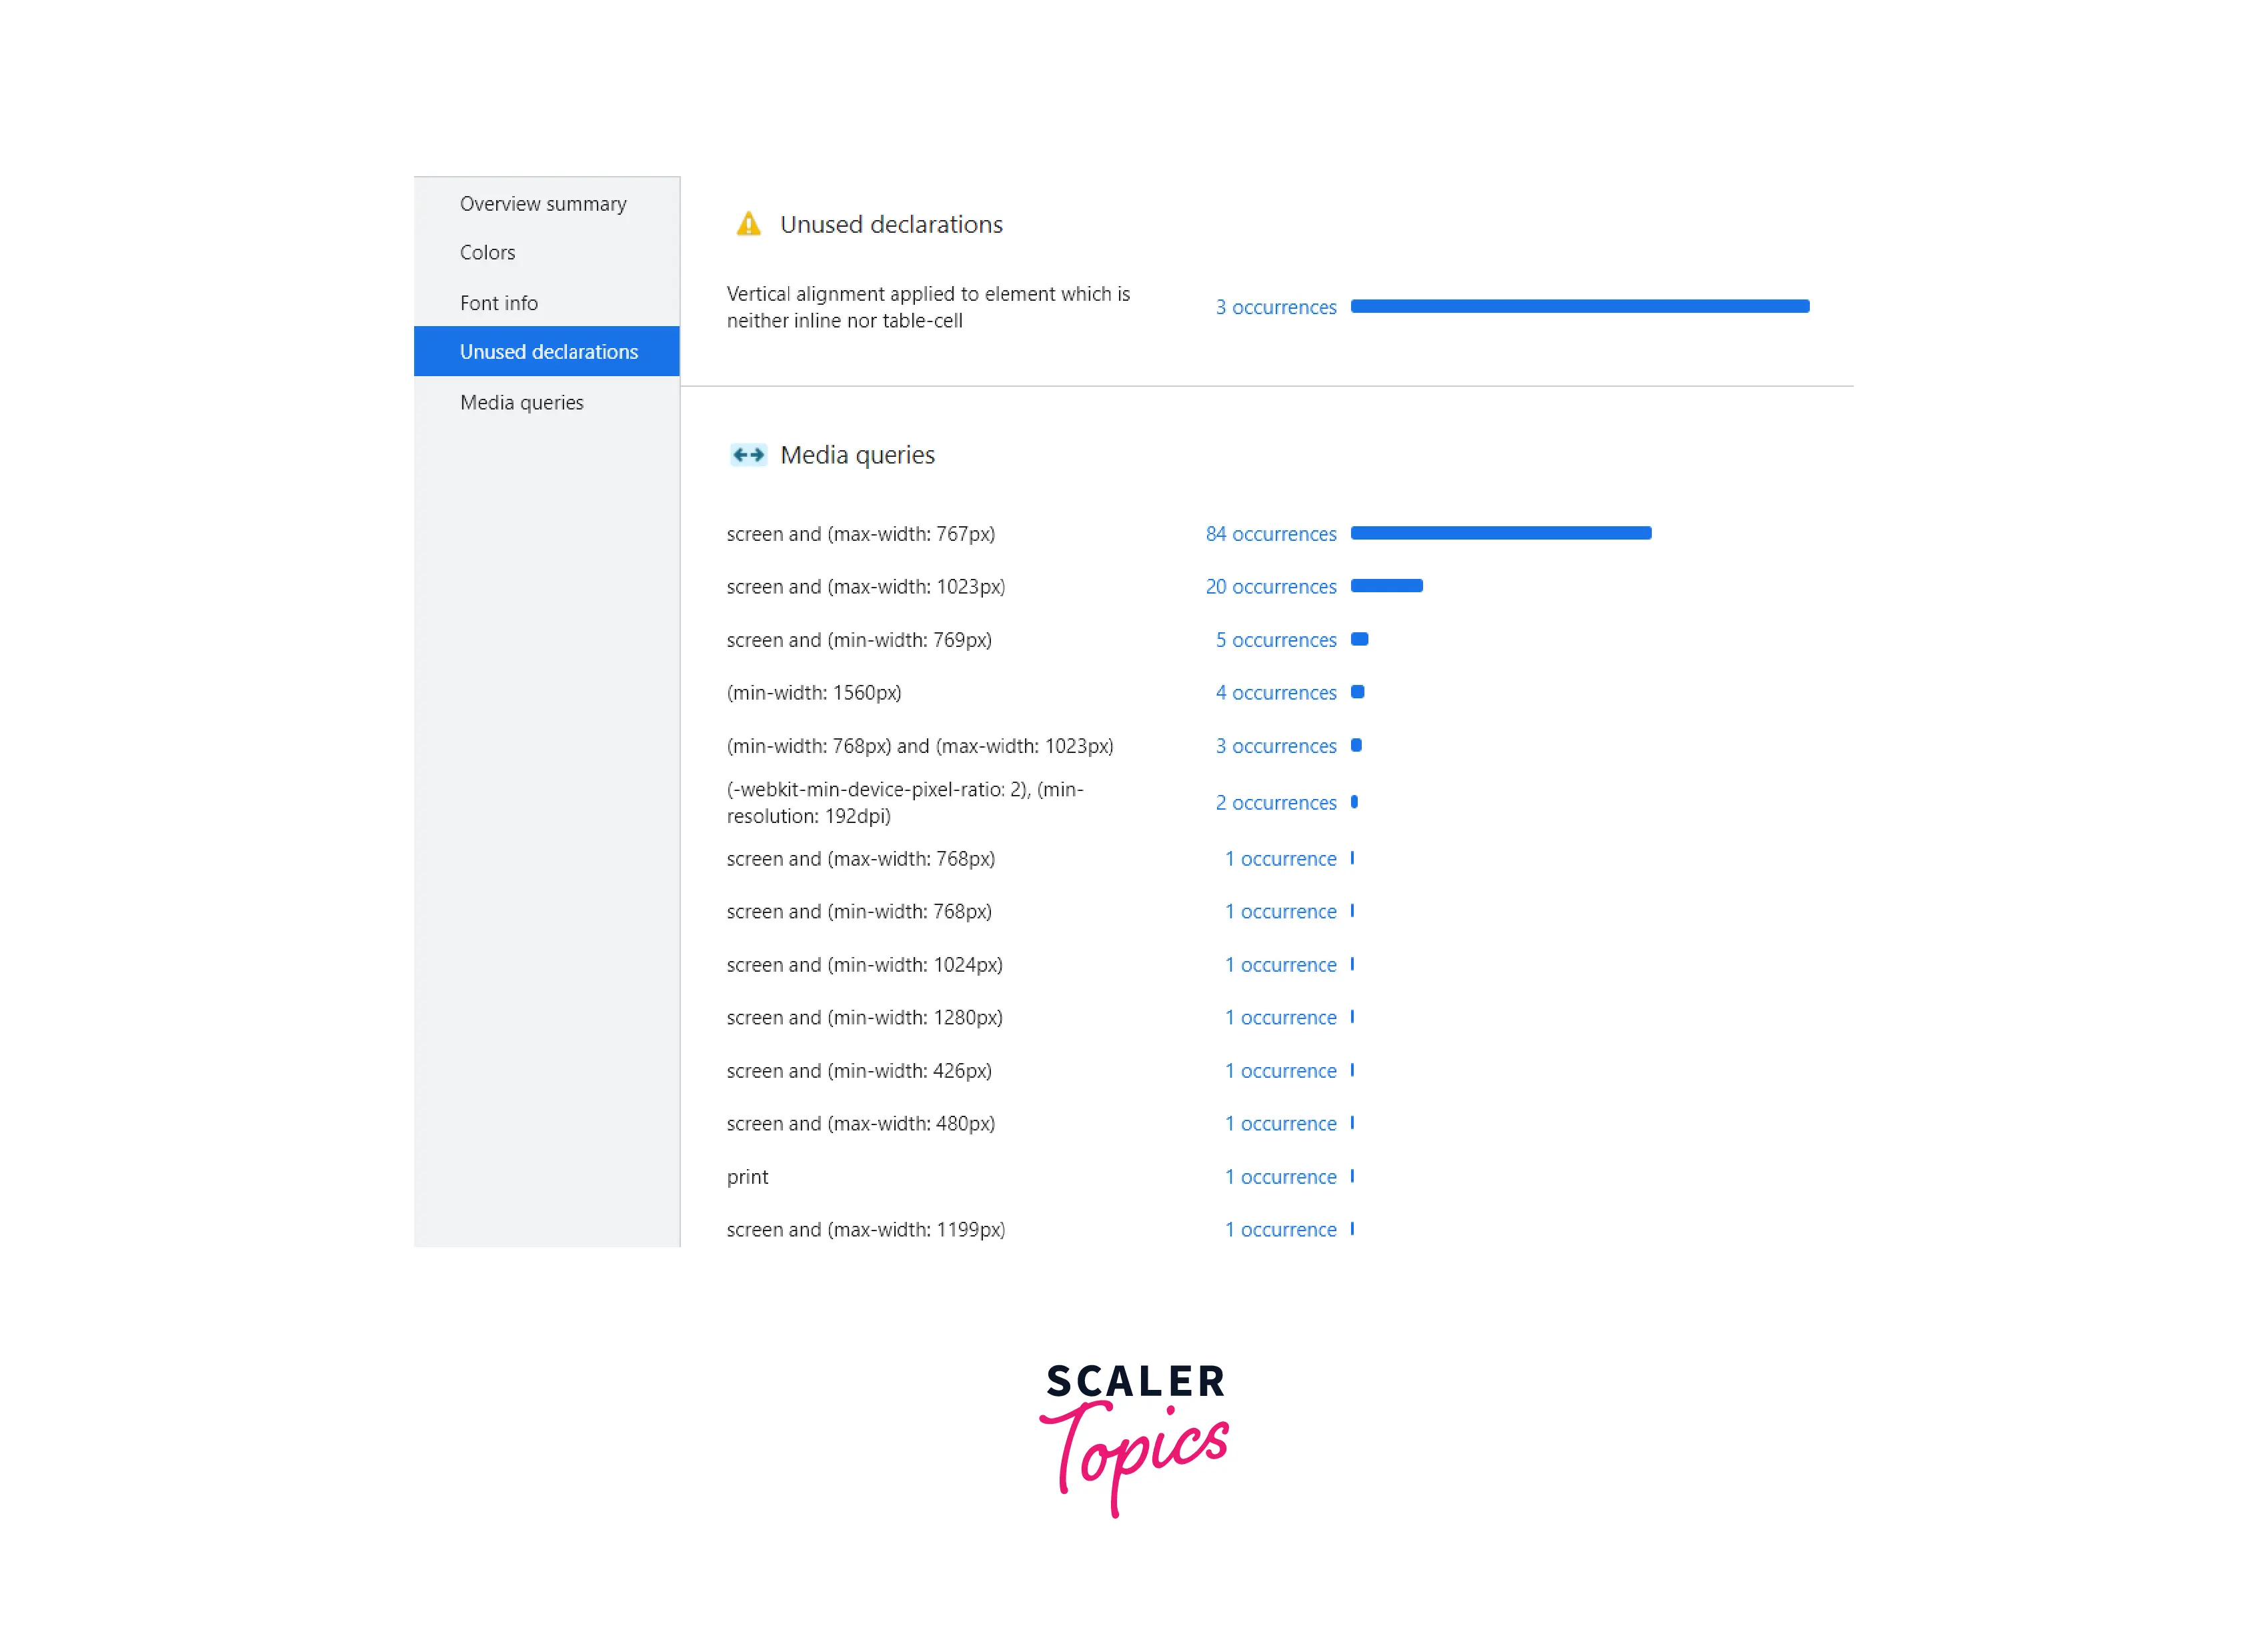
- Media queries:
This section contains all the media queries defined and sorted with the highest occurrence. To view the affected elements, click on any occurrences.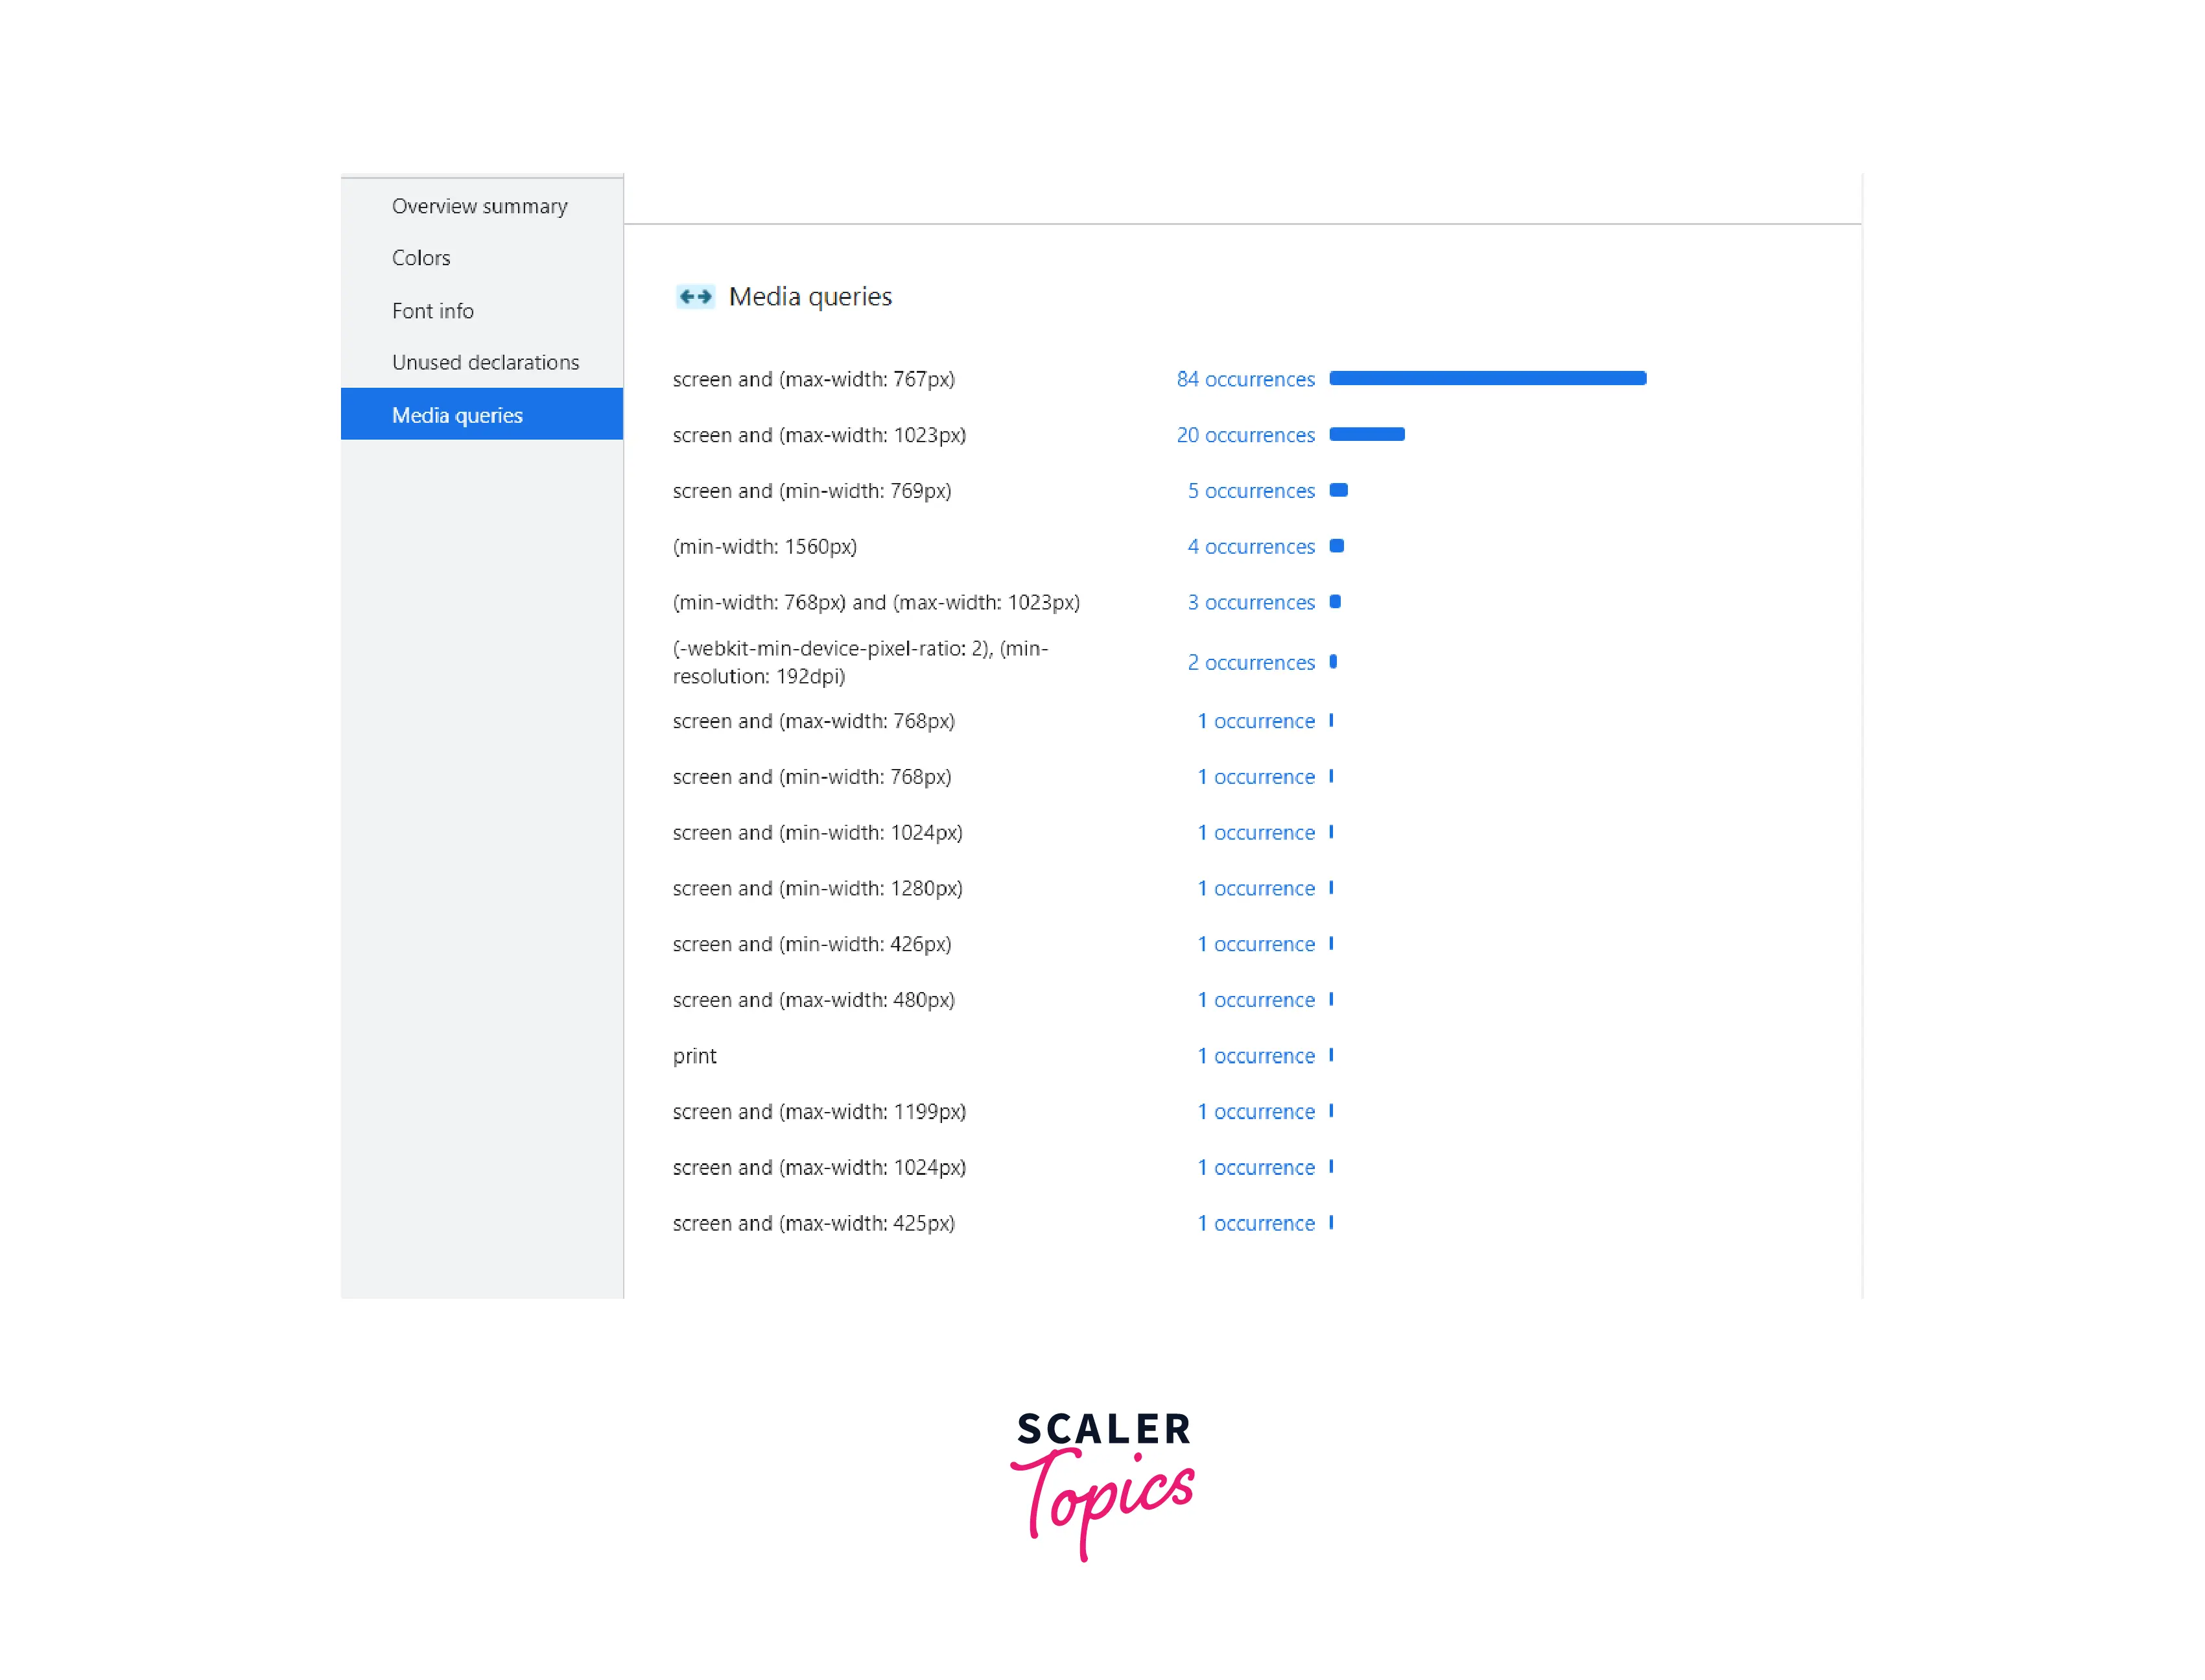
Conclusion
- Google Chrome Developer Tools includes several tools for working with CSS.
- Troubleshooting and debugging CSS with DevTools is easiest because it gives real-time effect and does not store the changes made with it.
- When we reload the website or page, all the changes made in DevTools are lost.
- You can use DevTools to identify potential improvements and unused CSS.