Best Tools for Data Analyst in 2024
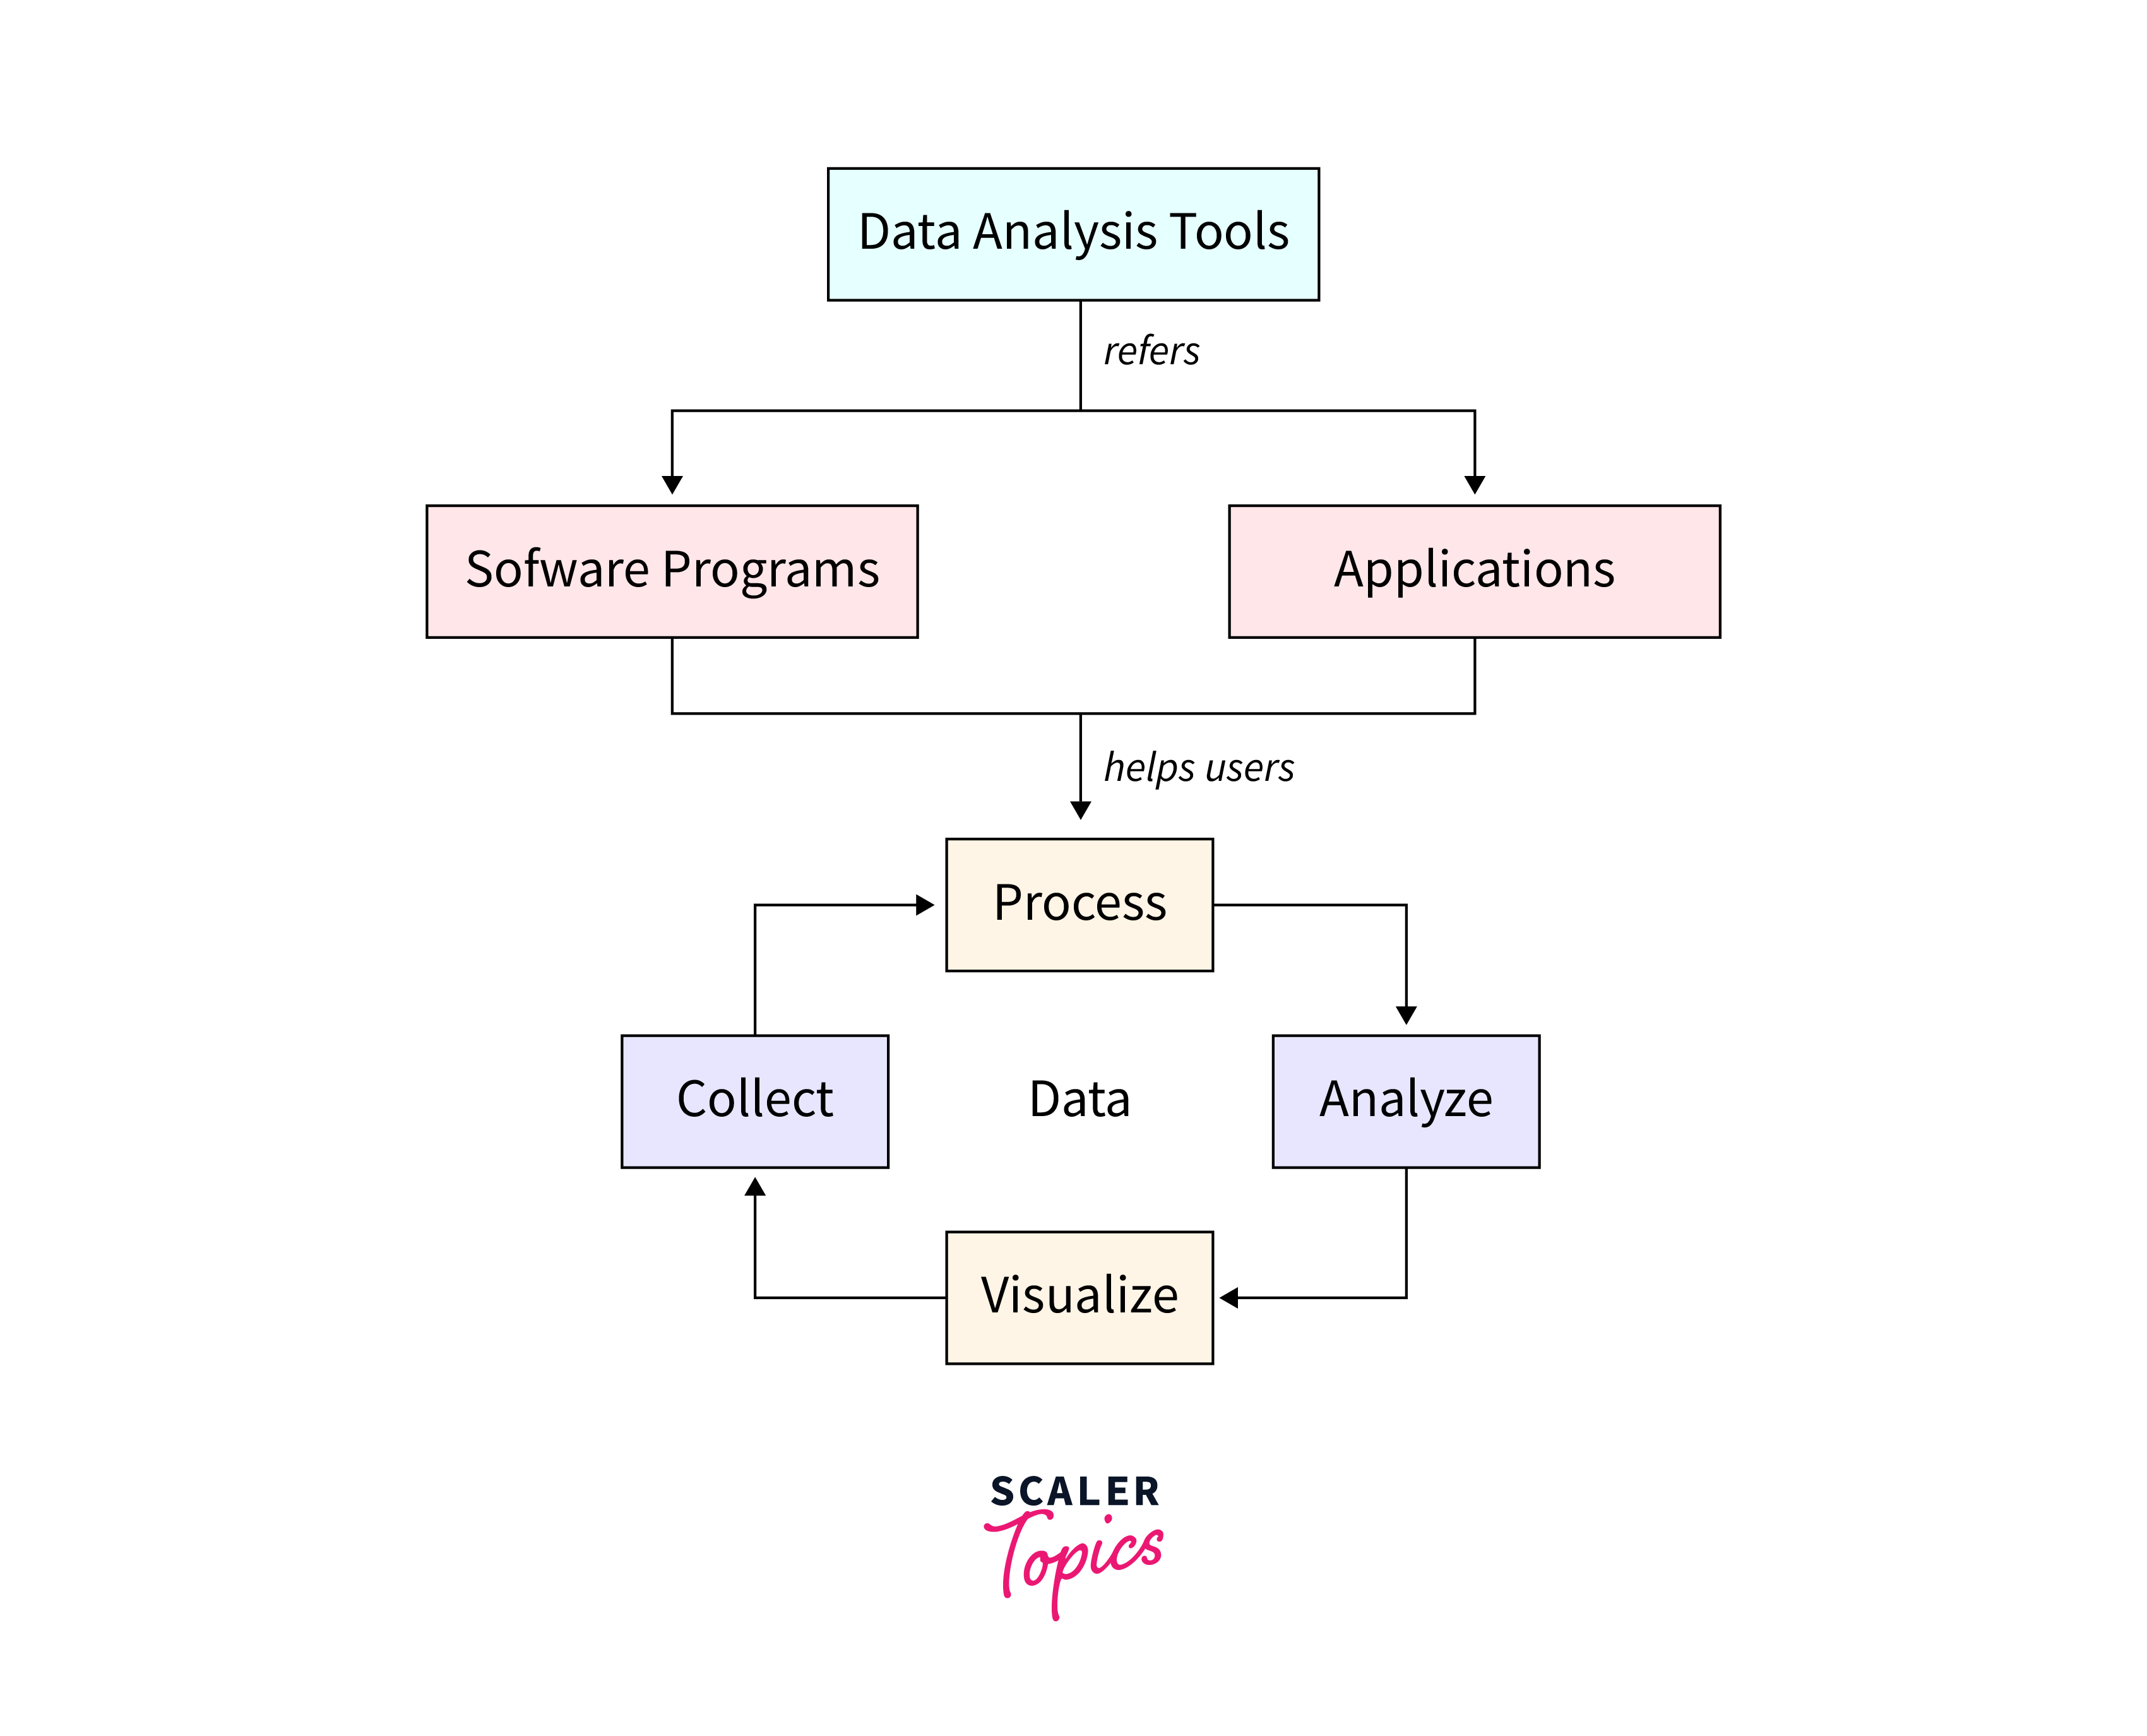
Data analyst tools refer to computer programs and applications used for examining information, gaining insights, and making decisions based on valuable data. This article provides a comprehensive overview of key data analytics tools, ranging from popular open-source solutions to commercial software along with their applications, advantages, and limitations.
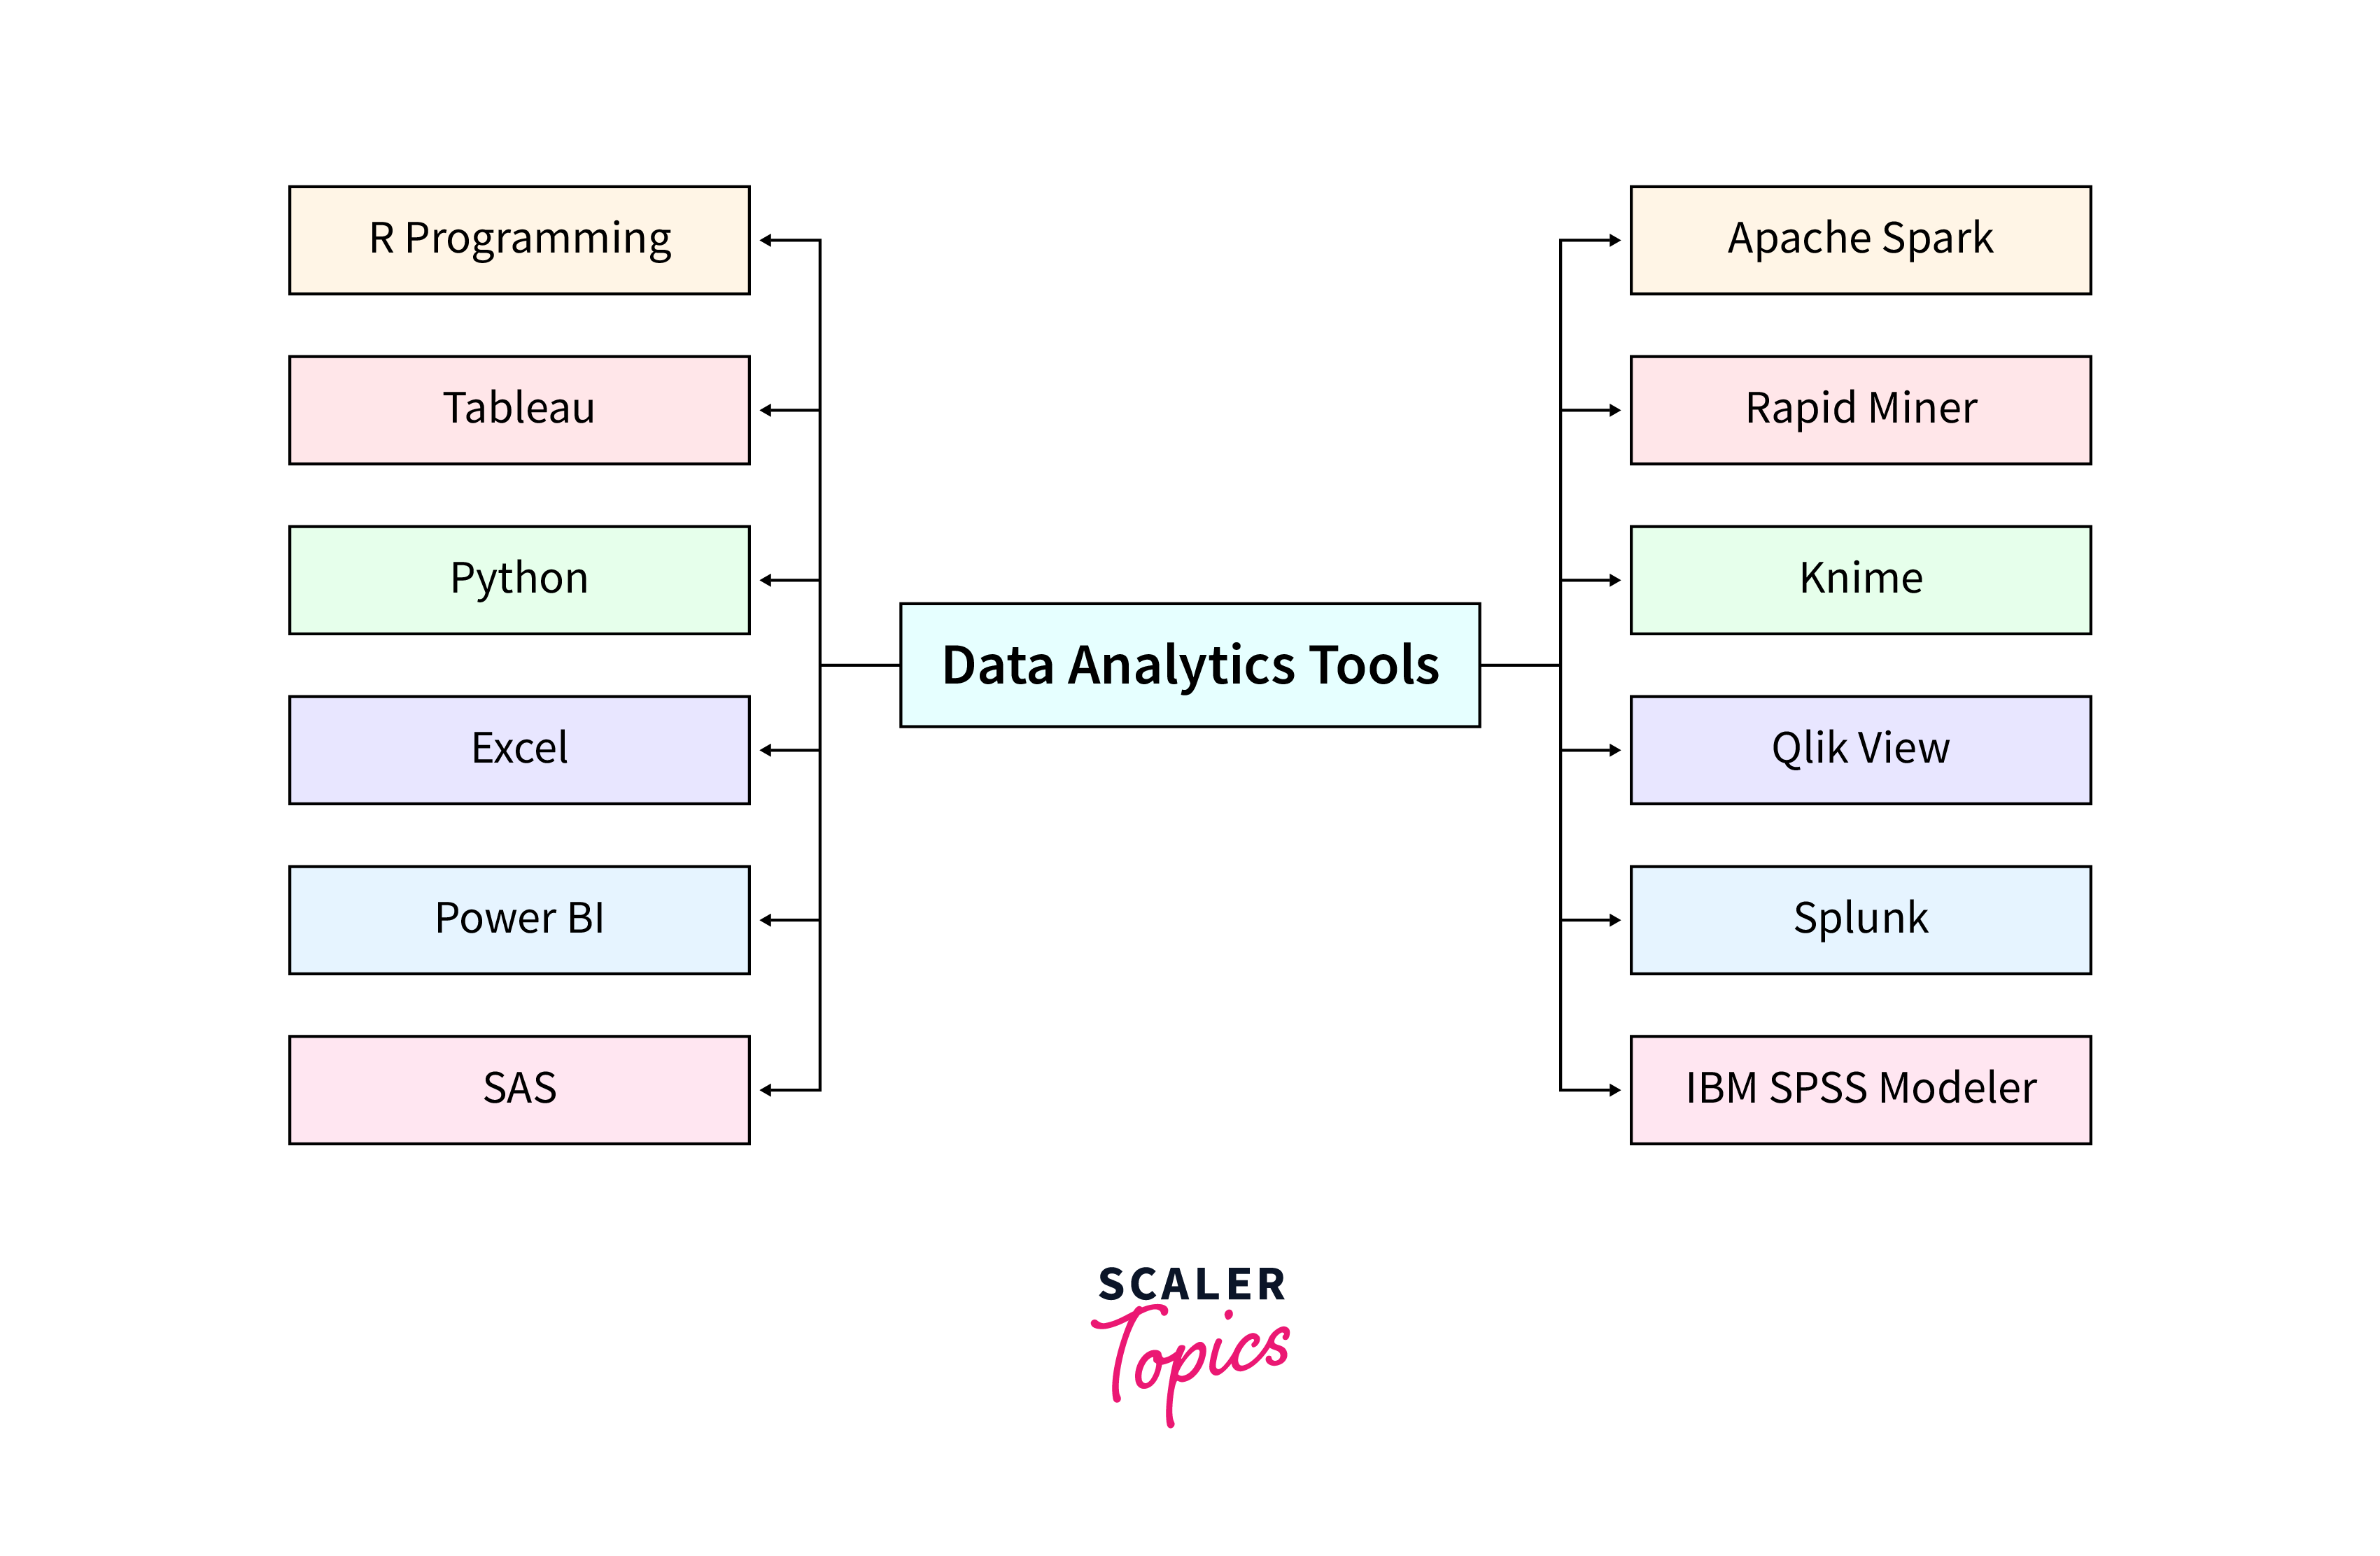
Best Data Analyst Tools
As the field of data analytics advances, a variety of data analysis tools becomes accessible for various purposes. Let's explore the applications of each data analyst tool:
Microsoft Excel
Microsoft Excel is the most widely-used Spreadsheet software that helps organize, a range, of reports and show information in tables. It comes with lots of useful features and add-ons, and some versions offer a free one-month trial, but you usually need to buy it.
It's excellent for doing calculations and creating graphs when you're working with data. It has useful tools like pivot tables, which help you sort or total data, and tools for making forms. Almost all organizations use Microsoft Excel daily to gather meaningful insights from the data. A few of the popular companies using Excel are McDonald’s, IKEA, and Marriot.
Excel has a few limitations as well, including cost, occasional calculation errors, and challenges with handling large datasets, leading to potential slowdowns and reduced accuracy with extensive numbers. While suitable for simple analyses, it struggles with larger datasets. Furthermore, Excel lacks robust collaboration support and versioning capabilities.
Python
Python is a special computer language that's super useful for people who analyze data. It's not as complex as some other languages making it Easy to learn. It is super popular, available as Open-source with over 200,000 packages and thousands of free libraries.
It has tools like NumPy and pandas for math and data, while Beautiful Soup and Scrapy fetch info from the internet. Matplotlib creates cool charts. It works with other tools for machine learning and data visualization.
However, Python isn't the fastest language out there; it takes up a lot of computer memory and can be a bit slow. But, overall, if you're starting a new project, Python is a great choice.
R
R is another popular computer language that is free for everyone to use, just like Python. People often use it to make software for statistics and data analysis.
It is a bit more complicated to learn than Python, and it takes some time to get used to it. However, it was created specifically to handle tasks involving a lot of statistics, and many people like using it for showing data in graphs and charts. Similar to Python, it has a bunch of freely available code in a network called CRAN, with over 15,000 open-source packages.
R is good with other languages and big data tools like C, C++, and FORTRAN. The good thing is, that it works on any system and is very compatible. However, it's slow and not great at memory.
Jupyter Notebook
Jupyter Notebook is a special Open-source computer program that helps you make interactive documents. These documents can have live code, math equations, pictures, and text that tells a story.
It's considered good for showing off your work or for teaching and creating tutorials because you can use it on the internet, and it works with more than 40 languages, including Python and R. It can also connect with big data tools like Apache Spark and can create different kinds of things like web pages, pictures, and videos.
There are a few limitations of Jupyter as well like it is not great for keeping track of changes in your work, and it's not the best for working together with others. For serious work and programming, it's better to use a different tool. Also, if you share your document, you need to make sure the other person has everything they need, like extra tools or programs.
Apache Spark
Apache Spark, an open-source program, helps data professionals efficiently manage extensive datasets. Particularly effective for handling large and complex data, it distributes the analysis workload across multiple computers.
There are other programs similar to Spark, like Apache Hadoop, but Spark is super speedy. It's about 100 times faster than Hadoop because it uses a special kind of memory called RAM. People often use Spark when they are making complicated models to understand lots of data, especially for things like machine learning.
Spark even has its own set of tools for machine learning called MLlib. These tools help in making predictions and grouping similar things. But, there are some downsides also, it uses a lot of computer memory, which can make it expensive to use and it also doesn't have a way to organize files, so it usually needs to work with other programs, like Hadoop.
Google Cloud AutoML
Google Cloud AutoML is a special data analyst tool that helps you make machine-learning models without much effort. It has different tools for various things like organizing data, translating languages, and figuring out what's in pictures and videos. As more and more companies use machine learning, there is an increasing need for AutoML.
This tool is mainly used to make machine learning easier. However, it costs money, especially for big projects, and it's not very flexible.
SAS
SAS, which stands for Statistical Analysis System, is a famous set of tools used by businesses to understand data better. People mainly use it to learn about customers, make reports, find useful information in data, and predict things.
SAS is built for big companies because they usually have different levels of experts in computer programming. Even though it costs a lot of money, it's good for big organizations because it's strong, flexible, and easier for them to use.
While it doesn't have as many features as Python, this tool keeps growing and adds new things based on what people want. It's known for being business-focused and having good support for users because it helps with things like stopping money fraud and understanding data from the Internet of Things.
Microsoft Power BI
Power BI is a newer tool for looking at data, and it's less than ten years old. With Power BI, people can make cool reports and dashboards that are easy to interact with, and it's not too hard to learn.
The best thing about Power BI is that it works really well with Excel, and it can also handle information from text files, databases like SQL, and even data from places like Google and Facebook.
It has some drawbacks, like being a bit bulky, and formulas aren't very flexible. It also has its own language called DAX, which can be a bit tricky. Power BI lets you build automatic machine learning models and works with Azure Machine Learning.
Tableau
Tableau is a good data analyst tool if you want to make cool pictures and dashboards without knowing a lot about coding. You can just drag and drop things to make your pictures, which is a big plus compared to some other tools.
Tableau has some limits as it can't do certain tasks and doesn't have a special way of giving commands. It's not good at getting data ready or doing hard calculations. If you need to do those things, you might have to use other tools like Python or R. Also, it doesn't work well with advanced SQL queries and has poor version control and no data pre-processing.
Even though it has some limitations, many people like using Tableau because it's excellent at making things look good. It's also user-friendly on your phone, which may not be crucial for a data analyst, but it's convenient if you want to work while on the move.
Big companies like Citibank, Deloitte, Skype, and Audi use Tableau to make their data look nice and get useful information. Tableau has different parts like Desktop, Server, Online, Reader, and Tableau Public.
KNIME
KNIME, which stands for Konstanz Information Miner is a free, open-source platform that helps gather and organize data. It is used for understanding customers, business planning, and machine learning.
It is very easy to use, you can drag and drop things to create your data plans without needing a lot of technical skills. It's especially good at finding important information in lots of data(data mining).
KNIME provides two software:
-
KNIME Analytics Platform – It's a free tool used to clean and gather data, make reusable components accessible to everyone, and create Data Science workflows.
-
KNIME Server – This platform is used by big companies for deploying Data Science workflows, team collaboration, management, and automation.
Big companies like Siemens, Novartis, Deutsche Telekom, and Continental use KNIME to understand their data and get useful insights. It helps you analyze information from different places in one go and allows you to add extra features for working with popular programming languages like R, Python, Java, and SQL.
Steamlit
Streamlit is a new tool for folks dealing with data and machines. It is an open-source Python library designed for creating interactive websites for showcasing your data projects. Even though it's relatively new, many data experts appreciate it because it makes creating pictures and charts easy. It's not as powerful as Power BI or Tableau and it also needs a Python installation.
How to Choose a Data Analysis Tool
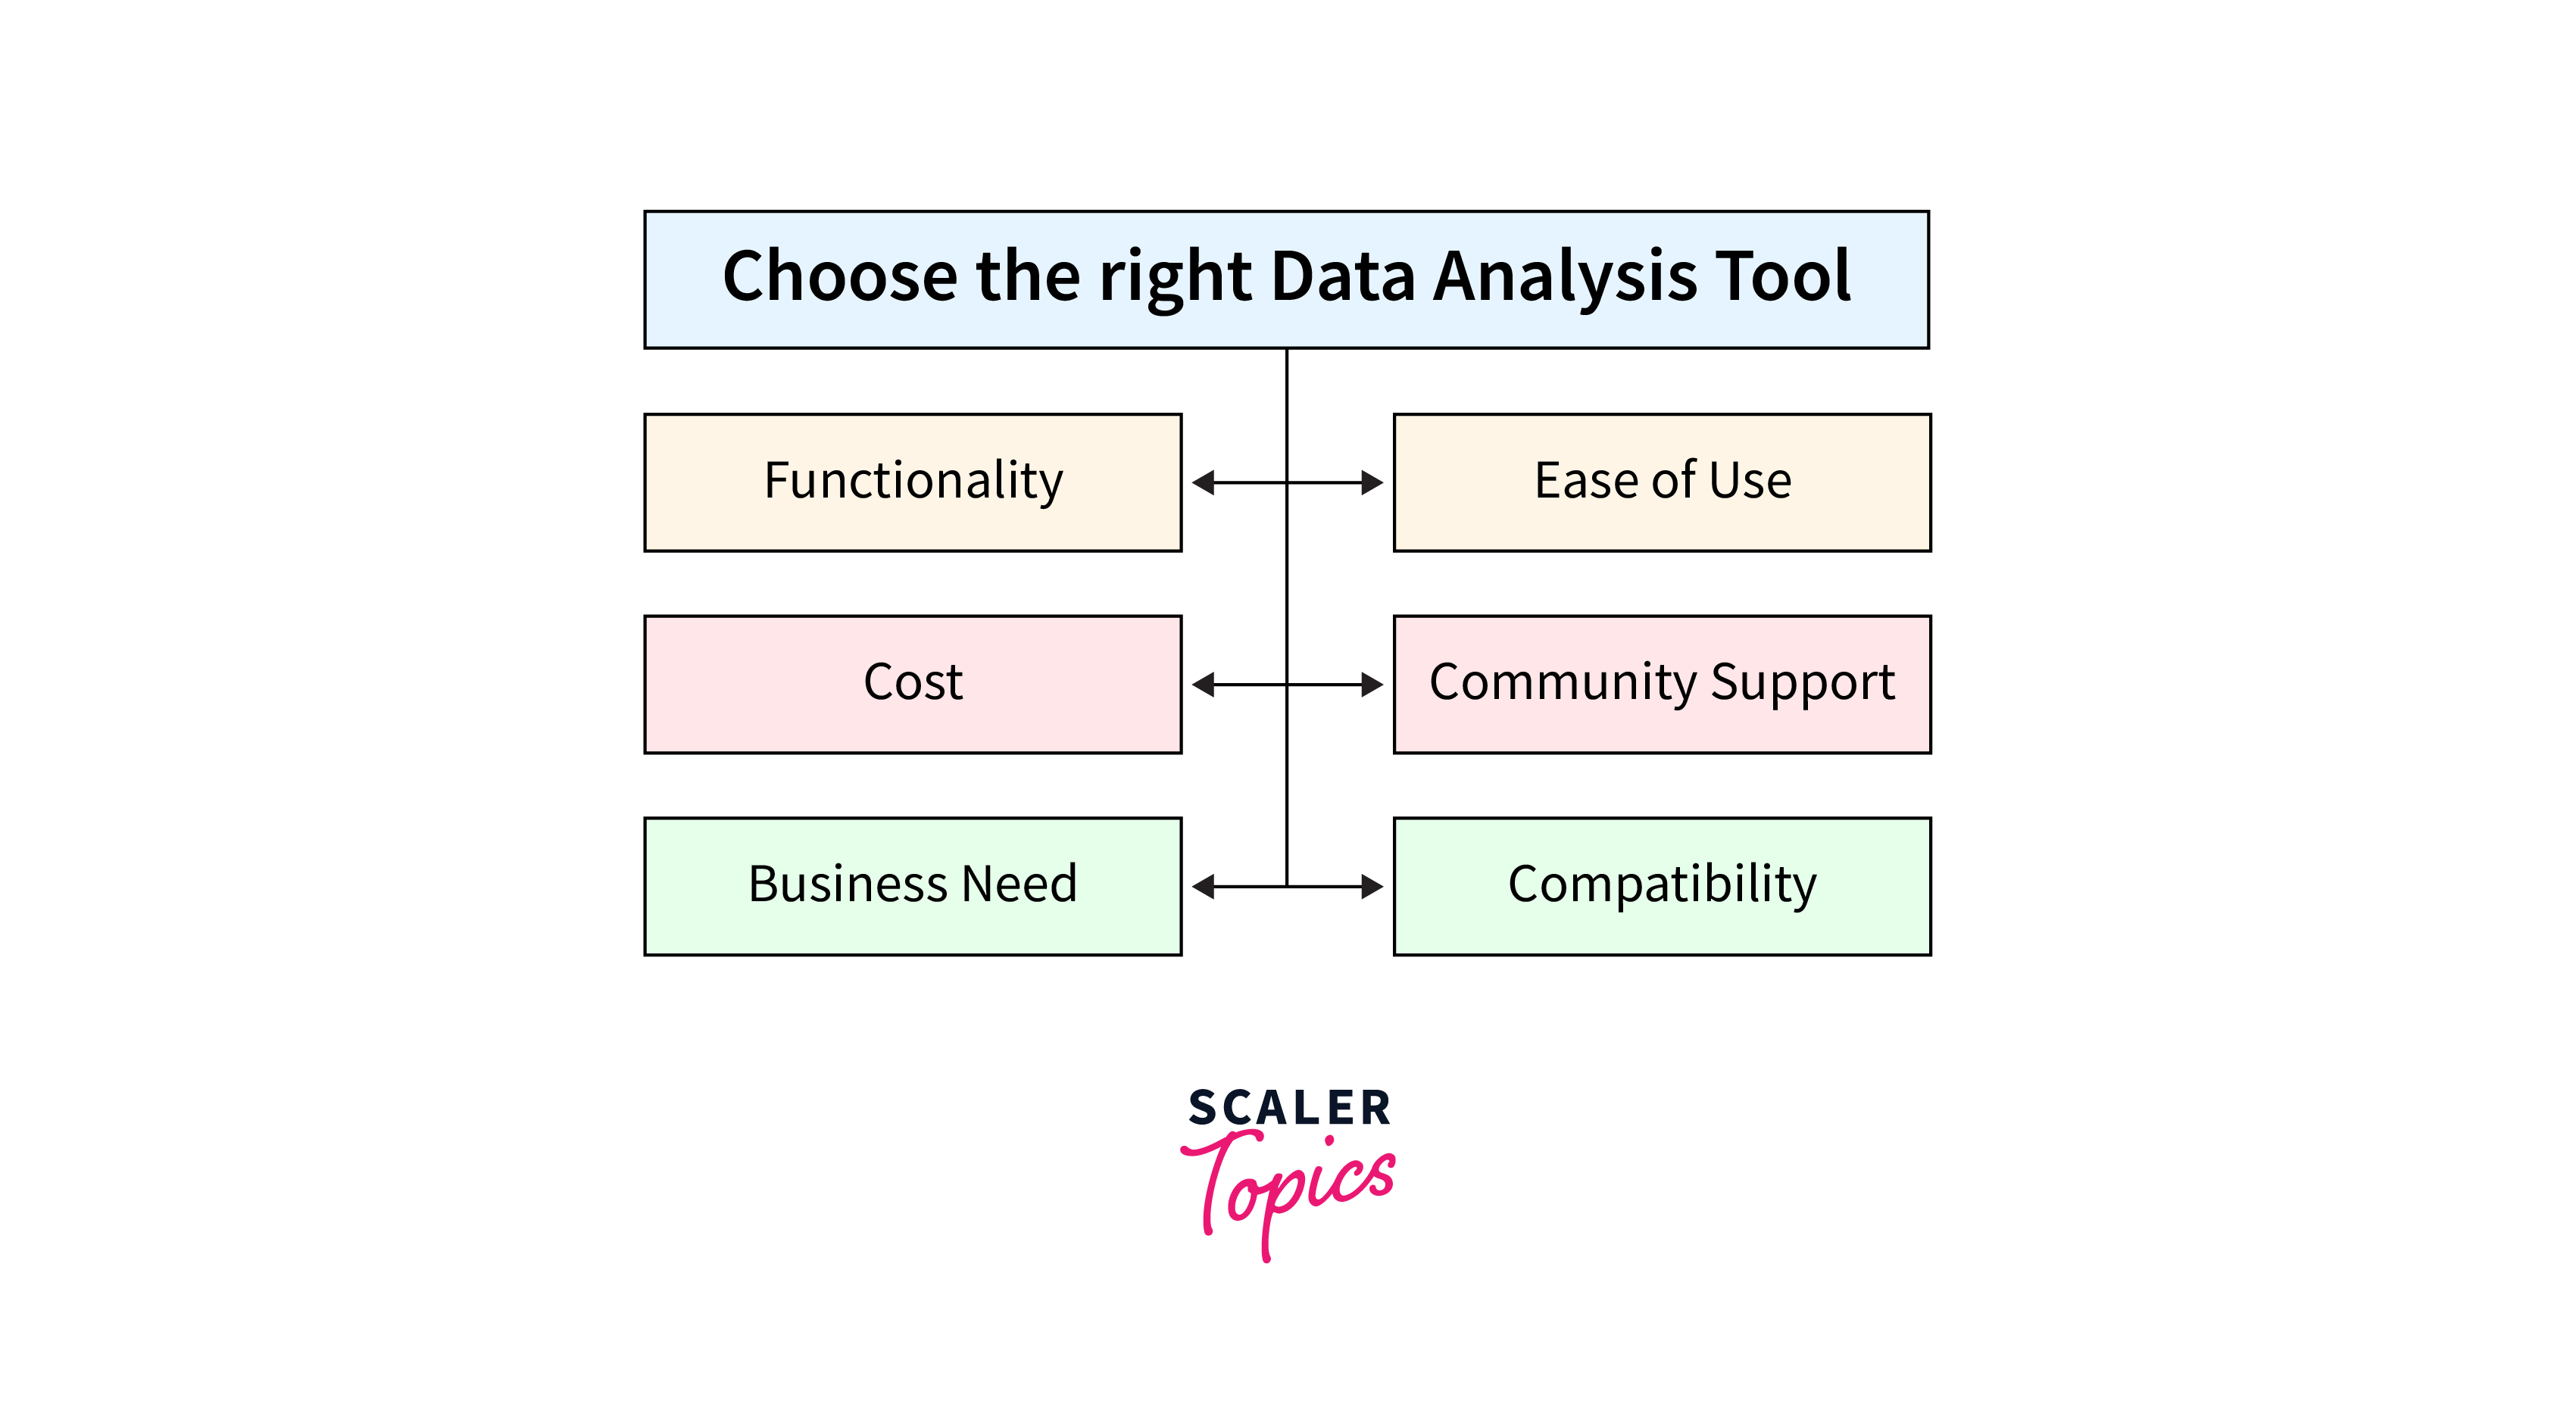 To pick a data analysis tool from a list, remember that no single tool does everything for data analysis. You might need different tools for different tasks.
For that, you need to consider your business needs and see who will use the data tools (experts non-technical users or both). Next, check if the tool can organize and prepare data.
Finally, check the cost. Some tools are free, while others may require payment for the full version. You will have to think about how many people will use it and for how long.
FAQs
Q. What are data analyst tools?
A. Data analyst tools are like computer software that organize, clean, and show data in an easy-to-understand way. People use these tools to find important information and make smart decisions in business.
Q. What is the most commonly used data analyst tool?
A. Lots of data analysts prefer Microsoft Excel because it's easy to use for organizing, reporting, and making data look good. It's friendly for working with data and doing math.
Q. Is SQL one of a data analyst tool?
A. Yes, SQL is a computer language that data analysts use to organize and ask questions about data in databases. It is used to study the data and then create reports to understand things better.
Q. Which tool is best to analyze data?
A. It depends on what you want to do with the data and the business needs. Some popular and useful tools include Python, SQL, MS Excel, and Tableau.
Conclusion
- Microsoft Excel is widely used for data wrangling and KNIME is an open-source data integration platform suitable for data mining.
- Python is a versatile programming language for data analysis and Streamlit is an open-source Python library that facilitates interactive content creation.
- R is an open-source language for statistical analysis and data mining, while Jupyter Notebook serves as an open-source tool for interactive documents in multiple languages.
- Apache Spark is a fast data processing framework for big data and machine learning and Google Cloud AutoML, a cloud-based tool is used for automating machine learning tasks.
- SAS is a commercial statistical software for business intelligence, while Tableau offers impressive data visualization.