R Data Frames
Overview
Data frames are essential data structures used for organizing and analyzing tabular data in various programming languages. In R, a powerful statistical programming language, data frames are a fundamental data structure widely utilized for data manipulation and analysis. R's data frames are two-dimensional arrays, resembling spreadsheets, where rows represent observations, and columns represent variables. They allow data to be stored in a structured format, facilitating efficient data handling and transformation. Researchers, statisticians, and data scientists extensively use data frames in R for tasks like data cleaning, filtering, merging, and conducting various statistical analyses, leading to valuable insights and informed decision-making.
What is Data Frame in R?
In R, a data frame is a fundamental data structure used for organizing and storing data in a tabular format. It is a two-dimensional array-like object where rows represent observations or cases, and columns represent variables or attributes. Each column in a data frame can have a different data type, such as numeric, character, factor, or logical.
Data frames are particularly useful for working with structured data, such as datasets imported from spreadsheets or databases. They provide a convenient and efficient way to manipulate, analyze, and visualize data using R's extensive ecosystem of packages and functions.
You can create a data frame using the data.frame() function in R or by importing data from various sources, such as CSV files, Excel spreadsheets, or databases. Data frames are widely used in statistical analysis, data exploration, and machine learning tasks, making them a crucial tool for researchers, data analysts, and data scientists in R.
Create Data Frame in R
In R, you can create a data frame using the data.frame() function or by importing data from external sources. Here's an example of how to create a data frame using the data.frame() function:
The code above will create a data frame called my_data_frame with three columns: "Name", "Age" and "Score" and four rows of data.
Alternatively, you can also read data from external sources like CSV files, Excel spreadsheets, or databases and convert them into data frames using appropriate functions like read.csv(), read_excel(), or others, depending on the file type.
Get the Structure of the Data Frame in R
In R, you can use the str() function to get the structure of a data frame. The str() function provides a concise and informative summary of the object's structure, including the data types of its columns, the first few rows of data, and the total number of observations.
Here's an example of how to use the str() function to get the structure of a data frame:
Summary of Data in the R Data Frame
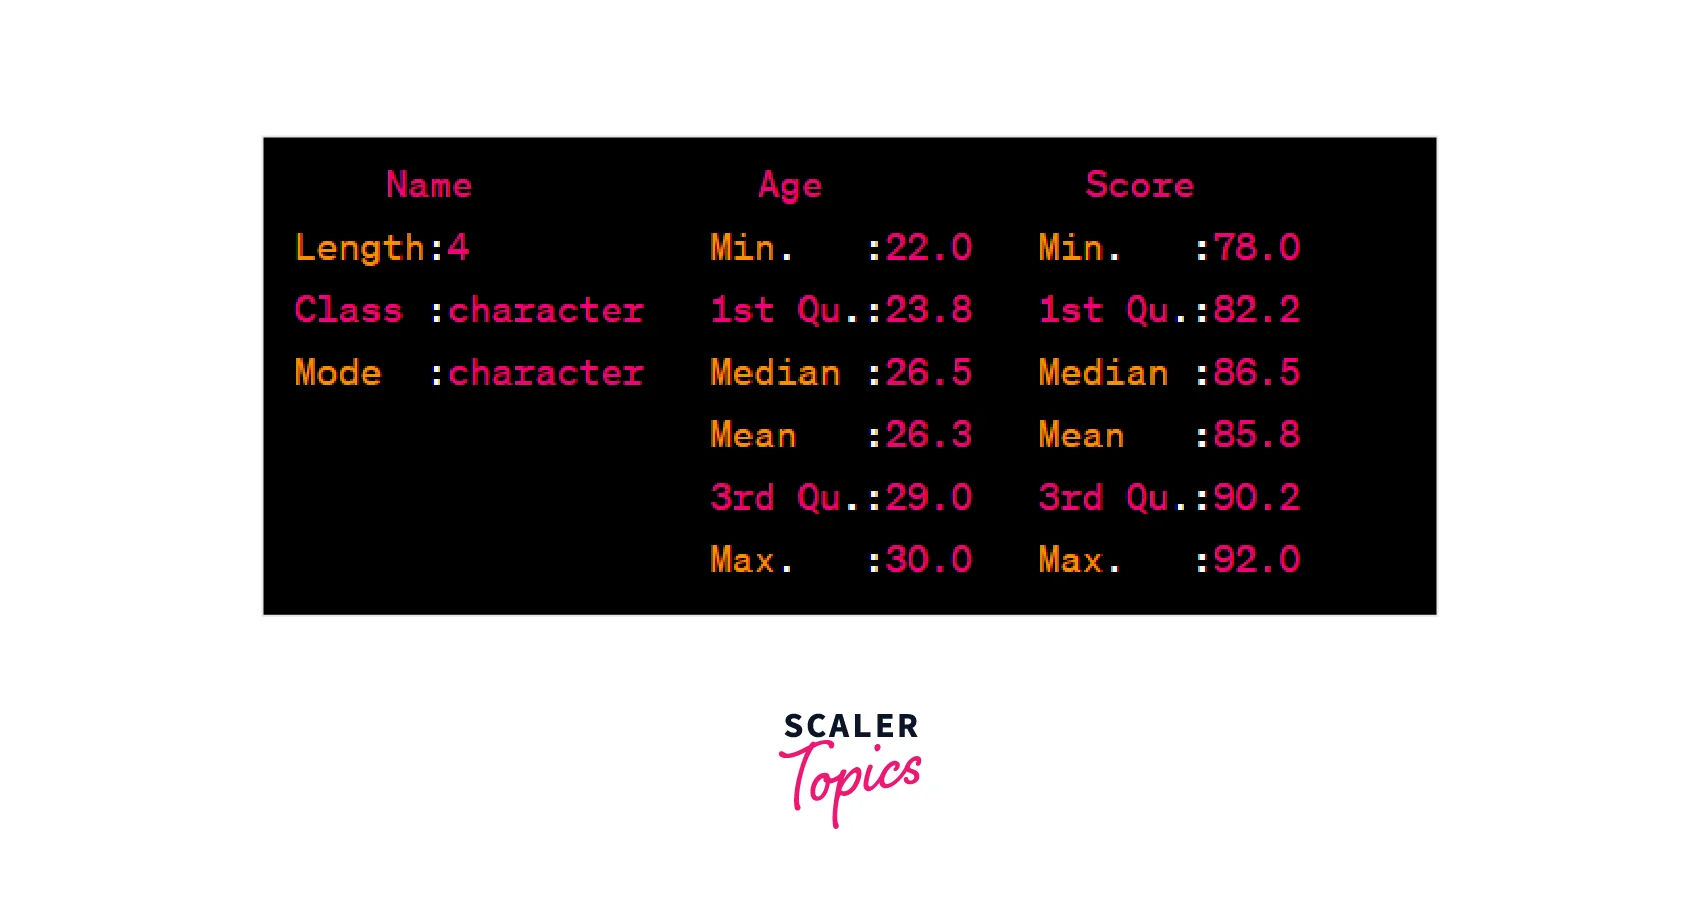
In R, you can use the summary() function to get a statistical summary of the data in a data frame. The summary() function provides descriptive statistics for each column in the data frame, such as minimum, 1st quartile, median, mean, 3rd quartile, maximum, and the number of non-missing values.
Here's an example of how to use the summary() function to get a summary of data in a data frame:
Output
Accessing Data Frame Columns in R
In R, you can access data frame columns using the dollar sign $ or square brackets [] notation. Here's how you can do it:
- Using the Dollar Sign $: You can access a specific column in a data frame using the column name followed by the dollar sign $. This method is straightforward and commonly used when you know the column names in advance.
- Using Square Brackets []:
You can also access data frame columns using square brackets with either the column name or column index. The advantage of this method is that it allows you to dynamically select columns based on variables or conditions.
Extract Data from Data Frame
In R, you can extract specific columns and rows from a data frame using various indexing and subsetting techniques. Here are examples of how to perform each of these operations:
Extracting Specific Columns
You can extract specific columns from a data frame using the column name or index within square brackets []. To select multiple columns, use a comma-separated list of column names or column indices.
Extracting Specific Rows
You can extract specific rows from a data frame using integer indexing within square brackets [].
Extracting Specific Rows Corresponding to Specific Column
You can extract specific rows based on conditions applied to a particular column.
Combine Data Frames
In R, you can combine data frames in different ways, such as merging, binding, or joining, depending on your specific needs. Here are some common methods to combine data frames:
- rbind():
This function is used to combine data frames by row-wise binding, stacking one data frame on top of another. The data frames must have the same columns for successful merging.
Output

- cbind():
This function is used to combine data frames by column-wise binding, joining columns side by side. The data frames must have the same number of rows for successful merging.
Output

Expand Data Frame in R
In R, you can expand a data frame by adding columns or rows using various functions and techniques. Here's how you can add a column and add a row to a data frame:
- Add Column:
To add a new column to an existing data frame, you can simply assign a new vector to a new column name using the dollar sign $ notation or the square brackets [] notation.
- Add Row:
To add a new row to an existing data frame, you can use the rbind() function to concatenate the new row with the existing data frame.
Remove Rows and Columns
In R, you can remove rows and columns from a data frame using various functions and subsetting techniques. Here's how you can remove rows and columns from a data frame:
- Remove Rows:
To remove specific rows from a data frame, you can use subsetting to exclude the rows you want to delete. You can use logical conditions or row indices to select the rows you want to keep.
- Remove Columns:
To remove specific columns from a data frame, you can use subsetting to exclude the columns you want to delete. You can use column names or column indices to select the columns you want to keep.
How to Find the Length of a Data Frame in R?
In R, you can find the length of a data frame using the nrow() function, which returns the number of rows in the data frame. Here's how to use it:
The nrow() function returns the number of rows in the data frame "my_data_frame" and stores it in the variable length_of_df. You can then print or use this value as needed. The length of a data frame corresponds to the number of observations or cases present in the data frame.
Conclusion
- Data frames are tabular data structures used for organizing and analyzing data in R.
- Data frames in R are two-dimensional arrays, with rows representing observations and columns representing variables.
- They are widely used for handling structured data and are fundamental for data analysis and statistical modeling.
- Data frames can be created using the data.frame() function or by importing data from external sources.
- You can access data frame columns using the dollar sign $ or square brackets [] notation.
- The str() function provides a summary of the structure of a data frame, including data types and dimensions.
- The summary() function provides a statistical summary of the data in a data frame.
- Data frames can be expanded by adding columns or rows using functions like cbind(), rbind(), or by direct assignment.
- Specific rows and columns can be removed from a data frame using subsetting techniques.
- To find the length of a data frame (number of rows), you can use the nrow() function.