Introduction to EDA in Data Mining
Overview
Exploratory Data Analysis (EDA) is an important step in the data mining process that involves analyzing and understanding the data before building any models or making predictions. EDA in data mining allows data mining specialists or data scientists to uncover patterns, relationships, and anomalies in the data, which can help decide subsequent steps in the data mining process.
What is EDA in Data Mining?
Exploratory Data Analysis (EDA) is a technique used in data mining that involves analyzing and summarizing data to gain insights into the data's structure, patterns, and characteristics. EDA is typically the first step in the data mining process. It is used to identify relationships and trends in the data and identify any anomalies or outliers that may need to be addressed.
EDA in data mining can be carried out through various statistical and visualization techniques, such as summary statistics, histograms, scatter plots, and box plots. These techniques help reveal data patterns, such as the distribution of values, correlations between variables, and the presence of outliers or missing values.
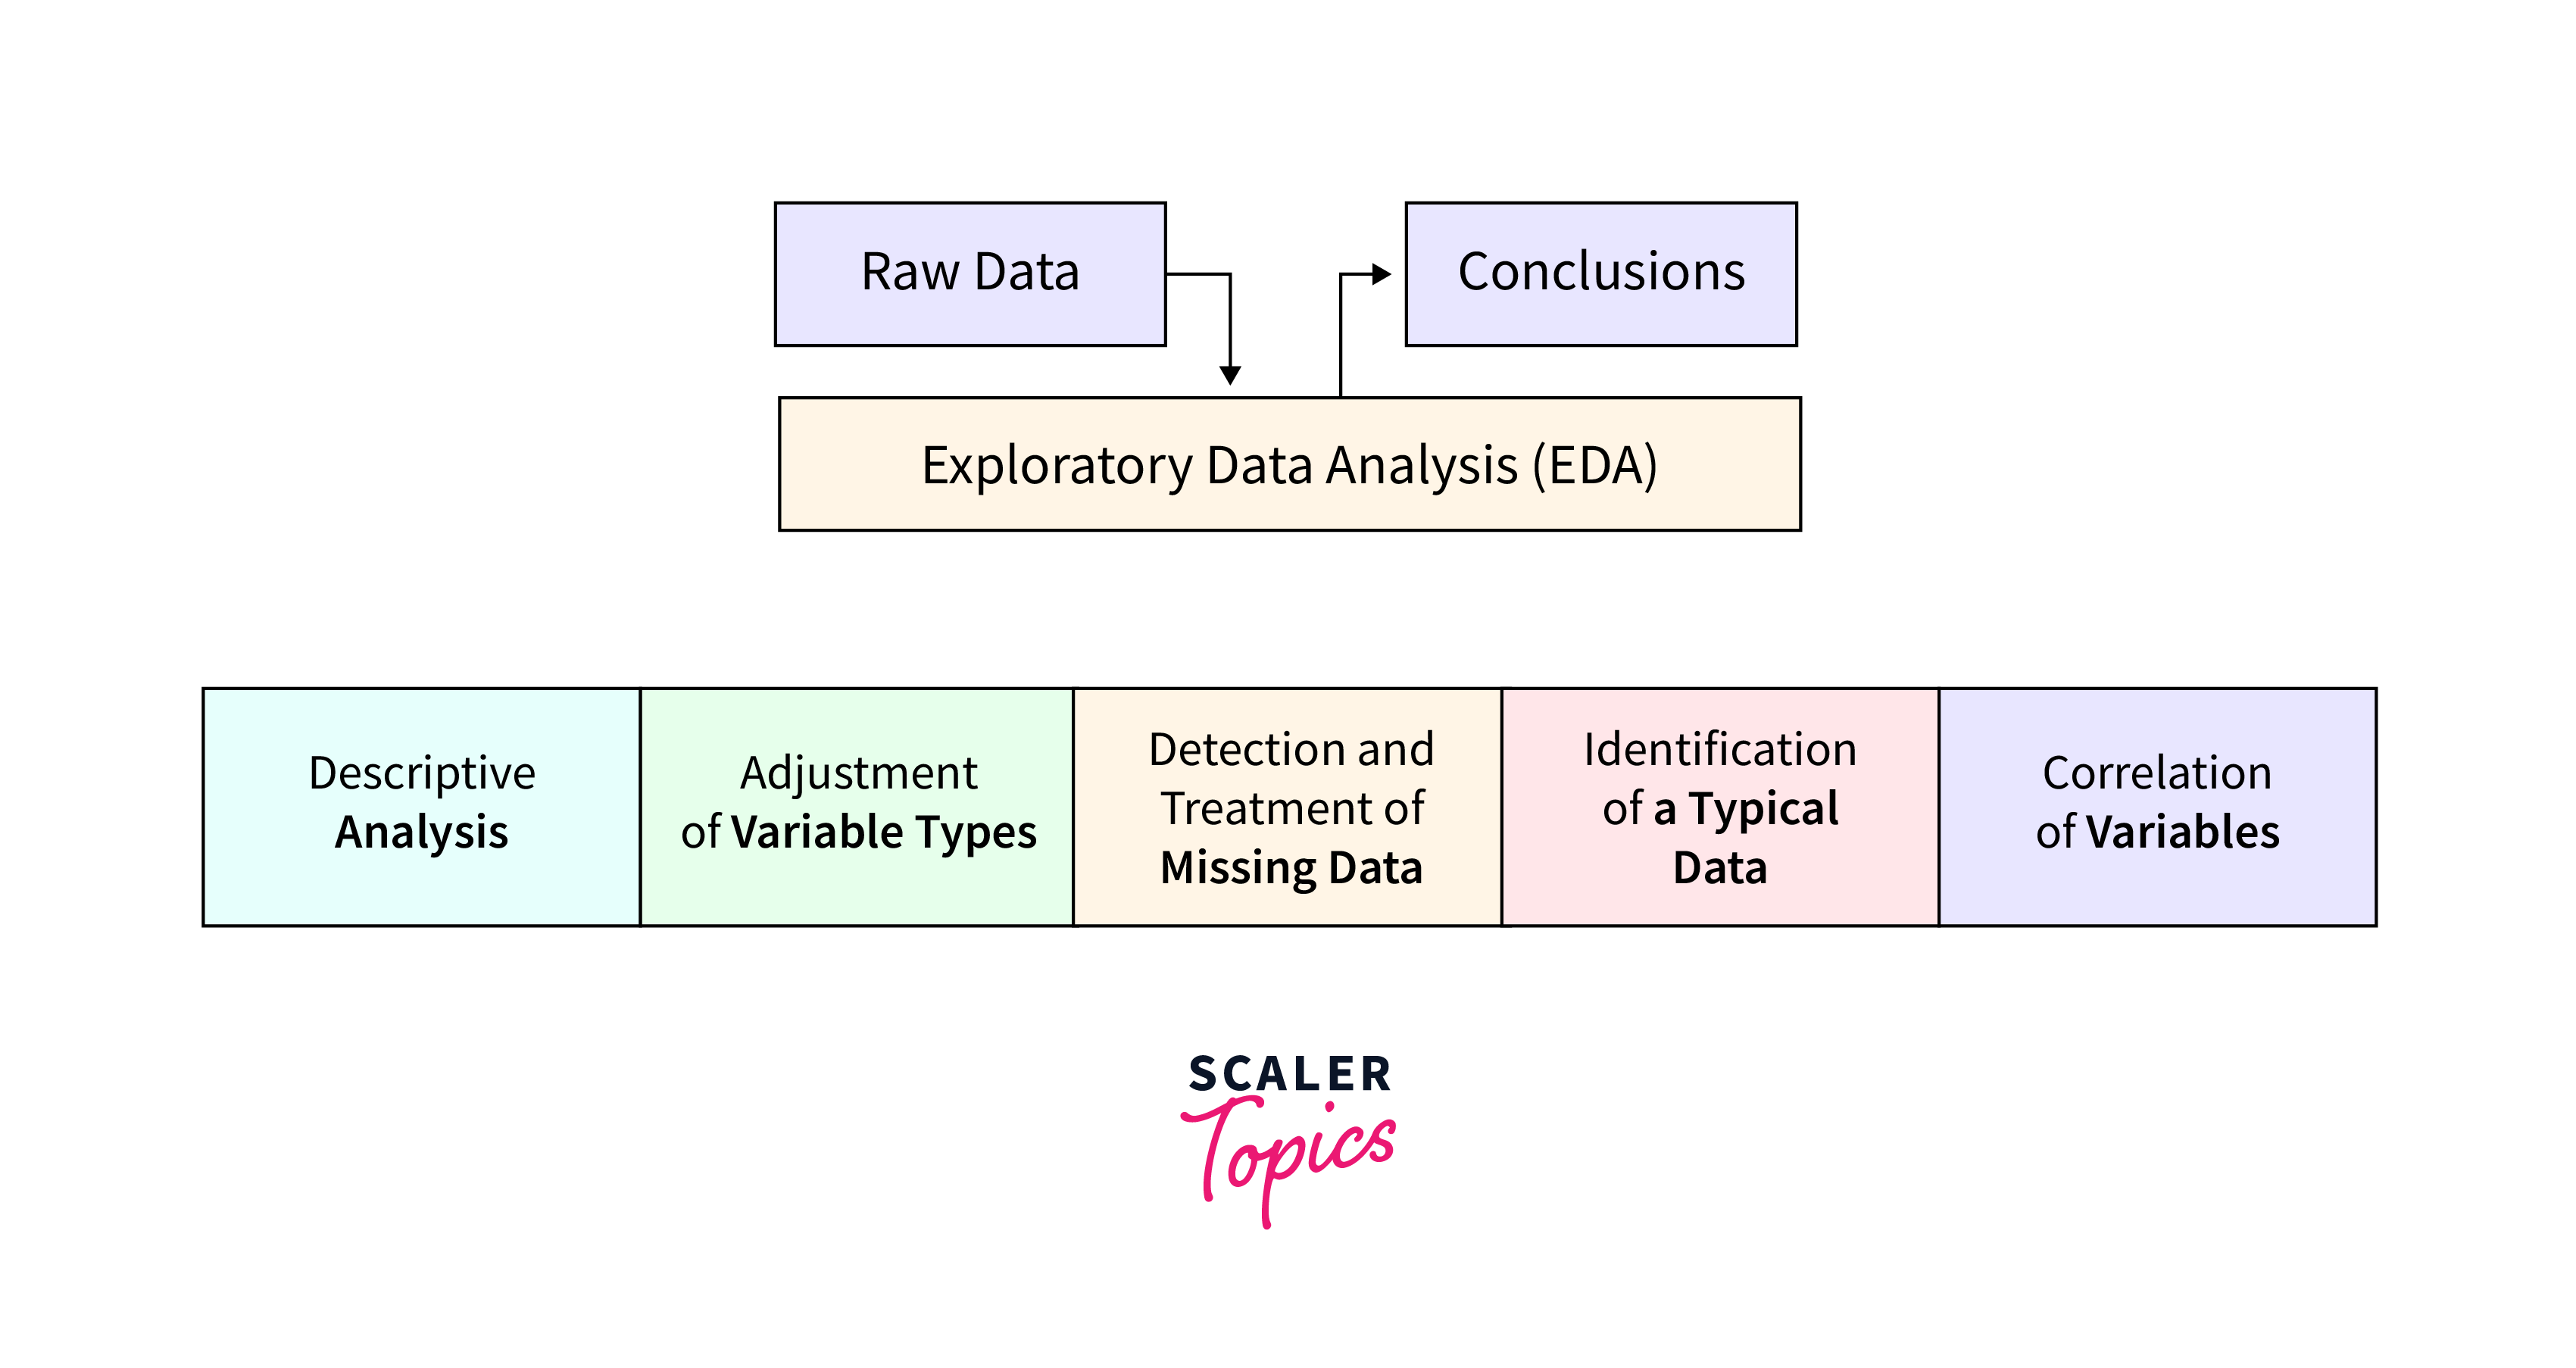
EDA aims to gain a deeper understanding of the data to inform subsequent steps in the data mining process, such as feature engineering, model selection, and prediction. EDA in data mining can be performed using various tools and programming languages, such as R, Python, and Excel, and is a critical component of any data mining project.
Steps Involved in Exploratory Data Analysis
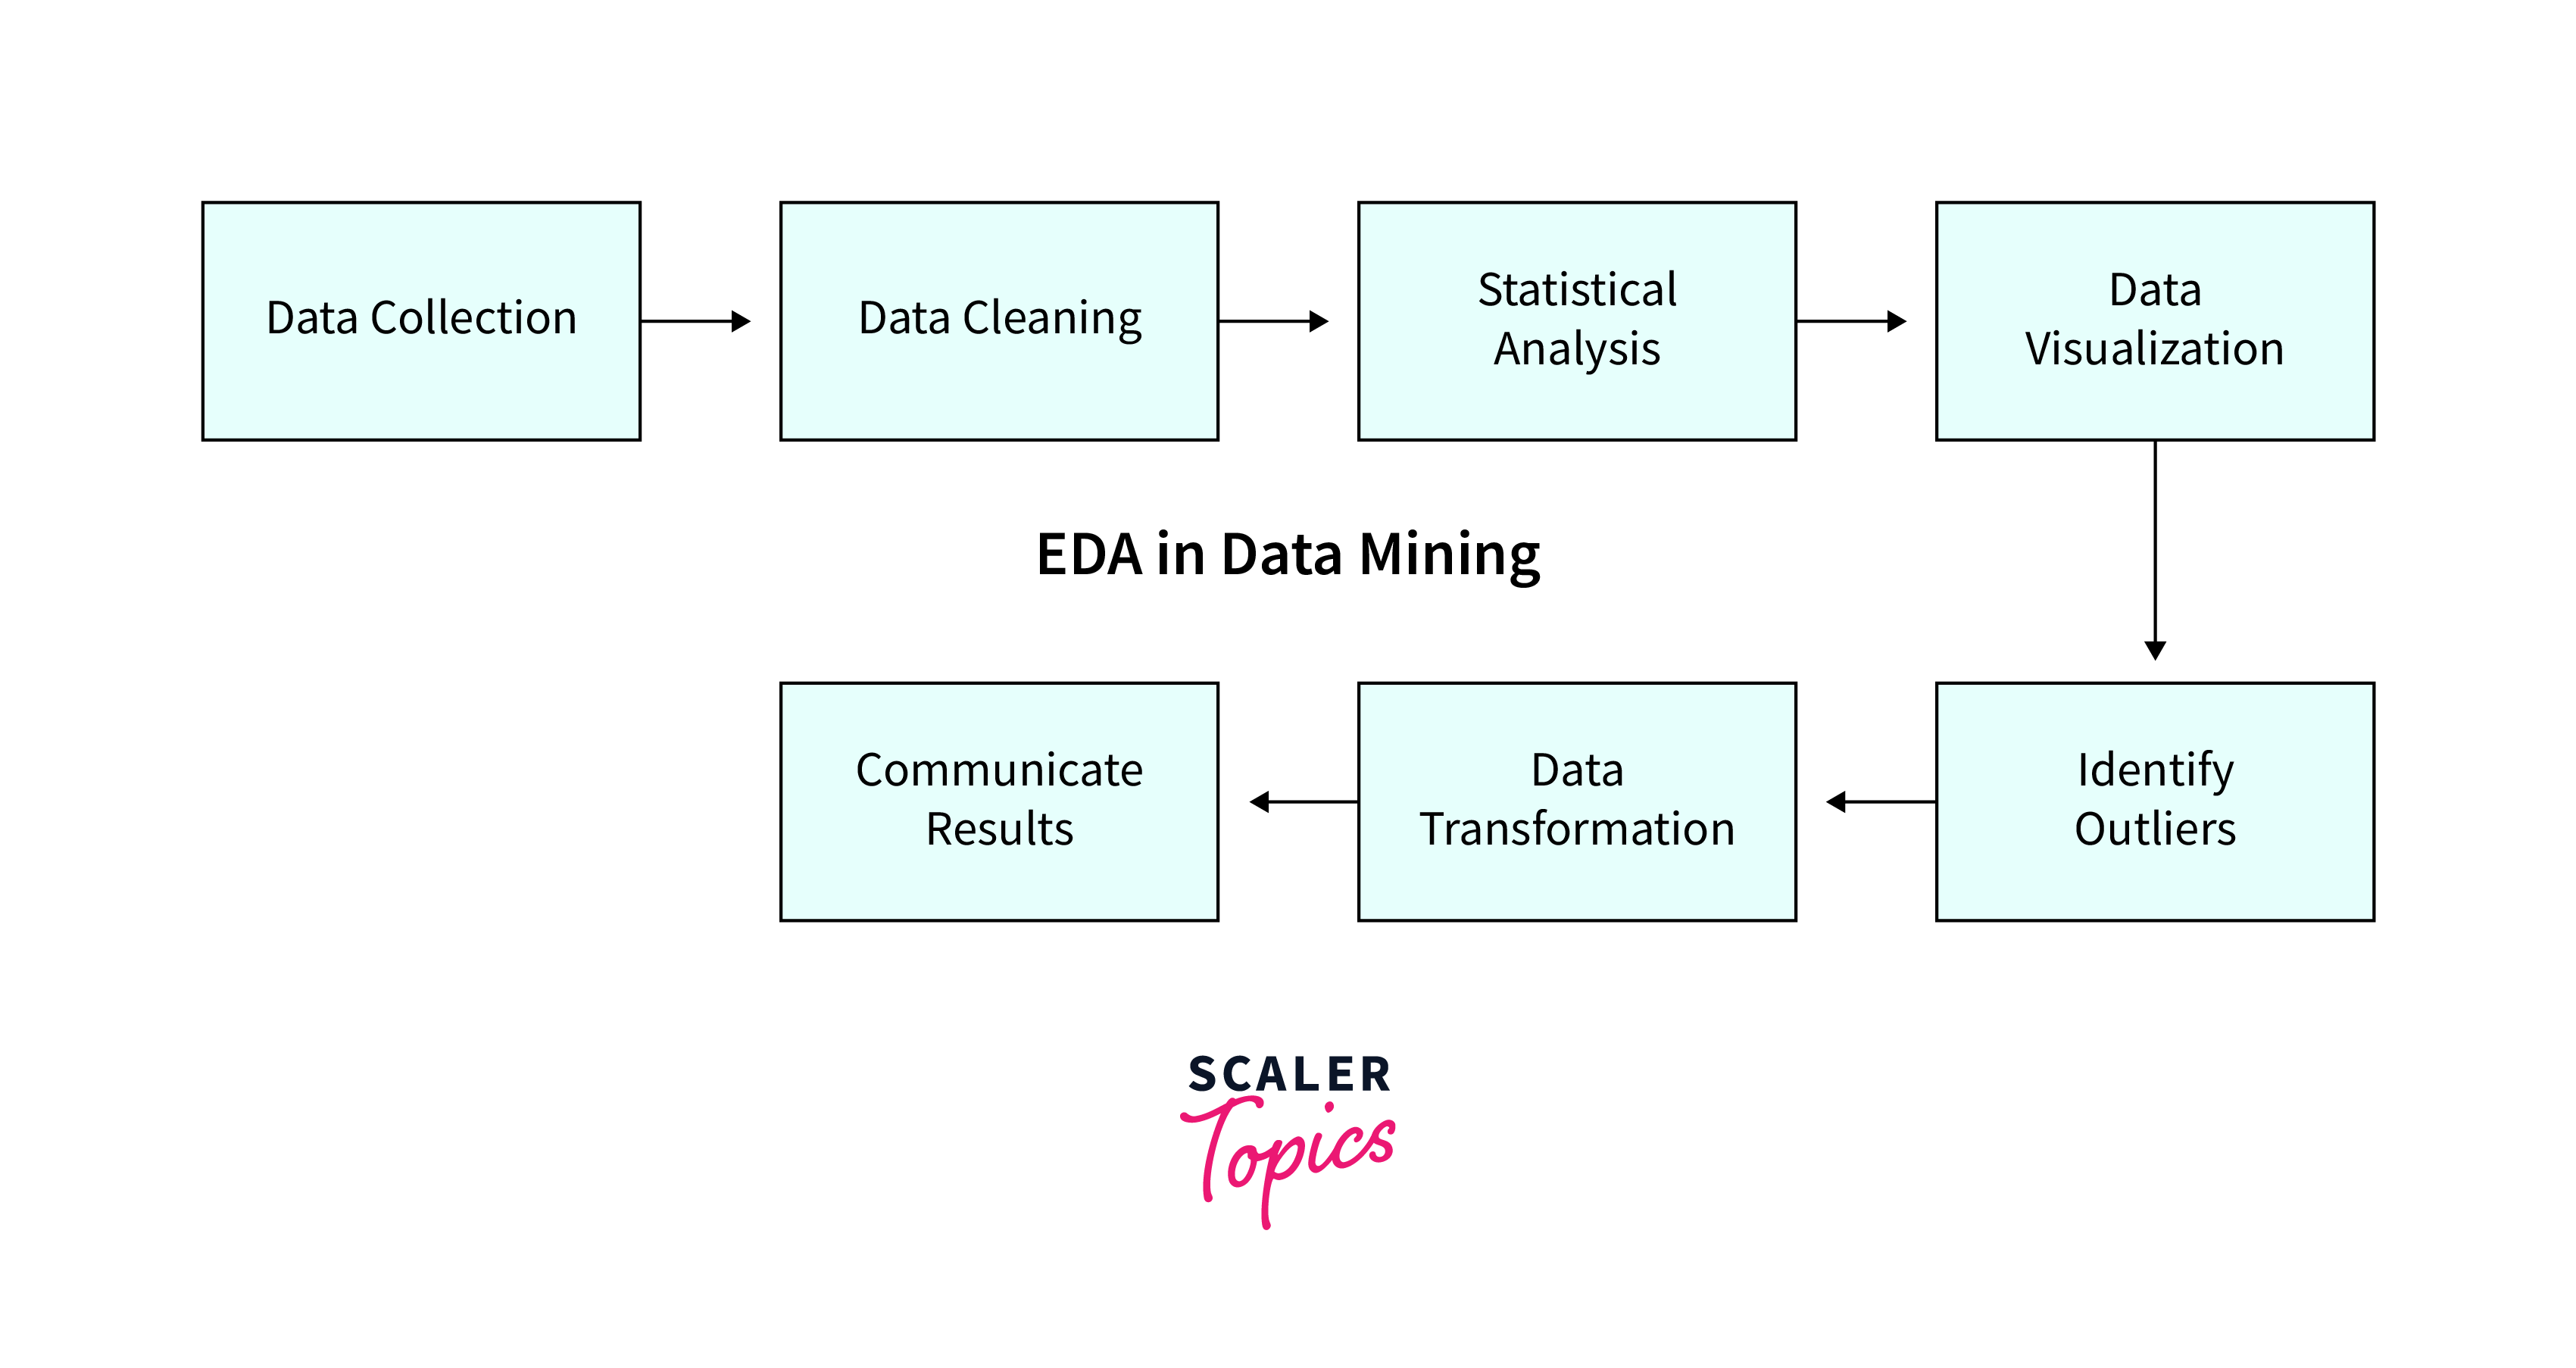
Below are the typical steps involved in the Exploratory Data Analysis (EDA) process in data mining:
- Data Collection:
The first step in EDA in data mining is to collect data from various sources, such as databases, websites, spreadsheets, or other sources. - Data Cleaning:
The next step is to clean the data by identifying and addressing any missing values, inconsistent data types, and other errors. Data cleaning is a critical step in EDA as it ensures that the data is accurate and reliable. - Statistical Analysis:
Statistical analysis involves identifying data correlations, trends, and patterns by applying various statistical techniques, such as hypothesis testing, regression analysis, correlation analysis, and clustering. - Data Visualization:
Data visualization is a key component of EDA in data mining, and it involves creating visual representations of the data to identify patterns and trends. Common visualization techniques include scatter plots, histograms, and box plots. - Detect Outliers:
Outliers are data points that are significantly different from the rest of the data. Identifying outliers is important in EDA in data mining, as they can skew the analysis results. Different methods can be used to identify outliers, such as box plots, scatter plots, and statistical methods. - Data Transformation:
Data transformation involves scaling, encoding, or transforming the data to prepare it for analysis. This step can help to normalize the data and remove any biases or inconsistencies. - Communicate Results:
The final step in EDA in data mining is communicating the analysis results to stakeholders. This involves creating reports, presentations, and other visualizations to communicate the insights gained from the analysis effectively. Effective communication is critical to ensure that the insights are understood and acted upon.
Data Visualization
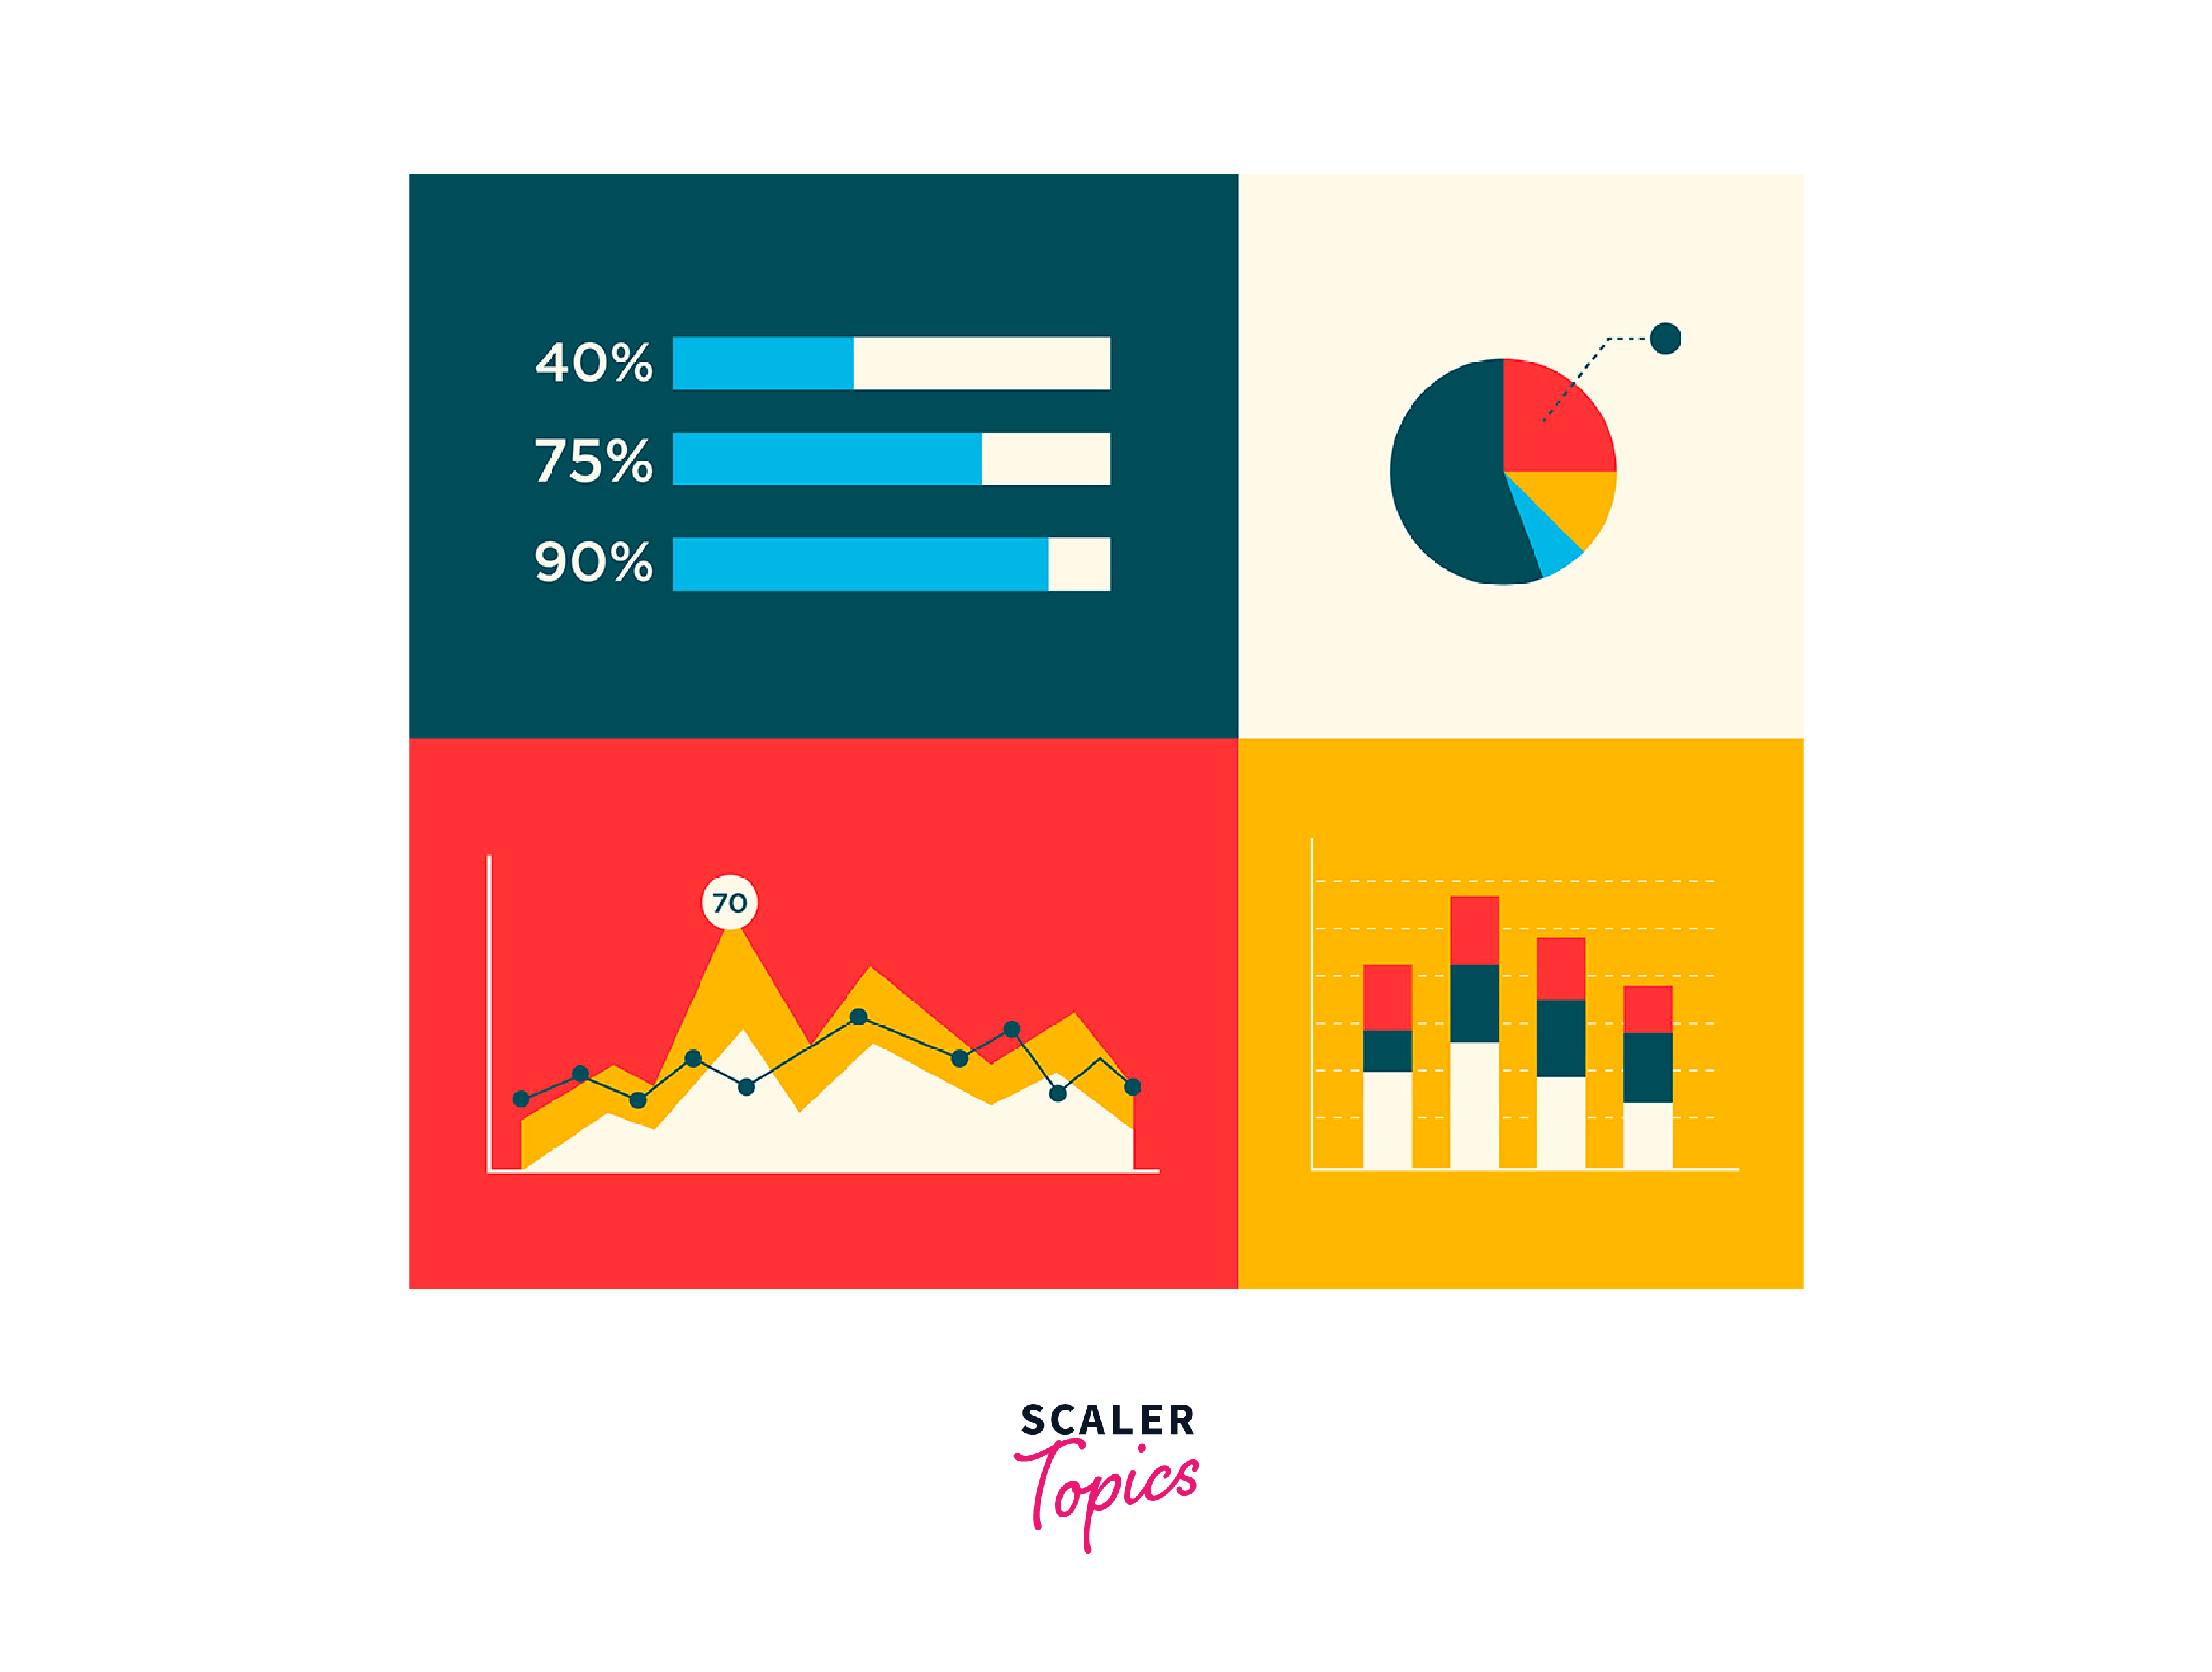
Data visualization is the graphical representation of data that is used to communicate information and insights to stakeholders. Data visualization is an essential component of Exploratory Data Analysis (EDA) as it helps to identify patterns and trends in the data that may not be evident from the raw data alone.
Visualizing data allows data mining professionals to explore the relationships between variables, identify outliers, and understand the distribution of values in the data. This helps analysts gain a deeper understanding of the data that may not be apparent through other methods, such as numerical or statistical analysis. Also, data visualization helps to communicate complex information to key stakeholders and partners in an easily understandable and visually appealing way.
Many different types of data visualizations can be used in EDA in data mining, including scatter plots, histograms, box plots, and heat maps. Each type of visualization is used to convey different types of information and is suitable for different types of data. For example, scatter plots are used to visualize the relationship between two continuous variables, while histograms are used to visualize the distribution of a single variable.
Handling Outliers in Data
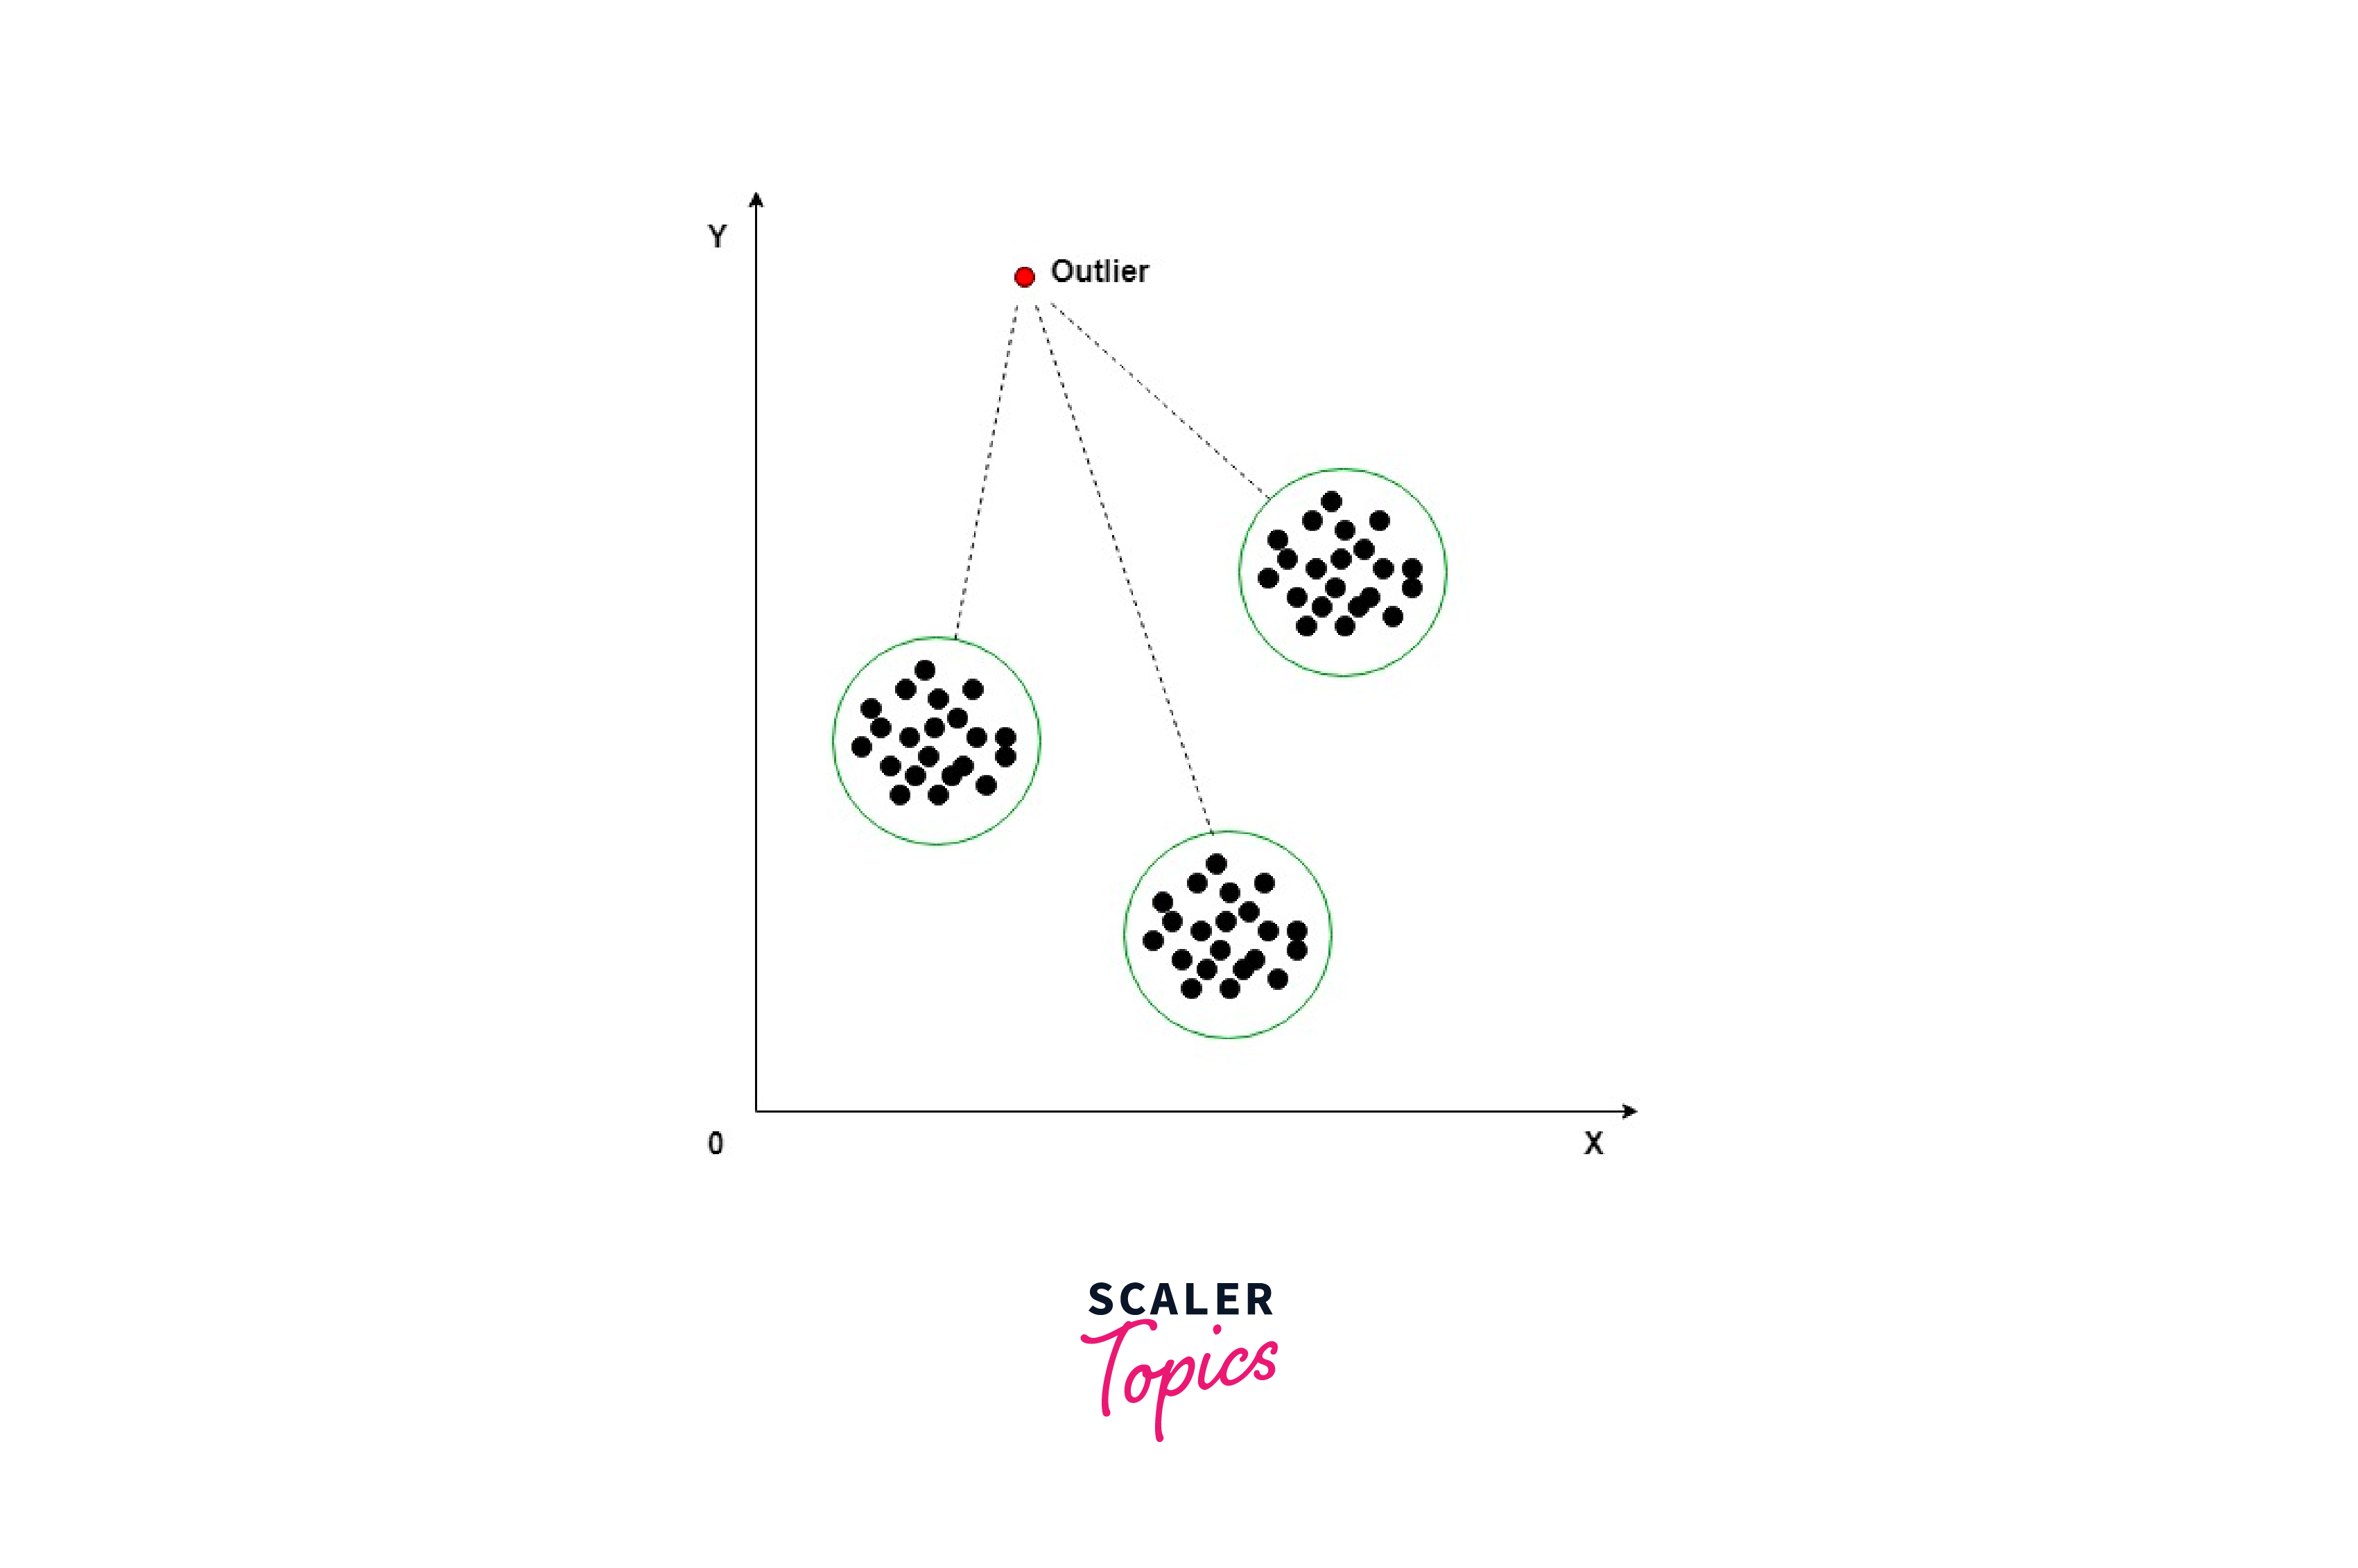
Outliers are data points that are significantly different from the rest of the data. They can occur due to measurement errors, data entry errors, or simply because of natural variability in the data. Outliers can be problematic in EDA because they can skew the analysis results and lead to inaccurate insights.
One common approach to handling outliers is to remove them from the dataset. However, this approach should be used cautiously, as removing outliers can also remove valuable information from the dataset. Another approach is to transform the data, making outliers less extreme. For example, the log transformation is commonly used to handle data with a large range of values. Alternatively, they can be analyzed separately from the rest of the data. This approach can help to identify unique patterns or trends that may be present in the outliers.
Various techniques can be used to identify outliers, such as box plots, scatter plots, z-score, IQR, standard deviation, etc.
Covariance & Correlation
Covariance and correlation are two statistical concepts commonly used in EDA to understand the relationships between variables in a dataset.
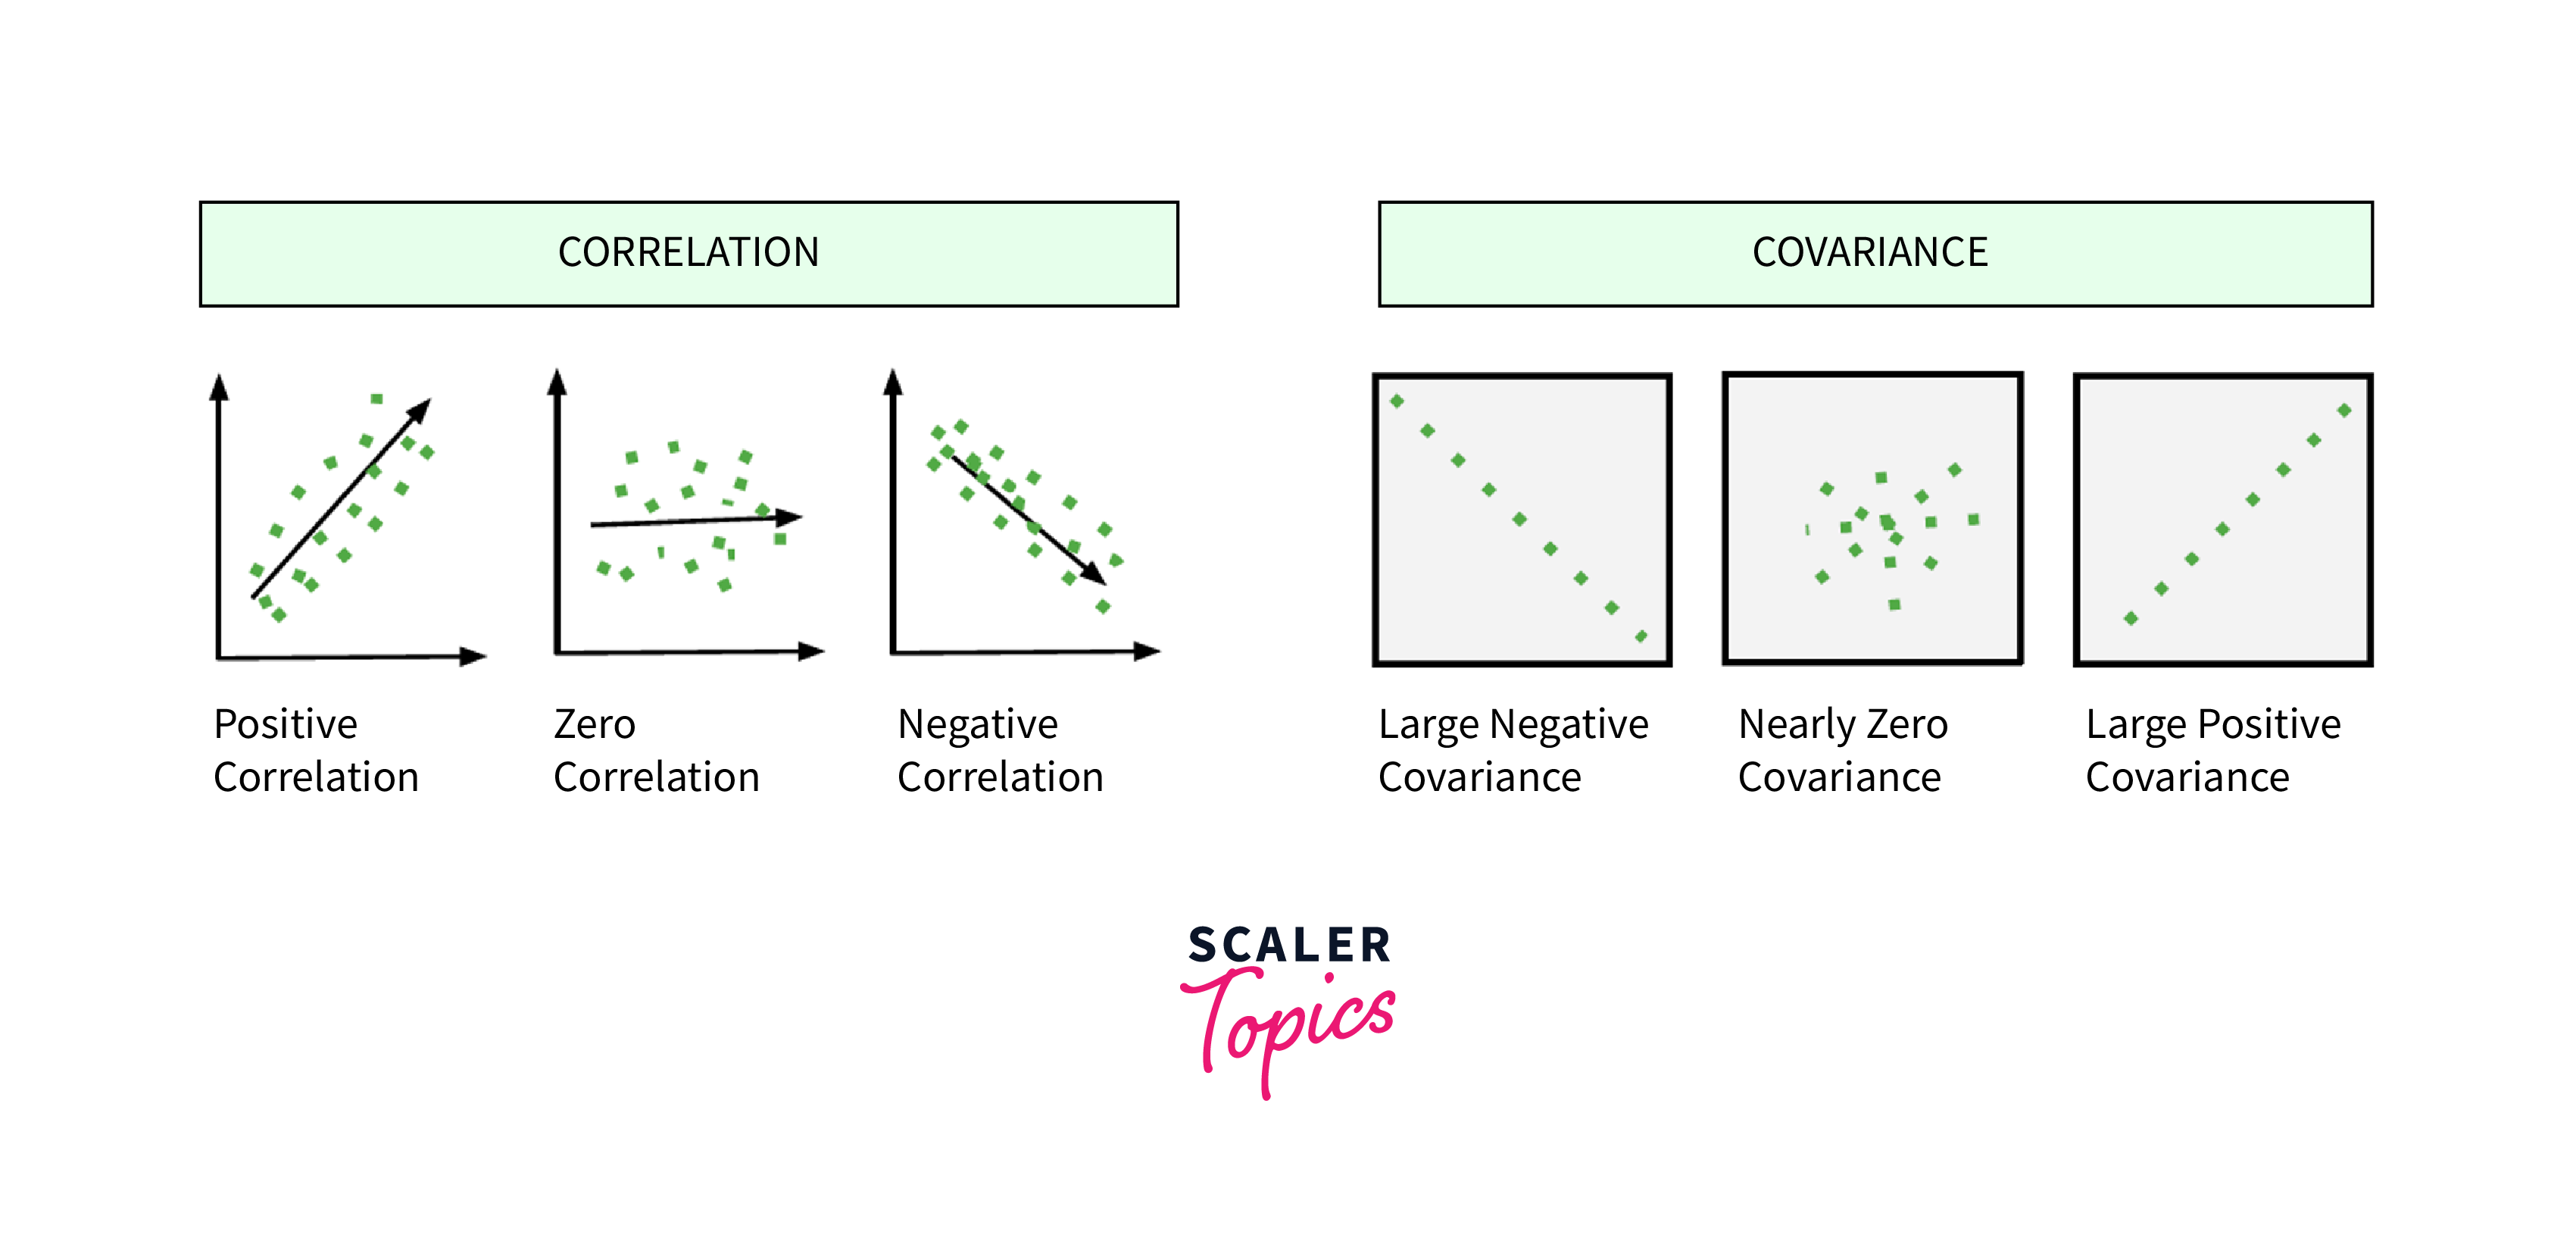
Covariance is a measure of the joint variability of two random variables. It is used to determine how two variables are related to each other. If the covariance is positive, then the two variables tend to increase or decrease together. If the covariance is negative, then the two variables tend to move in opposite directions.
Correlation is a standardized version of covariance that measures the strength and direction of the relationship between two variables. It ranges from: 1 to +1, where: 1 indicates a perfectly negative correlation, 0 indicates no correlation, and +1 indicates a perfectly positive correlation. Correlation is used to determine the degree to which two variables are related to each other.
In EDA, covariance and correlation are used to identify relationships between variables in a dataset. For example, if a dataset contains information on people's age and income, we could use covariance or correlation to determine if there is a relationship between these two variables. If there is a positive correlation, we could conclude that their income increases as people age. If there is a negative correlation, we could conclude that their income decreases as people age. Covariance and correlation can also identify redundant or highly correlated variables. This can be important in feature selection, where we want to select only the most relevant features for the prediction task.
Data Transformation
Data transformation is the process of converting, transforming, or manipulating data to improve its quality or make it easier to analyze. It is used in EDA in data mining to prepare data for analysis and to ensure that it meets the assumptions of statistical models.
There are several common types of data transformation, such as scaling, encoding, and log transformations. Scaling is used to adjust the range of values in the data to a common scale, making it easier to compare across variables. Encoding converts categorical variables into numerical values that can be used in statistical models. Log transformations adjust the data distribution to a more normal shape, making it easier to use in statistical models that assume normality.
Data transformation is an important step in EDA in data mining because it can improve the accuracy and reliability of the analysis. Additionally, data transformation can reveal patterns and relationships in the data that were not apparent before.
One Hot Encoding
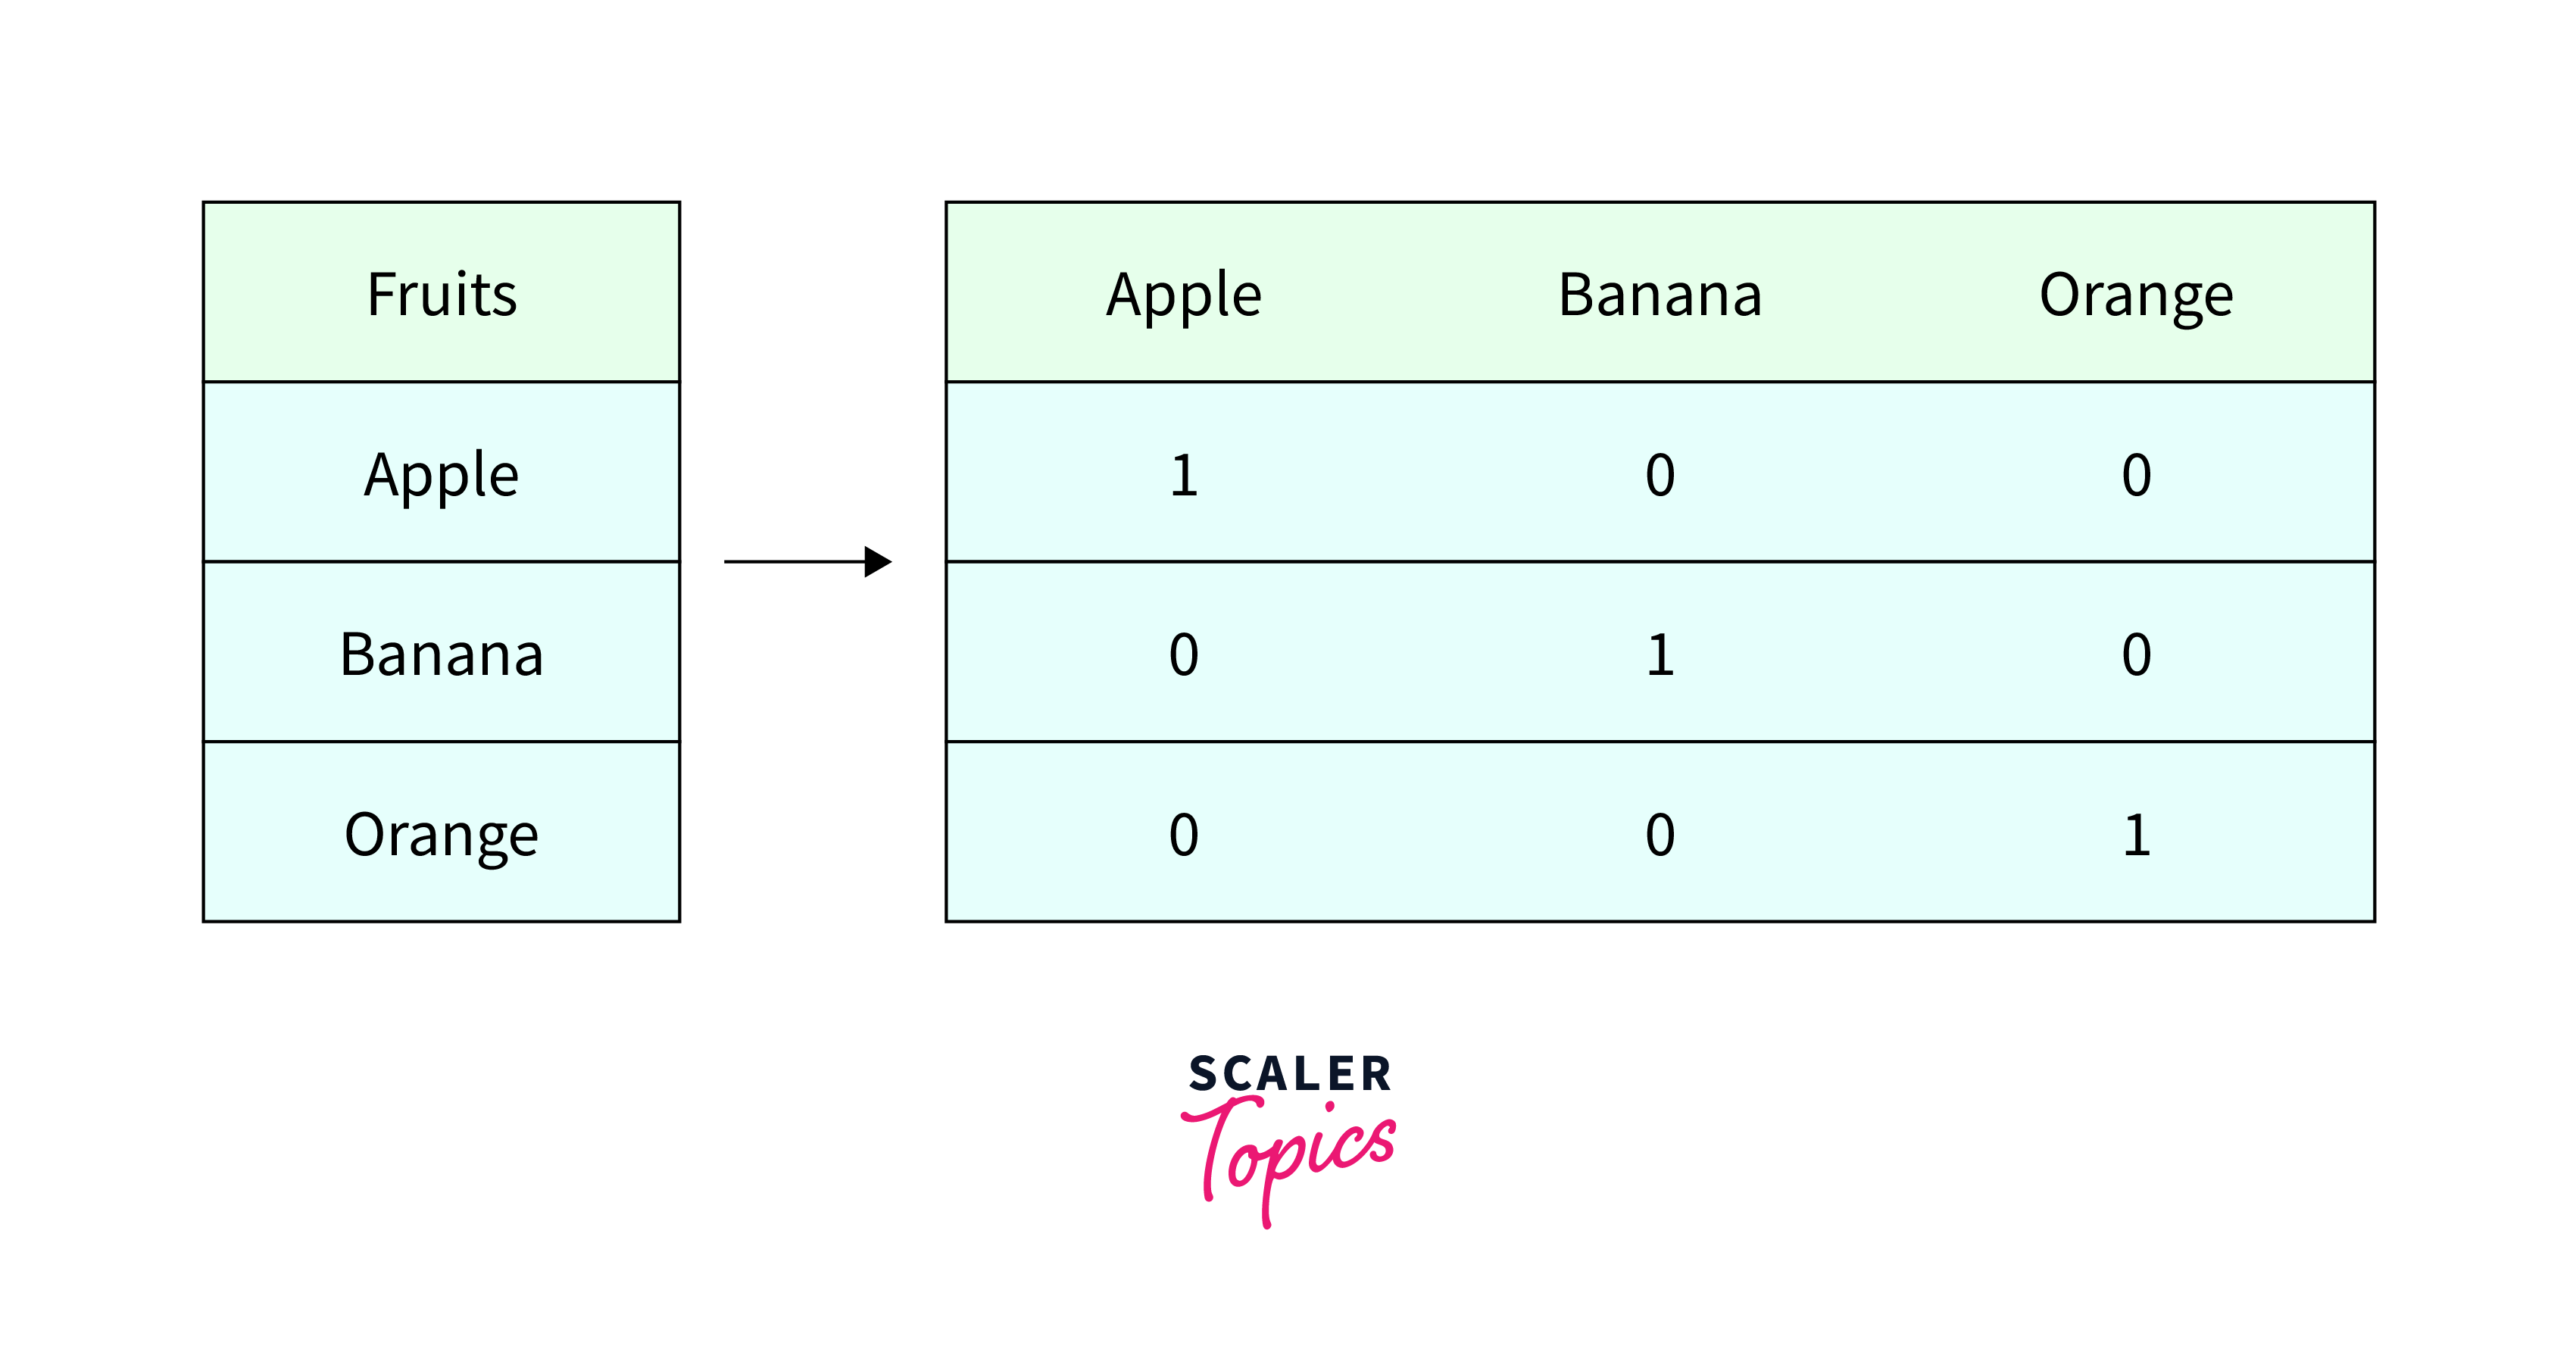
One hot encoding is a technique used in EDA in data mining to convert nominal categorical variables into a numerical format that can be used in statistical models. It creates binary variables for each category, where a value of 1 indicates that the observation belongs to that category, and a value of 0 indicates that it does not.
One hot encoding is used because many statistical and ML models require numerical data for analysis and processing. Categorical variables, such as color or country, are not numerical and cannot be used directly in many models. One hot encoding allows these variables to be transformed into numerical variables that can be used in statistical models. For example, suppose we have a dataset that includes a categorical variable for "fruit type" with values of "apple", "banana", and "orange". One hot encoding would create three binary variables for each fruit type, where a value of 1 indicates that the observation belongs to that category, and a value of 0 indicates that it does not. These new variables could further be used in statistical or ML models.
Ordinal Encoding
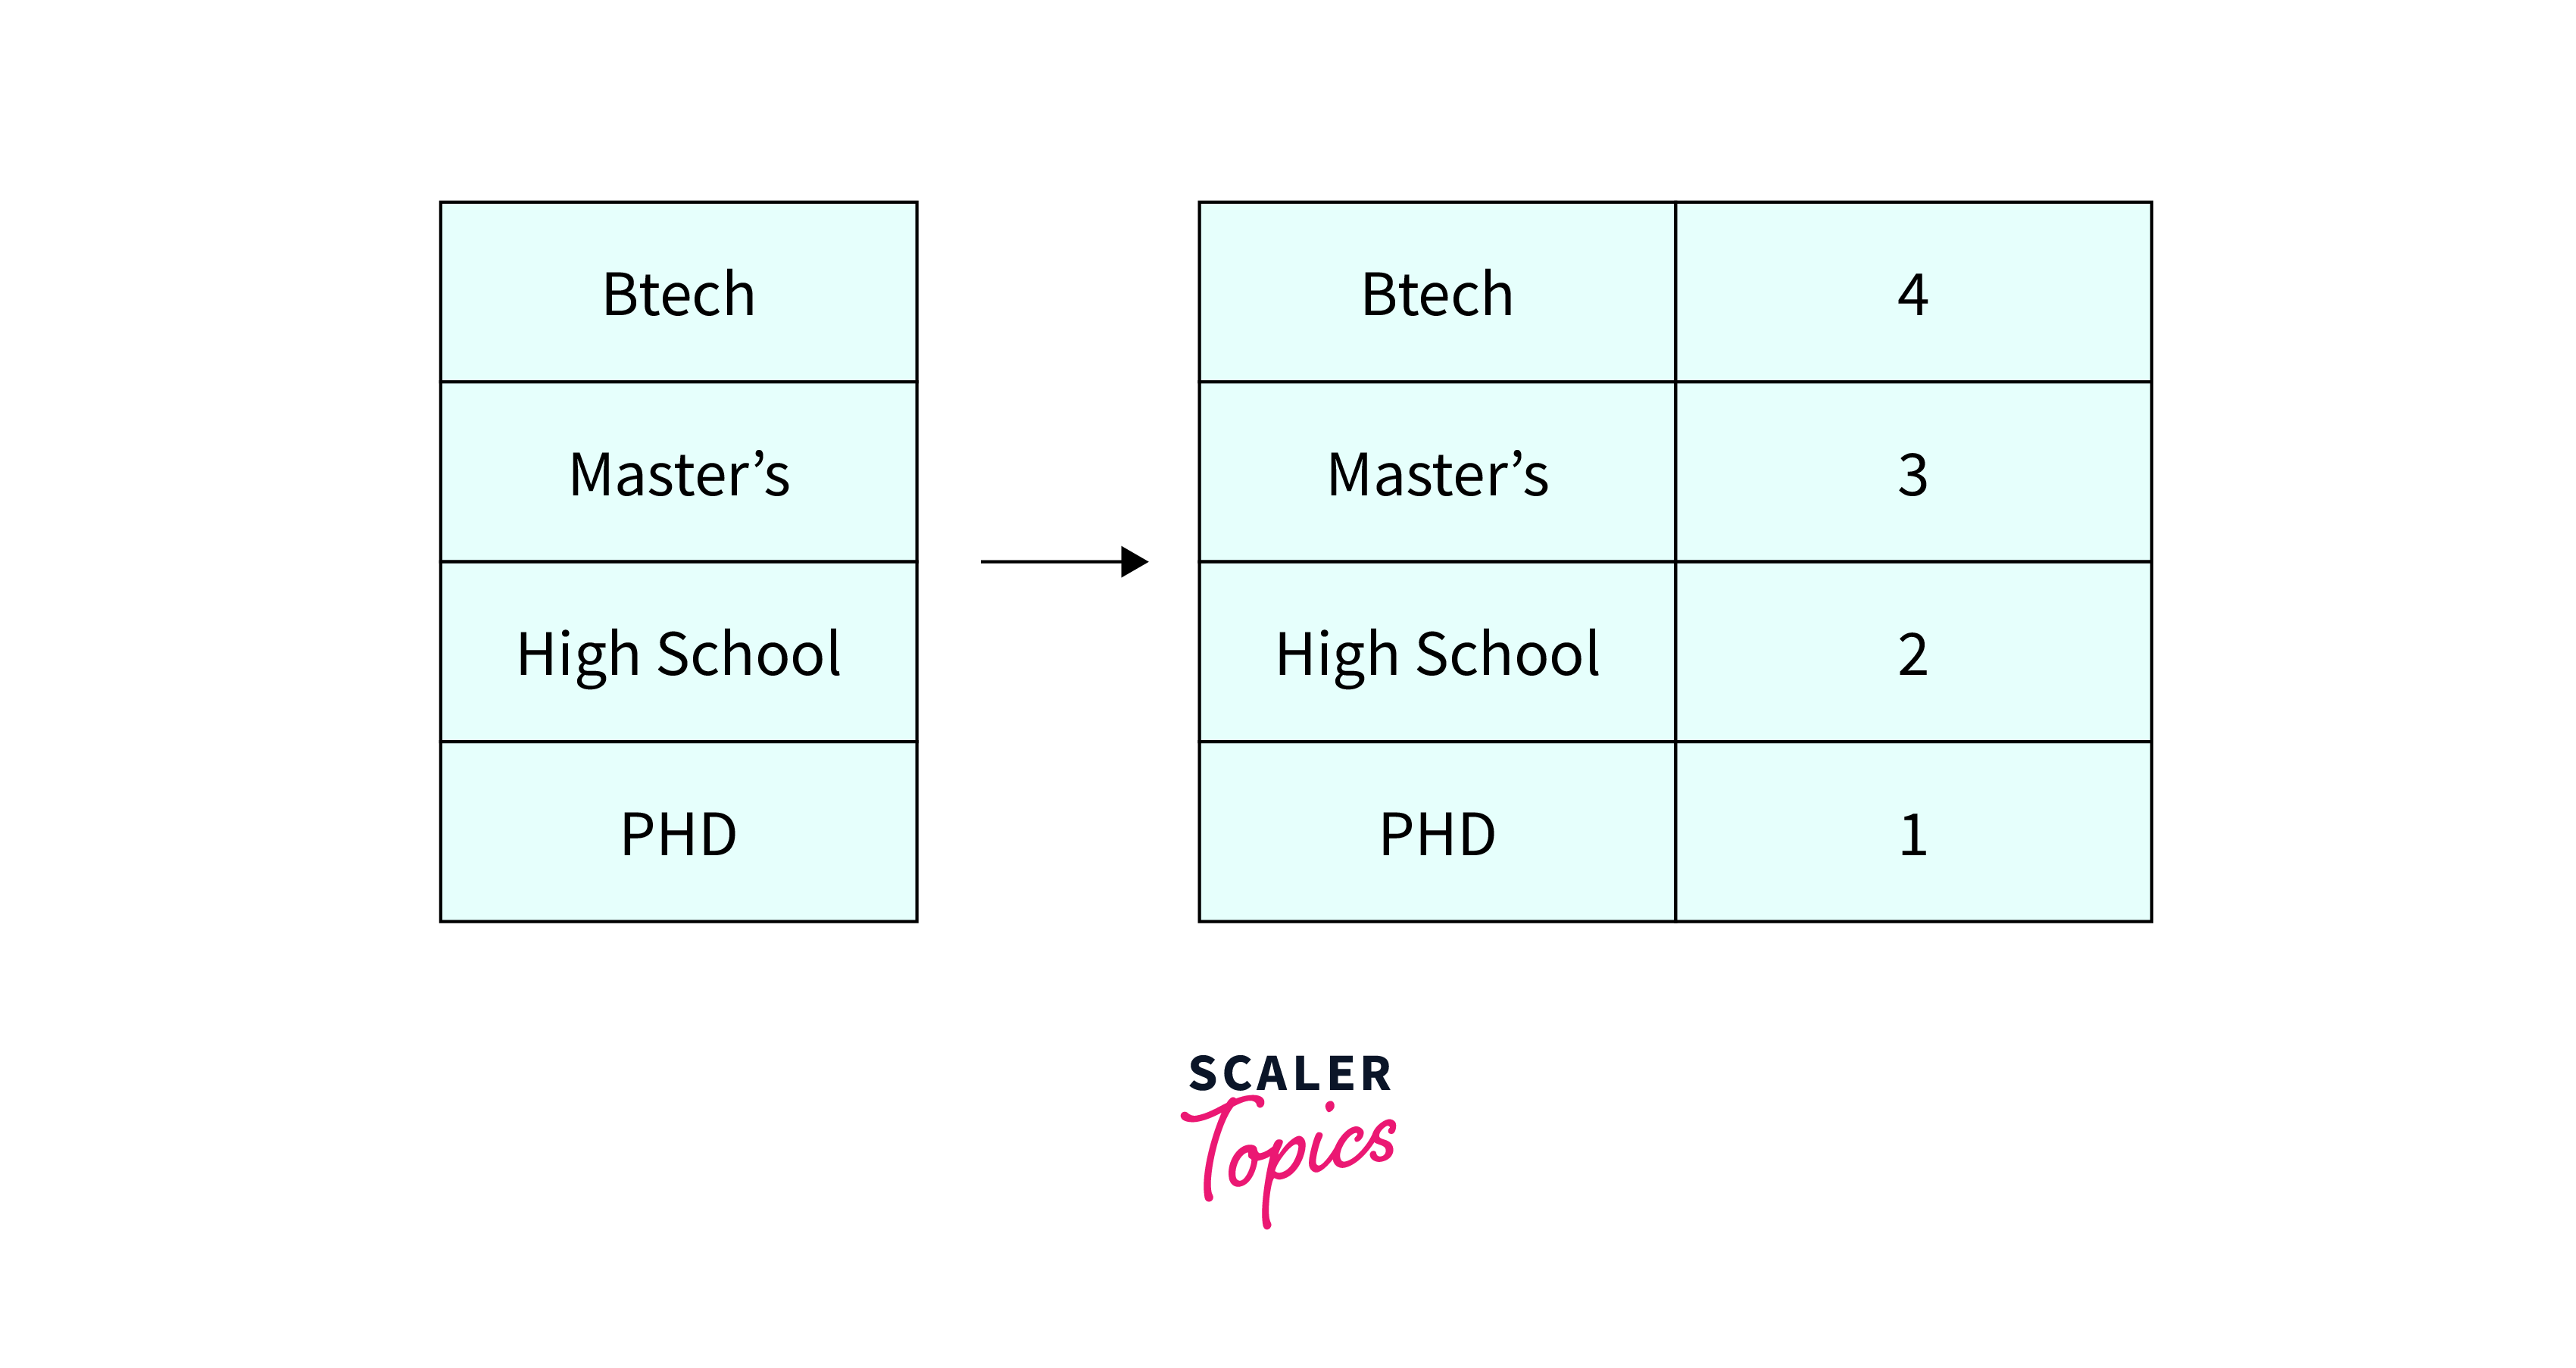
Ordinal encoding is a technique used to convert ordinal categorical variables which contain an inherent order, such as "low", "medium", and "high", into numerical variables. It assigns a numerical value to each category based on its order, with a higher number indicating a higher rank.
Ordinal encoding is used in EDA because it preserves the order of the categories, which can be important in many statistical models. For example, suppose we have a dataset that includes an ordinal categorical variable for "education level" with values of "high school", "B.Tech.", "Master’s degree" and "Ph.D.". Ordinal encoding would assign a numerical value to each category based on its rank, with "high school" being 1, "B.Tech." being 2, "Master’s degree" being 3, and "Ph.D." being 4.
Conclusion
- EDA in data mining is an important technique that allows us to gain insight into our data, identify patterns and relationships, and make informed decisions.
- By following a structured process that involves collecting, cleaning, analyzing, visualizing, and transforming data, we can effectively prepare our data for use in statistical models and predictive analytics.
- EDA in data mining helps us to identify outliers, understand the distribution of our data, and determine the best methods for data transformation and encoding, ultimately leading to more accurate and meaningful results.
