Statistics For Data Science

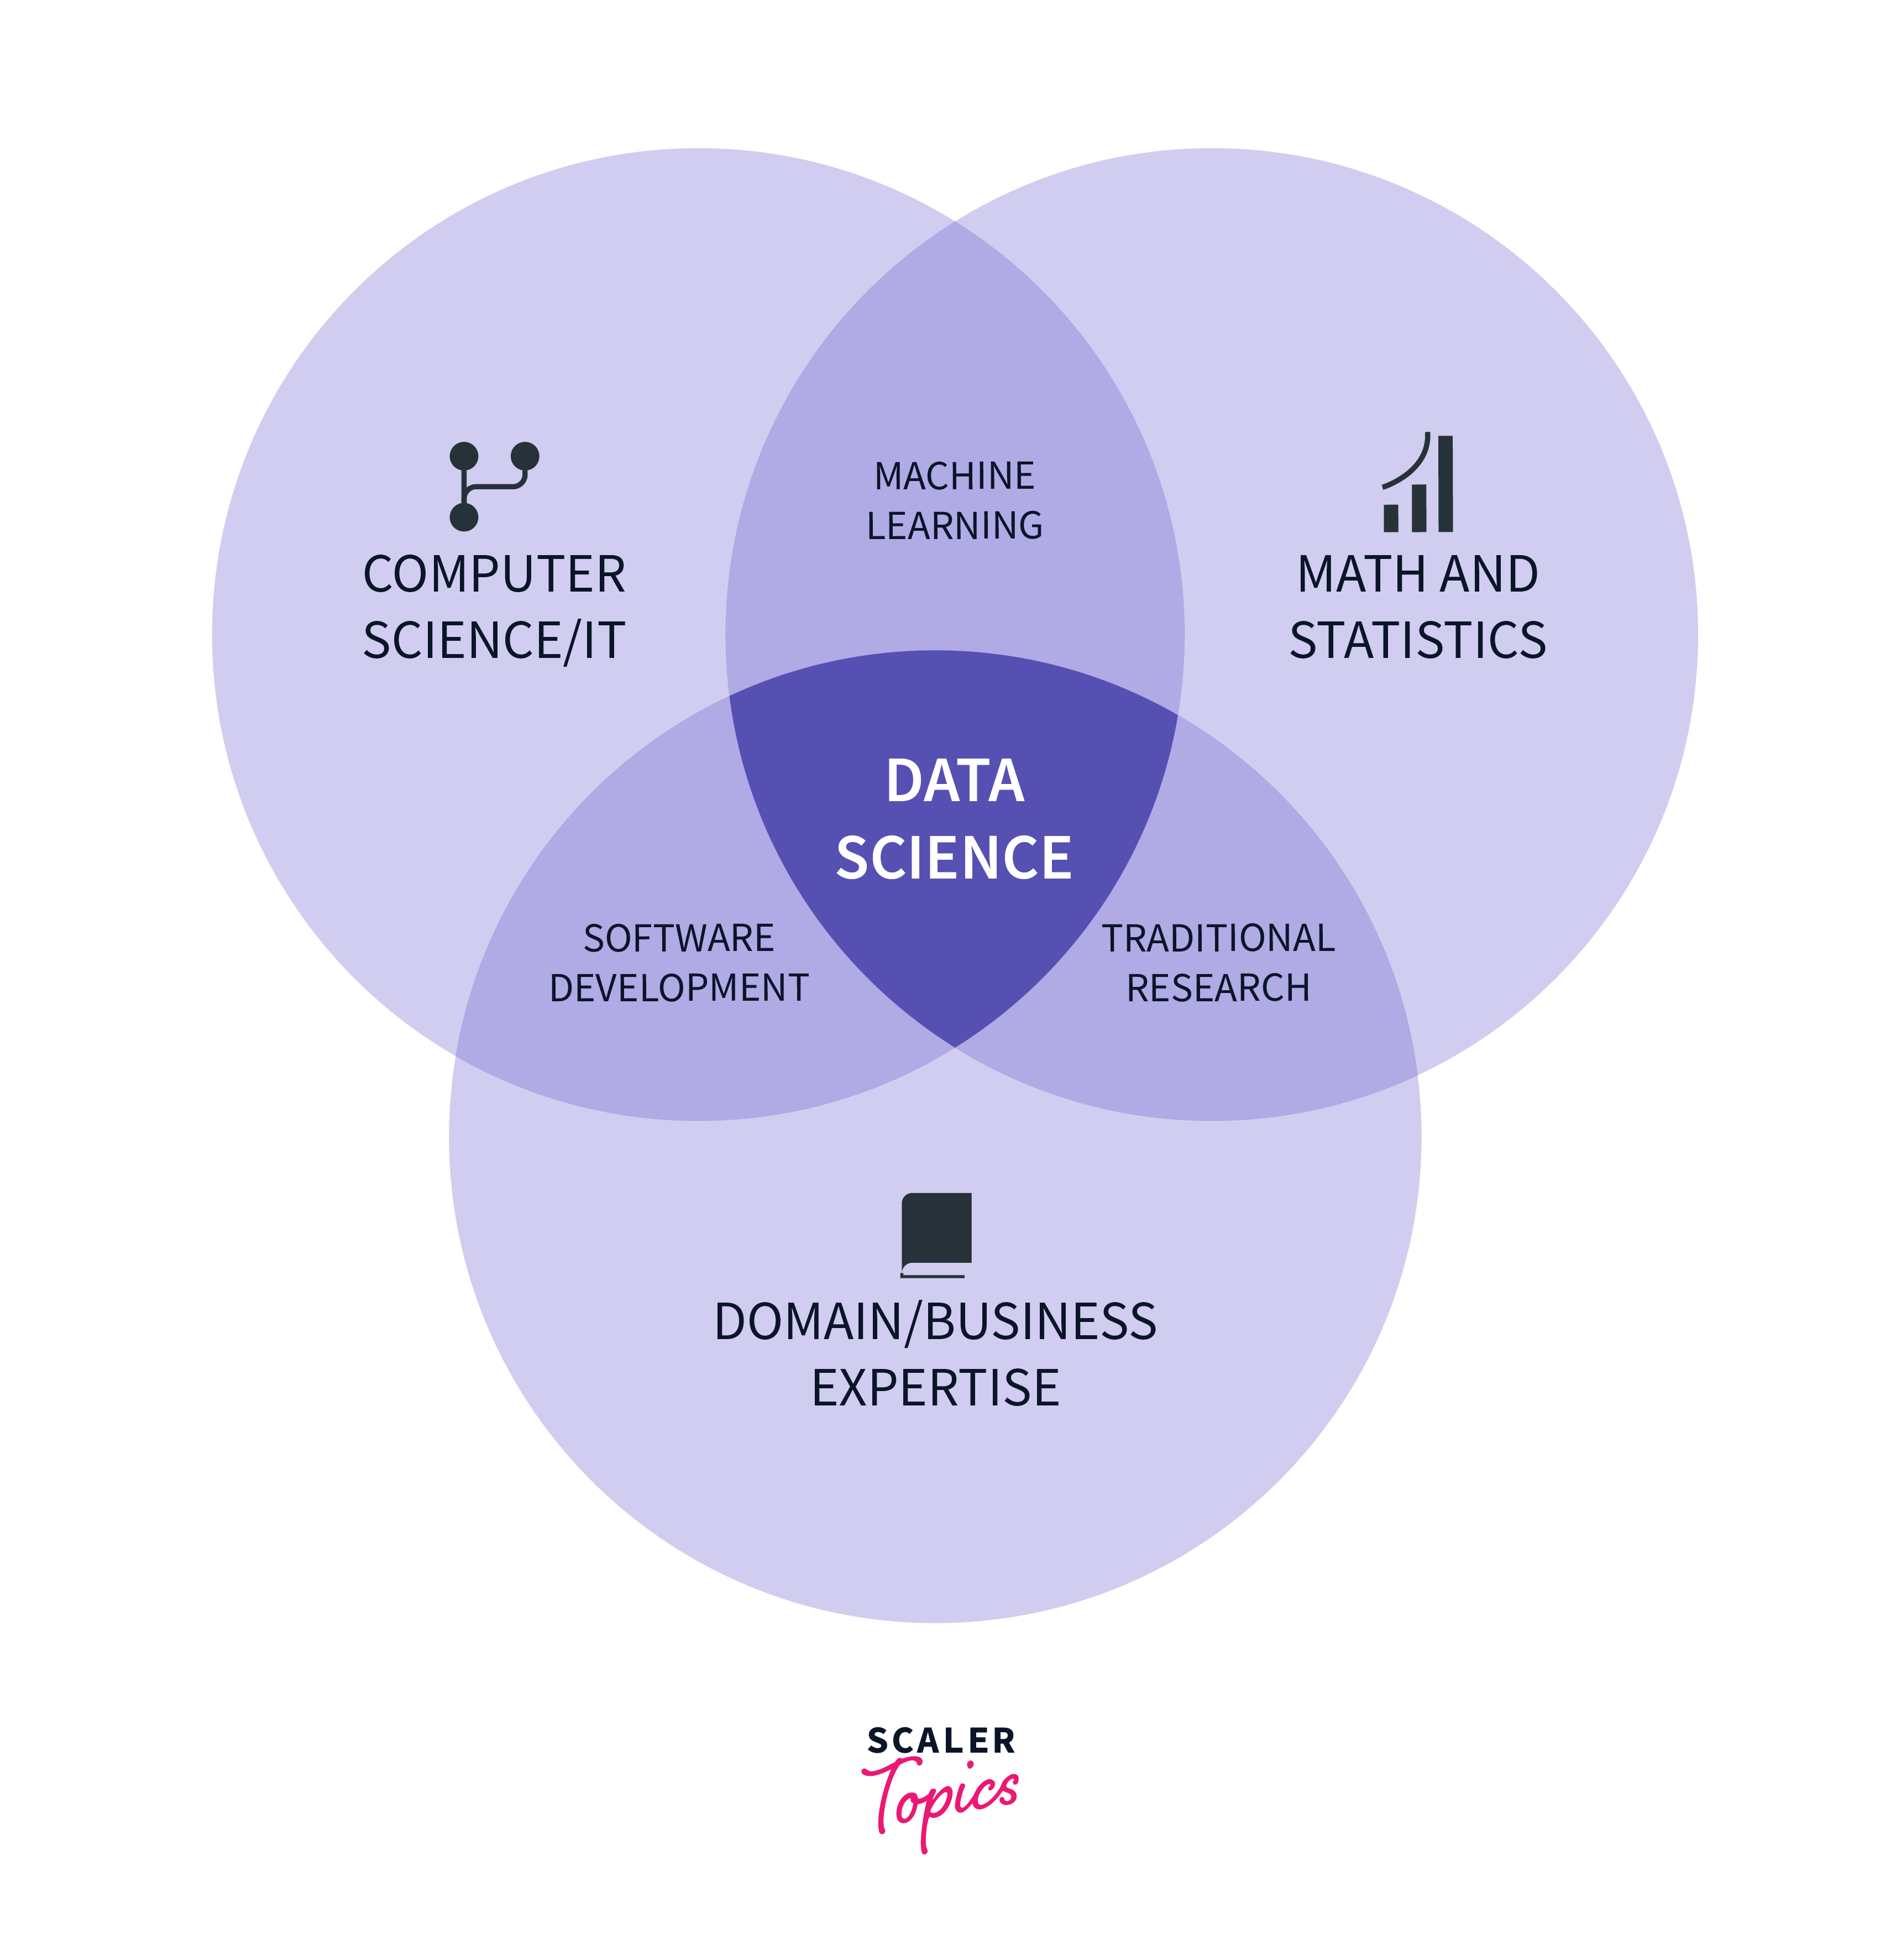
Statistics is the backbone of data science, providing the tools and techniques to extract meaningful insights from vast and complex datasets. It involves the collection, analysis, interpretation, presentation, and organization of data. In the realm of data science statistics serves as a crucial tool to unravel patterns, trends, and relationships within the data, enabling informed decision-making.
Importance of Statistics in Data Science

-
Data Exploration: Statistics for data science serve as the compass in the initial stages of data exploration, guiding data scientists to unravel the distribution, central tendencies, and variability within datasets. It provides a foundational understanding that aids in identifying potential insights and challenges within the data.
-
Pattern Recognition: Statistical methods are the lens through which data scientists identify patterns, correlations, and anomalies in datasets. This capability is crucial for extracting valuable information, revealing hidden trends, and uncovering relationships contributing to informed decision-making.
-
Inference and Prediction: Statistics for data science is the key to making sense of sample data and extrapolating insights to broader populations. It forms the basis for building predictive models, allowing data scientists to anticipate future trends and outcomes with a degree of confidence.
-
Data-driven Decision Making: Statistics for data science offers a systematic framework for analysis, empowering organizations to embrace data-driven decision-making. By reducing uncertainty and providing quantitative insights, statistics for data science ensures that decisions are grounded in empirical evidence, ultimately enhancing the likelihood of organizational success.
Types of Statistics

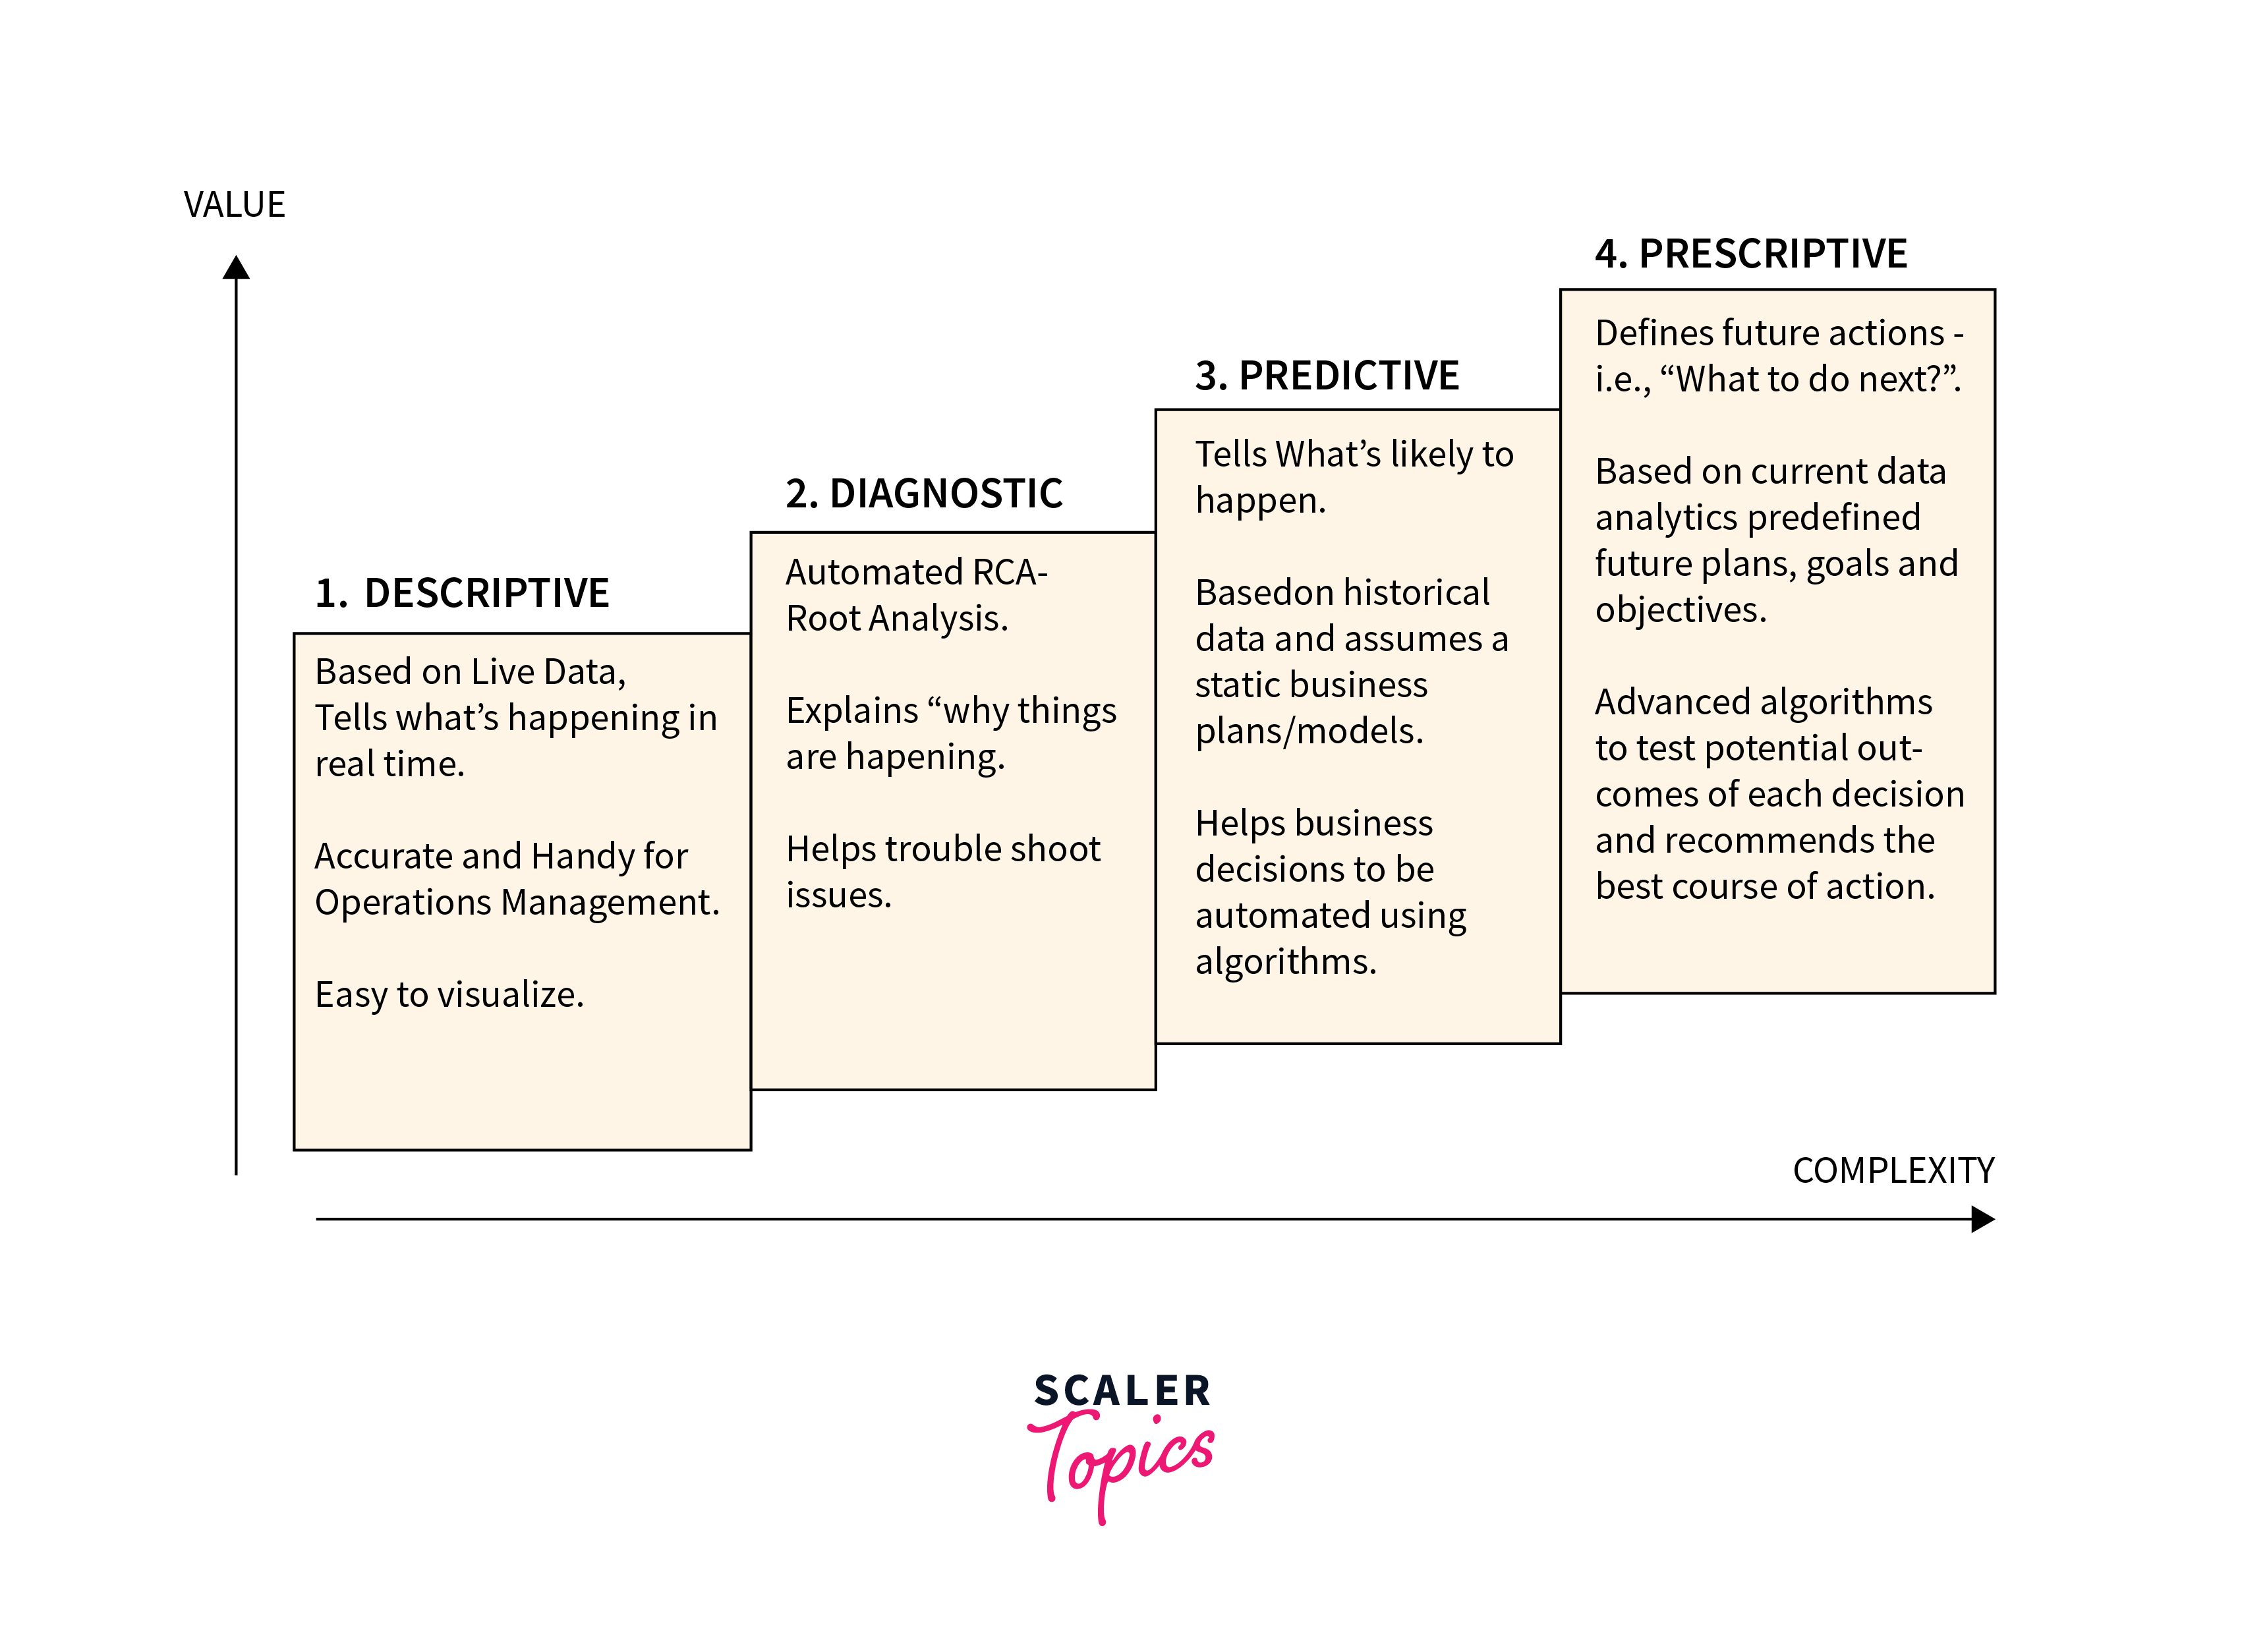
Descriptive Analytics
- Definition: Descriptive analytics is the initial phase of statistical analysis that involves summarizing and describing the main features of a dataset. The primary objective is to provide a concise and understandable overview of the essential characteristics of complex data.
- Application: Descriptive statistics include various measures that capture different aspects of the dataset. The mean (average) gives a central tendency, while the median provides the middle value. Mode identifies the most frequent value, and standard deviation quantifies the spread or dispersion of the data. Graphical representations like histograms visually portray the distribution of data, offering insights into patterns, skewness, and outliers within the dataset.
Diagnostic Analytics
- Definition: Diagnostic analytics focuses on examining historical data to understand the underlying reasons for specific events or outcomes. It aims to uncover the root causes behind observed patterns, anomalies, or deviations from expected results.
- Application: Diagnostic analytics involves various techniques to delve into the reasons for observed phenomena. Root cause analysis helps identify the fundamental factors contributing to a specific outcome or problem. Trend analysis explores historical patterns over time to understand the dynamics of change, while correlation studies examine relationships between different variables. By understanding cause-and-effect relationships, diagnostic analytics provides valuable insights into the factors influencing data patterns.
Predictive Analytics
- Definition: Predictive analytics employs statistical algorithms and machine learning techniques to analyze historical data and identify future trends and outcomes. It aims to make informed forecasts about what might happen in the future based on patterns observed in the past.
- Application: Time series analysis is a prevalent technique in predictive analytics, especially when dealing with sequential or temporal data. Regression models establish mathematical relationships between variables, allowing for the prediction of one variable based on others. Machine learning algorithms, ranging from decision trees to neural networks, contribute to predictive modeling by learning patterns and making predictions based on historical data. Predictive analytics is widely used in various industries for demand forecasting, risk assessment, and trend identification.
Prescriptive Analytics
- Definition: Prescriptive analytics goes beyond prediction and provides recommendations on what actions to take to influence desired outcomes based on predictive models. It aims to prescribe the best course of action for a given situation, optimizing decision-making processes.
- Application: Optimization algorithms are commonly used in prescriptive analytics to identify the best combination of factors or variables that will lead to a desired outcome. Decision trees assist in mapping decision paths based on different scenarios, providing decision-makers with a visual guide. Simulation models simulate the impact of different decisions, allowing decision-makers to explore the consequences of various choices before making a final decision. Prescriptive analytics is valuable in scenarios where organizations seek optimal solutions to complex problems, such as resource allocation, supply chain management, and strategic planning.
How to Learn Statistics for Data Science

Probability
- Concept: Probability is a fundamental concept in statistics for data science that quantifies the likelihood of a specific event occurring. It ranges from 0 (impossible) to 1 (certain) and forms the basis for understanding uncertainty in data.
- Application: In data science statistics, probability is crucial for making predictions and decisions. It serves as the backbone for Bayesian statistics, where prior beliefs are updated based on new evidence. Machine learning algorithms, especially those based on probability distributions, leverage these concepts for classification, regression, and anomaly detection.
Sampling
- Concept: Sampling is the process of selecting a subset of data from a larger population to make inferences about the entire population. It involves choosing a representative sample to ensure generalizability.
- Application: Various sampling techniques, such as random sampling, stratified sampling, and cluster sampling, are essential in data science statistics. Understanding these techniques is crucial for drawing meaningful conclusions from limited data, reducing bias, and improving the accuracy of statistical analyses.
Tendencies and Distribution of Data
- Concept: Central tendencies, including mean (average), median (middle value), and mode (most frequent value), provide a summary of where the data tends to cluster. Data distribution, such as normal, skewed, or uniform, describes the shape and spread of the dataset.
- Application: These concepts are vital for summarizing and interpreting data. For instance, a skewed distribution may indicate the presence of outliers, influencing the choice of appropriate statistical measures. Data scientists use these tendencies to gain insights into the typical values and patterns within the data, guiding further analysis.
Hypothesis Testing
- Concept: Hypothesis testing is a statistical method used to make inferences about population parameters based on sample data. It involves forming a hypothesis (null and alternative) and conducting statistical tests to determine the validity of the hypothesis.
- Application: Hypothesis testing is crucial for data scientists to validate assumptions, make predictions, and draw meaningful conclusions from data. It helps determine whether observed differences or relationships are statistically significant or could have occurred by chance, providing a robust framework for decision-making.
Variation
- Concept: Variation measures how individual data points differ from the mean, providing insights into the spread and dispersion of data. Standard deviation is a common measure of variation.
- Application: Understanding variation is essential for assessing the reliability and consistency of data. It helps data scientists identify the range within which data points are expected to fall, aiding in accurate predictions and decision-making. Robust statistical analysis acknowledges and accounts for variation to avoid making assumptions based on overly simplistic models.
Regression
- Concept: Regression analysis explores the relationship between a dependent variable and one or more independent variables. It quantifies how changes in independent variables affect the dependent variable.
- Application: Regression models are widely used in predictive analytics to make predictions based on historical data. Understanding regression is essential for data scientists to model complex relationships, identify influential factors, and make informed predictions. It forms the backbone of predictive modeling, enabling data-driven decision-making in various fields such as finance, marketing, and healthcare.
FAQs
-
Q: Why is statistics important in data science?
A: Data science statistics is essential as it provides the tools to analyze, interpret, and draw meaningful insights from data, enabling informed decision-making.
-
Q: What is the difference between descriptive and diagnostic analytics?
A: Descriptive analytics summarizes features of a dataset, while diagnostic analytics delves into historical data to understand why certain events occurred.
-
Q: How does probability play a role in data science?
A: Probability is foundational in data science statistics, guiding predictions and decisions. It forms the basis for Bayesian statistics and machine learning algorithms.
-
Q: Why is hypothesis testing important in data science statistics?
A: Hypothesis testing allows data scientists to make inferences about population parameters based on sample data, helping validate assumptions and draw reliable conclusions.
Conclusion
- Statistics for data science plays a foundational role in data science, guiding data scientists through data exploration, enabling the identification of patterns, and providing a crucial understanding of data distribution and variability.
- Serving as a lens, statistics for data science aids in identifying correlations, anomalies, and hidden trends within datasets, contributing significantly to the extraction of valuable insights essential for decision-making.
- Statistics forms the basis for making sense of sample data and building predictive models, allowing data scientists to anticipate future trends and outcomes with confidence.
- By offering a systematic framework for analysis, statistics empowers organizations to adopt data-driven decision-making, reducing uncertainty and ensuring decisions are grounded in empirical evidence.
- From descriptive and diagnostic analytics to predictive and prescriptive analytics, the diverse types of statistics provide a comprehensive toolkit for addressing a wide range of challenges in data science.
- Aspiring data scientists should focus on mastering fundamental statistical concepts such as probability, sampling, tendencies and distribution of data, hypothesis testing, variation, and regression to navigate the complexities of statistical analysis effectively.
