Data Transformation

Overview
Data Transformation can be defined as a process of converting data into a format that aids in building efficient ML models and deriving better insights. Data Transformation is an important step in the feature engineering and data processing stage of a Data Science project.
What is Data Transformation?
There is no doubt that in today’s world, data is the most important asset for organizations worldwide. The majority of data is raw, which makes it challenging to work with as it is difficult to understand this data directly. Therefore, it is essential to convert this data into a format that is more usable and understandable. Data Transformation is a technique used to transform raw data into a more appropriate format that enables efficient data mining and model building.
When to Transform Data?
- Data Transformation is an essential technique that must be used before Data Mining so that it can help in extracting meaningful patterns and insights.
- It is also essential to perform before training and developing an ML model. While training an ML model, both datasets used in the training and testing phase of the model need to be transformed in the same way.
Benefits and Challenges of Data Transformation
A few of the benefits companies get by using Data Transformation include as following :
-
Maximize Value of Data:
Data Transformation standardizes data from various data sources to increase its usability and accessibility. This will ensure that maximum data is used in Data Mining and model building, resulting in extracting maximum value from data. -
Effective Data Management:
Data Transformation helps remove inconsistencies in the data by applying various techniques so that it is easier to understand and retrieve data. -
Better Model Building and Insights:
Typically, the distribution of features in a dataset is highly skewed. So, Data Transformation helps remove bias in the model by standardizing and normalizing features in the same range. -
Improve Data Quality:
Data Transformation helps organizations improve data quality by handling missing values and other inconsistencies.Data Transformation comes with its own challenges as well. Let’s have a look at some of the challenges of the Data Transformation process.
-
Data Transformation is an expensive and resource-intensive process. This cost depends upon many factors such as infrastructure, tools, company requirements, data size, etc.
-
Data Transformation requires professionals with appropriate subject matter expertise as faulty Data Transformation can lead to inaccurate business insights.
Data Transformation Techniques
A few of the most common Data Transformation techniques include as following :
Data Smoothing
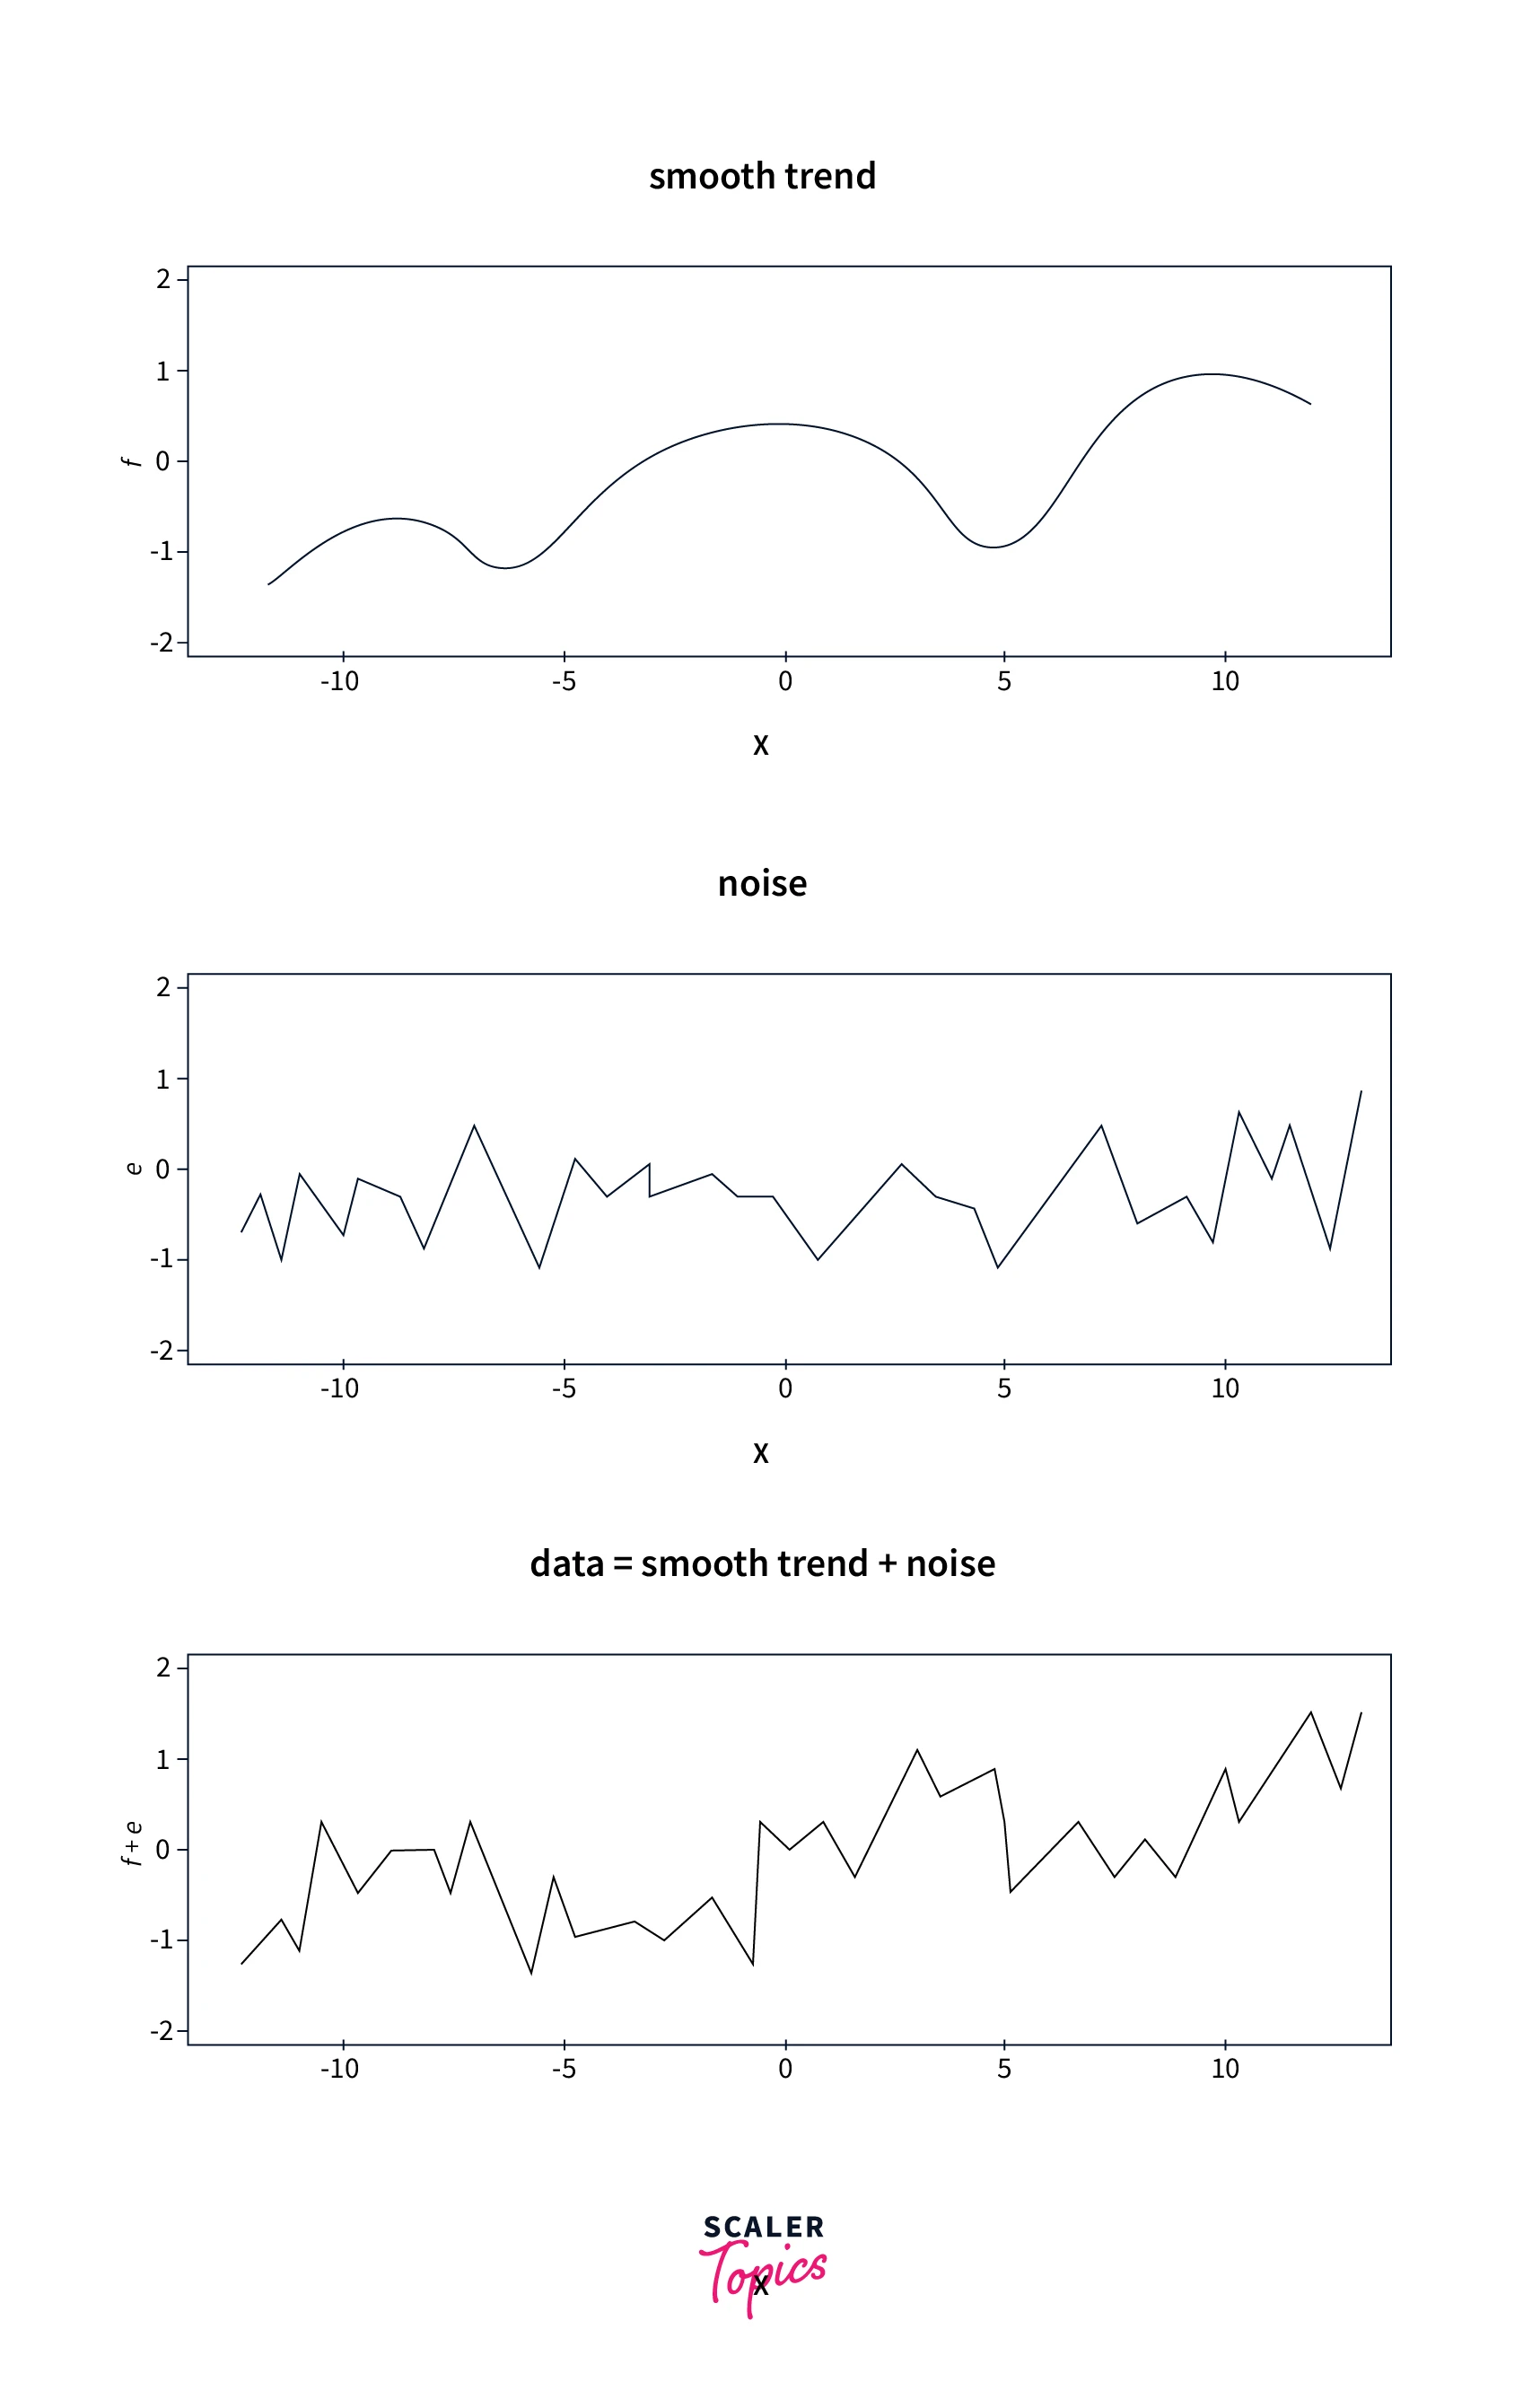
Data Smoothing is used to remove noise in the data, and it helps inherent patterns to stand out. Therefore, Data Smoothing can help in predicting trends or future events. For example, as shown in the below diagram, smoothing allows us to remove noise from the input data that helps identify implicit seasonality and growth trends. Some of the ways to perform Data Smoothing are moving average, exponential average, random walk, regression, binning, etc.

Attribute Construction
In this method, new attributes or features are created out of the existing features. It simplifies the data and makes data mining more efficient. For example, if we have height and weight features in the data, we can create a new attribute, BMI, using these two features.
Data Aggregation
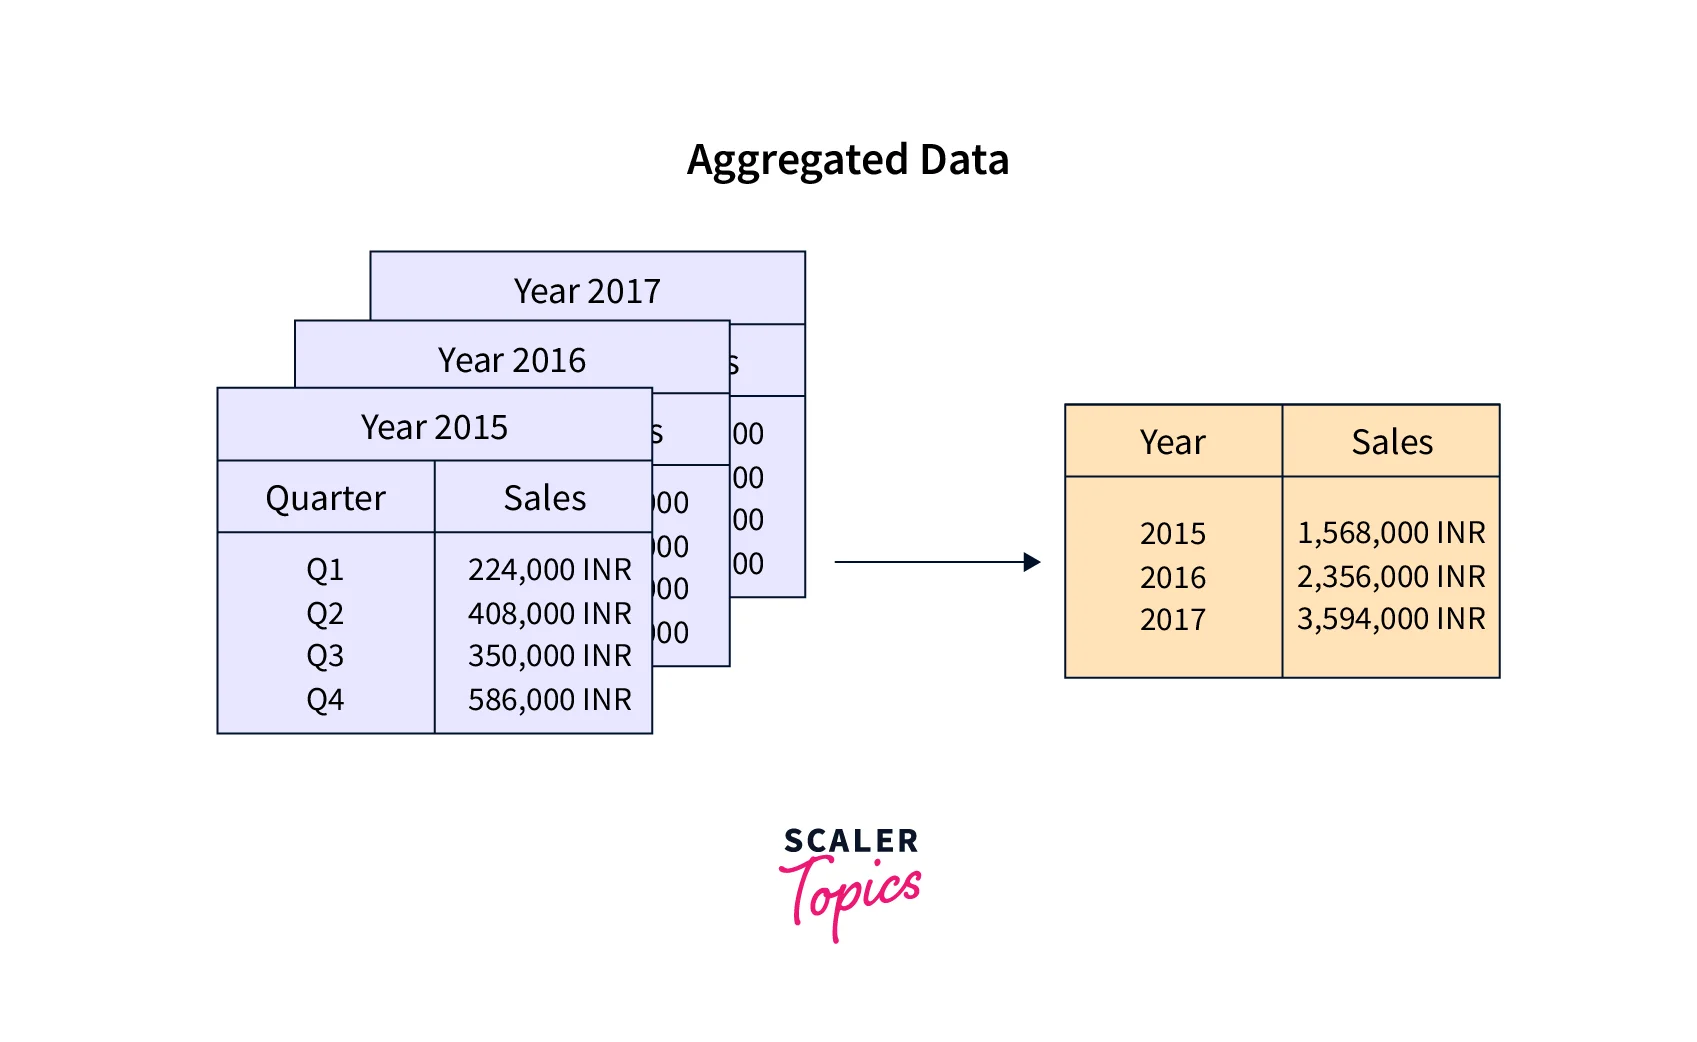
Data Aggregation is the process of compiling large volumes of data and transforming it into an organized and summarized format that is more consumable and comprehensive. Data Aggregation can enable the capability to forecast future trends and aid in predictive analysis. For example, a company may look at monthly sales data of a product instead of raw sales data to understand its performance better and forecast future sales.

Ready to Dive Deeper? Explore the Practical Applications of These Concepts in Our Data Science Course and Turn Knowledge into Expertise.
Data Normalization
The range of values for each attribute in a dataset can vary greatly. Some features might contain large numbers, such as sales data, etc., while others might have comparatively smaller matters, such as age, etc. This could introduce a bias in the model building. Therefore it is essential to normalize every feature in the dataset. Data Normalization is a technique that is used to convert a numeric variable into a specified range such as [-1,1], [0,1], etc. A few of the most common approaches to performing normalization include :
-
Min-Max Normalization:
This is a linear transformation and will convert the data into the [0,1] range. The formula for Min-Max Normalization is : -
Z-Score Normalization:
It utilizes the mean and standard deviation of the attribute to normalize it. It will ensure that the attribute has a 0 mean and 1 standard deviation. Z-Score Normalization is also called Data Standardization or Data Scaling. The below formula is used to perform Z-Score Normalization :
Data Discretization
It is a process of converting numerical or continuous variables into a set of intervals. This makes data easy to analyze and understand. For example, the age features can be converted into intervals such as (0-10, 11-20, ..) or (child, young, …).
Log Transformation
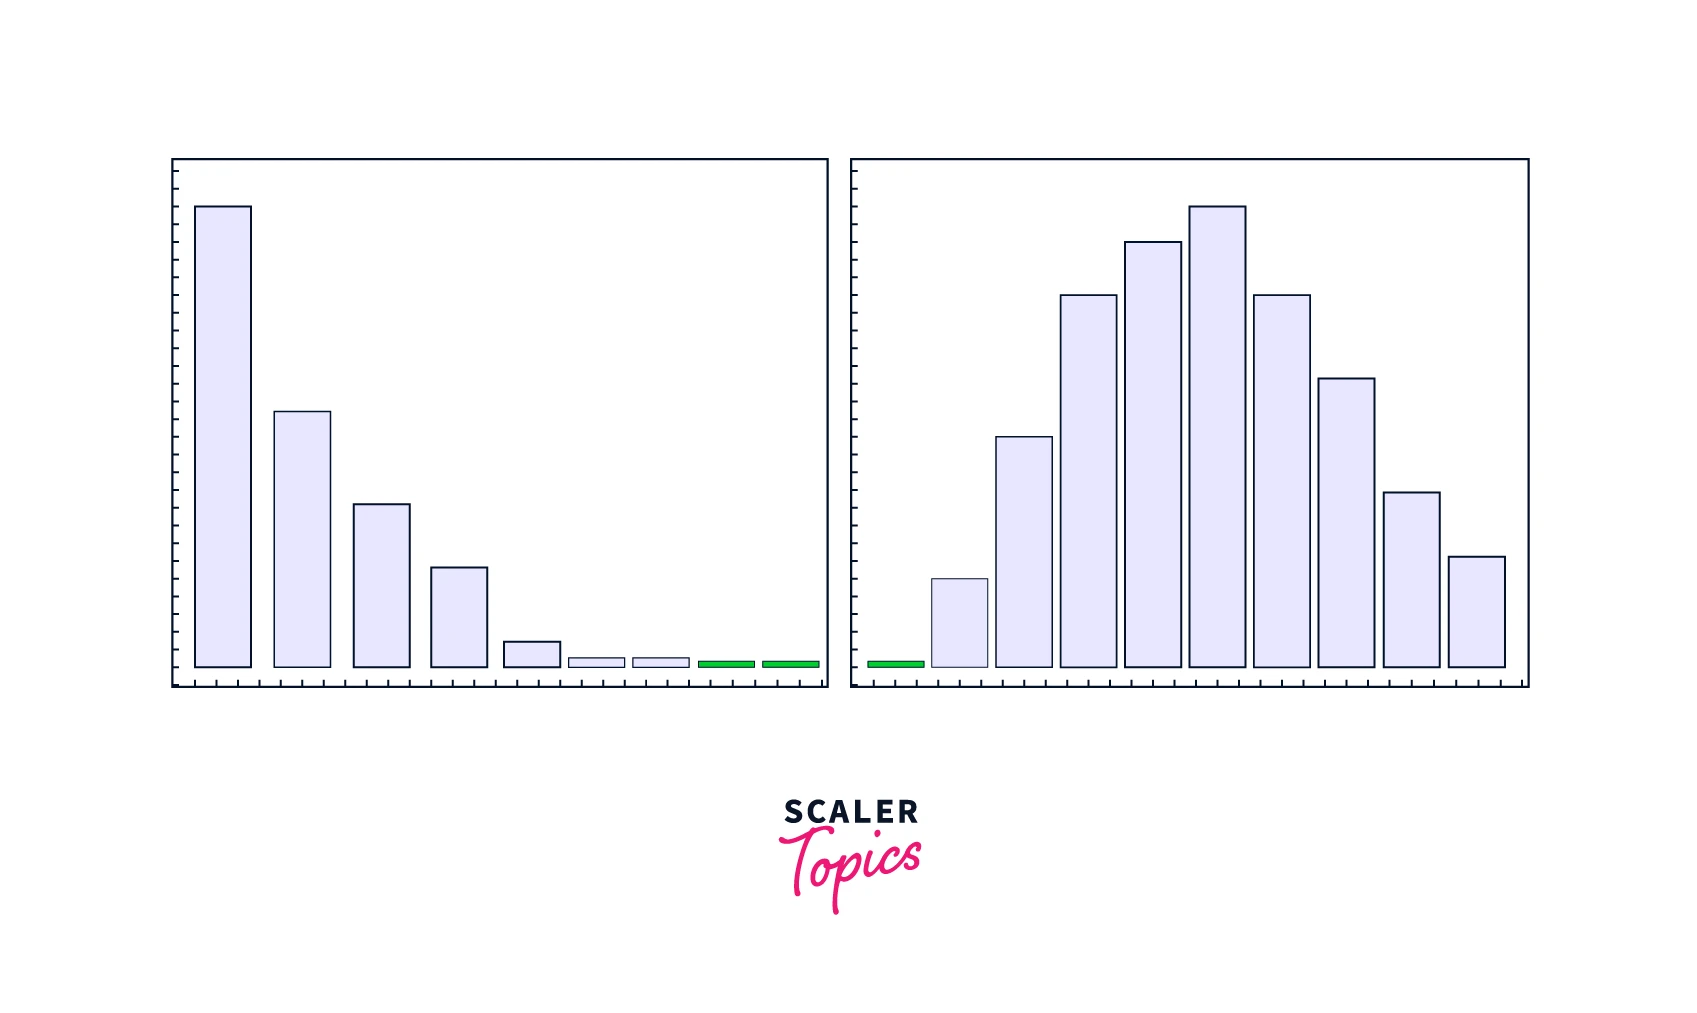
When input data does not conform to the normal distribution and has a skewed distribution, then Log transformation is used to transform/convert it into a normal distribution.

Reciprocal Transformation
In Reciprocal Transformation, an attribute x is replaced by its inverse i.e., 1/x. This transformation can be applied only to attributes having non-zero values. It is also called inverse transformation.
Square Transformation
In Square Transformation, attribute x is replaced by its square (x2). It can be applied to any feature having numeric values.
Square Root Transformation
In this transformation, x is replaced by its square root. It can be applied to features having only positive values. This transformation has a moderate effect on input distribution.
Box-Cox Transformation
In Box-Cox Transformation, values in attribute x are replaced based on the formula as mentioned below :
This transformation will also convert non-normal data to a near-normal distribution.
How does Data Transformation Works?
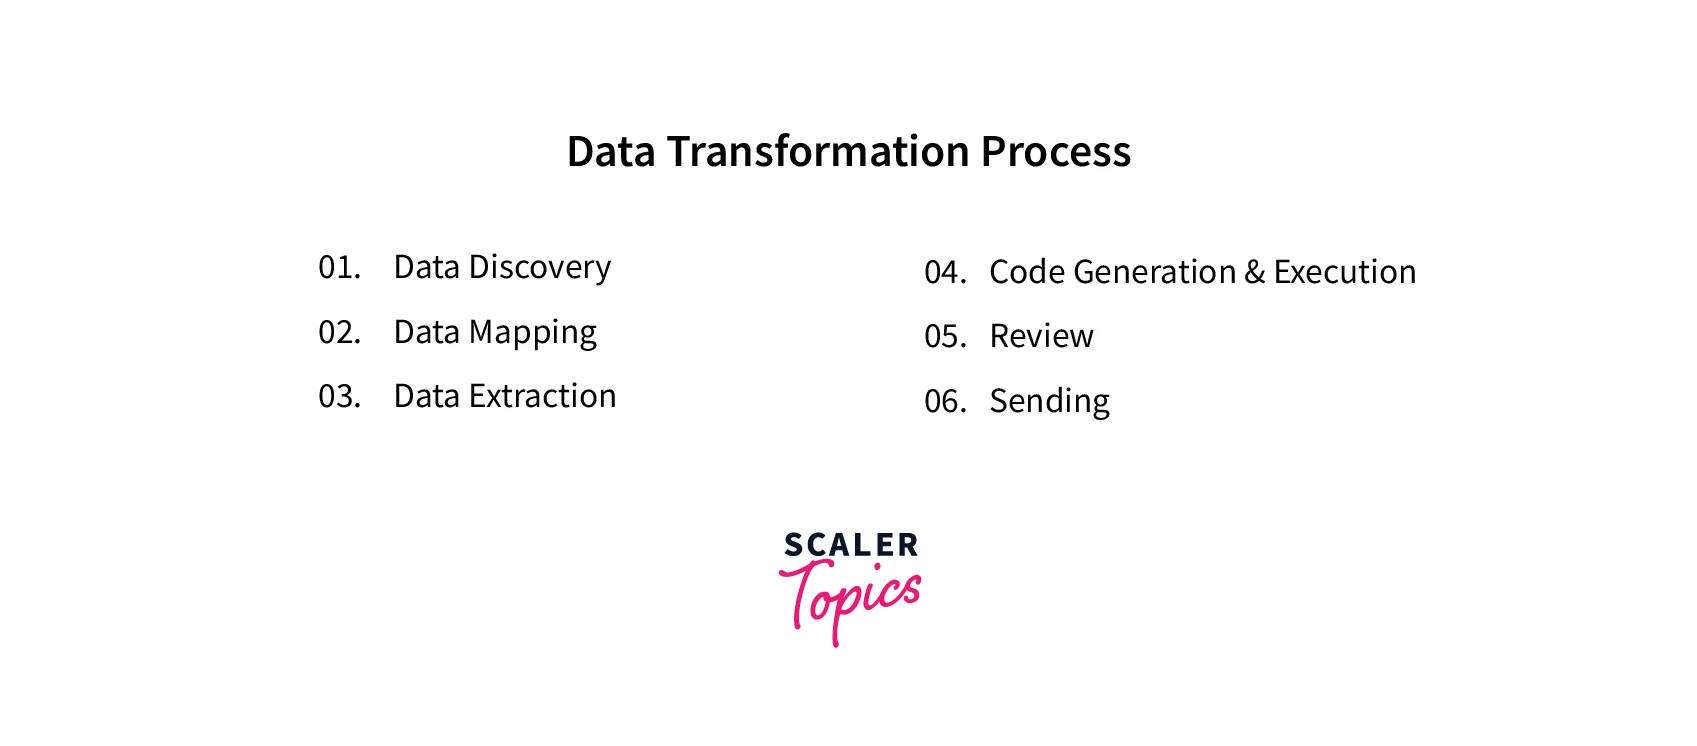
The entire process of Data Transformation is called ETL (Extract, Transform, and Load). ETL process can be defined as a six-step process as shown below :
-
Data Discovery:
In this stage, Data Scientists and Analysts identify data sources that are relevant for required for further analysis. They also review its format and schema. -
Data Mapping:
During this phase, Data Scientists and Analysts determine how individual attributes across data sources are mapped, modified, and aggregated. -
Data Extraction :
ted from its primary source in this step. It could be in this step SQL database or data from the Internet using Web Scraping methods. -
Code Generation and Execution:
In this step, Data Scientists and Analysts prepare the code scripts for transformation and execute them. -
Review:
After the execution of code in the previous step, in this step, the output is reviewed to validate whether the transformation was accurate or not. -
Sending:
Once transformed data is reviewed and validated, it is sent for storage to the destination source, such as a database, data warehouse, data lake, etc.
Data Transformation Tools
There are various ETL tools available that can be used to implement Data Transformation. ETL tools automate the entire transformation process and can enable efficient monitoring and management of Data Transformation.
ETL tools can be on-premise or cloud-based. On-premise ETL tools are hosted on company servers, and cloud-based ETL tools are hosted in the cloud. Cloud-based ETL tools are easy to scale and use only whenever required to save up extra costs.
Differentiate Between Scaling, Normalization, and Log Transformations
Data Normalization, Data Scaling (Standardization), and Log Transformation are the most popular transformation techniques used in Data Science. Let’s review how to differentiate between them and which one to choose for your analysis.
- Data Scaling transforms features in such a way that ensures it has zero mean and unit standard deviation. It is the most used transformation technique and typically works for all distributions to transform them into a normal distribution.
- Data Normalization technique transforms features into a fixed range to ensure all values lie between the given min and max values. It doesn’t work well with features that contain a lot of outliers.
- Log Transformation technique is used to transform features with a heavily skewed distribution into a normal distribution.
Ready to dive into the world of data science? Join our free Data Science course and unlock the secrets to harnessing the power of data.
Conclusion
- Data Transformation is a process to transform raw data into a more suitable format that supports efficient data mining and model building. A Data Transformation process is also called an ETL process and this process consists of six steps - data discovery, mapping, extraction, scripting, review, and storing.
- There are many techniques available for Data Transformation. The most common ones include Data Scaling, Data Normalization, Log Transformation, etc.
