Data Structures in R Programming
Overview
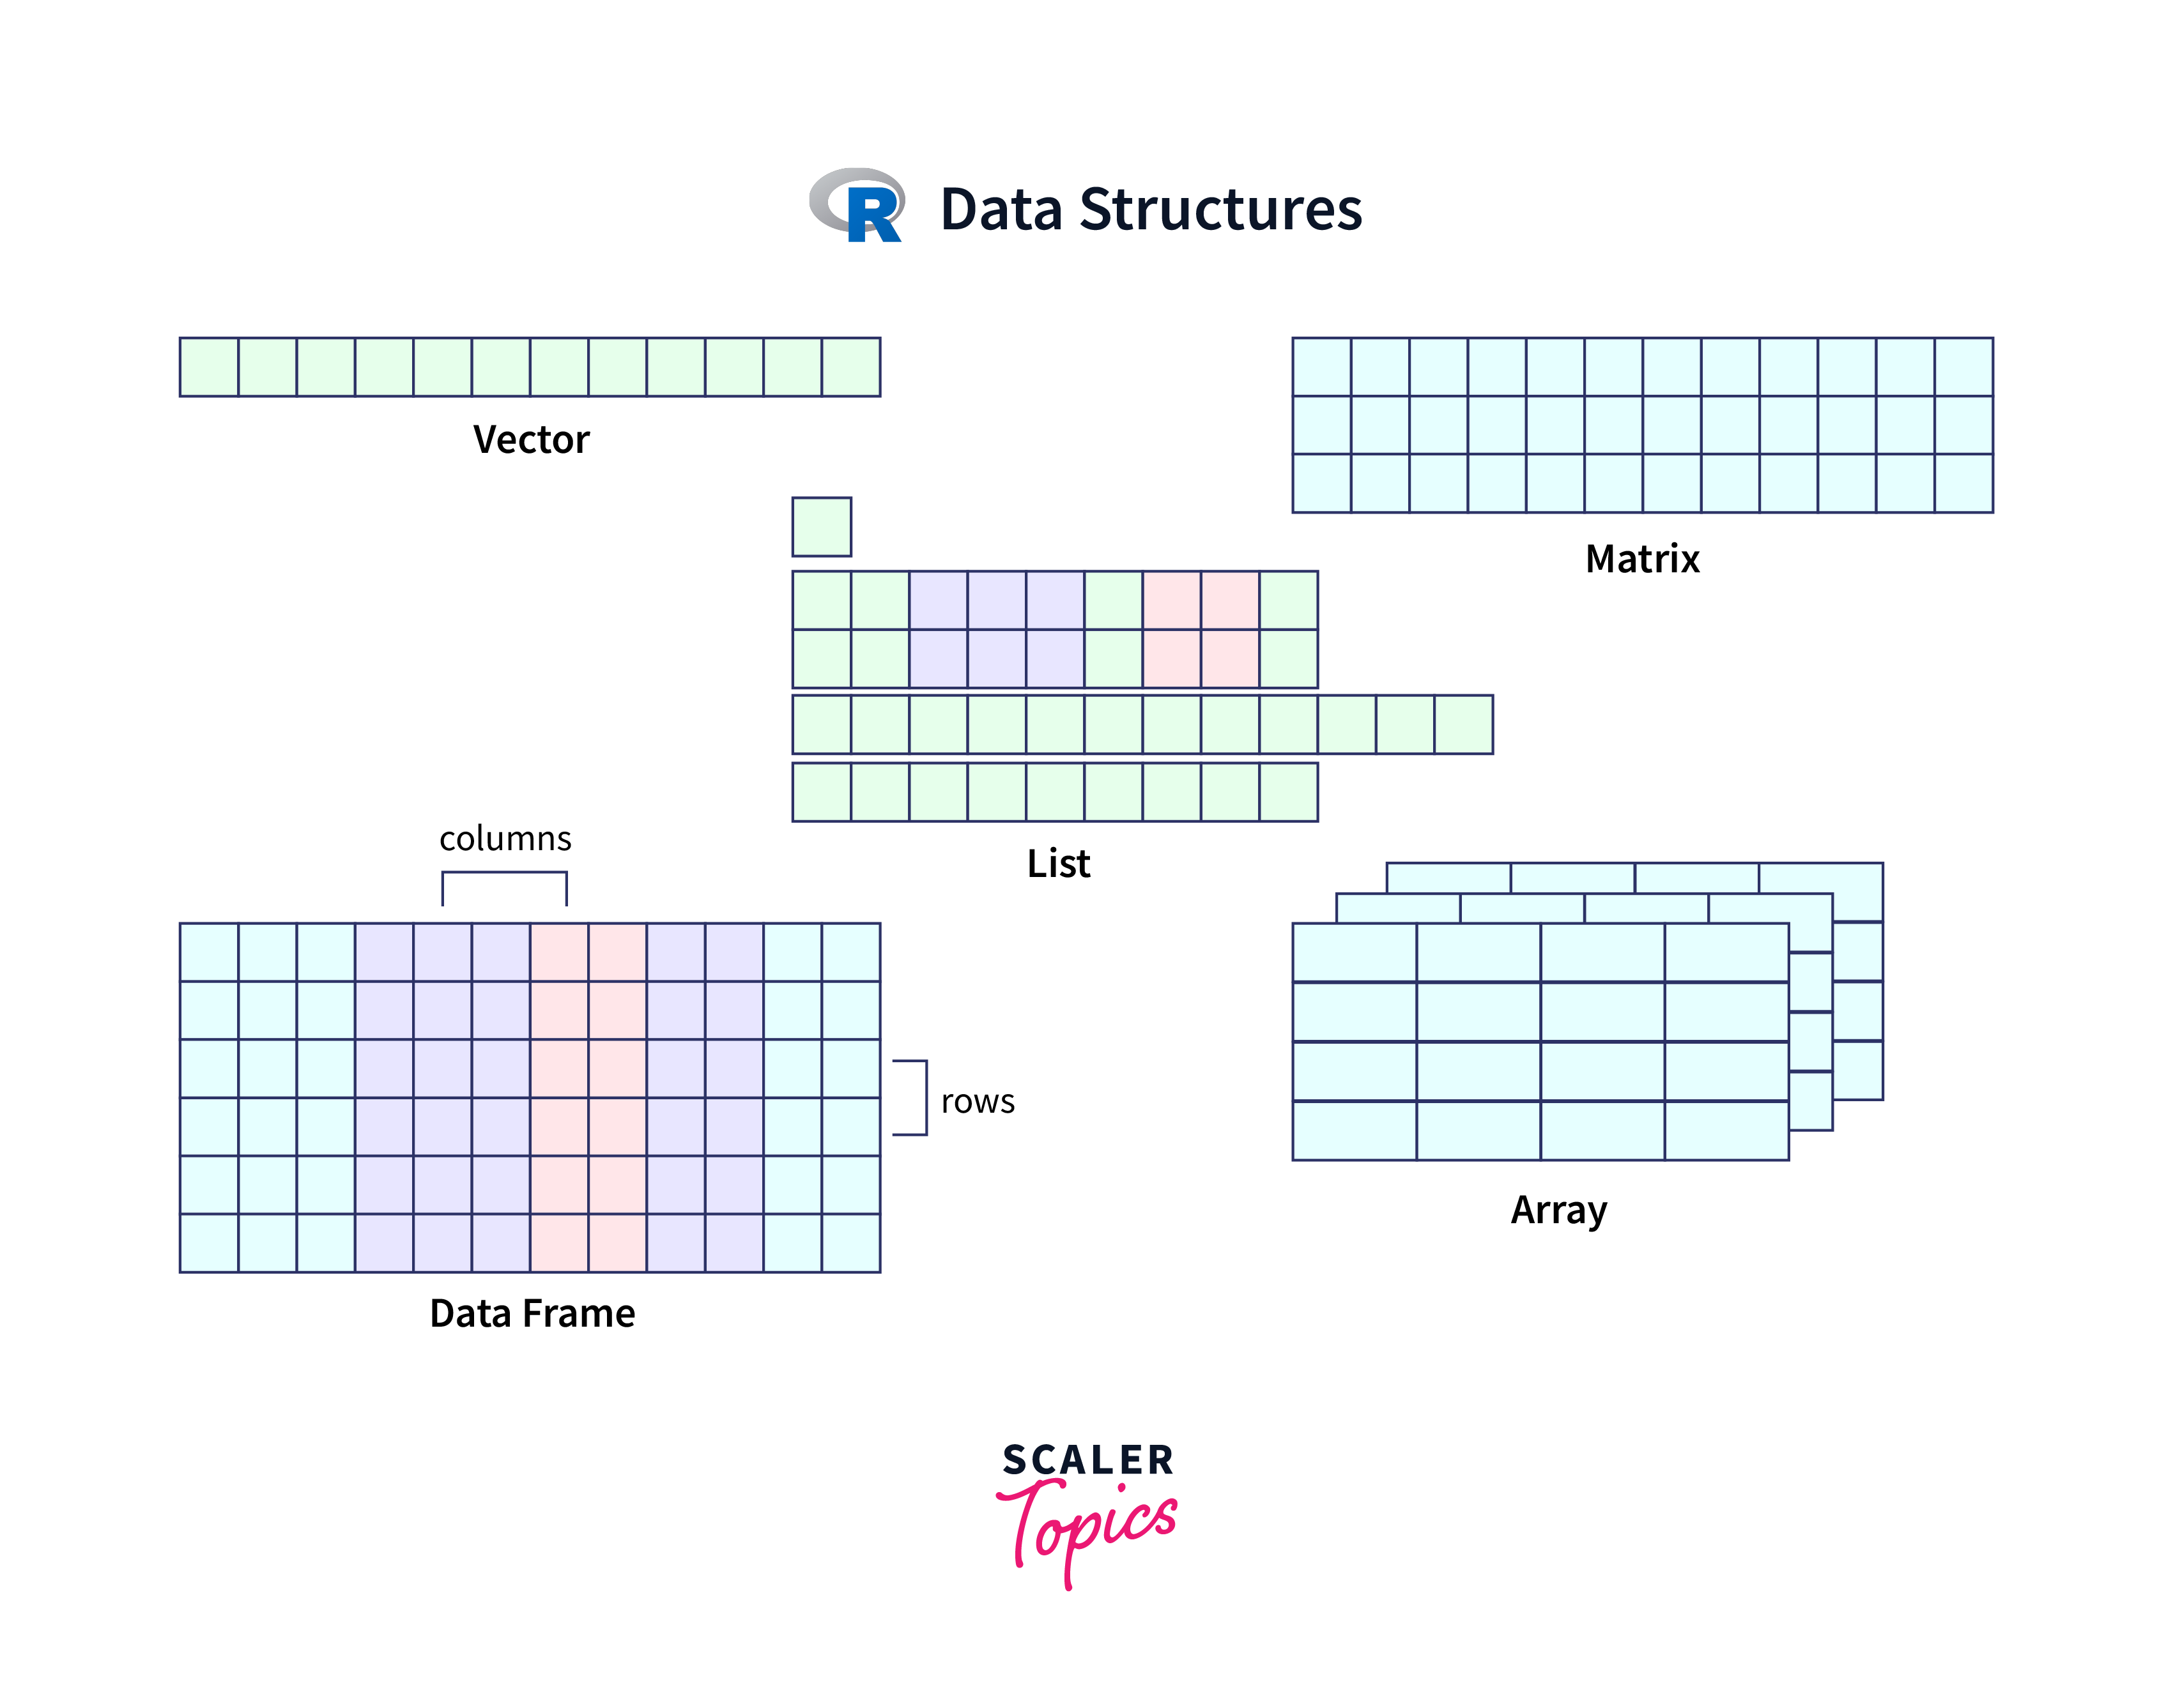
Data structures in R programming provide a way to organize and store data efficiently. R offers various built-in data structures, including vectors, matrices, arrays, lists, and data frames. Vectors are used to store homogeneous data, while matrices and arrays are suitable for multidimensional data. Lists can hold heterogeneous data types and are versatile for complex structures. Data frames are tabular structures used for organizing data in rows and columns. R's data structures enable data manipulation, analysis, and statistical computations. Understanding and utilizing the appropriate data structure in R is crucial for efficient data handling and effective programming in statistical analysis, data science, and other data-related tasks.
In R programming, a data structure refers to the way data is organized, stored, and accessed. It determines how data elements are arranged and how they can be manipulated or operated upon. Data structures in R provide a framework for efficiently storing and working with different types of data.
Data structures in R can be thought of as containers that hold data elements. These structures define the organization and relationships between the data elements, enabling efficient data manipulation and analysis.
R offers several built-in data structures, including vectors, matrices, arrays, lists, and data frames. Each data structure has its own characteristics and is suited for specific types of data and operations.
Now let us read about each of the data structures in detail:
- R Vectors
- R Lists
- R Dataframes
- R Matrices
- R Arrays
- R Factors
R Vectors
In R programming, a vector is a fundamental data structure that holds a sequence of elements of the same data type. It is a one-dimensional array-like object that can store values such as numbers, characters, logical values, or factors. Vectors are widely used in R for computations, data storage, and manipulation.
There are two types of vectors in R: atomic vectors and lists. Atomic vectors can only hold elements of a single data type, while lists can store elements of different types.
To create a vector in R, you can use the c() function, which concatenates the given values into a vector. For example:
R provides various functions and operations to work with vectors. Some important aspects of working with vectors in R include:
- Accessing Elements: You can access individual elements of a vector using square brackets [] and the index of the element. For example:
- Vector Operations: R allows performing operations on vectors, such as element-wise arithmetic operations, logical comparisons, and vectorized functions. These operations are automatically applied to each element of the vector. For example:
- Vectorized Functions: R provides many built-in functions that work with vectors, such as mean(), sum(), length(), sort(), and more. These functions can be applied to vectors directly, simplifying data analysis and computations.
- Vector Indexing: R allows indexing vectors using logical vectors or named vectors, enabling subsetting and filtering based on specific conditions or labels. For example:
In this case, the list has three elements: the number 42, the string "Hello", and a numeric vector c(1, 2, 3). Each element within the list can be accessed using indexing, denoted by double square brackets. For instance:
You can also name the elements within a list, which allows for more descriptive and convenient access. To assign names to the elements of a list, you can use the names() function. Here's an example:
In this case, the list elements are named "number," "greeting," and "values." You can access elements by their names using the dollar sign ($) notation or the double square bracket indexing. Here's how you can access the elements by name:
R Dataframe
In R, a dataframe is a two-dimensional data structure that organizes data into rows and columns, similar to a table or spreadsheet. It is one of the most commonly used data structures for data manipulation and analysis in R, and it provides a convenient way to work with structured data.
To create a dataframe in R, you can use the data.frame() function. You can specify the values of each column by providing vectors of data, and you can also assign column names. Here's an example:
In this case, the dataframe "my_df" has three columns: "name," "age," and "city." Each column is represented by a vector of data. The column names are specified using the name = syntax.
Dataframes allow for easy access and manipulation of data. You can access individual columns using the dollar sign ($) notation or by using the square bracket indexing. For example:
You can also access rows using indexing. For instance, to access the second row of the dataframe, you can use the square bracket notation:
Dataframes also provide several useful functions for data manipulation. Some common operations include:
- Adding new columns: You can add new columns to a dataframe using the dollar sign ($) notation or by assigning values to a new column.
- Subsetting: You can subset a dataframe to select specific rows or columns based on certain conditions. The subset() function or logical indexing can be used for this purpose.
- Aggregation: Dataframes support various aggregation functions to summarize data. Functions like summarize(), aggregate(), or the dplyr package can be used for aggregation operations.
- Merging: Dataframes can be merged or joined together based on common columns using functions like merge() or dplyr functions such as inner_join(), left_join(), etc.
R Matrices
In R, a matrix is a two-dimensional data structure that contains elements of the same data type arranged in rows and columns. Matrices are useful for storing and manipulating numeric or character data in a structured format.
To create a matrix in R, you can use the matrix() function. The function takes a vector of data as input and specifies the number of rows and columns in the matrix. Here's an example:
In this case, the matrix() function creates a matrix named "my_matrix" with two rows and three columns. The values are provided in the c(1, 2, 3, 4, 5, 6) vector, which is filled column-wise by default.
You can also specify the data to be filled row-wise by setting the byrow argument to TRUE:
You can access elements in a matrix using indexing. Matrices are indexed by specifying the row and column position. For example:
Matrices also support operations like addition, subtraction, multiplication, and division. These operations are performed element-wise on corresponding elements of the matrices. However, for matrix multiplication, the * operator performs element-wise multiplication, while the %*% operator performs matrix multiplication.
R provides various functions for matrix operations and manipulations, such as transposing a matrix, finding the dimensions, calculating row or column sums, and more.
R Arrays
In R, an array is a multidimensional data structure that can store elements of the same data type. It extends the concept of a matrix to more than two dimensions, allowing you to work with higher-dimensional data.
To create an array in R, you can use the array() function. The function takes a vector of data as input and specifies the dimensions of the array using the dim argument. Here's an example:
In this case, the array() function creates a 3-dimensional array named "my_array" with dimensions 2x3x2. The values are provided in the c(1, 2, 3, 4, 5, 6) vector, which is filled in the order of the dimensions specified.
You can access elements in an array using indexing. Arrays are indexed by specifying the position along each dimension. For example:
You can also access elements using a single index value, which treats the array as a flattened vector:
Arrays support operations like addition, subtraction, multiplication, and division. These operations are performed element-wise on corresponding elements of the arrays, considering the dimensions match.
R provides functions for manipulating and analyzing arrays, such as finding the dimensions, calculating row or column sums along specific dimensions, and more.
R Factors
In R, a factor is a data structure used to represent categorical variables or discrete data with a fixed set of possible values, also known as levels. Factors are particularly useful when working with data that has distinct categories or levels, such as survey responses, age groups, or nominal variables.
To create a factor in R, you can use the factor() function. The function takes a vector of data as input and converts it into a factor. Here's an example:
In this case, the factor() function creates a factor named "my_factor" with levels "Female" and "Male" based on the unique values present in the input vector.
Factors have two main components: the levels and the labels. The levels represent the distinct values or categories in the data, while the labels correspond to the actual values in the factor. You can access the levels and labels of a factor using the levels() and labels() functions, respectively.
Factors have an underlying integer representation, where each level is assigned a unique integer value. You can access the integer representation of a factor using the as .integer() function.
Factors in R are useful for various operations and analyses. They provide a convenient way to handle categorical variables and enable efficient statistical modeling and analysis. Some common operations with factors include:
- Frequency table: You can generate a frequency table to count the occurrences of each level in a factor using the table() function.
- Reordering levels: You can reorder the levels of a factor using the reorder() function based on a specific variable or criterion.
- Renaming levels: You can rename the levels of a factor using the levels() function to provide more meaningful labels.
- Subset and recode levels: You can subset a factor to select specific levels or recode the levels to create new categories.
Need of Data Structures in R Programming
Data structures are fundamental components of any programming language, including R. They play a crucial role in organizing, storing, and manipulating data efficiently. Here are some key reasons why data structures are essential in R programming:
- Data Organization: Data structures provide a systematic way to organize and structure data. By using appropriate data structures, you can represent and store different types of data, such as numbers, strings, dates, and more, in a logical and coherent manner. This organization facilitates data management and simplifies subsequent data analysis tasks.
- Data Manipulation: Data structures offer powerful operations and functions to manipulate and transform data. You can perform various operations, such as sorting, filtering, aggregating, merging, and reshaping, on data structures to extract meaningful insights and generate desired outcomes. Data manipulation becomes more efficient and concise with the use of appropriate data structures.
- Efficient Memory Usage: Different data structures have different memory usage characteristics. Choosing the right data structure based on your specific needs can help optimize memory usage. For instance, vectors are generally more memory-efficient than lists or data frames for storing large homogeneous datasets. Efficient memory usage is crucial when working with large datasets or in memory-constrained environments.
- Data Accessibility and Indexing: Data structures provide efficient mechanisms for accessing and retrieving data elements. In R, various indexing methods, such as numeric indexing, logical indexing, and named indexing, enable easy retrieval of specific data points or subsets from a data structure. Efficient data accessibility allows for seamless data exploration, analysis, and visualization.
- Compatibility with Statistical Analysis: R is widely used for statistical analysis and modeling. Many statistical functions and packages in R are specifically designed to work with specific data structures, such as data frames, matrices, or factors. Utilizing the appropriate data structure enhances compatibility and ensures the smooth integration of statistical techniques into your data analysis workflow.
- Flexibility and Extensibility: R provides a wide range of built-in data structures, including vectors, matrices, lists, data frames, arrays, factors, and more. This diversity of data structures offers flexibility to handle diverse types of data and supports various analytical tasks. Furthermore, R allows for custom-defined data structures, enabling programmers to create specialized data structures tailored to specific needs or complex data representations.
Data structures are indispensable in R programming as they enable efficient data organization, manipulation, analysis, and modeling. By utilizing the appropriate data structures, you can optimize memory usage, enhance data accessibility, and leverage the extensive range of statistical analysis tools available in R.
Conclusion
- Data structures provide a systematic and logical way to organize different types of data, facilitating data management and ensuring data integrity.
- Data structures offer powerful operations and functions for data manipulation, including sorting, filtering, aggregating, merging, and reshaping, allowing for efficient data transformations.
- Selecting appropriate data structures can optimize memory usage, which is crucial for handling large datasets or working in memory-constrained environments.
- Data structures enable easy and efficient access to specific data elements or subsets, enhancing data exploration, analysis, and visualization capabilities.
- R has specialized statistical functions and packages designed to work with specific data structures, ensuring seamless integration of statistical techniques into data analysis workflows.
- R offers a diverse set of built-in data structures and allows for custom-defined data structures, providing flexibility to handle different types of data and support complex data representations.