DBSCAN Clustering in R Programming
Overview
Clustering in R is a data analysis technique that groups similar data points together. Commonly used packages like stats offer hierarchical clustering and k-means methods. The process involves data preparation, selecting a clustering algorithm, and setting parameters such as the number of clusters (k). Execute clustering using functions like kmeans() or hclust(). Evaluate cluster quality using measures like silhouette score or elbow method to determine the optimal k value. Visualize results using plots like dendrograms or scatterplots. Clustering helps uncover patterns, segment data, and aids in various applications, including customer segmentation, anomaly detection, and image analysis.
In this article, we will learn about one of the most popular clustering algorithms in R; DBSCAN Clustering.
DBSCAN Algorithm
DBSCAN (Density-Based Spatial Clustering of Applications with Noise) is a robust and versatile clustering algorithm widely used in R for grouping data points based on their density distribution. Unlike traditional clustering algorithms such as k-means, DBSCAN doesn't require you to specify the number of clusters beforehand, making it particularly useful when dealing with datasets of unknown or varying cluster sizes and shapes.
In R, implementing DBSCAN typically involves loading the necessary libraries, such as "dbscan" and "ggplot2." The "dbscan" library provides the core functions for performing DBSCAN clustering, while "ggplot2" can be used for visualizing the resulting clusters. After loading the libraries, you should prepare your dataset, ensuring that it contains numeric attributes suitable for distance-based calculations, as DBSCAN relies on proximity information to identify clusters.
Here's an image that would sum up what DBSCAN algorithm looks like:
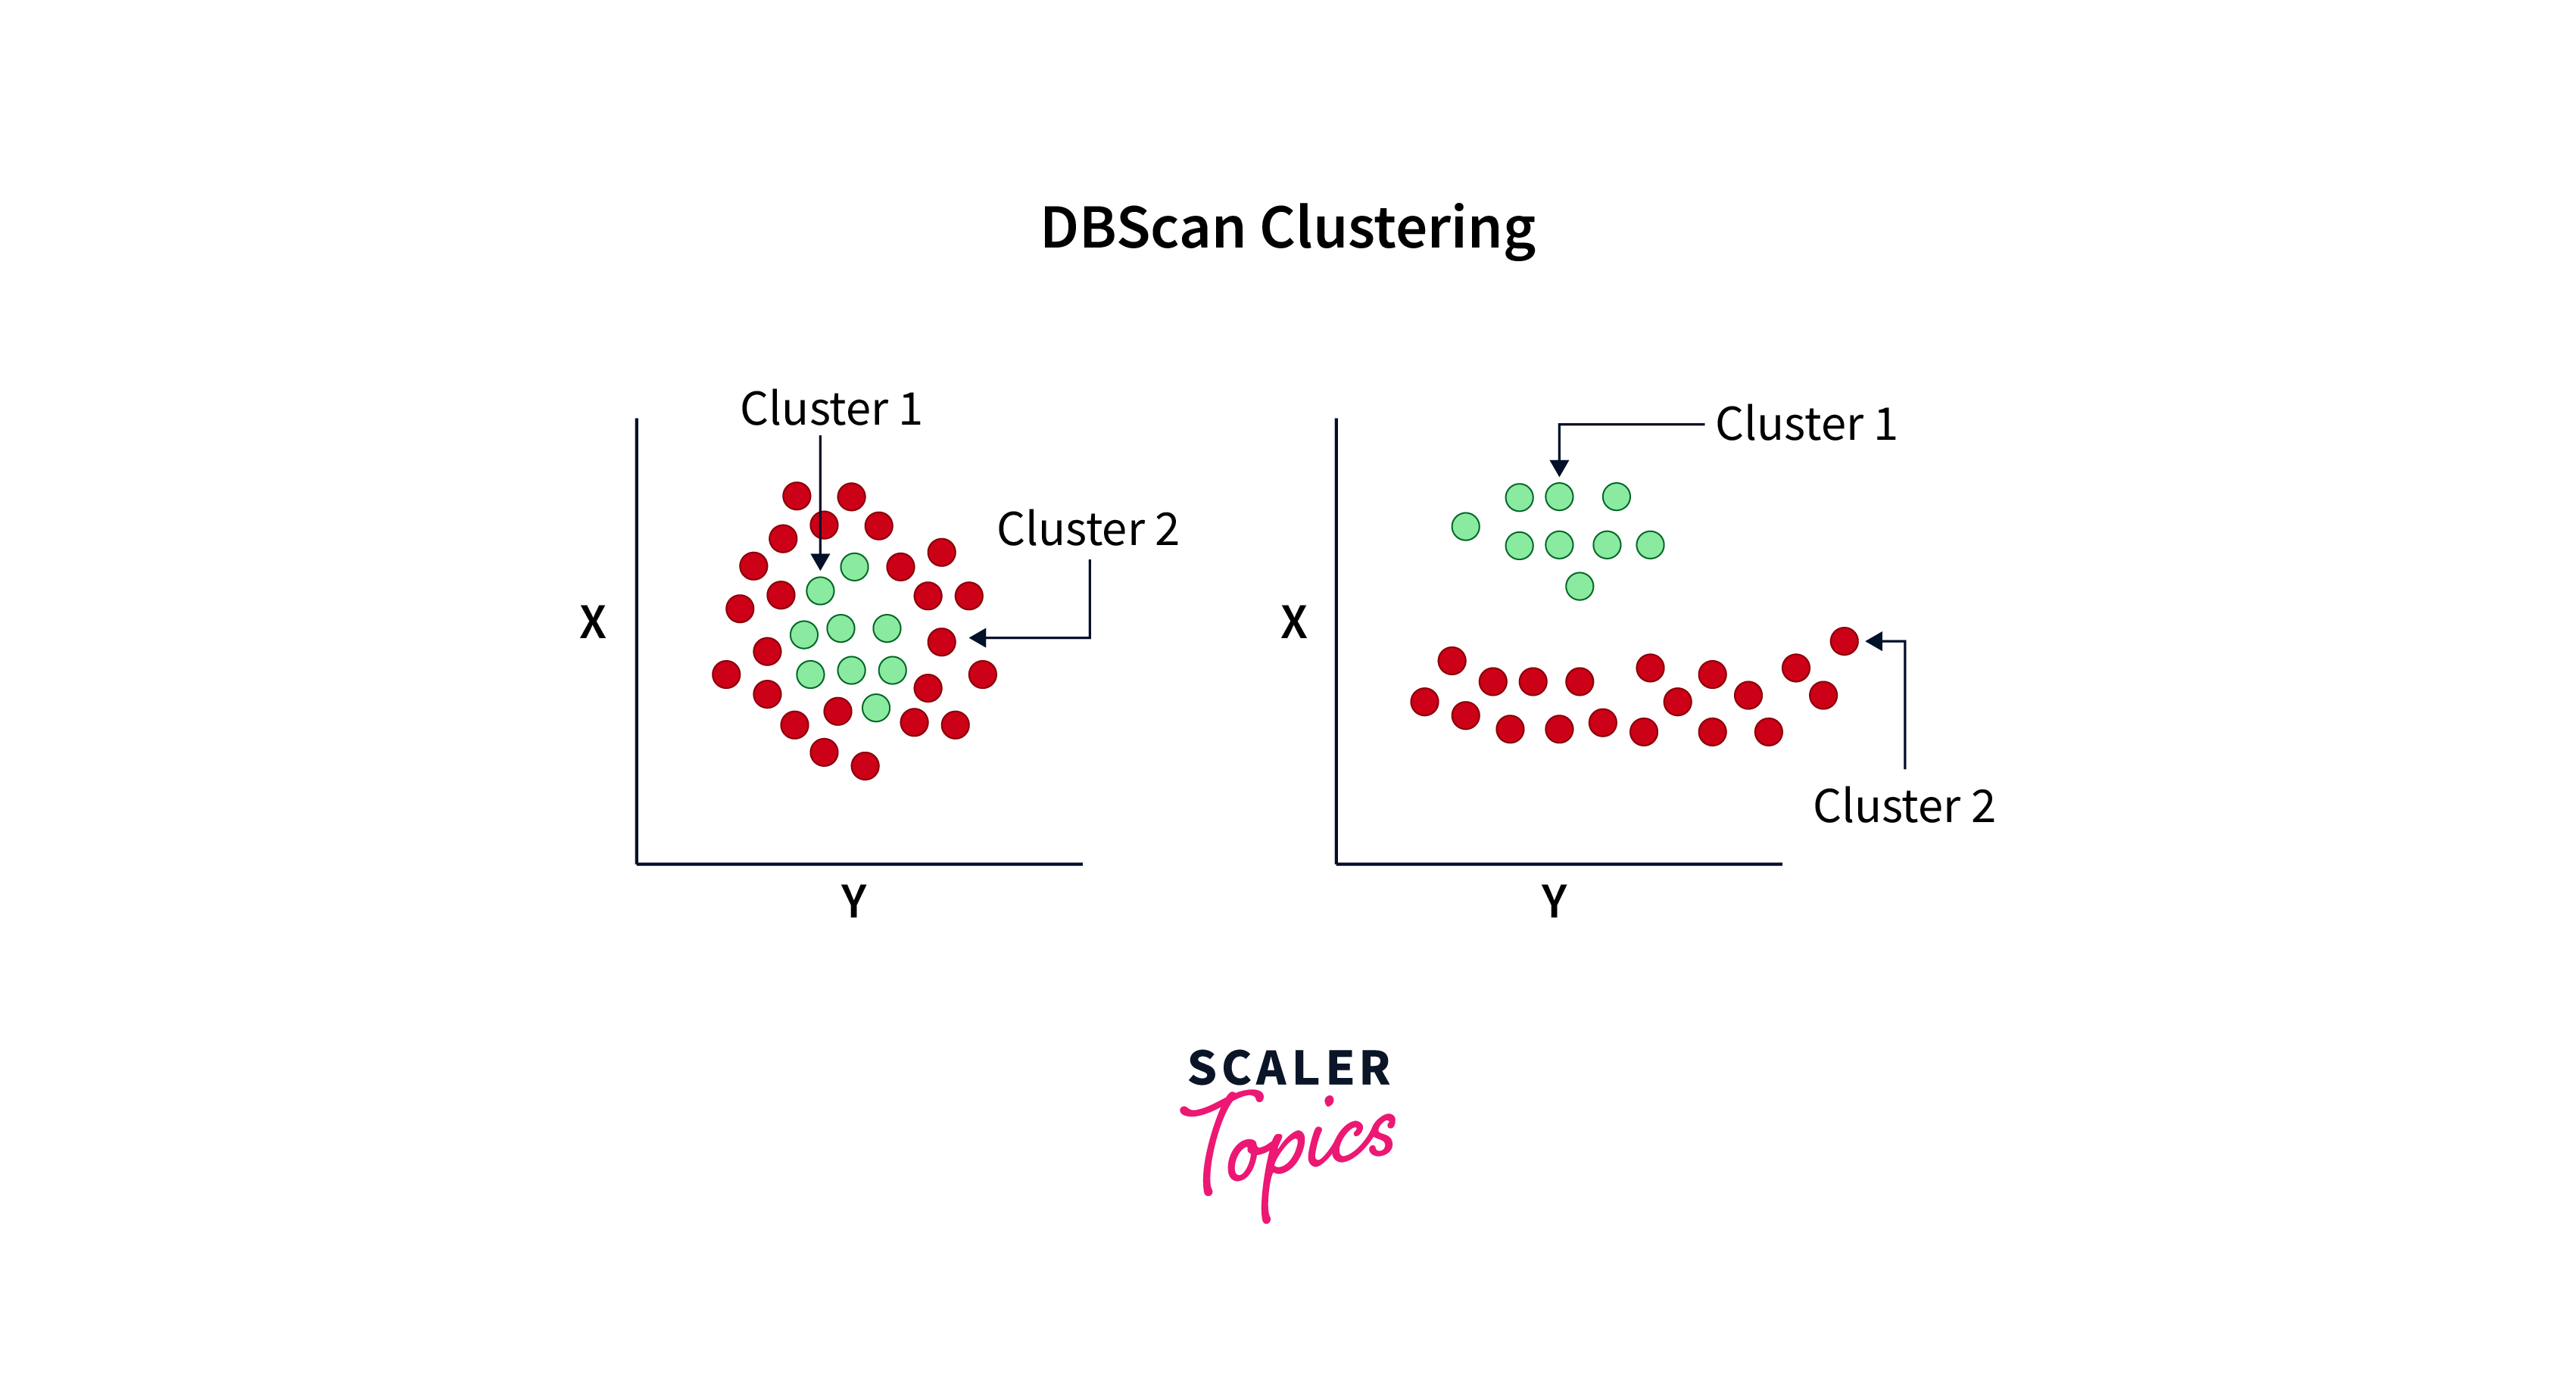
DBSCAN, or Density-Based Spatial Clustering of Applications with Noise, is an algorithm that clusters data points by considering the density distribution of the points. Here's the algorithm for DBSCAN:
-
Initialization:
- Choose the distance metric (e.g., Euclidean distance) to measure the proximity between data points.
- Specify two important parameters: eps (epsilon) and minPts (minimum points). eps defines the maximum distance for data points to be considered neighbors, while minPts is the minimum number of points required to form a dense region (core point).
-
Core Point Identification:
- For each data point in the dataset, calculate the number of data points that fall within a distance of eps from that point.
- If the number of neighbors is greater than or equal to minPts, mark the data point as a core point.
-
Cluster Expansion:
- For each core point that has not been assigned to a cluster:
- Create a new cluster and assign the current core point to it.
- Identify all data points in the epsilon-neighborhood of the core point (including itself) and add them to the cluster.
- Recursively repeat this process for each newly added data point in the cluster, expanding the cluster until no more data points can be added.
- For each core point that has not been assigned to a cluster:
-
Noise Point Identification:
- Any data point that is not a core point or does not belong to any cluster is considered a noise point.
-
Result:
- The algorithm terminates when all data points have been assigned to a cluster or labeled as noise points.
- The result is a set of clusters, each containing one or more data points, and a set of noise points.
In a programming point of view, a pseudocode would help us to understand DBSCAN in a much better way:
DBSCAN Algorithm Pseudocode:
Parameter Selection in DBSCAN
Effective parameter selection is essential when using the DBSCAN (Density-Based Spatial Clustering of Applications with Noise) algorithm to ensure the clustering results are meaningful. The critical parameters to decide on are eps (epsilon) and minPts (minimum points). Here's a guide on how to make effective parameter choices:
-
Epsilon (eps):
- eps defines the maximum distance for data points to be considered neighbors. It influences the size and shape of clusters.
- There's no universally optimal value for eps since it depends on the specific dataset and problem at hand.
- You can use various methods to choose eps:
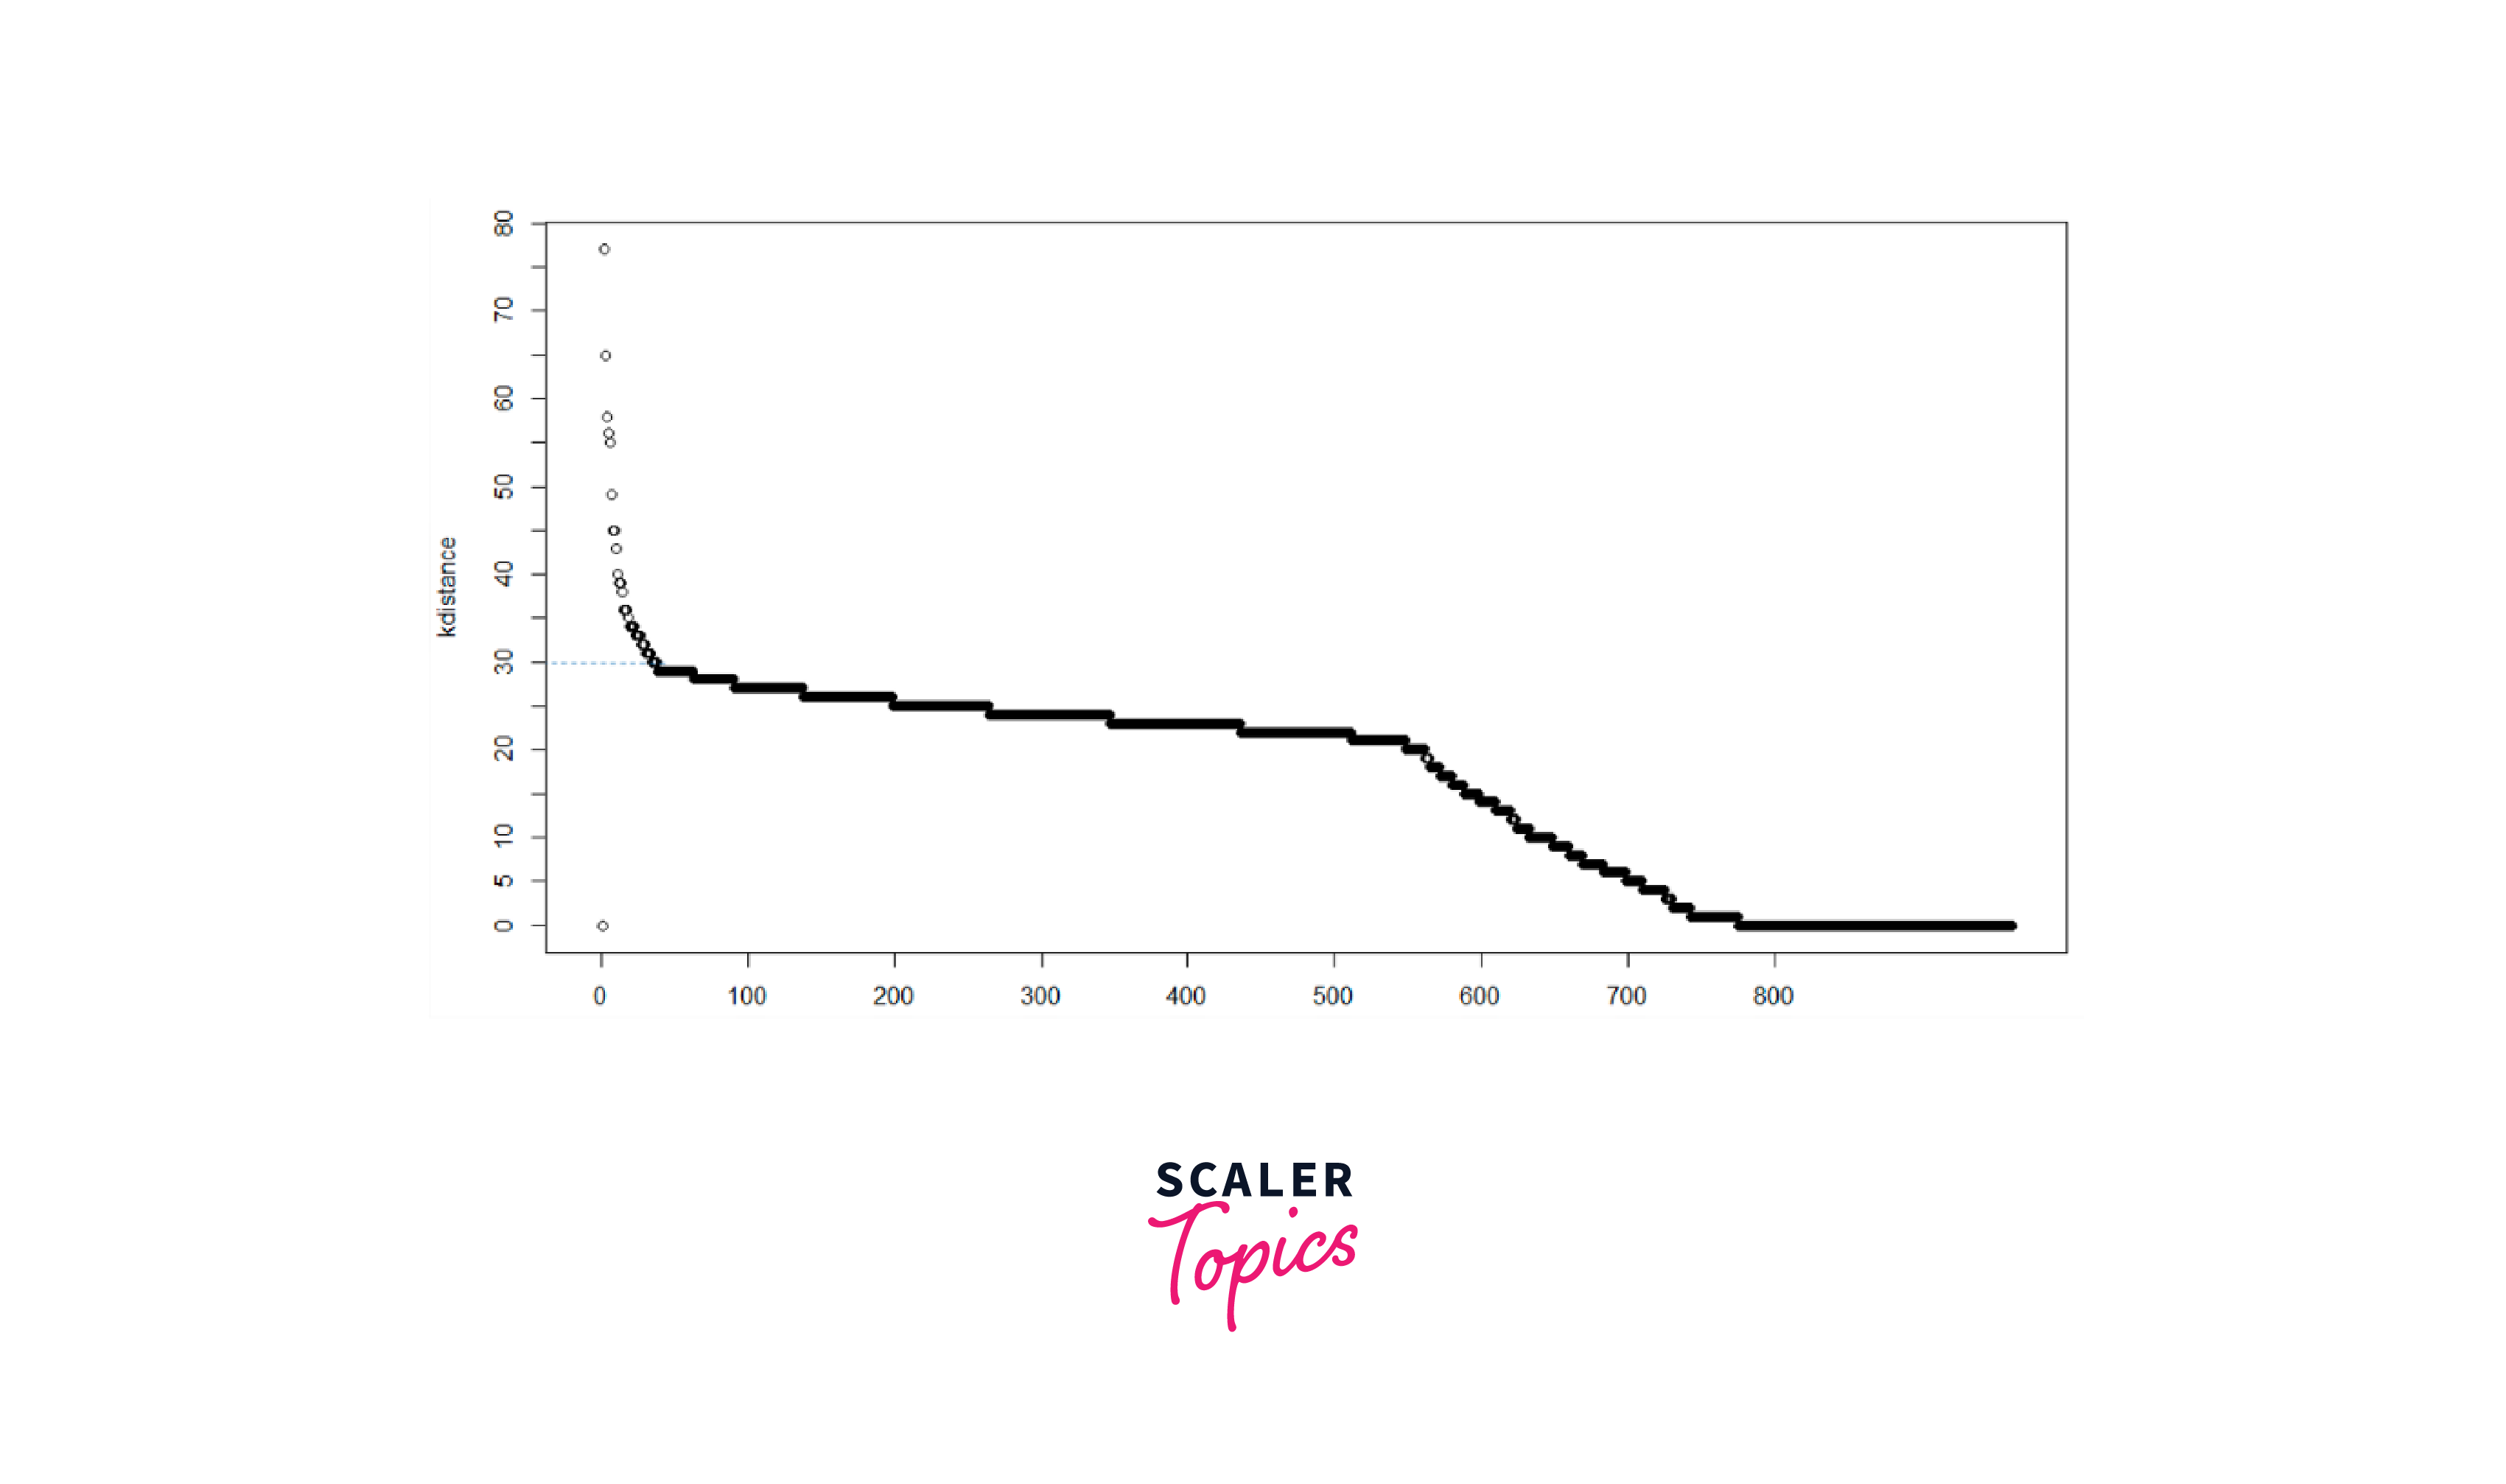
- Visual Inspection: Plot a distance matrix or a k-distance graph to observe the distances between points. Choose eps where a knee or elbow point is evident, indicating a significant change in distances.
- K-Distance Plot: Plot the k-distance graph for different values of k (e.g., using the "fpc" package in R) and select eps where the graph starts to stabilize.
- Silhouette Score: Compute the silhouette score for different eps values and choose the one that maximizes the silhouette score. A higher silhouette score indicates better cluster quality.
- Domain Knowledge: If you have domain knowledge, it can guide your choice of eps based on the expected cluster sizes and characteristics.
-
Minimum Points (minPts):
- minPts specifies the minimum number of points required within the eps neighborhood of a point for it to be considered a core point.
- The choice of minPts is often driven by the density of your data.
- A lower minPts value can result in more clusters, including smaller and more scattered ones.
- A higher minPts value can lead to larger, more cohesive clusters.
- You can select minPts based on your understanding of the data and the desired granularity of clusters. Common values range from 3 to 10, but it can vary widely depending on the dataset.
-
Experimentation and Evaluation:
- It's advisable to experiment with different combinations of eps and minPts to see how they affect the clustering results.
- Use evaluation metrics like the silhouette score, Davies-Bouldin index, or visual inspection of the clusters to assess the quality of clustering.
- Consider the balance between precision and recall in your clustering. Lower eps values might give more precise but smaller clusters, while higher values might result in larger but less precise clusters.
-
Robustness Testing:
- Test the robustness of your parameter choices by applying the DBSCAN algorithm to different subsets or variations of your data.
- Robust parameter choices should produce consistent results across different data samples or iterations.
Remember that parameter selection in DBSCAN is somewhat of an art and often involves a trial-and-error process. The chosen parameters should reflect your understanding of the data's characteristics and the goals of your analysis.
Implementation of DBSCAN Clustering in R
A. Importing Libraries
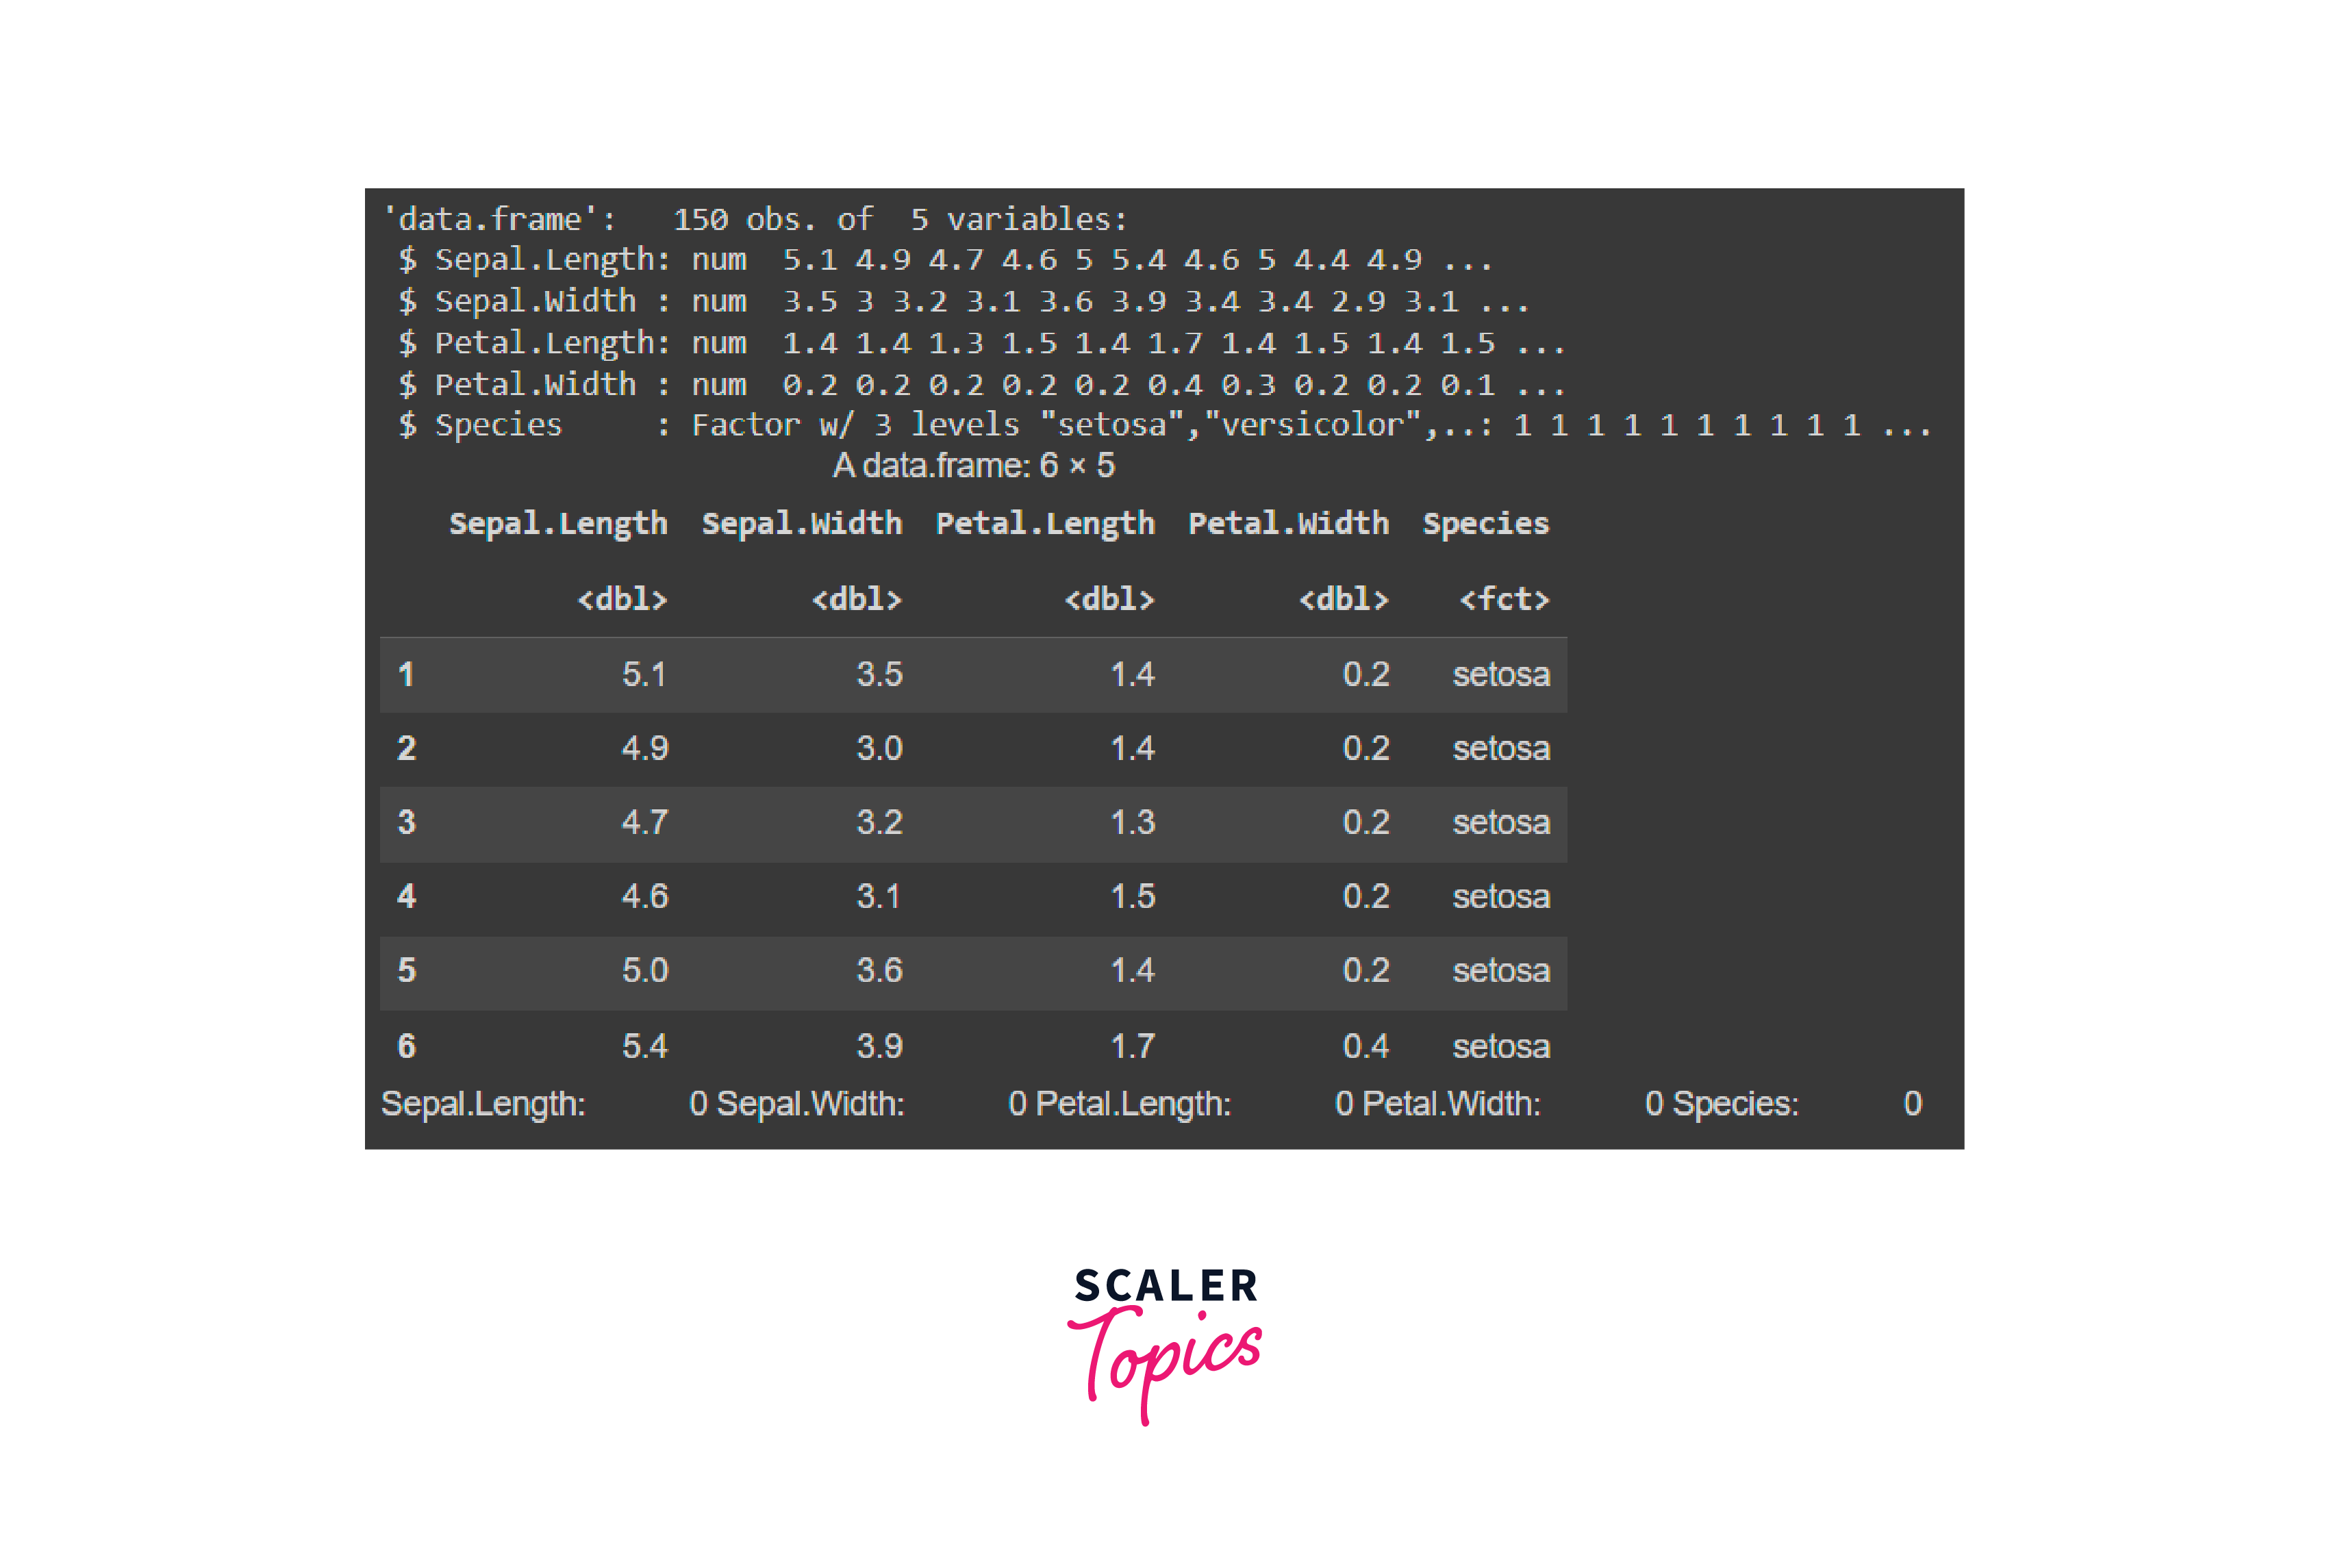
B. Load the Dataset
C. Data Preprocessing and Cleaning
Output
D. Obtaining Optimal value of Epsilon
Output
E. Performing DBSCAN Clustering
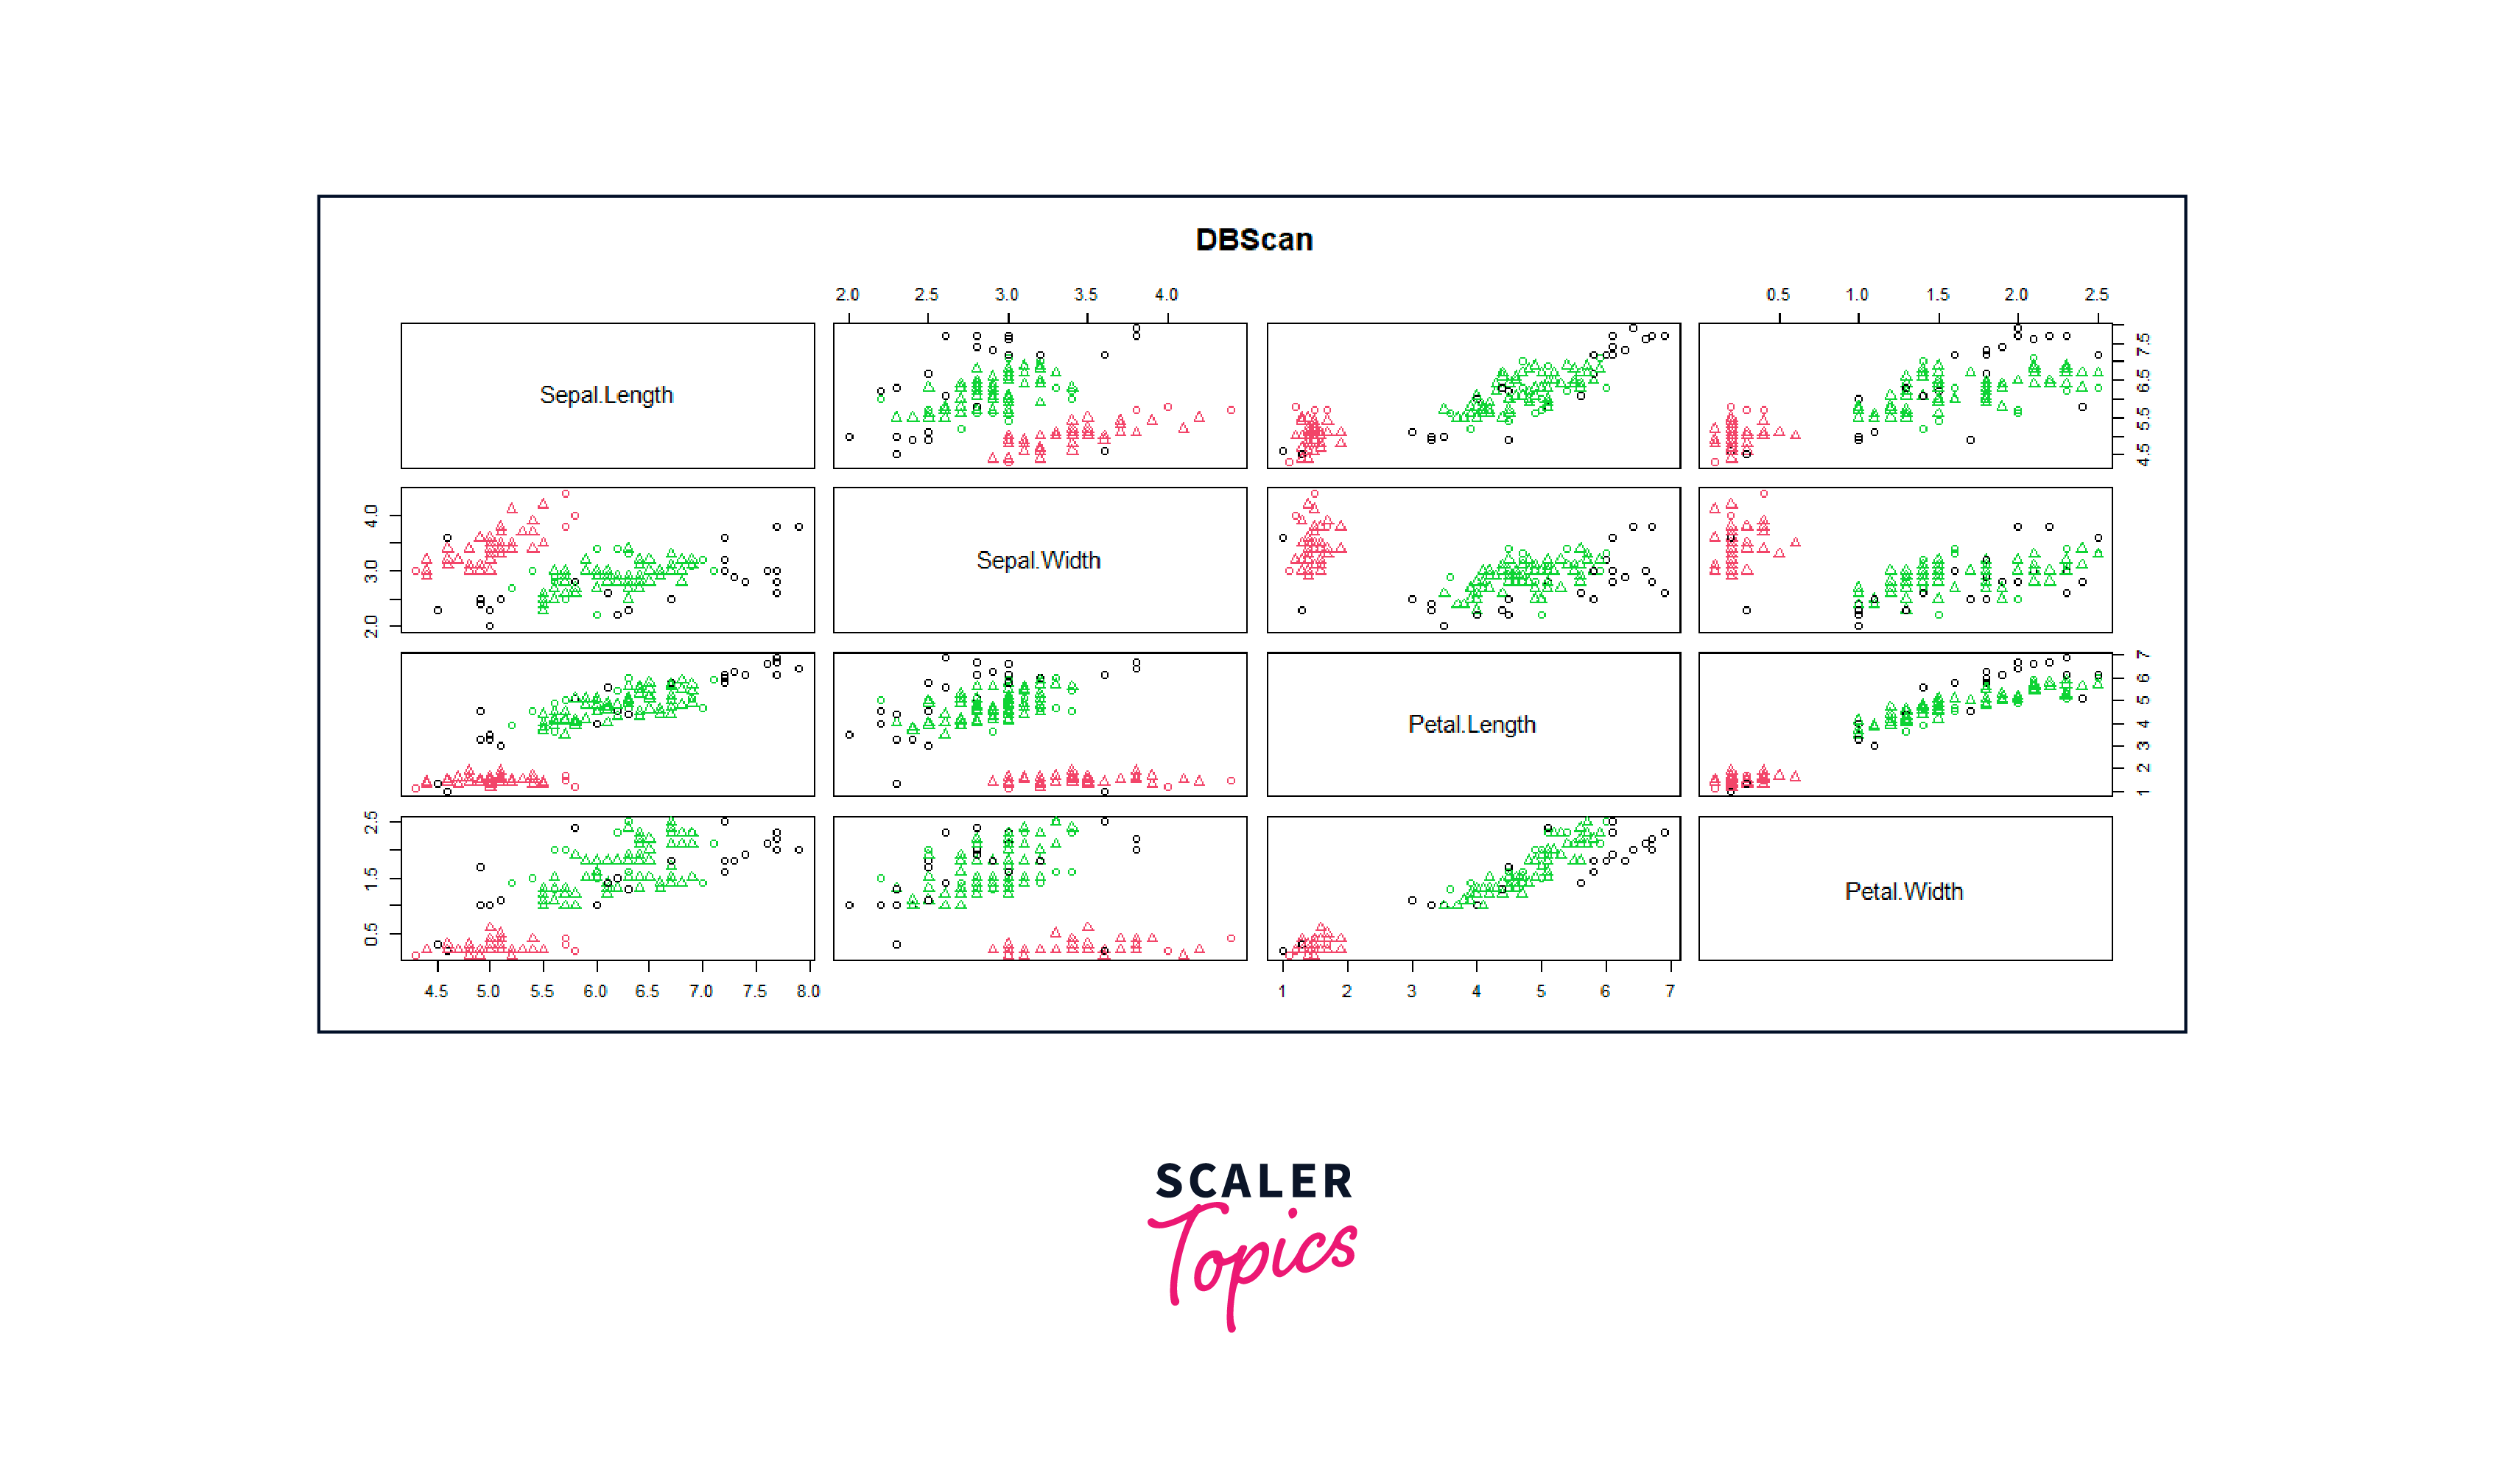
F. Cluster Visualization
Output
G. Evaluation the Results
Conclusion
- Clustering groups similar data points together using methods like hierarchical clustering and k-means. This involves data preparation, selecting an algorithm, setting parameters like the number of clusters, and evaluating cluster quality through metrics like silhouette score.
- DBSCAN, different from methods like k-means, doesn't require pre-specifying the number of clusters. It's implemented in R using libraries like “dbscan” for clustering and “ggplot2” for visualization, focusing on grouping data points based on density distribution.
- The DBSCAN process involves choosing a distance metric, defining parameters like epsilon (eps) and minimum points (minPts), identifying core points, expanding clusters, and labeling noise points. The outcome is a set of clusters with one or more data points and a set of noise points.
- Effective parameter selection in DBSCAN is crucial for meaningful clustering. Eps affects the size and shape of clusters, and minPts determines the density required for core points. Methods like visual inspection, k-distance plots, and silhouette scores assist in parameter selection.
- Implementing DBSCAN in R involves importing libraries, loading datasets, preprocessing data, determining optimal epsilon values, performing clustering, and visualizing results.