The Decision Tree algorithm is one of the many algorithms that work on the concept of supervised learning. This algorithm can be used to solve both regression and classification-based use cases. It performs excellently when used in classification-based tasks in general and generates a tree-based structure on the dataset. As this algorithm mainly makes decisions based on certain factors that it considers to be important, it is quite relatable to the human way of thinking while making real-life decisions. The logic behind the decisions can also be easily understood due to the tree-like structure that the algorithm provides.
Scope of the Article
- This article mainly speaks about the
decision treealgorithm in machine learning. - We shall discuss the steps involved in the working of a
decision treeand the standard assumptions that are followed with respect to decision trees along with the advantages and disadvantages that the algorithm has. - The article specifically speaks about different algorithms that work on the concept of decision trees and also highlights different attribute selection measures.
- We will also discuss concept of overfitting is also explained along with the methods to avoid overfitting in decision trees.
The article does not compare decision trees with any other machine learning algorithms and any mathematical calculations related to different decision tree algorithms are not discussed.
Takeaways
Advantages of decision trees :
- Able to handle both numerical and categorical data.
- Able to handle multi-output problems.
- The cost of using the tree is logarithmic
Types of Decision Trees
1) Regression based decision trees
Regressionis used when the data that we have and the data that we are making predictions on are continuous.
2) Classification based decision trees.
Classificationis used when the data we have and the data that we are making predictions on are discrete(or)categorical.
Let’s understand the meaning of discrete and continuous data. Ever heard of something like “The system has half defect”? No right!. A system either has a complete defect or no defect at all. There are no halves, quarters, or fractions. This type of data is called Discrete data ex: Yes/no, Good/bad, etc. Only a finite number of values are possible, and the values cannot be subdivided further.
Continuous data is data that can be measured and broken down into smaller parts and still have meaning. Money, temperature, and time are continuous. Ex: If you have many pizzas then counting the no. of pizzas is discrete and measuring each pizza and recording the size (i.e
Important Terminologies Related to Decision Trees
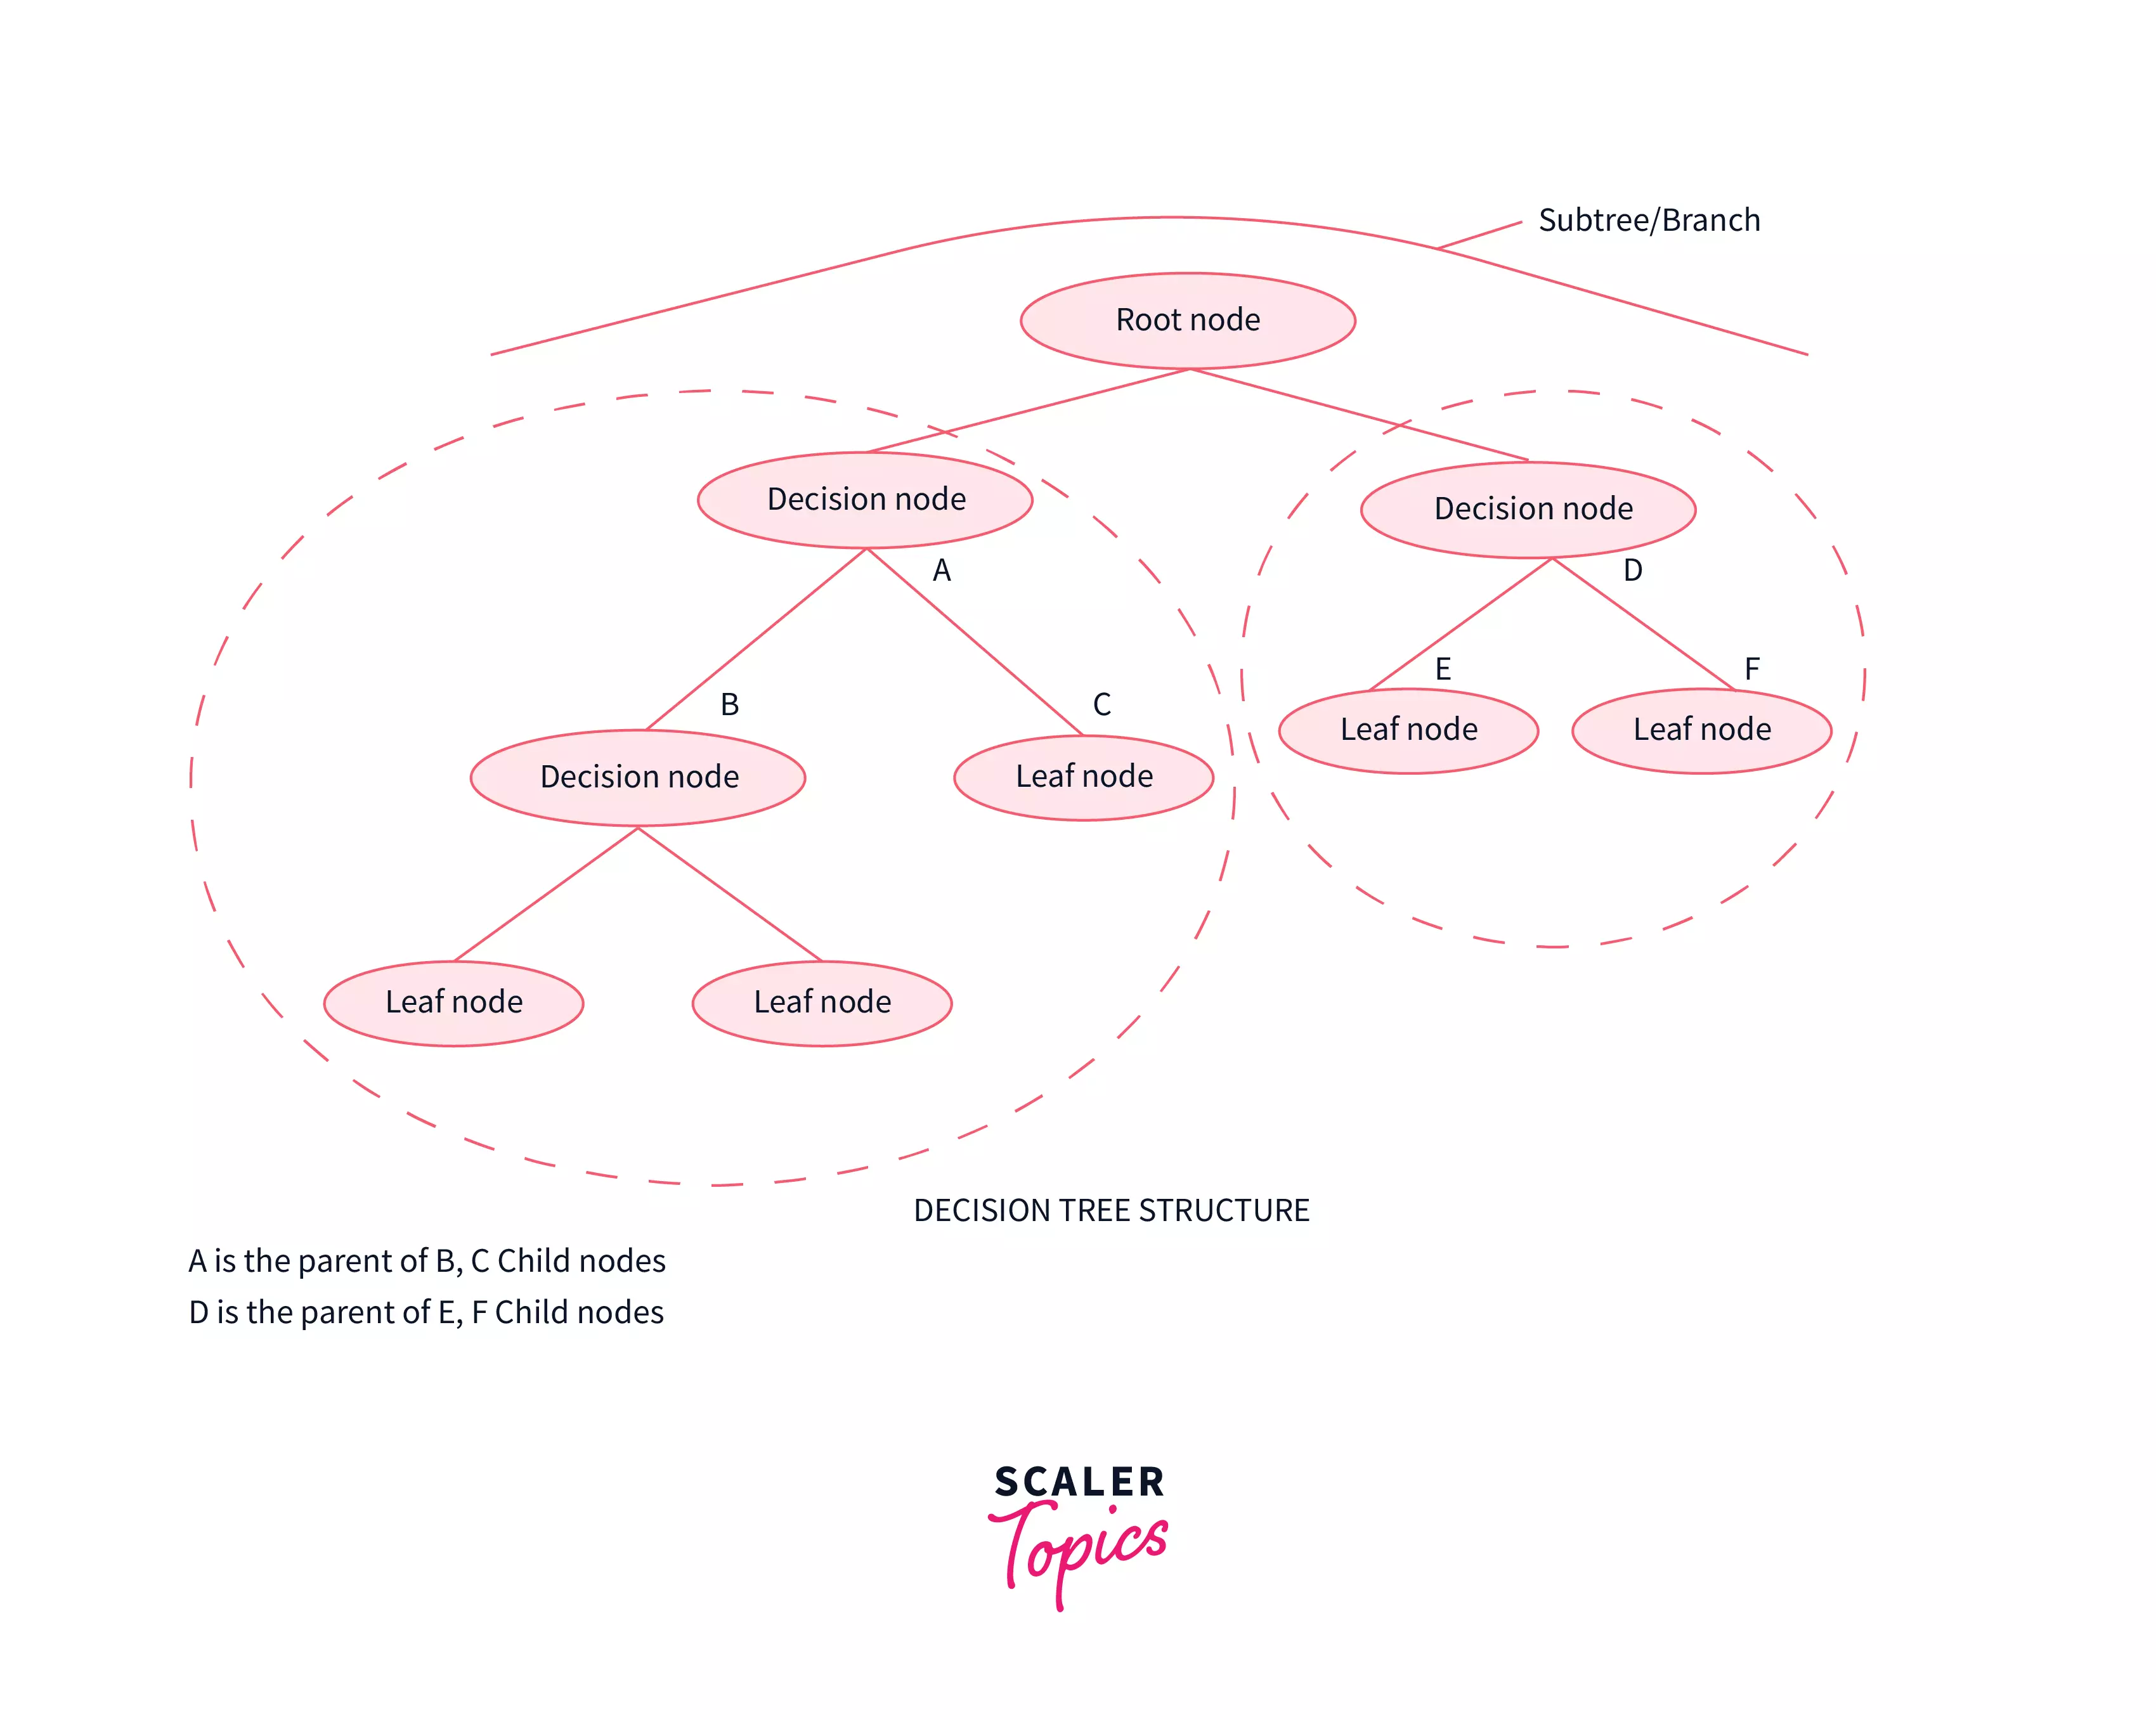
1) Root Node: The root node is the very first node in the tree. This node initiates the whole decision-making process by further getting divided into 2 or more sets of nodes and each node consists of a feature in the data set.
2) Splitting: A node is broken down into sub-nodes at every level and this process is called splitting.
3) Decision Node: When a node can be broken down into 2 or more nodes then it’s called a decision node. This breaking down happens according to the number of different decisions that can be made from that particular node.
4) Leaf / Terminal Node: Nodes that cannot be broken down into sub-nodes anymore.
5) Pruning: This is the process of removing an unwanted part of a tree. To be precise it can be a node (or) a branch in the tree too.
6) Branch / Sub-Tree: When a tree is split into different sub-parts it is known to be a branch in a tree (or) a subtree.
7) Parent and Child Node: When a node is divided into sub-nodes the sub-nodes are called the child nodes and the node that got split is called the parent node of all these child nodes.
Assumptions While Creating a Decision Tree
1) All the training data is passed to the root node. Training data is the data that we use to train the machine model and the model learns using this data and makes predictions on the test data.
2) The features (or) the attributes in the dataset are preferred to be categorical (or) discrete .
3) If the features are continuous in the data set, they are discretized before data modeling.
4) Recursive distribution of the records is done on the values of the feature/attribute.
5) The order of having a root node followed by internal nodes followed by leaf nodes is done using statistical methods.
Algorithms
- ID3 :
ID3stands forIterative Dichotomiser 3. This algorithm iteratively divides features into two or more groups at each step. Here “Iterative” means continuous/repeated and “dichotomiser” means dividing.ID3follows a top-down approach i.e the tree is built from the top and at every step greedy approach is applied. The greedy approach means that at each iteration we select the best feature at the present moment to create a node and this node is again split after applying some statistical methods.ID3generally is not a very ideal algorithm as it overfits when the data is continuous. - C4.5: It is considered to be better than the
ID3algorithm as it can handle both discrete and continuous data. InC4.5splitting is done based on Information gain (attribute selection measure ) and the feature with the highest Information gain is made the decision node and is further split.C4.5handles overfitting by the method of pruning i.e it removes the branches/subpart of the tree that does not hold much importance (or) is redundant. To be specific,C4.5follows post pruning i.e removing branches after the tree is created. - CART:
CARTstands forclassification and regression trees. As the name suggestsCARTcan also perform both classification and regression-based tasks.CARTuses Gini’s impurity index as an attribute selection method while splitting a node into further nodes when it’s a classification-based use case and uses sum squared error as an attribute selection measure when the use case is regression-based. WhileCARTuses Gini Index as anASM(attribute selection measure),C4.5andID3use information gain as anASM. - CHAID:
CHAIDstands for Chi-square Automatic Interaction Detector. It is known to be the oldest of all three algorithms in history and is used very less these days. InCHAIDchi-square is the attribute selection measure to split the nodes when it’s a classification-based use case and usesF-testas an attribute selection measure when it is a regression-based use case. Higher the chi-square value higher is the preference given to that feature. The major difference betweenCHAIDandCARTis,CARTsplits one node into two nodes whereasCHAIDsplits one node into2or more nodes. - MARS:
MARSstands forMultivariate adaptive regression splines. It is an algorithm that was specifically designed to handle regression-based tasks, provided, the data is non-linear.
Why Use Decision Trees?
Here are some of the reasons that state why we should use decision trees while working on machine learning use cases.
1) While using decision trees we get to see the problem more clearly and understand which node is giving rise to what as it forms a tree-like structure. A decision tree almost works like a person doing their day-to-day activities and taking the best decisions related to a certain situation based on various deciding factors.
2) Decision trees help us to see all possible cases that a decision can lead to and help us make the decision accordingly.
3) It helps us in mathematically finding out the probabilities of achieving a certain outcome
How Does Decision Tree Algorithm Work?
Let’s look at the steps that the decision tree algorithm follows.
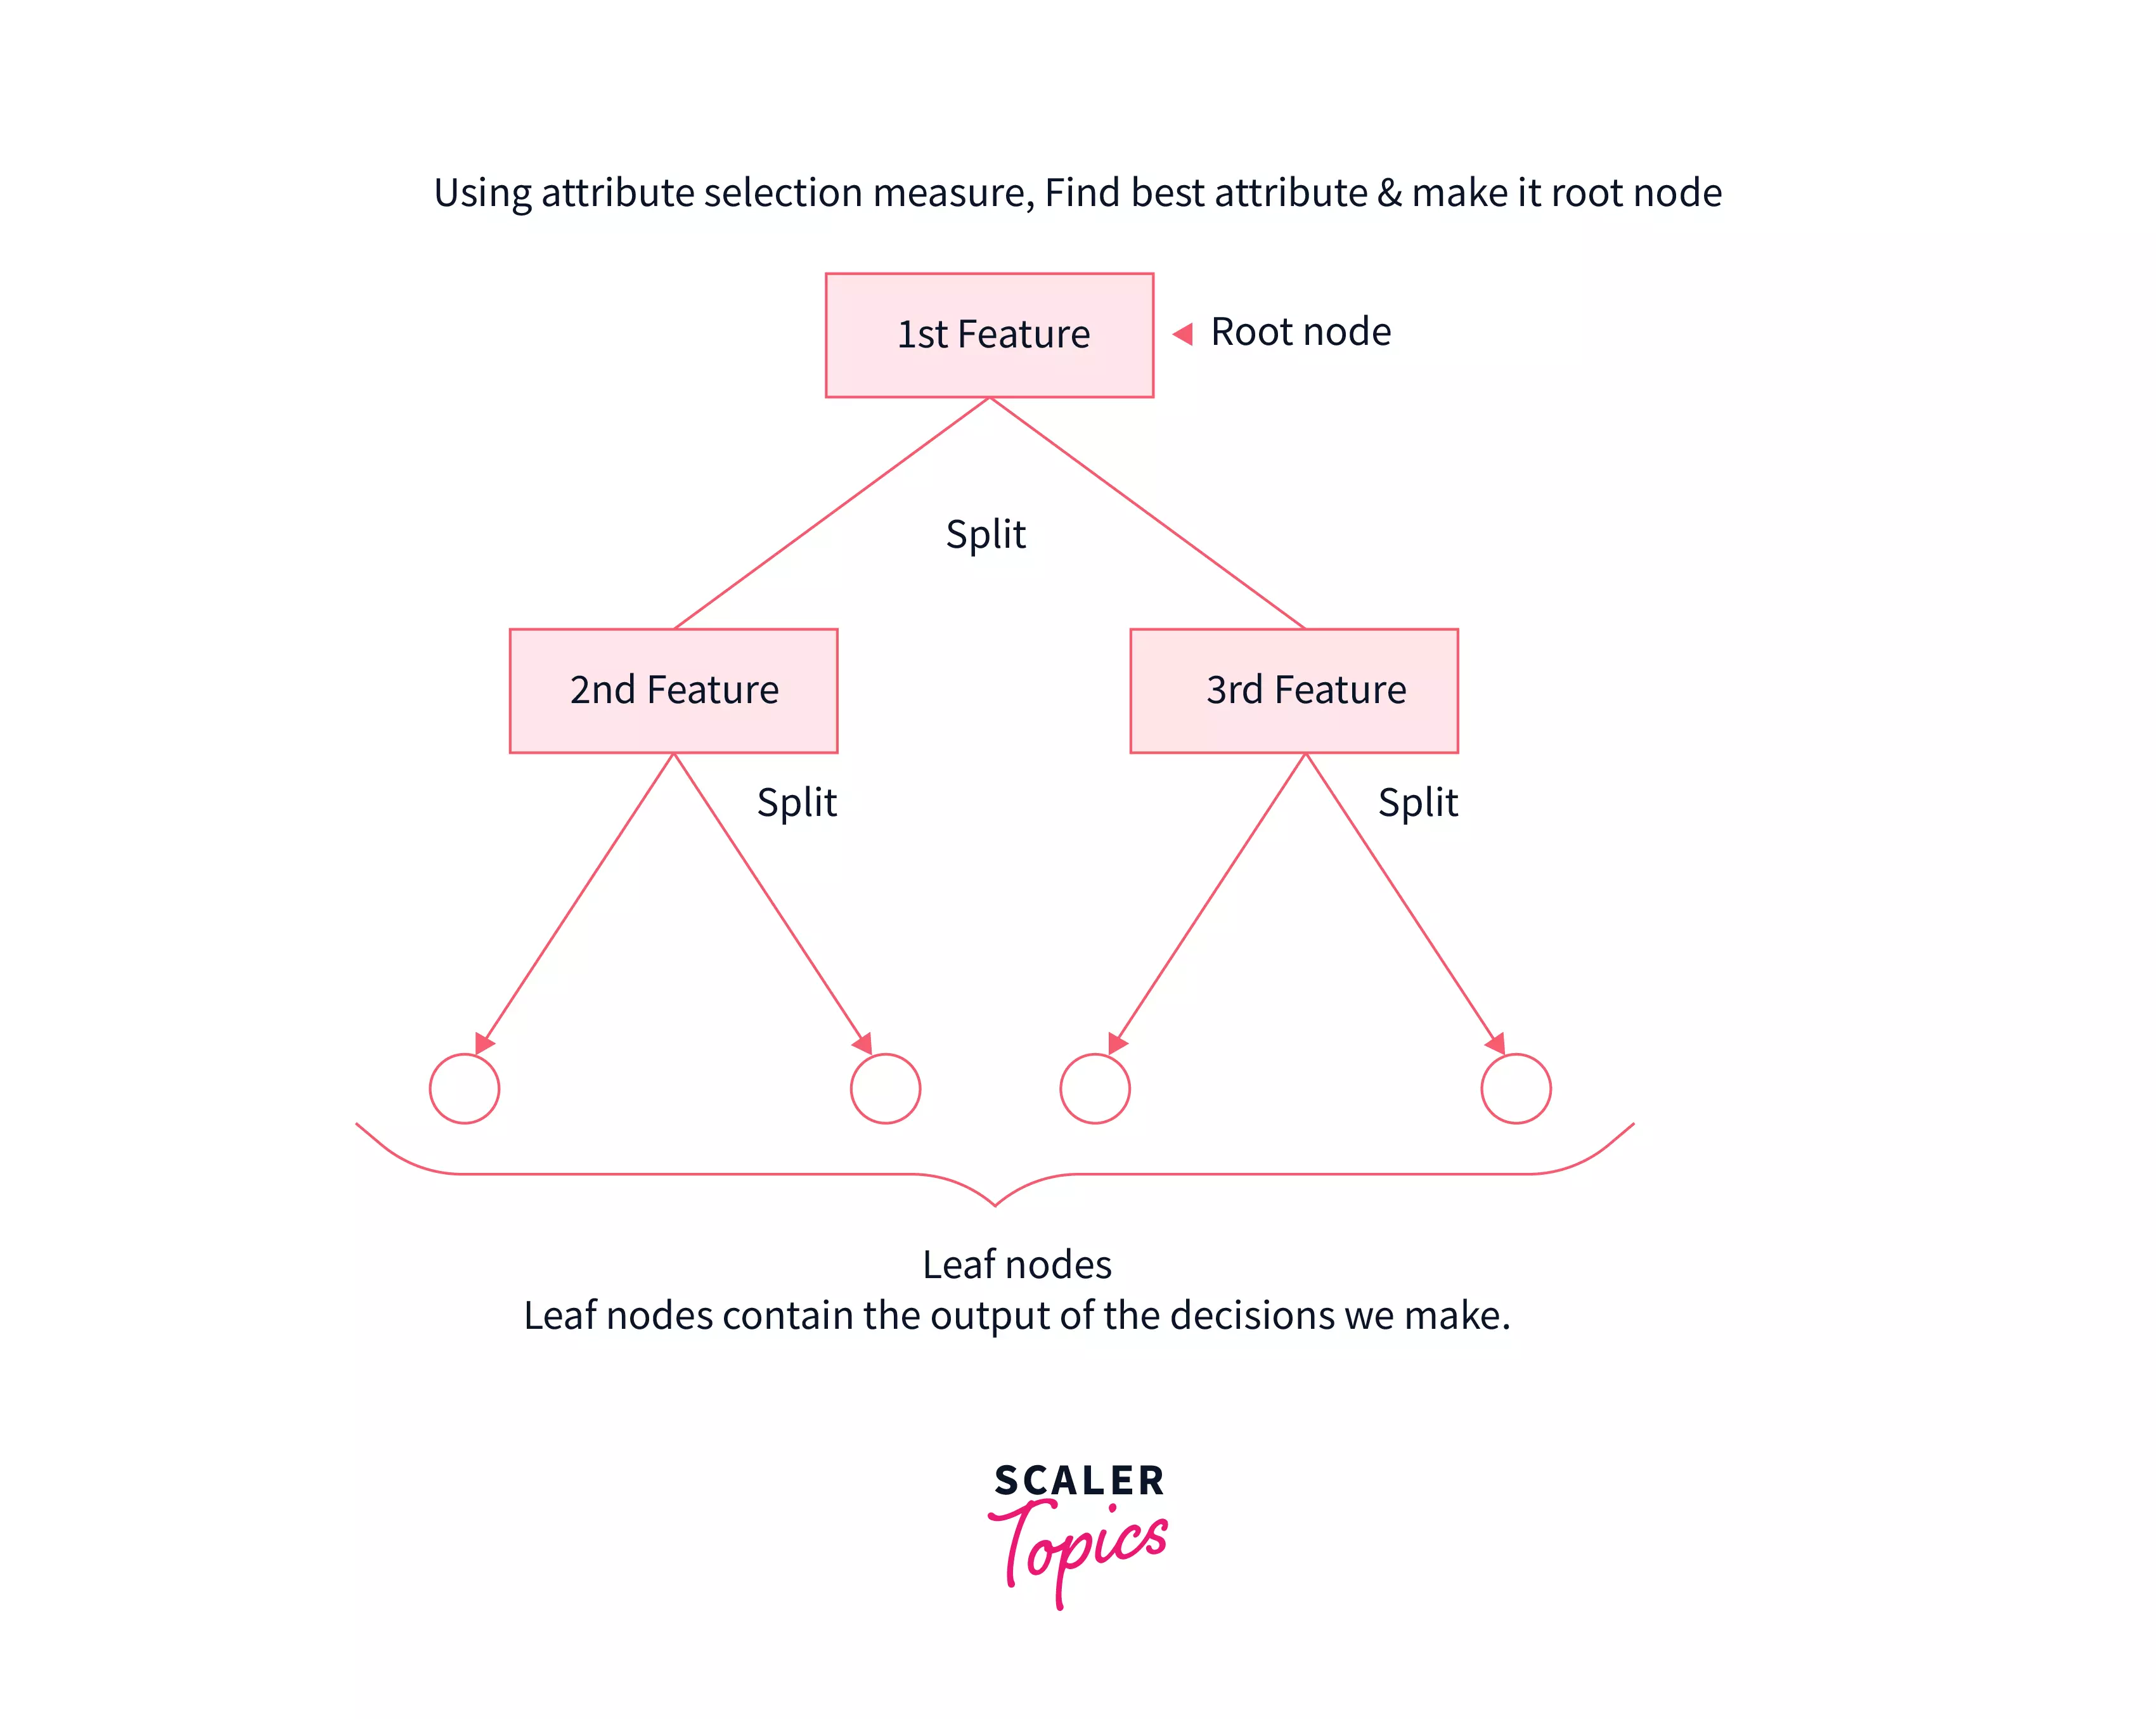
Step 1: The first node of the tree is always the root node and it consists of the whole dataset. Let’s refer to the root node as S.
Step 2: Use attribute selection measures to find the best attribute.
Step 3: Now divide the root node (S) into subsets that contain various possible values of the best attribute that you found out in step 2.
Step 4: Now generate a decision tree node that consists of the best attribute.
Step 5: Now make new decision trees using the subsets that were created in step – 3. Do this step recursively till the node cannot be divided anymore i.e leaf node.
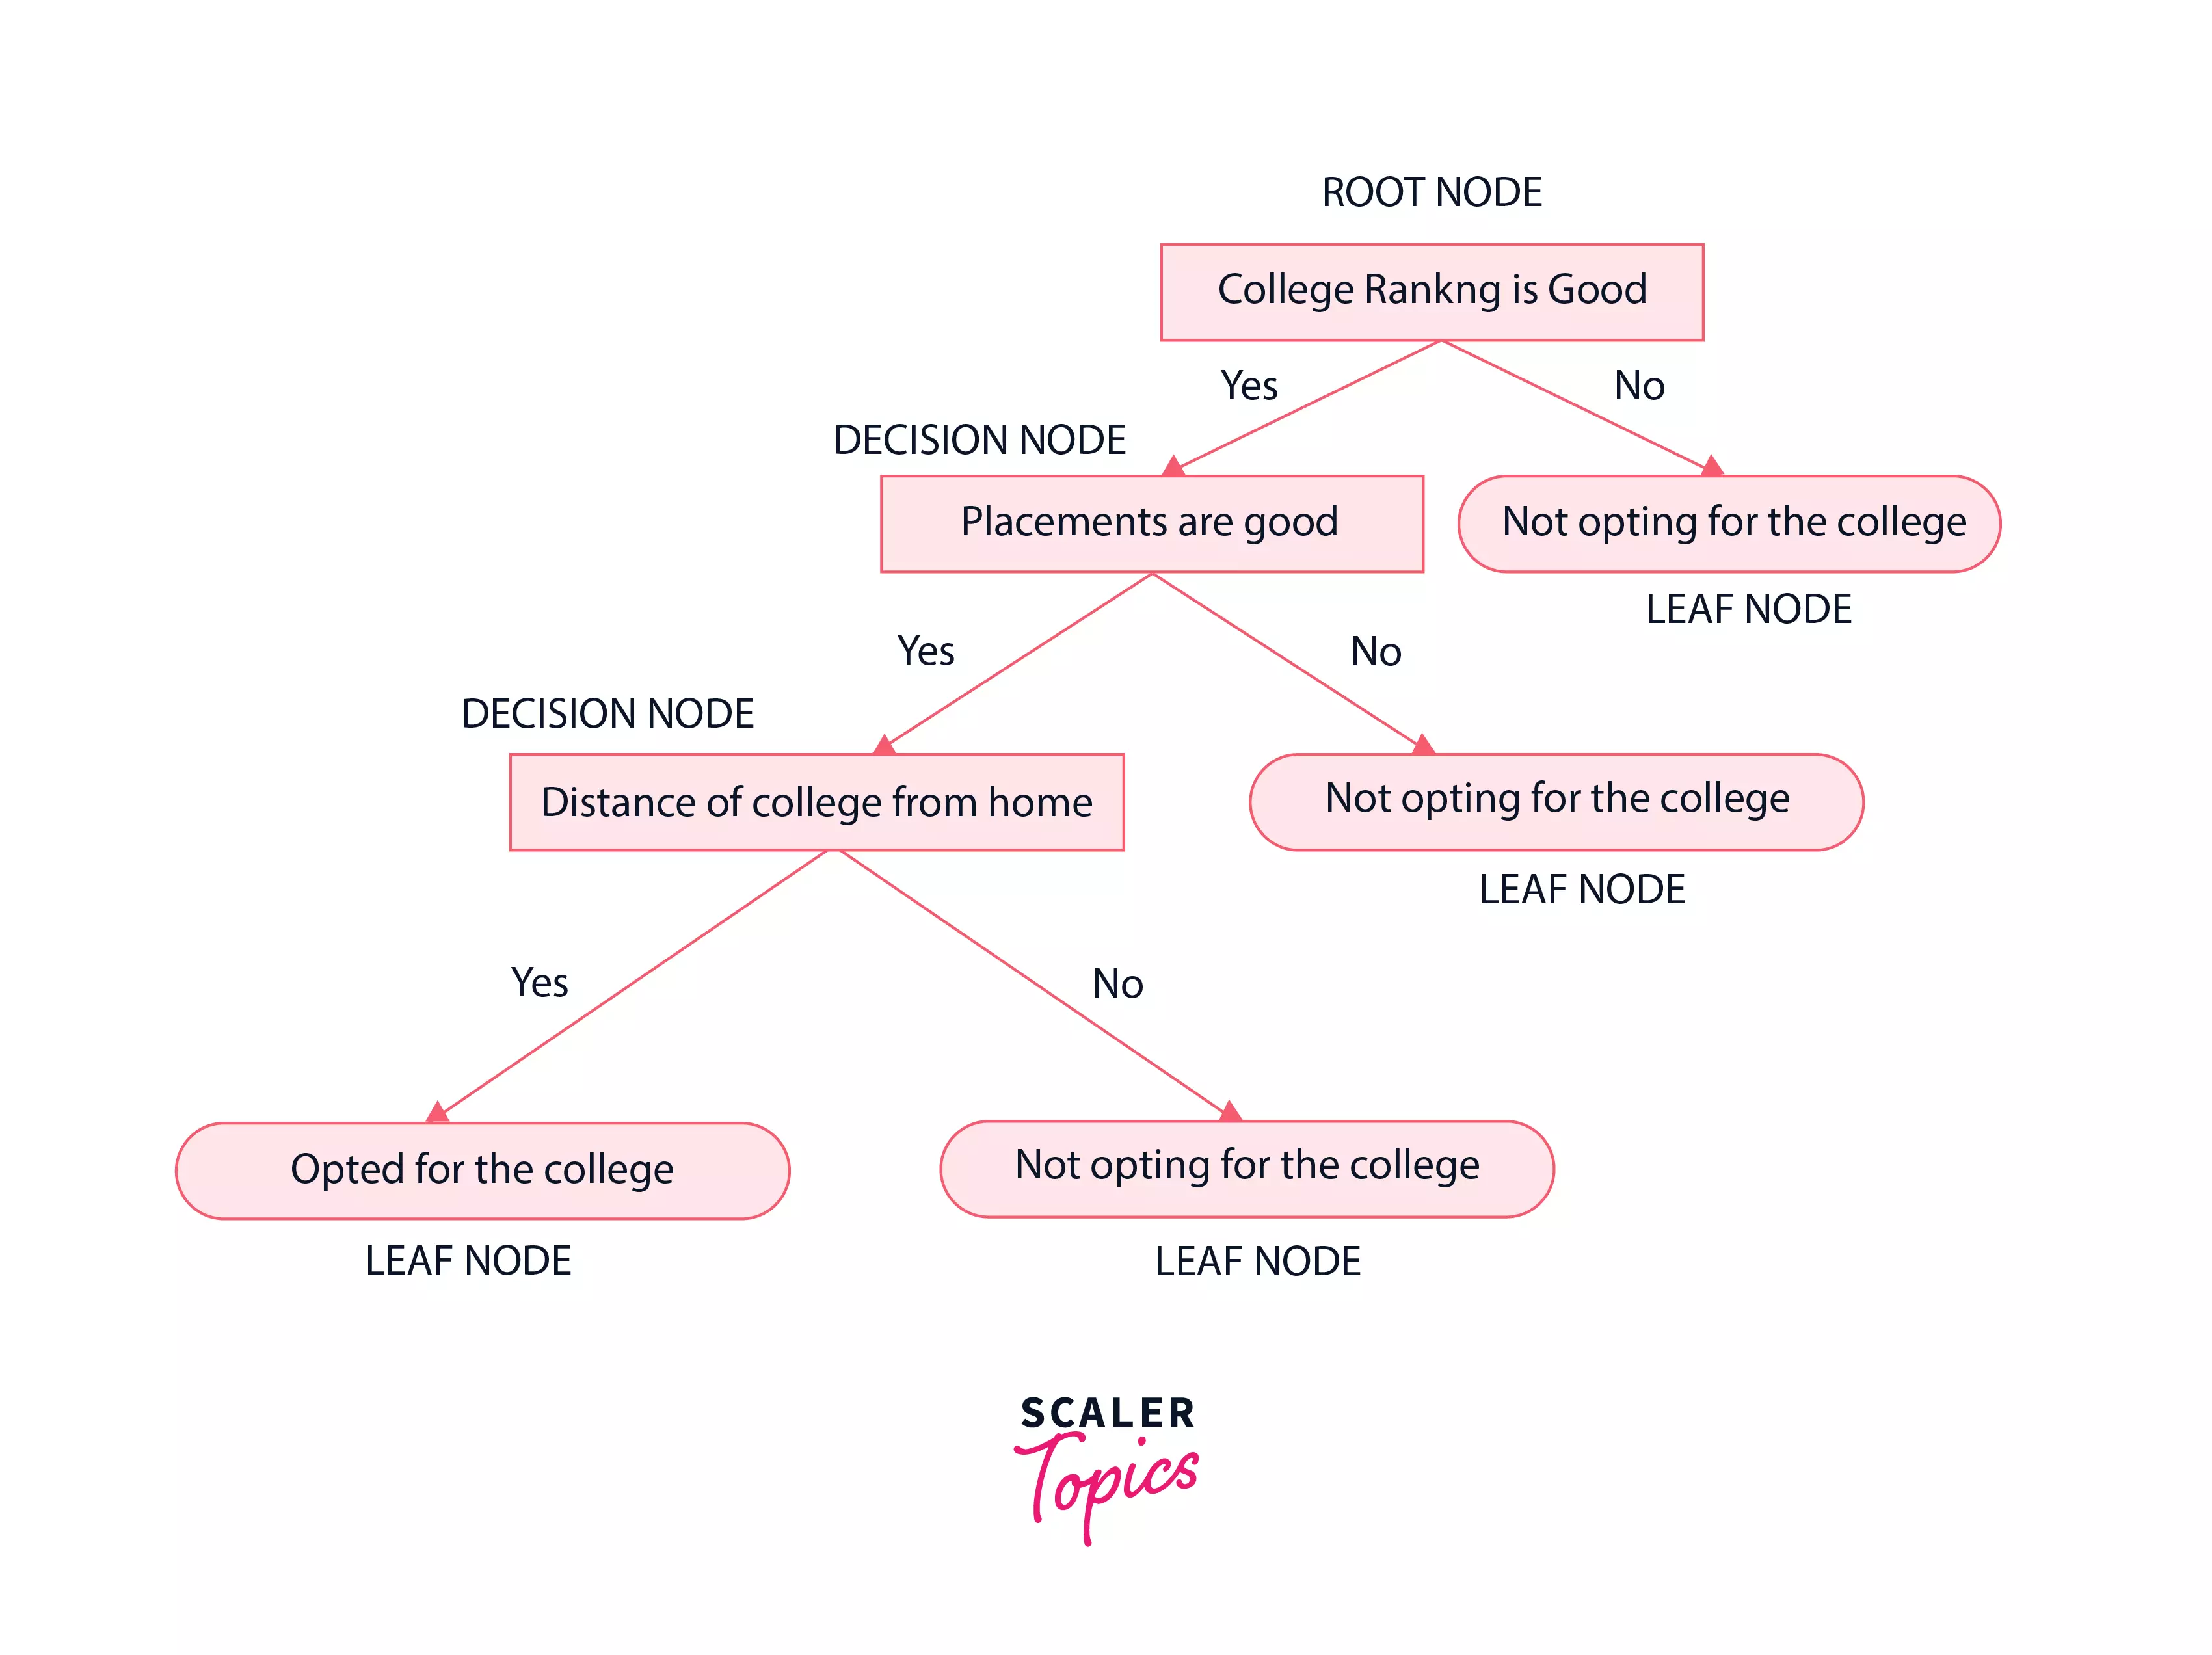
Let’s say there is a student who wants to join an engineering college and wants to decide among the various options he/she has.
Let’s approach this problem using decision trees. The decision tree starts with the root node
The root node then splits into the next decision node(placements at college) & a leaf node( not opting for the college because the college ranking isn’t good ).
The next decision node further gets split into one decision node ( distance of college from home) and one leaf node ( not opting for the college because the placements aren’t good ). Lastly, the decision node splits into two leaf nodes ( Opting for the college and Not opting for the college.). Consider the below diagram.
Attribute Selection Measures
In general, there are different features/attributes in a dataset. We randomly cannot make a feature/attribute as the root node and then follow the same for every decision node. Doing so would lead to a very wrong model that will make wrong decisions based on unuseful features.
So to solve this problem, we have something called Attribute Selection Measures
Here is a list of some attribute selection measures.
1) Entropy
2) Information gain
3) Gini index
4) Gain Ratio
5) Reduction in Variance
6) Chi-Square**
Let’s discuss each one of them:
Entropy
It is the measure of impurity (or) uncertainty in the data. It lies between 0 to 1 and is calculated using the below formula.

For example, let’s see the formula for a use case with 2 classes- Yes and No.
Here Yes and No are two classes and s is the total number of samples. P(Yes) is the probability of Yes and P(No) is the probability of No.
If there are many classes then the formula is
Here n is the number of classes.
The entropy of each feature after every split is calculated and the splitting is continued. The lesser the entropy the better will be the model because the classes would be split better because of less uncertainty.
Information Gain
Information gain is simply the measure of change in entropy. The higher the information gain, the lower is the entropy. Thus for a model to be good, it should have high Information gain. A decision tree algorithm in general tries to maximize the value of information gain, and an attribute/feature having the highest information gain is split first.

Where “before” is the dataset before the split, N is the number of subsets that got generated after we split the node, and (i, after) is the subset ‘i’ after the split.
Gini Index
It is a measure of purity or impurity while creating a decision tree. It is calculated by subtracting the sum of the squared probabilities of each class from one. It is the same as entropy but is known to calculate quicker as compared to entropy. CART ( Classification and regression tree ) uses the Gini index as an attribute selection measure to select the best attribute/feature to split. The attribute with a lower Gini index is used as the best attribute to split.

Here ‘i’ is the no. of classes.
Gain Ratio
The Gain Ratio solves the problem of Bias in Information gain. Information gain shows bias towards the nodes that have a large number of values i.e if an attribute has a large set of values in the data set then makes it a root node. This is something that isn’t appreciated while designing a model, so to solve this problem of bias, the number of branches that a node would split into is something that is taken under consideration by the gain ratio while splitting a node. The gain ratio is defined as the ratio of information gain and intrinsic information (or) split info.
Here intrinsic information/split info refers to the entropy of sub-dataset proportions.
The formula for gain ratio is:

Reduction in variance
It is used when the data we have is continuous in nature. Variance simply refers to the change in the model when using different subparts of the training data. The split with lower variance is taken into consideration. To use variance as an attribute selection measure, firstly calculate variance for each node followed by calculating variance for each split.

X bar is the mean of the values, X is actual and n is the number of values.
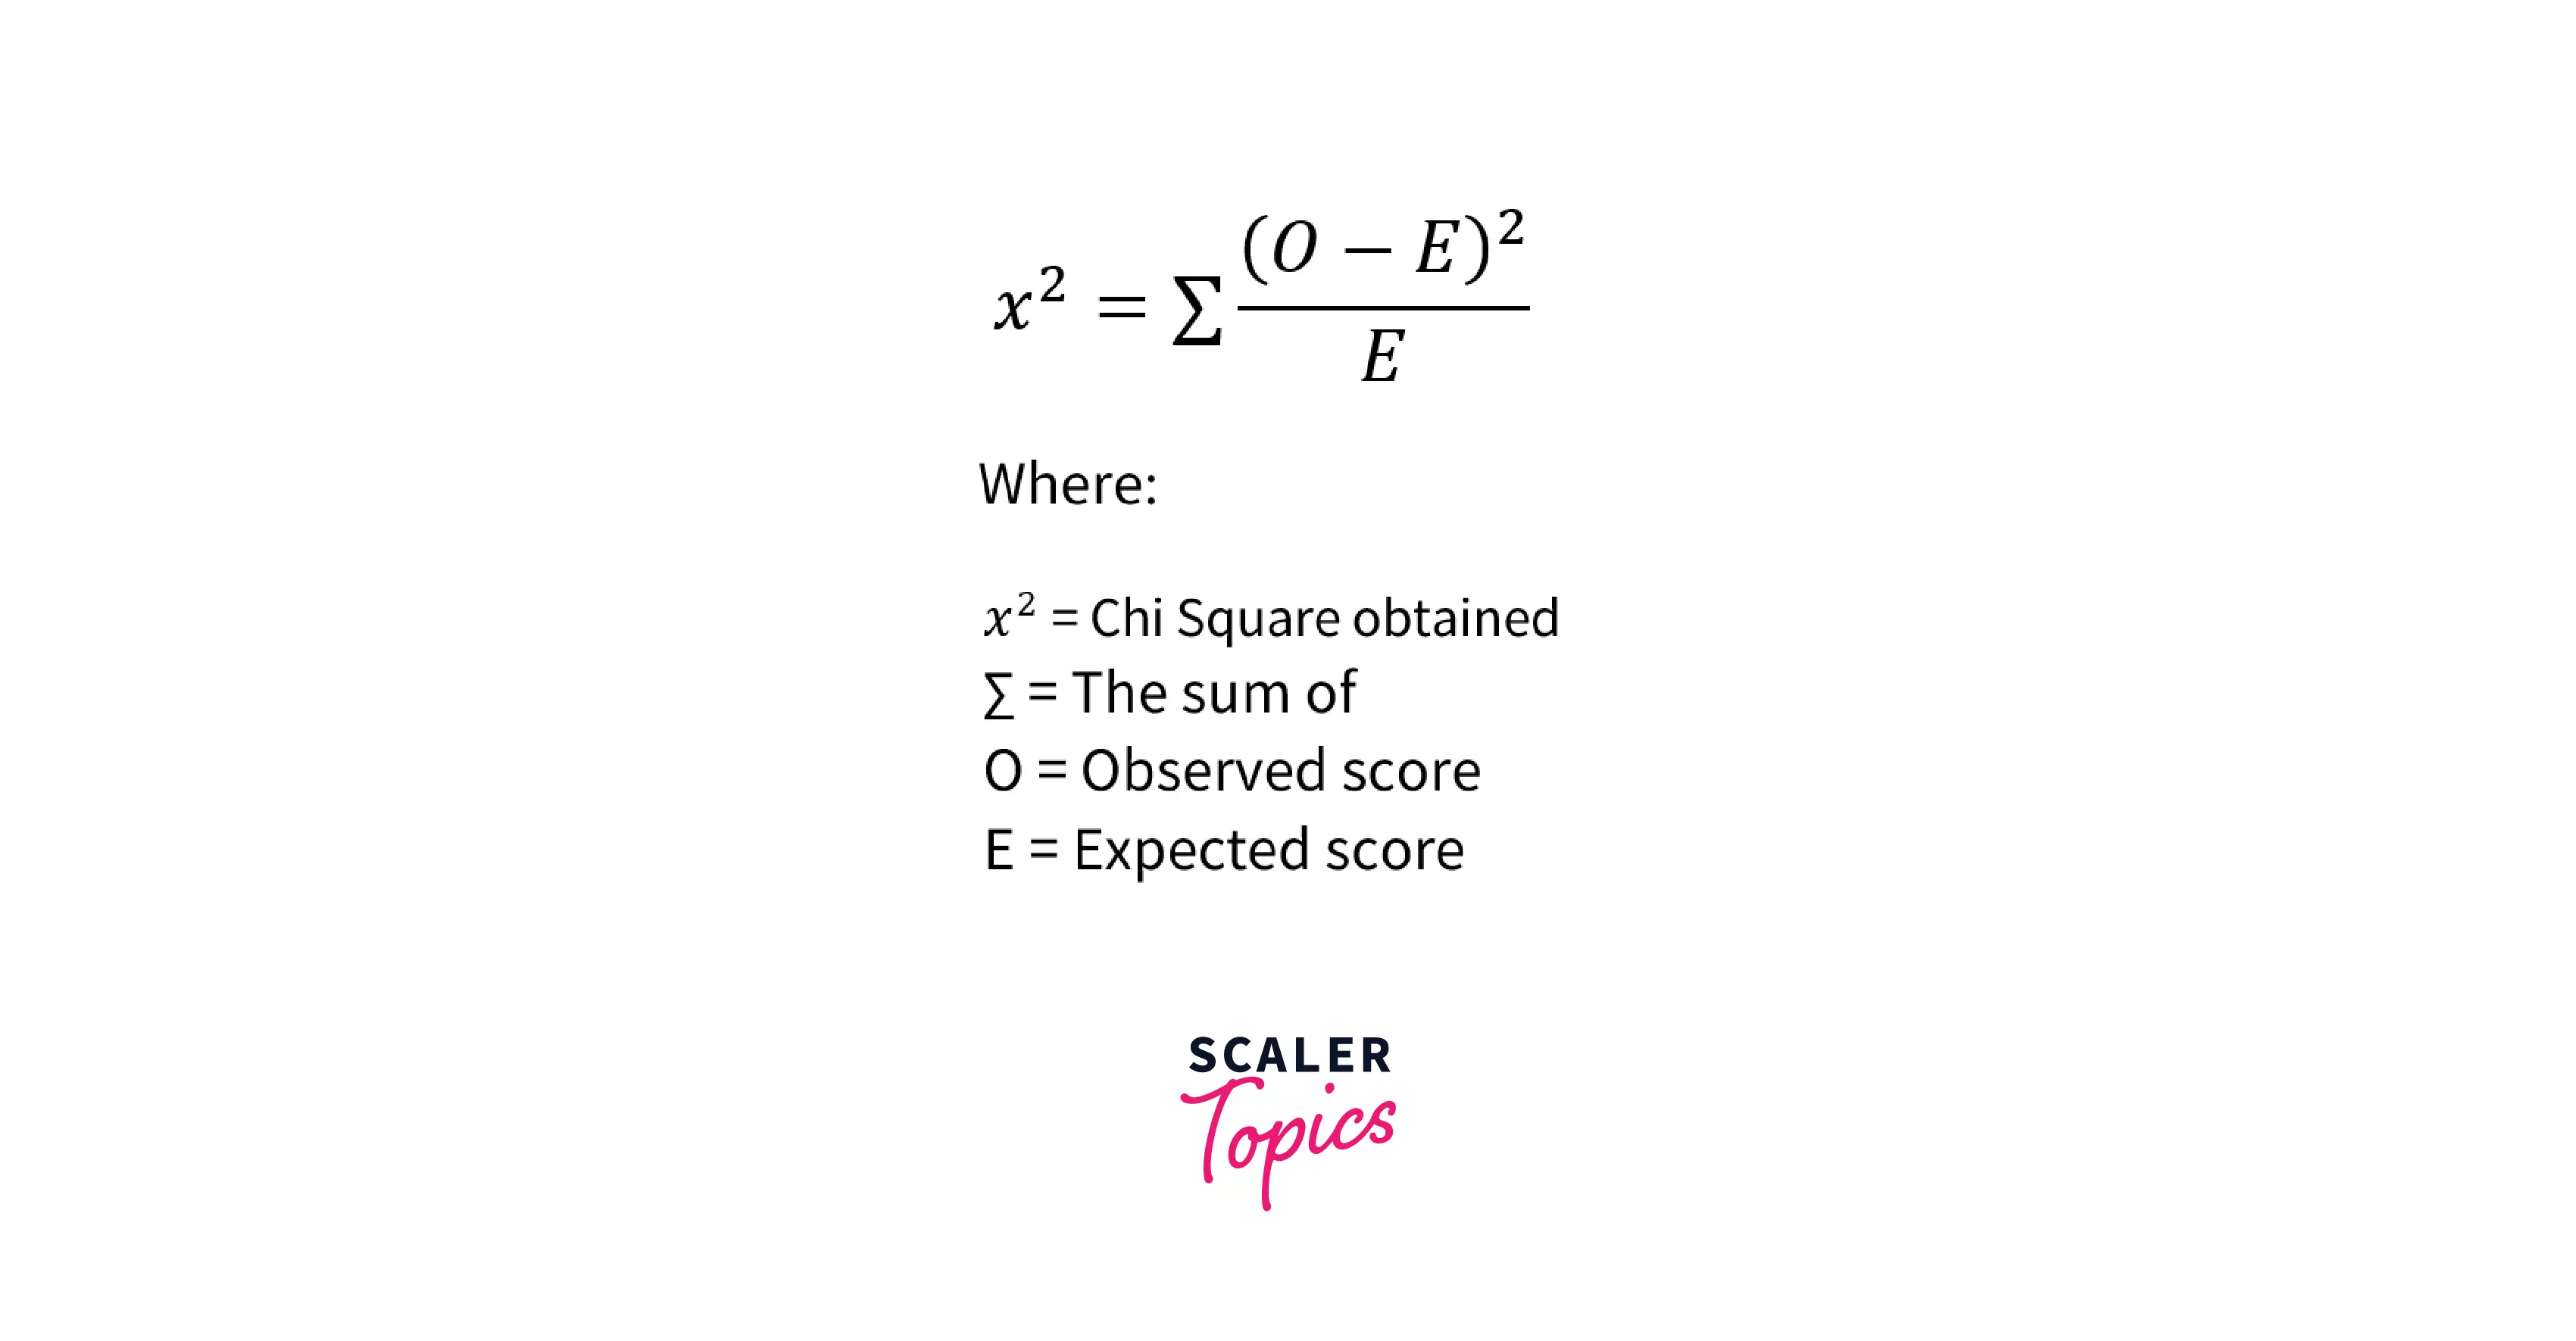
Chi-Square
Chi-Square is a comparison between observed results and expected results. This statistical method is used in CHAID(Chi-square Automatic Interaction Detector). CHAID in itself is a very old algorithm that is not used much these days. The higher the value of chi-square, higher is the difference between the current node and its parent.
The formula for chi – square is
Advantages and Disadvantages
Advantages
Decision treecan work on both categorical and numeric data.- This algorithm does not need much preprocessing of the data set. Here preprocessing refers to cleaning (or) normalizing (or) scaling the dataset. Thus it is considered a better algorithm when compared to other algorithms.
Decision treecan be easily understood by any layperson as it mimics the nature of the human when making a decision.Decision treehelps us to think about all possible outcomes that a decision can lead to.
Disadvantages
Decision treeis not that efficient when it comes to regression-based use cases.- If the class labels are more, the depth of the tree increases. Thus making the algorithm more time taking to perform calculations for every label. This leads to more training time.
Decision treesometimes faces the problem of overfitting that can be resolved by certain methods like pruning, discretizing the data, using random forest algorithm.
Applications
Decision trees are used in various sectors & disciplines in the world. Let’s look at a few.
Education

The education sector takes uses student data like marks in boards, marks in the entrance test, the reservation that a student holds, etc., and gives rankings to a student that he/she uses to join colleges/organizations.
Banking & Finance

When a customer of a bank approaches for a loan, his/her capability to pay the bank loan is calculated using decision trees. Here the factors that decide if he/she can pay back the loan are age, salary, no. of members in the family, existing loans, etc. Other than this, fraud detection in the finance sector is also something that the decision tree algorithm facilitates.
Healthcare & Diagnosis

In the healthcare sector, decision trees are used to check whether a person is suffering from a disease or not by taking some health factors into consideration. For example: Classify if a person has cancer, classify if a person has diabetes, etc.
Marketing and Business Growth

Targeted advertisements are something that businesses do in order to market their product, decision tree in this case helps in segmenting the audience that can be targeted using some factors like age of the audience, location of the audience, mindset of the audience, etc. Speaking about the growth of the business, the past sales data of the company is taken under condition and analyzed in order to find patterns that can be used to make any business strategies in the current scenario of the business.
How to Avoid Overfitting in Decision Trees?
Overfitting is a scenario that occurs when the machine learning model completely fits the training data ( learns everything in detail about the training data) such that it fails while performing on the new test data set. Example: Let’s say you practice trigonometry formulas for a week and you know them by heart. Now in the exam, you get questions based on calculus, will you be able to perform well (or) will you fail? This is exactly what happens in overfitting.
In Decision trees, there might be chances of overfitting sometimes. So, let’s understand some methods using which we can avoid overfitting in decision trees.
Pruning
Pruning is simply cutting off the branches of the decision tree. Here we prune out the branches that do not hold much importance (or) are redundant. Pruning out branches means removing the features of the dataset that do not contribute much to making decisions in a decision tree. There are 2 types of pruning Pre pruning & Post pruning. Pre pruning is when the branches/subparts/sections of a tree are removed during setting up a tree. Post pruning is when branches/subparts/sections of a tree are removed after the tree is completely constructed.
Discretization
Making data discretized is something that is necessary in order to control overfitting because when the data is continuous, the model finds it hard to make decisions.
Using Ensemble methods (or) Random Forest Algorithm
Random forest is an ensemble-based learning algorithm. Ensemble learning is simply the combination of 2 or more machine learning algorithms in order to increase the performance of accuracy while generating predictions. Ensembling prevents overfitting by resampling the training data continuously and helps generate many decision trees for the same data set.
Which is Better Linear or Tree-based Models?
Before we answer this question let’s see what these two terms mean. The linear model means that if we plot all the features/attributes in a data set including the outcome variable, there is a straight line or a hyperplane that we can draw in order to roughly estimate the outcome variable. Tree-based models are something that we already discussed in this article.
The answer to the question “Which is better Linear or tree-based models?” depends on the type of use case that we are trying to solve.
- When the variables in the data set are of a categorical type, tree-based models have an upper hand over linear models.
- If there is a heavy amount of non-linearity and the relationship between dependent and independent variables is complex, tree-based algorithms are way better as compared to linear models.
- If the relationship between dependent and independent variables can be plotted and a straight line of fit can be drawn to approximate the outcome variable then in that case linear models are better than tree-based models.
- Tree-based models are easy to understand and explain as compared to linear models.
Conclusion
- The
decision treealgorithm is a supervised learning model that can be used to solve both regression and classification-based use cases. - There are
2types ofdecision treesregression-based & classification based. - There are various decision tree algorithms namely
ID3,C4.5,CART,CHAID,MARS. - The different attribute selection measures that are used in
decision treesto find the best attribute to split are Entropy, Information gain, Gini index, Gain Ratio, Reduction in Variance. Chi-Square. Decision treesare used in sectors like healthcare, education, banking, marketing, etc.Overfittingindecision treescan be avoided by pruning, using ensemble methods, using random forest algorithm, and by discretizing the data set.