Monitoring and Scaling an Express Server
Overview
Monitoring and scaling an Express server is a critical aspect of managing and optimizing the performance of your web application. As your application grows and attracts more users, it becomes essential to continuously monitor the server's health and capacity and make necessary adjustments to ensure seamless operation. This article will explore the importance of monitoring and scaling an Express server and provide practical insights into effectively managing these processes.
Introduction
In today's digital landscape, where web applications play a crucial role in businesses of all sizes, ensuring the optimal performance and availability of your application is of utmost importance.
An Express server, built on top of Node.js, provides a robust framework for developing web applications. It offers a lightweight and flexible architecture that allows developers to create fast and efficient server-side applications. However, as the user base and traffic of your application increase, the server may encounter performance issues and struggle to handle the growing load. This can result in slower response times, increased error rates, and even server crashes, negatively impacting the user experience and potentially leading to lost business opportunities. This is where monitoring and scaling an Express server come into play.
What is express.js Monitoring?
Express.js monitoring refers to the process of tracking and analyzing the performance and behavior of an Express server to ensure its optimal operation. It involves monitoring various aspects of the server, such as CPU and memory usage, request rates, response times, error rates, and other relevant metrics. The goal of Express.js monitoring is to gain visibility into the server's health, identify potential performance bottlenecks, and take proactive measures to optimize its performance.
Monitoring an Express server allows you to gather real-time data about its behavior and performance. By continuously monitoring key metrics, you can identify trends, detect anomalies, and gain insights into the server's resource utilization. This data-driven approach enables you to make informed decisions regarding performance optimization, resource allocation, and capacity planning.
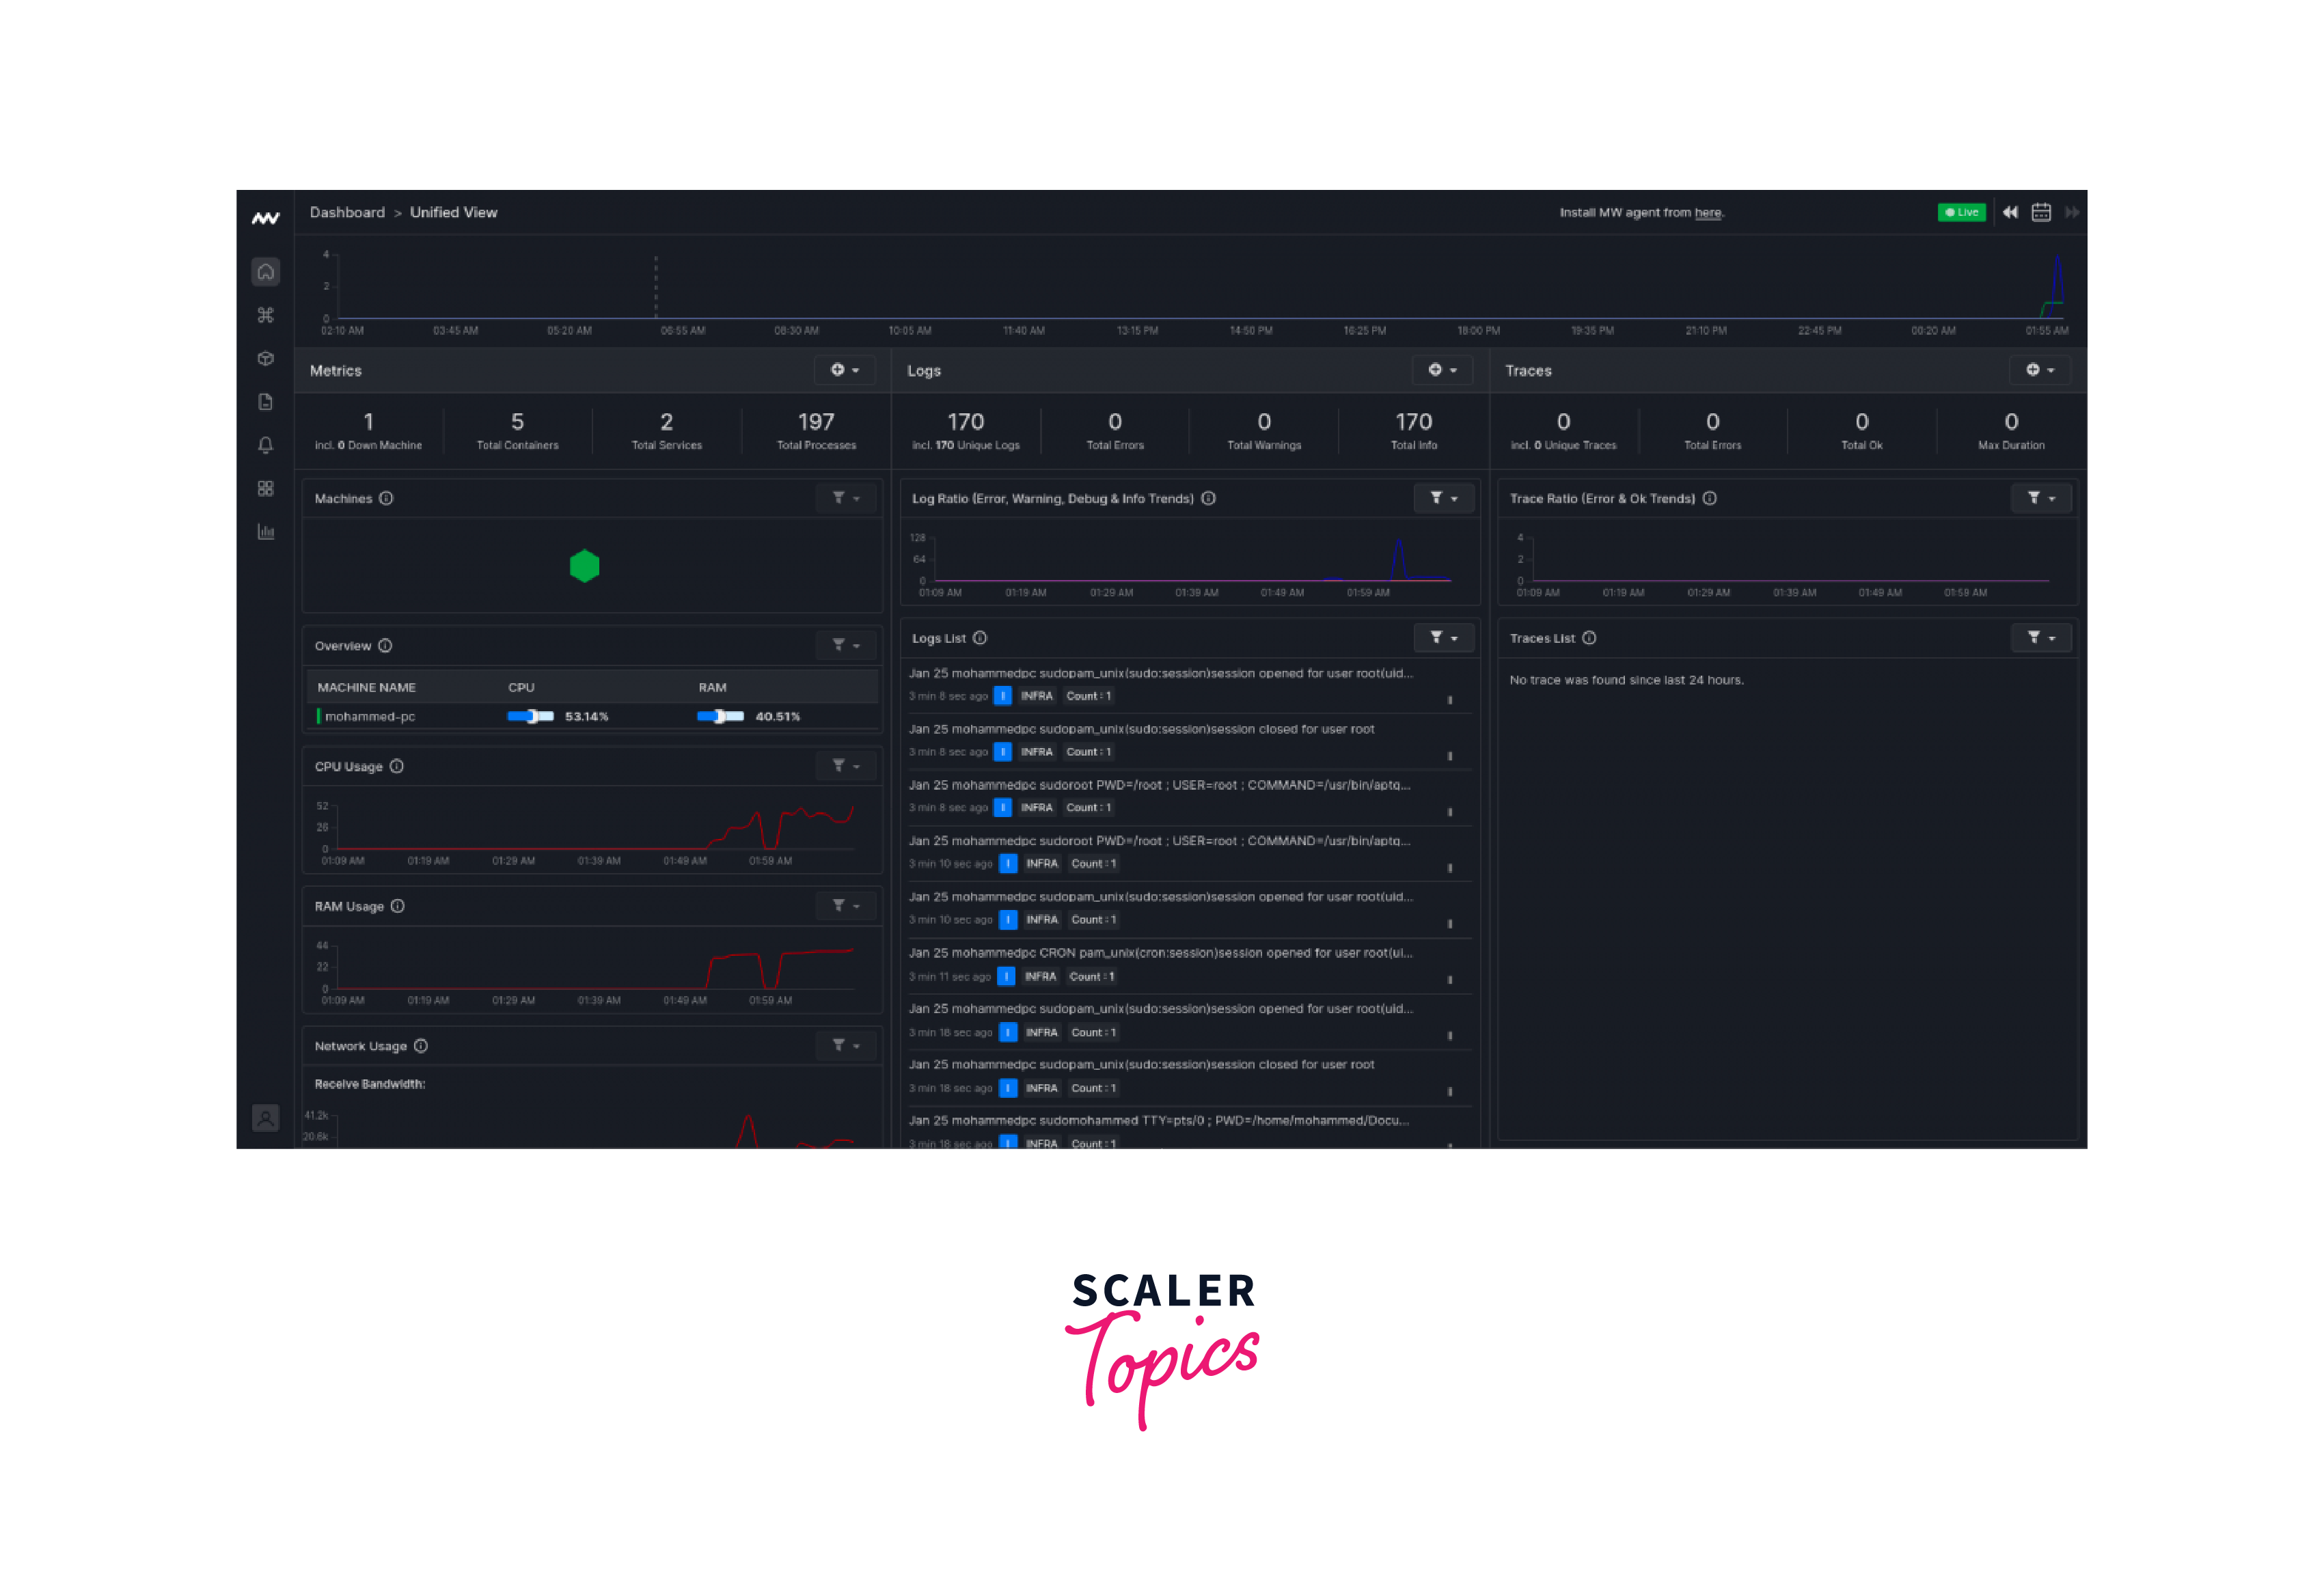
There are several tools and techniques available for monitoring an Express server. One common approach is to leverage monitoring solutions that provide real-time dashboards and visualizations of the server's performance metrics. These tools can collect and analyze data from various sources, such as server logs, application logs, and infrastructure metrics, to provide a comprehensive view of the server's health and performance.
Some popular monitoring tools for an Express server include:
- New Relic: New Relic is a widely used application performance monitoring (APM) tool that provides detailed insights into the performance of your Express server. It offers real-time monitoring, alerting, and diagnostic capabilities, allowing you to identify performance bottlenecks and optimize your server's performance.
- Datadog: Datadog is another powerful monitoring platform that offers comprehensive visibility into your Express server's performance. It provides monitoring and analytics for various metrics, including infrastructure, application performance, and logs, enabling you to gain a holistic understanding of your server's behavior.
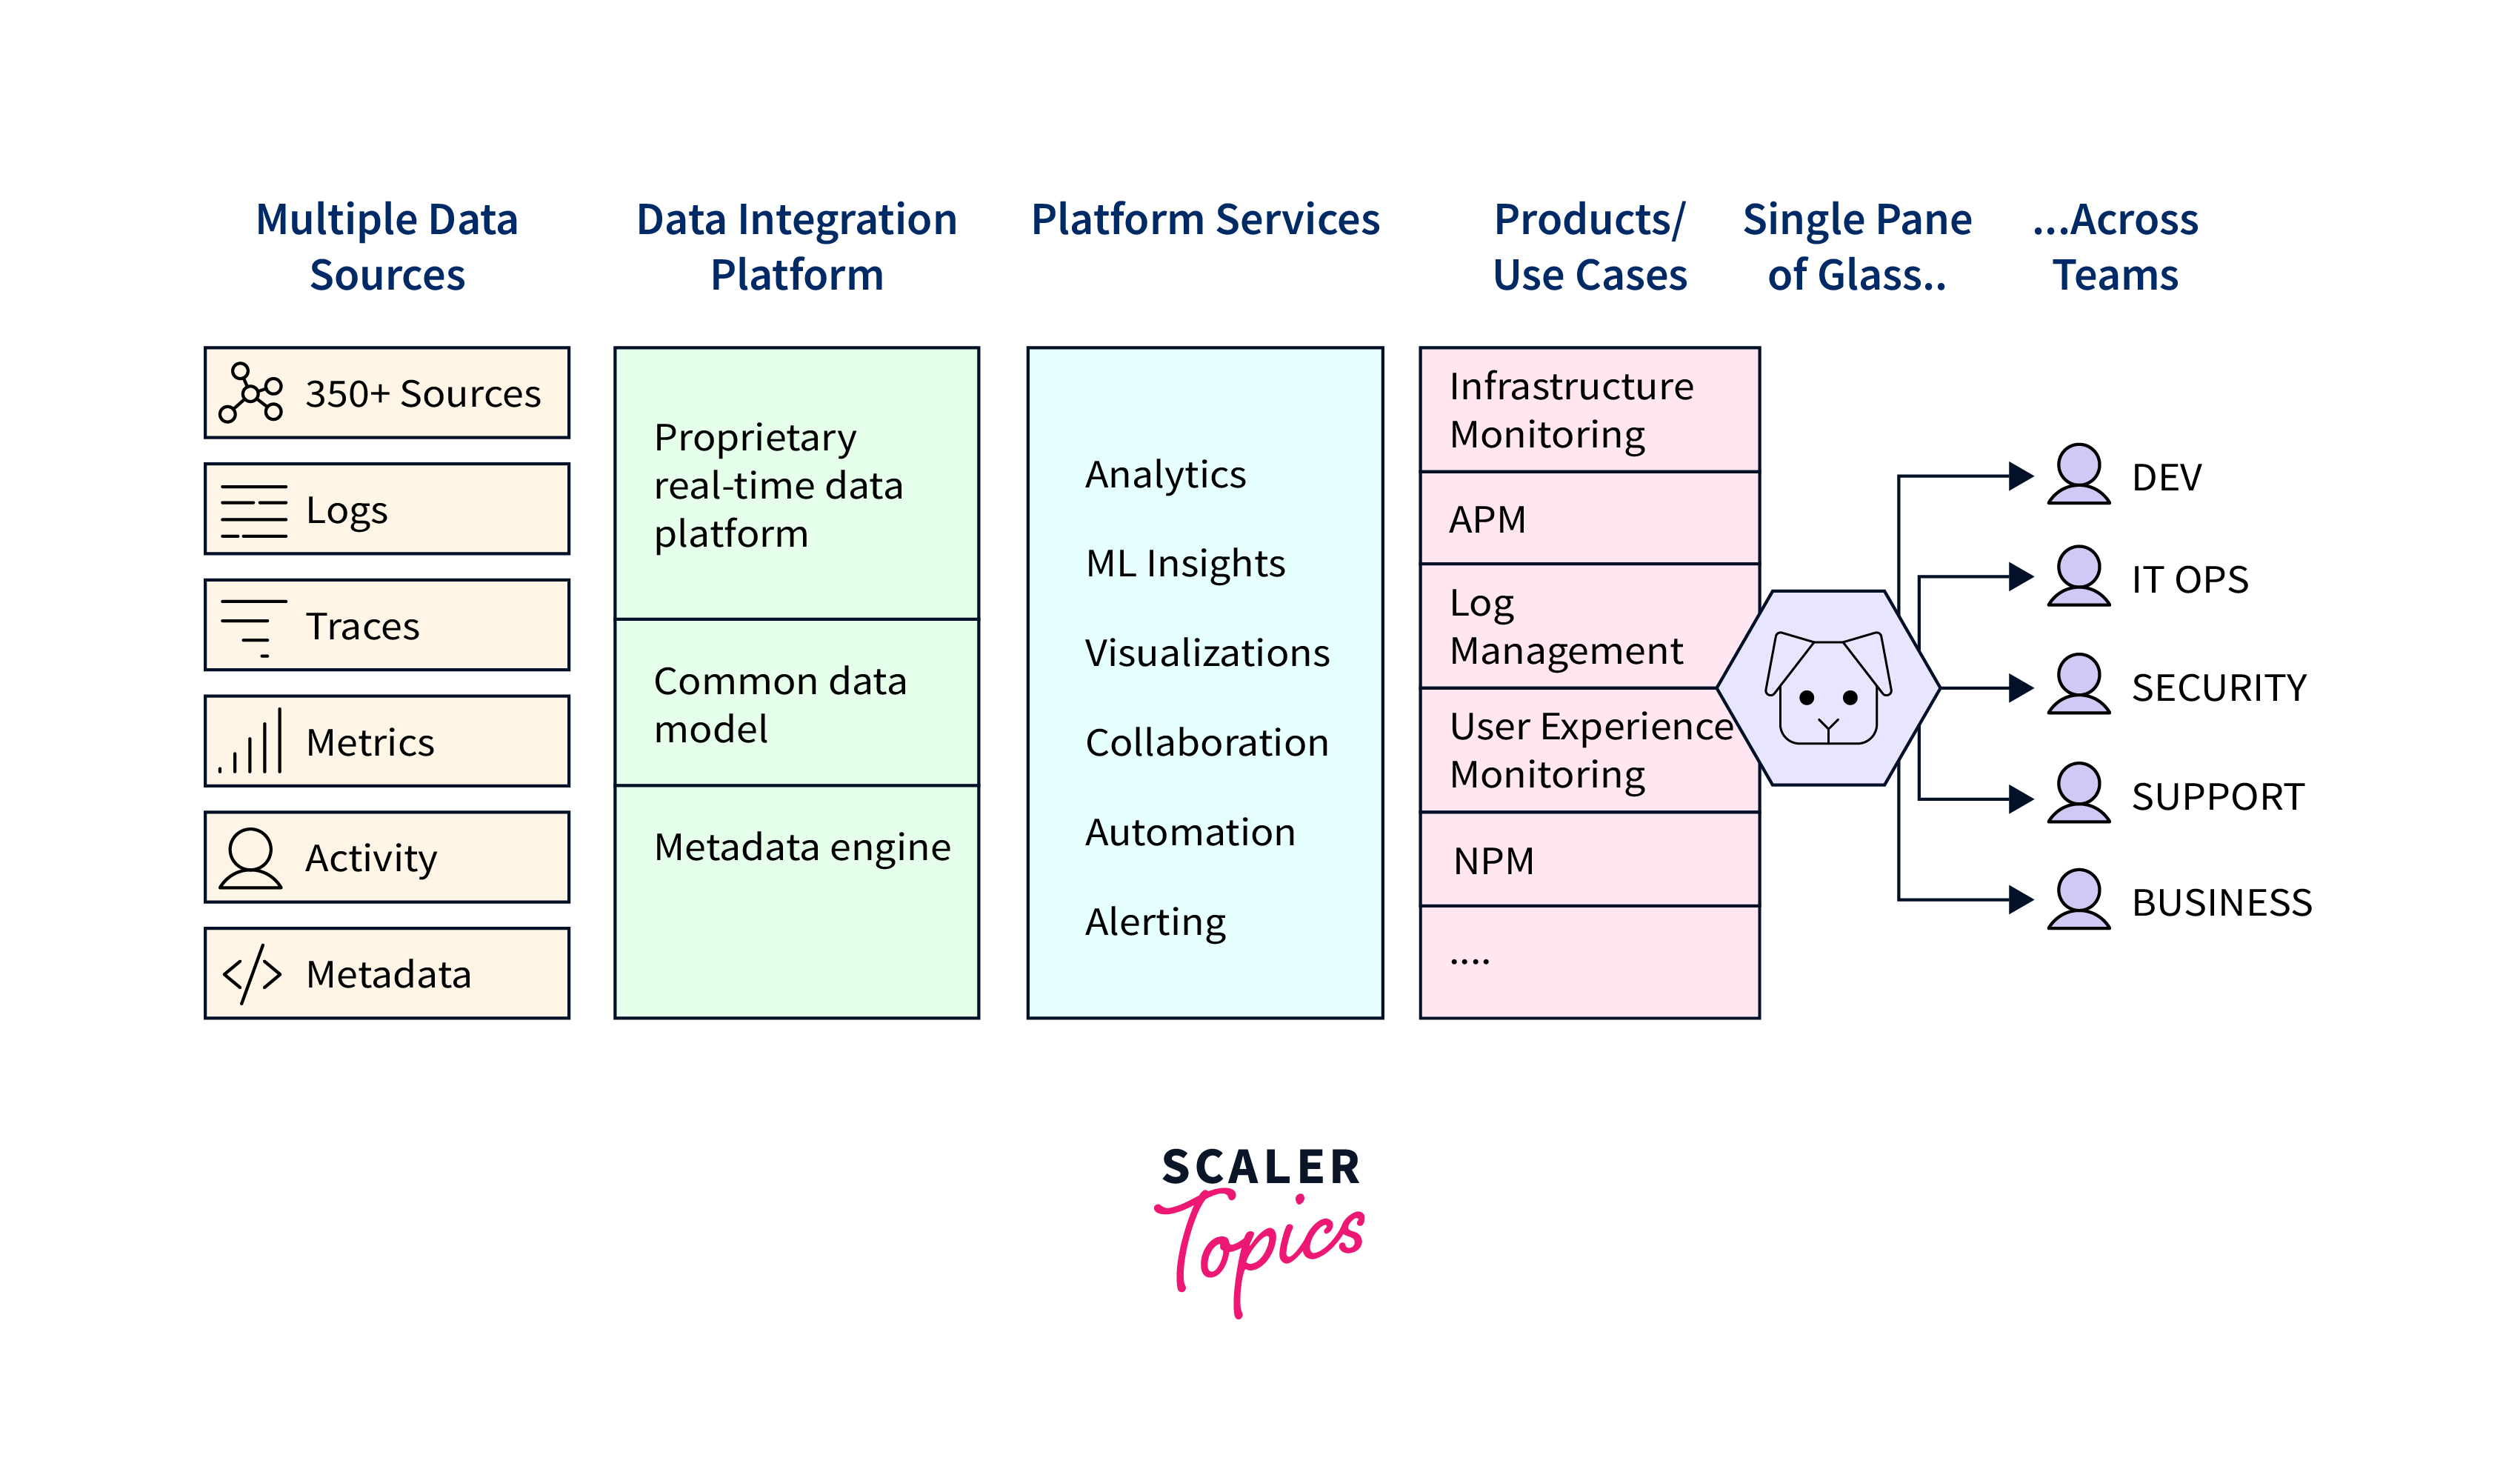
- Prometheus: Prometheus is an open-source monitoring system that is highly popular for monitoring containerized applications, including Express servers. It collects and stores time-series data, allowing you to query and analyze metrics for troubleshooting and performance optimization.
By implementing a robust monitoring solution for your Express server, you can gain valuable insights into its performance, detect potential issues, and ensure that your application meets the required performance standards. Monitoring not only helps in optimizing the server's performance but also plays a crucial role in ensuring high availability, meeting service-level agreements (SLAs), and delivering a seamless user experience.
Why you Need to monitor Node.js
Monitoring Node.js is crucial for maintaining the stability, performance, and reliability of your web applications built on this powerful JavaScript runtime. Node.js provides an event-driven, non-blocking I/O model that enables high concurrency and scalability. However, this unique architecture also introduces certain challenges that make monitoring Node.js essential for optimal application management.
Here are several reasons why monitoring Node.js is imperative:
- Identifying Performance Issues: Node.js applications handle multiple concurrent requests using a single-threaded event loop. While this architecture offers great scalability, it also means that any blocking or inefficient code can significantly impact performance. By monitoring Node.js, you can identify performance bottlenecks, such as slow database queries, heavy CPU usage, or inefficient algorithms, and optimize your application for better responsiveness and throughput.
- Detecting Memory Leaks: Node.js manages memory dynamically through garbage collection. However, memory leaks can occur if resources are not properly released, leading to increased memory consumption and potential application crashes. By monitoring Node.js, you can track memory usage patterns and detect memory leaks early on. This allows you to identify problematic areas in your code and take corrective actions to ensure efficient memory management.
- Analyzing Event Loop Performance: The event loop is a fundamental component of Node.js that handles asynchronous operations. Monitoring the event loop allows you to analyze its performance, identify event loop blocking, and measure event loop latency. By tracking event loop metrics, you can gain insights into how your application handles I/O operations and optimize its event-driven architecture for better performance and responsiveness.
- Ensuring High Availability: Monitoring Node.js helps you ensure the high availability of your web application. By monitoring key metrics like response times, error rates, and uptime, you can detect potential issues and proactively address them before they impact your users. Monitoring also enables you to set up alerts and notifications, allowing you to quickly respond to any performance degradation or downtime, minimizing the impact on your application's availability.
- Capacity Planning and Scaling: Monitoring Node.js provides valuable data for capacity planning and scaling your application. By tracking resource utilization, request rates, and traffic patterns, you can make informed decisions about scaling your infrastructure to handle increasing demand. Whether it's adding more servers, optimizing resource allocation, or utilizing cloud-based scaling solutions, monitoring helps ensure that your application can scale seamlessly while maintaining optimal performance.
What Should be Monitored on Node.js
Monitoring Node.js involves tracking various metrics to gain insights into the performance, health, and resource utilization of your Express server. By monitoring these key indicators, you can identify potential bottlenecks, detect anomalies, and optimize your server for efficient operation.
Here are some crucial aspects to monitor on Node.js:
- CPU Usage: Monitoring CPU usage helps you understand the level of processing power consumed by your Express server. High CPU usage may indicate performance bottlenecks, such as CPU-intensive tasks or inefficient code execution. By monitoring CPU usage, you can identify areas that require optimization to ensure optimal utilization of server resources.
- Memory Usage: Monitoring memory usage is vital for detecting memory leaks or excessive memory consumption. Node.js uses garbage collection to manage memory, but inefficient memory management can lead to memory leaks and potential application crashes. By monitoring memory usage, you can identify abnormal memory patterns and take corrective actions to optimize memory allocation and deallocation.
- Event Loop Metrics: The event loop is a critical component of Node.js, responsible for handling asynchronous I/O operations. Monitoring event loop metrics, such as event loop lag and event loop latency, helps you understand how efficiently your Express server processes events. High event loop lag can indicate blocking code or resource-intensive operations that may impact your application's performance.
- Request and Response Metrics: Monitoring request and response metrics provides insights into how your Express server handles incoming requests and serves responses. Key metrics to monitor include request rates, response times, and error rates. By analyzing these metrics, you can identify potential performance issues, bottlenecks, or errors and take corrective actions to ensure smooth and efficient request processing.
- Network Throughput: Monitoring network throughput helps you understand the amount of data being transferred between your Express server and clients. By tracking network throughput metrics, you can identify potential network congestion, bandwidth limitations, or connectivity issues that may affect your application's performance. Optimizing network throughput can help improve response times and overall user experience.
- Error and Log Monitoring: Monitoring errors and application logs is crucial for identifying and resolving issues promptly. By monitoring error logs, you can detect and diagnose errors, exceptions, or crashes that occur within your Express server. Log monitoring allows you to capture important information for troubleshooting, auditing, and understanding the behavior of your application.
- Server Health and Uptime: Monitoring server health and uptime is essential for ensuring the availability and reliability of your Express server. Tracking metrics such as server uptime, response code distribution, and server availability helps you identify potential issues, plan maintenance activities, and take proactive measures to minimize downtime and ensure uninterrupted service.
What is Scaling in Expresjs?
Scaling in Express.js refers to the process of adjusting the capacity and resources of your Express server to accommodate increased traffic and user demand. As your web application grows in popularity and attracts a larger user base, scaling becomes necessary to maintain optimal performance, reliability, and responsiveness.
There are two primary approaches to scaling an Express server:
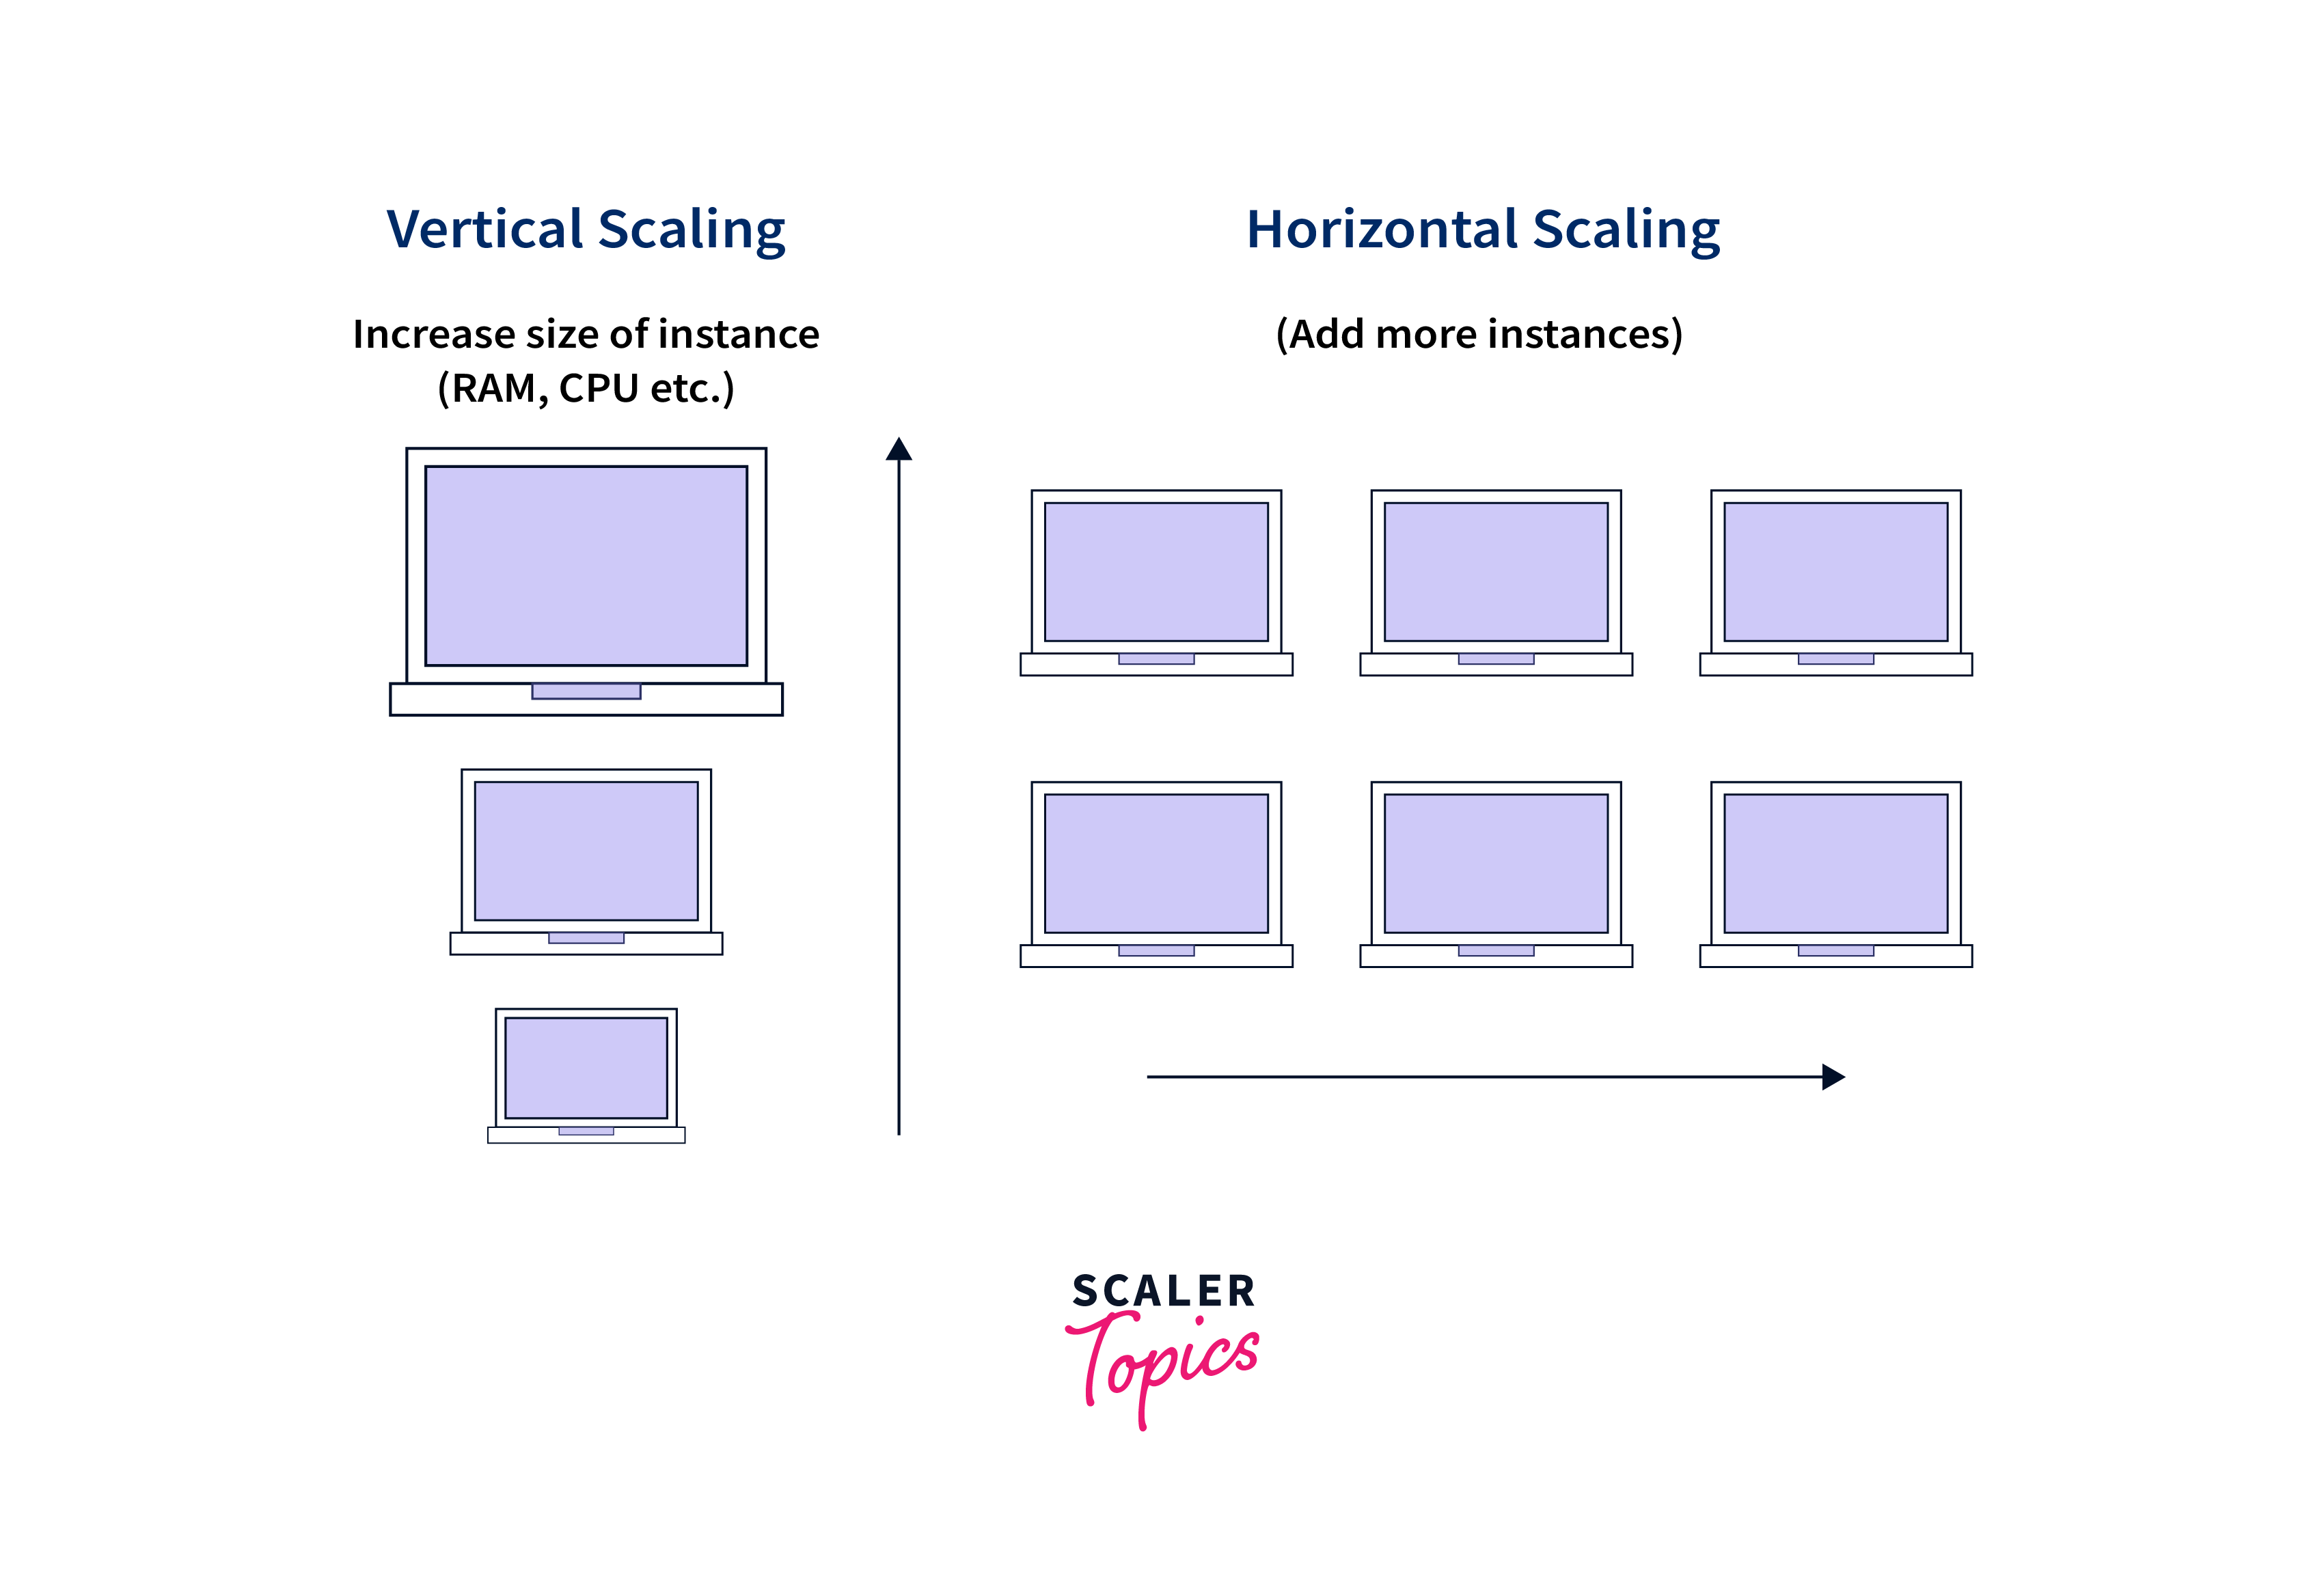
Horizontal Scaling
Horizontal scaling, also known as scaling out, involves adding more servers to your infrastructure to distribute the incoming workload. Instead of relying on a single server to handle all requests, horizontal scaling allows you to spread the load across multiple servers. This approach enhances performance, improves fault tolerance, and enables your application to handle increased traffic and concurrent requests effectively.
Horizontal scaling requires a load balancer to distribute incoming requests across the available servers. The load balancer can be implemented using various technologies, such as Nginx, HAProxy, or cloud-based load balancing services. The load balancer evenly distributes requests, ensuring that each server receives an appropriate share of the workload. This way, horizontal scaling enables your Express server to scale horizontally by adding more servers as needed.
Vertical Scaling
Vertical scaling, also known as scaling up, involves upgrading the resources of your existing server to handle increased traffic and user demand. Instead of adding more servers, vertical scaling focuses on enhancing the capacity of the current server. This can include upgrading the server's CPU, memory, storage capacity, or other resources to accommodate higher loads.
Vertical scaling typically requires downtime or a brief interruption in service as the server undergoes the upgrade process. It allows your Express server to handle more concurrent requests and process them more efficiently by increasing the server's processing power and memory capacity.
Strategies of Scalability
When it comes to scaling an Express server, there are several strategies you can employ to ensure optimal performance and handle increased traffic effectively. These strategies involve different approaches to managing your application's architecture and resources. Three common strategies for scalability are cloning, decomposing, and splitting.
Choosing the right scalability strategy depends on your application's specific requirements, architecture, and expected growth. It's important to regularly monitor the performance and resource utilization of your Express server to identify areas that need scaling and determine which strategy is most suitable for your application.
Cloning
Cloning involves creating multiple copies, or replicas, of your Express server and distributing the workload across them. Each cloned server handles a portion of the incoming traffic, allowing you to scale horizontally by adding more servers as needed. This strategy is particularly effective when you have a high volume of concurrent requests or when your application requires high availability and fault tolerance.
Cloning can be achieved by using load balancers to distribute incoming requests evenly among the cloned servers. Load balancing techniques such as round-robin, least connections, or session-based routing ensure that requests are directed to available servers in a balanced manner. By cloning your Express server, you can increase its capacity and handle a larger number of concurrent users.
Decomposing
Decomposing, also known as microservices architecture, involves breaking down your application into smaller, loosely coupled services. Each service focuses on a specific functionality or domain within your application. This approach allows you to scale different components independently based on their individual requirements.
By decomposing your Express application into microservices, you can scale each service individually, allocating more resources to critical or high-demand services while keeping other services lightweight. This strategy enables better resource utilization, flexibility in scaling, and easier maintenance and deployment of individual services. Communication between microservices can be established through APIs or message queues.
Splitting
Splitting involves dividing your Express application into smaller, manageable parts that can be deployed and scaled independently. This strategy is particularly useful when certain components of your application experience higher traffic or require specialized resources.
For example, you can split your Express server into separate modules based on different functionality, such as authentication, data processing, or image rendering. Each module can be deployed on different servers or containers and scaled individually as needed. Splitting allows you to allocate resources specifically to the components that require them the most, ensuring optimal performance and scalability.
Types of scaling practices
Scaling an Express server involves implementing various practices to ensure efficient resource utilization, handle increased traffic, and maintain optimal performance. Let's explore some of the common types of scaling practices:
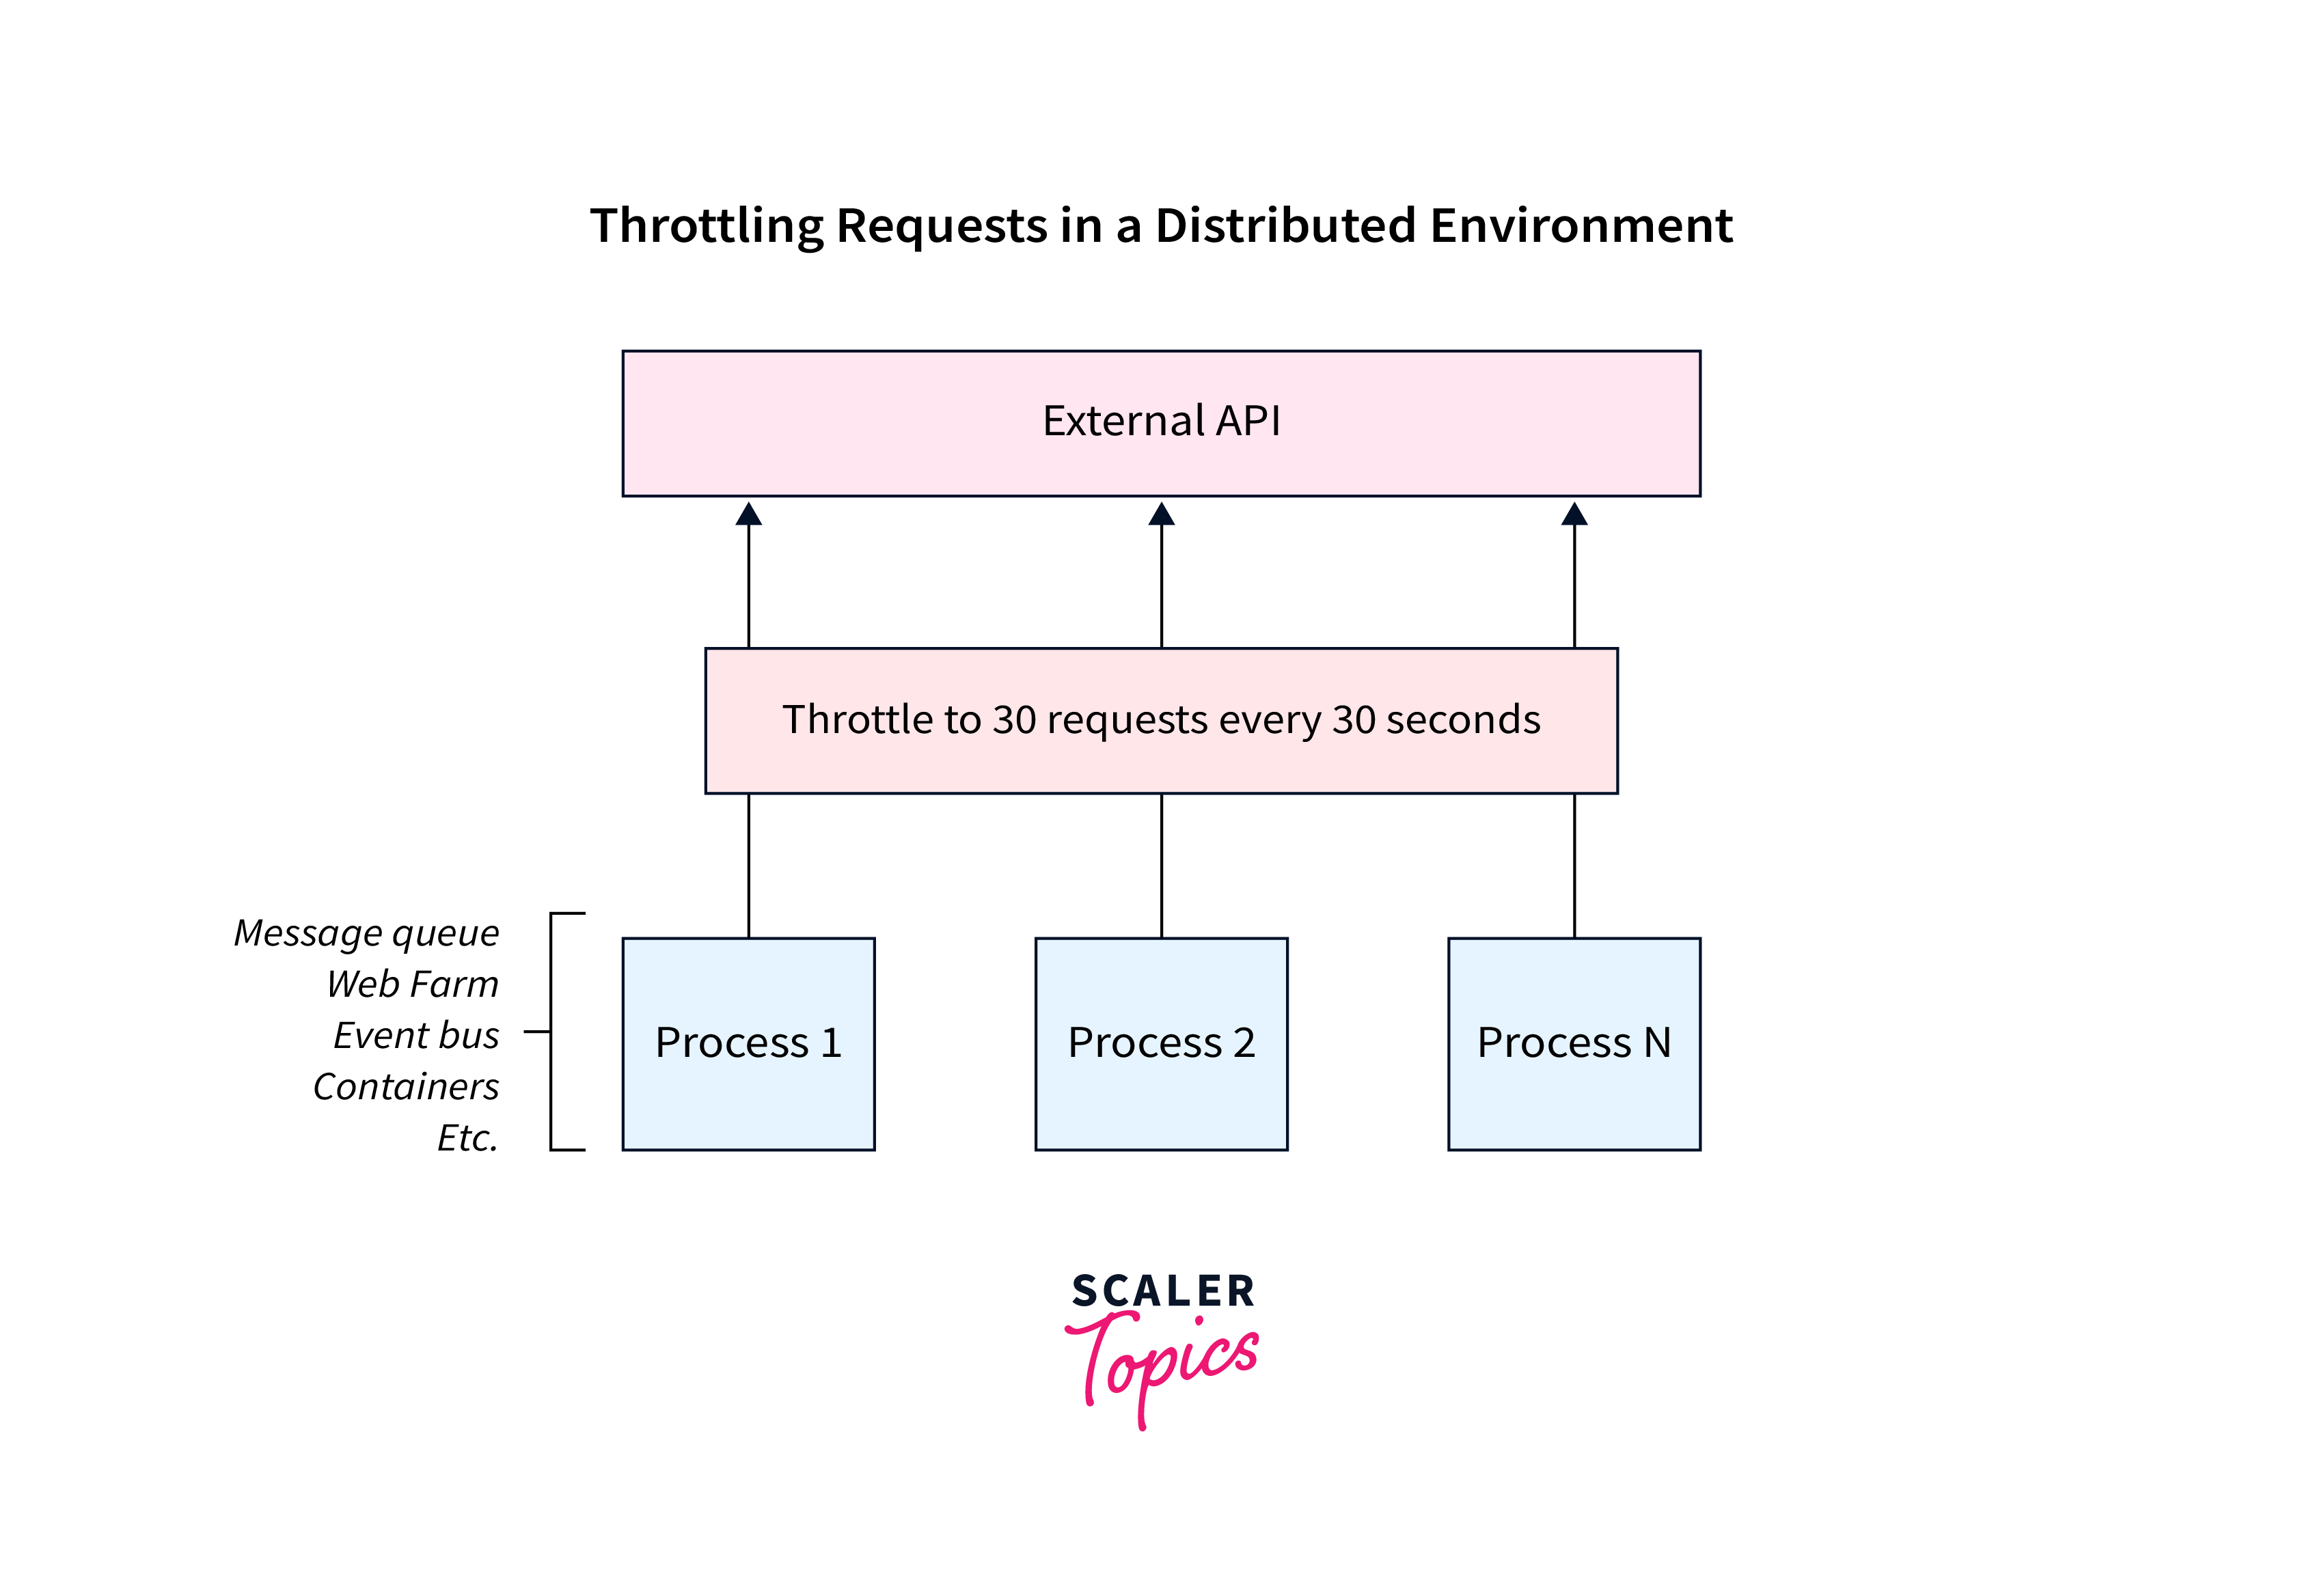
- Throttling: Throttling involves limiting the rate of incoming requests to prevent overloading the server. By setting limits on the number of requests accepted per second or minute, you can control the traffic flow and ensure a consistent level of service. Throttling helps protect your server from spikes in traffic and ensures that resources are allocated appropriately.

- Optimizing Database Queries: Optimizing your database queries is essential for efficient data retrieval and manipulation. By analyzing and improving your queries, you can reduce response times and enhance overall application performance. Techniques such as indexing, query caching, and denormalization can help optimize database operations and scale your Express server effectively.
- Fail Fast with Circuit Breaker: Implementing a circuit breaker pattern allows your application to respond quickly when dependent services or resources experience issues. By monitoring the health and availability of external services, you can detect failures and open the circuit breaker, preventing further requests from being sent. This practice helps protect your Express server from cascading failures and improves system resilience.
- Logging Checkpoints: Logging checkpoints involves capturing important information at various stages of request processing. By logging checkpoints, you can track the flow of requests, identify performance bottlenecks, and gain insights into the behavior of your Express server. This practice helps in troubleshooting, performance analysis, and identifying areas that may require optimization.
- Using Kafka over HTTP Requests: Kafka, a distributed streaming platform, can be utilized to decouple components and improve scalability. By using Kafka, you can replace traditional synchronous HTTP communication with asynchronous event-driven communication. This approach allows for better decoupling, improved fault tolerance, and the ability to handle high-throughput scenarios.
- Monitoring and Addressing Memory Leaks: Memory leaks can lead to increased memory consumption and degraded performance. Regularly monitoring your Express server for memory leaks and employing techniques like heap profiling, garbage collection analysis, and memory usage monitoring can help identify and address memory leaks. This practice ensures efficient memory management and prevents resource exhaustion.
- Caching: Caching involves storing frequently accessed data in memory to improve response times and reduce the load on backend resources. By implementing caching mechanisms, such as in-memory caches or distributed caching solutions, you can serve cached data instead of executing expensive operations for every request. Caching enhances the scalability and performance of your Express server.
- Using Connection Pooling: Connection pooling allows you to reuse and manage database connections efficiently. By pooling and reusing database connections, you can reduce the overhead of establishing new connections for each request, resulting in improved response times and better utilization of database resources. Connection pooling is particularly useful in scenarios where establishing connections is expensive.
- Seamless Scale-ups: Seamless scale-ups involve the ability to add resources or upgrade server specifications without interrupting the operation of your Express server. This practice ensures continuous availability and allows you to handle increased traffic without downtime. Techniques like containerization or cloud-based autoscaling can facilitate seamless scale-ups.
- OpenAPI-Compliant Documentation: Providing OpenAPI-compliant documentation enables easier integration and consumption of your Express server's APIs. Well-documented APIs make it simpler for developers to understand and utilize your services, fostering scalability by facilitating integration with external systems and encouraging adoption.
Conclusion
- Effective monitoring of your Express server enables you to identify performance bottlenecks, optimize resource utilization, and ensure a seamless user experience.
- Key metrics to monitor include CPU usage, memory usage, event loop metrics, request and response metrics, network throughput, and error and log monitoring.
- Scaling an Express server can be achieved through cloning, decomposing, or splitting, depending on your application's requirements and architecture.
- Horizontal scaling involves adding more servers to distribute the workload, while vertical scaling focuses on upgrading the resources of the existing server.
- Regular monitoring, analysis, and optimization are essential to adapt your Express server to handle growing demands and ensure efficient resource utilization.