How to Check Swap Space Usage in Linux?
Overview
Swap space, also known as virtual memory, is a crucial component of a Linux system that allows for efficient memory management. When the available physical memory (RAM) is insufficient to accommodate all running processes, the operating system uses swap space as an extension of memory. Swap space resides on the hard drive and acts as a temporary storage location for inactive pages of memory. Monitoring the usage of swap space is essential to ensure optimal system performance.
What is Swap Space?
Swap space, also known as virtual memory, is a designated area on a computer's hard drive that serves as an extension of physical memory (RAM). When the available RAM is insufficient to accommodate all running processes, the operating system moves inactive pages of memory to the swap space, freeing up RAM for active processes. Swap space allows the system to effectively manage memory usage and prevent crashes or slowdowns due to memory limitations. It acts as a temporary storage for data that is not immediately needed, facilitating efficient memory allocation and ensuring smooth performance on the computer.
Methods to Check Swap Space in Linux
There are several methods to check swap space usage in Linux. Let's find out how to check swap space in Linux. Will discuss some some common approaches:
Using swapon Command
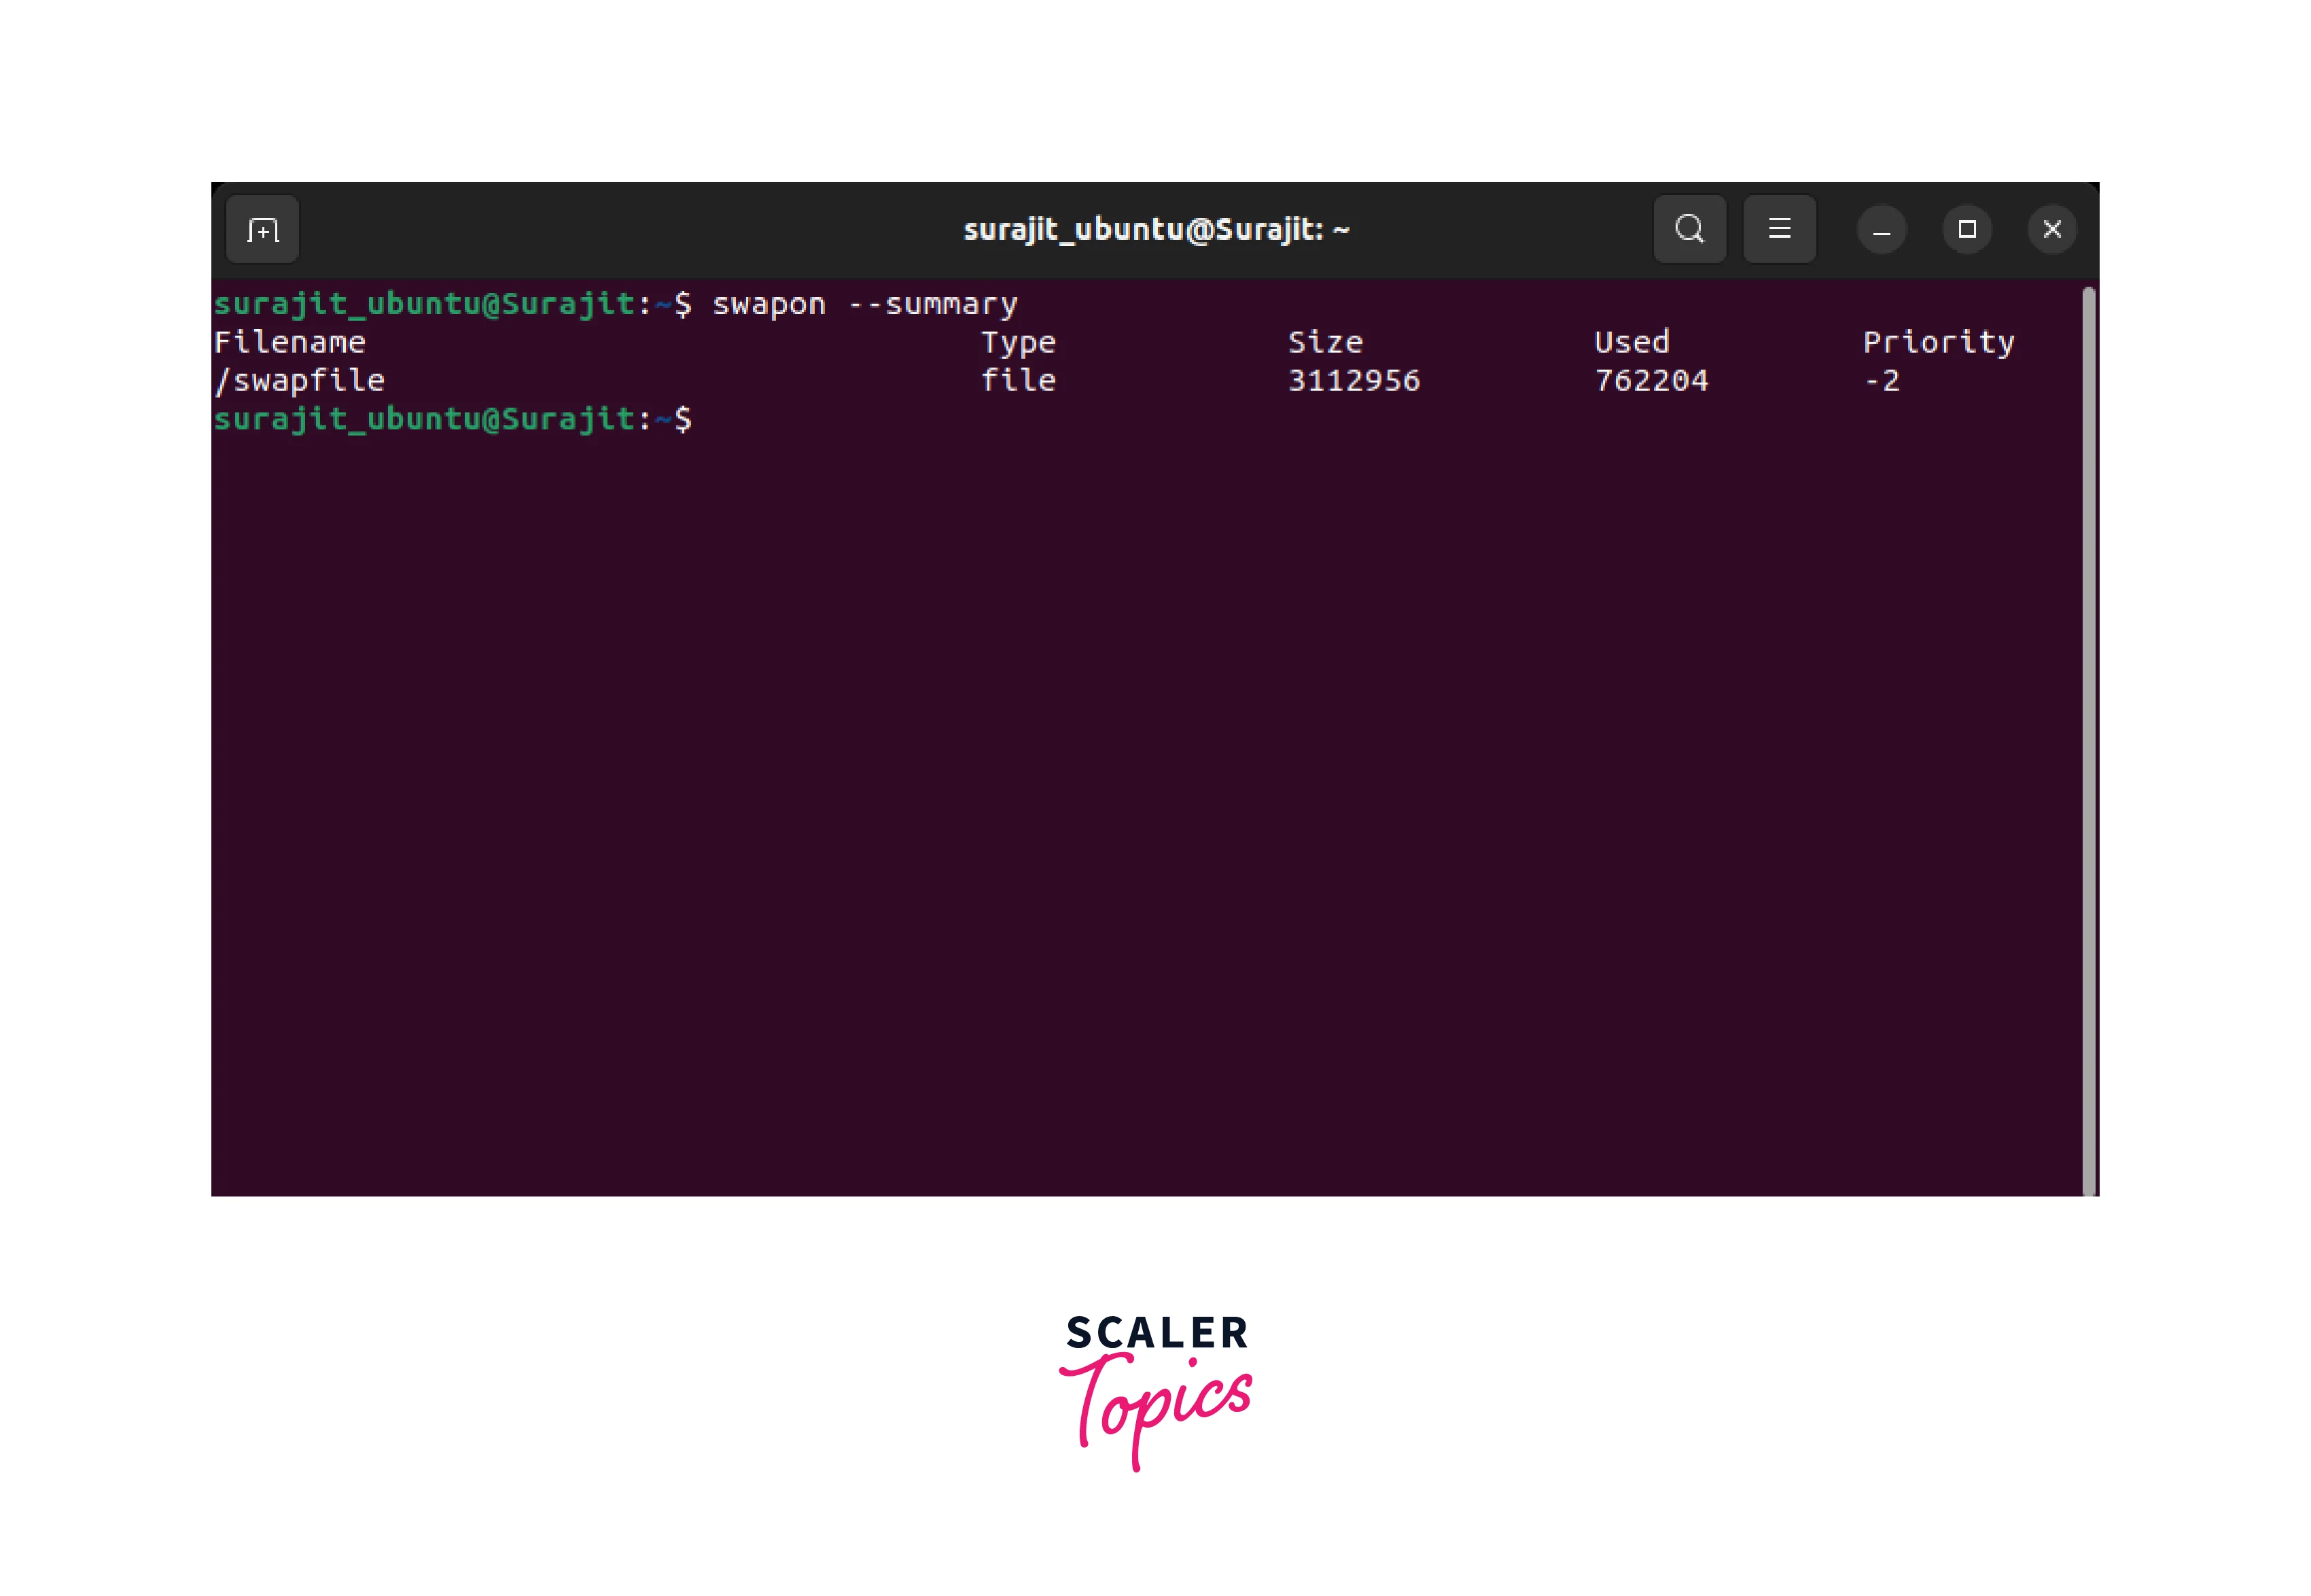
The swapon command in Linux is used to activate swap space, which provides additional virtual memory alongside the physical memory (RAM) of the system. By specifying a device or file name as an argument, the swapon command enables and makes the specified swap space available for use.
For instance, to activate a swap partition located on /dev/sda2, you can run swapon/dev/sda2. Multiple swap devices or files can be specified by providing multiple arguments. To deactivate swap space, you can use the swapoff command followed by the device or file name.
To check the summary of the Swap space use the command as mentioned below.
Using /proc/swaps
The /proc/swaps file is a virtual file that contains details about the active swap devices and files on a Linux system. It provides information such as the device/file name, type, size, used and priority of each swap space. To view the contents of /proc/swaps, you can use a command like cat or less. For example:
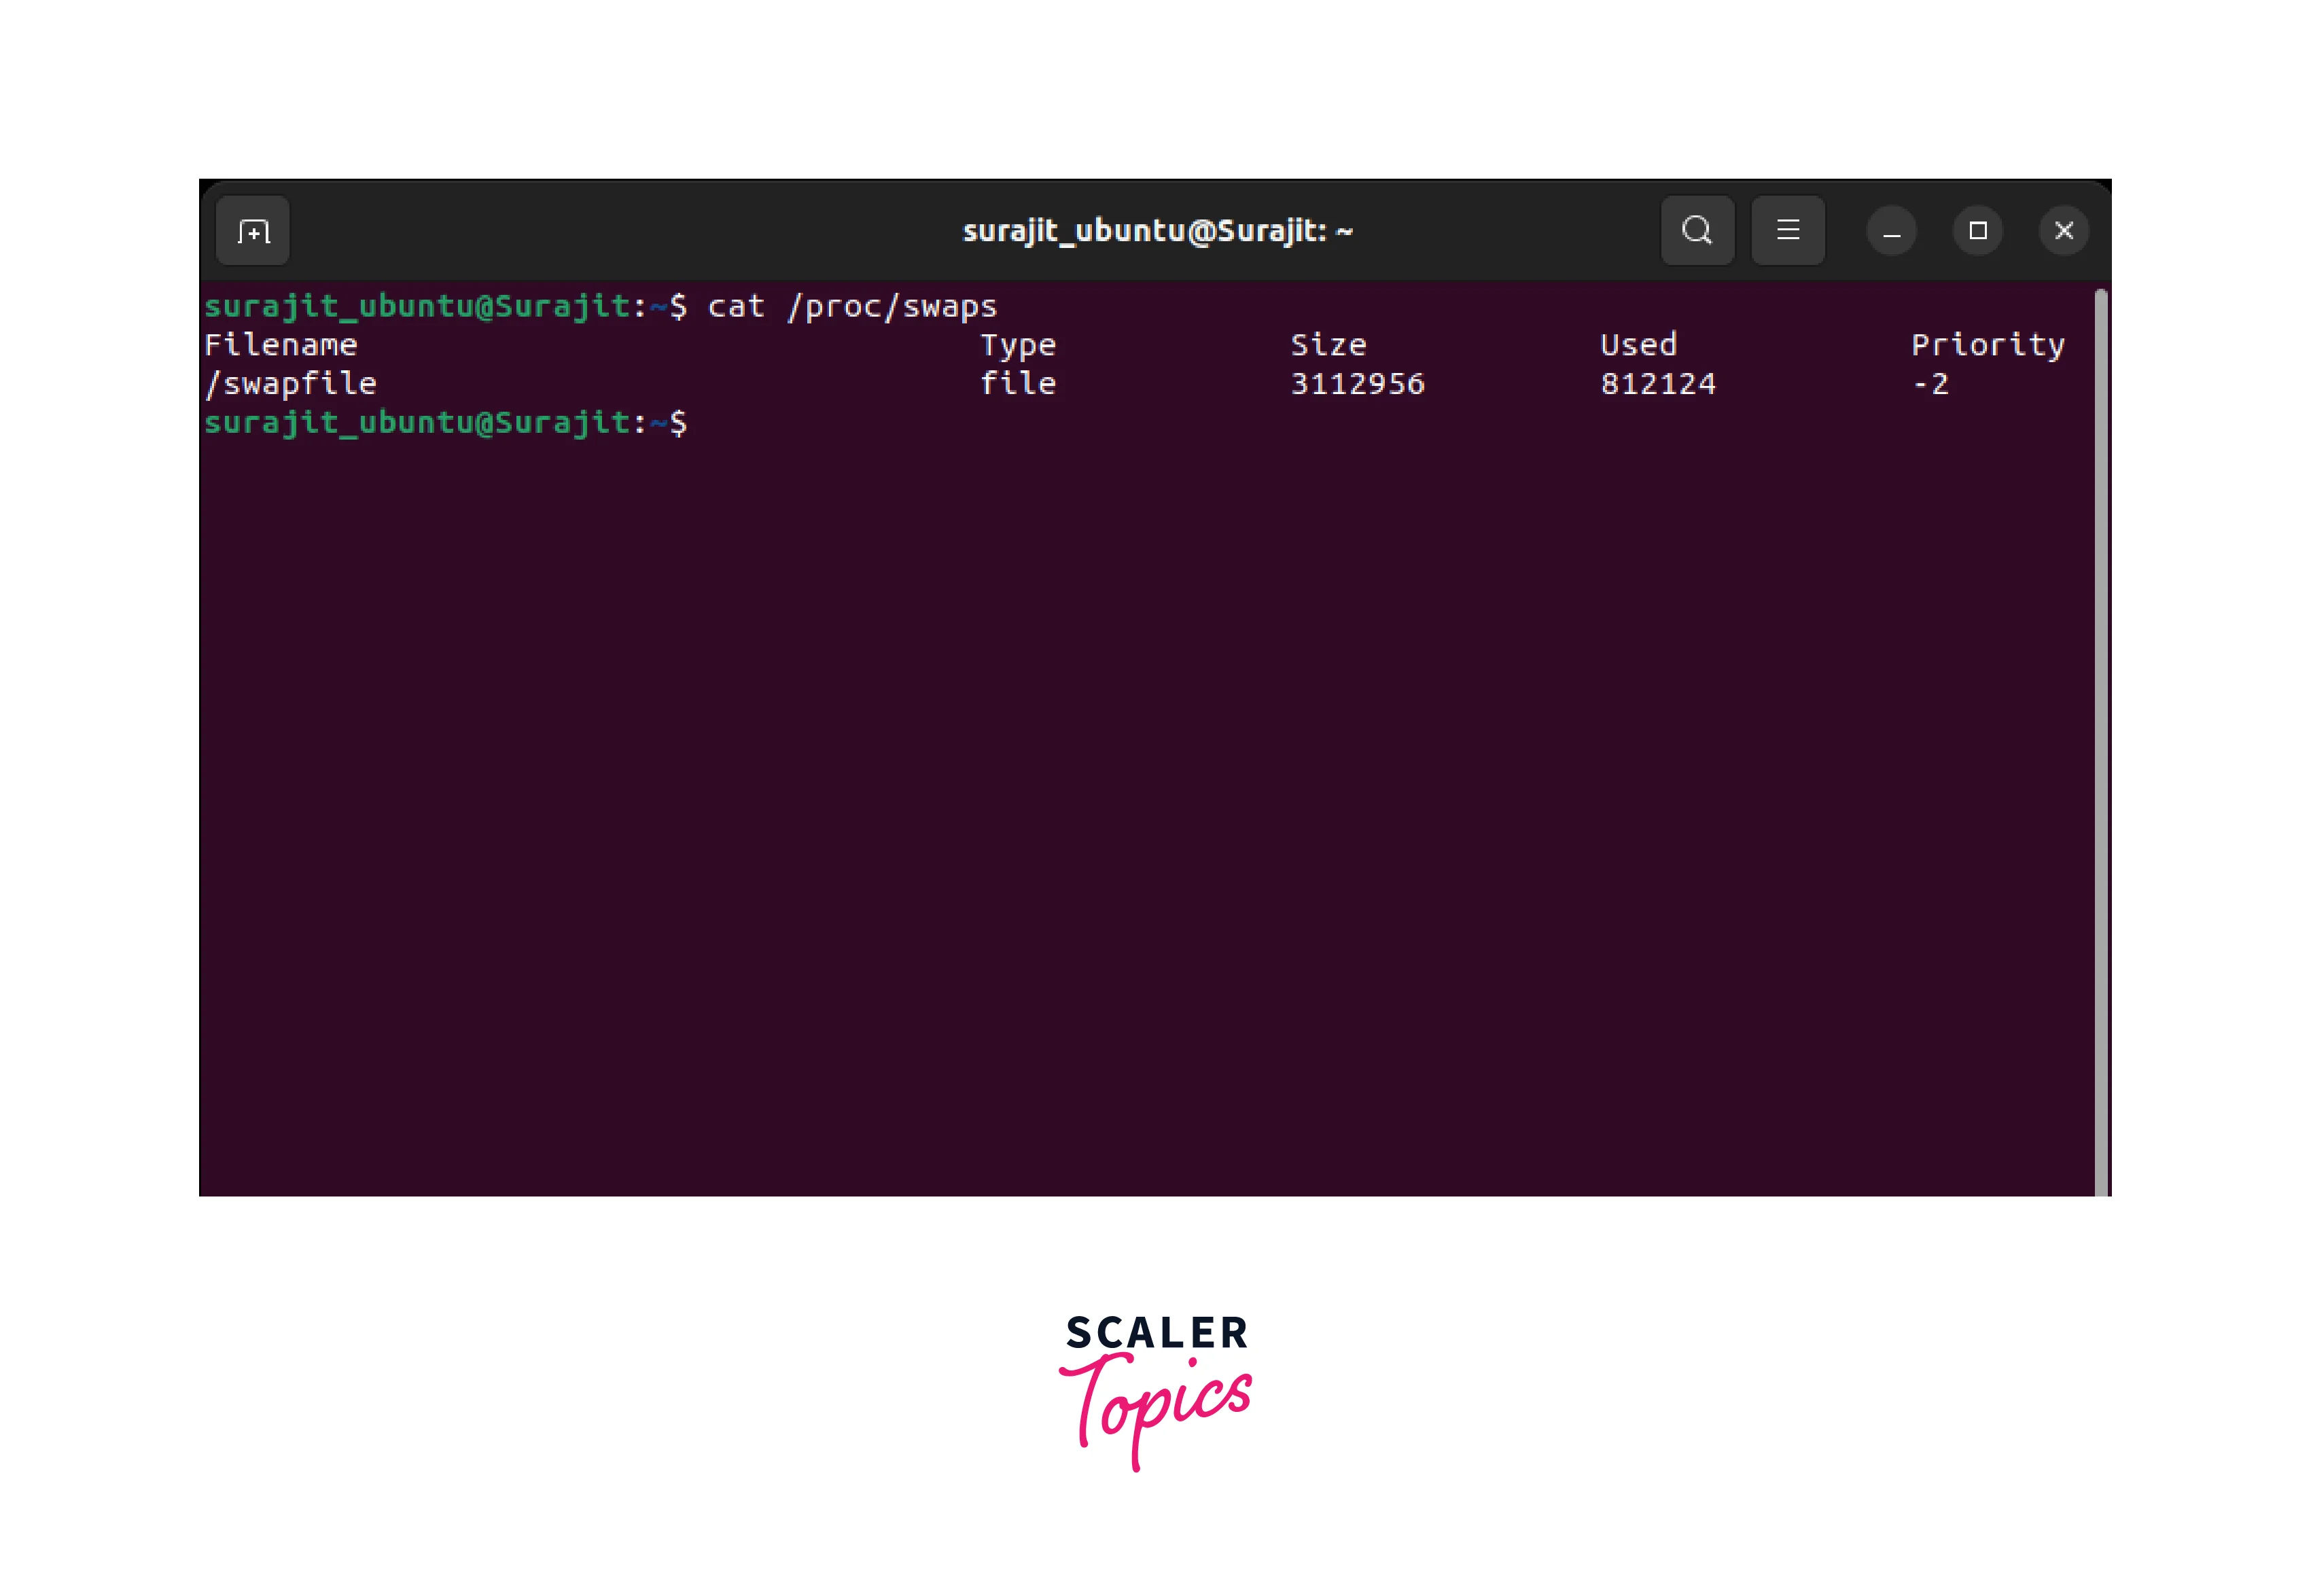
This will display a tabular representation of the active swap spaces. The file can be useful for checking the status and utilization of swap space on your system. Note that only privileged users (root or with sudo) can access the /proc/swaps file.
Using free Command
The free command in Linux is used to display information about the system's memory usage, including both physical and swap memory. Here's a concise explanation of the free command:
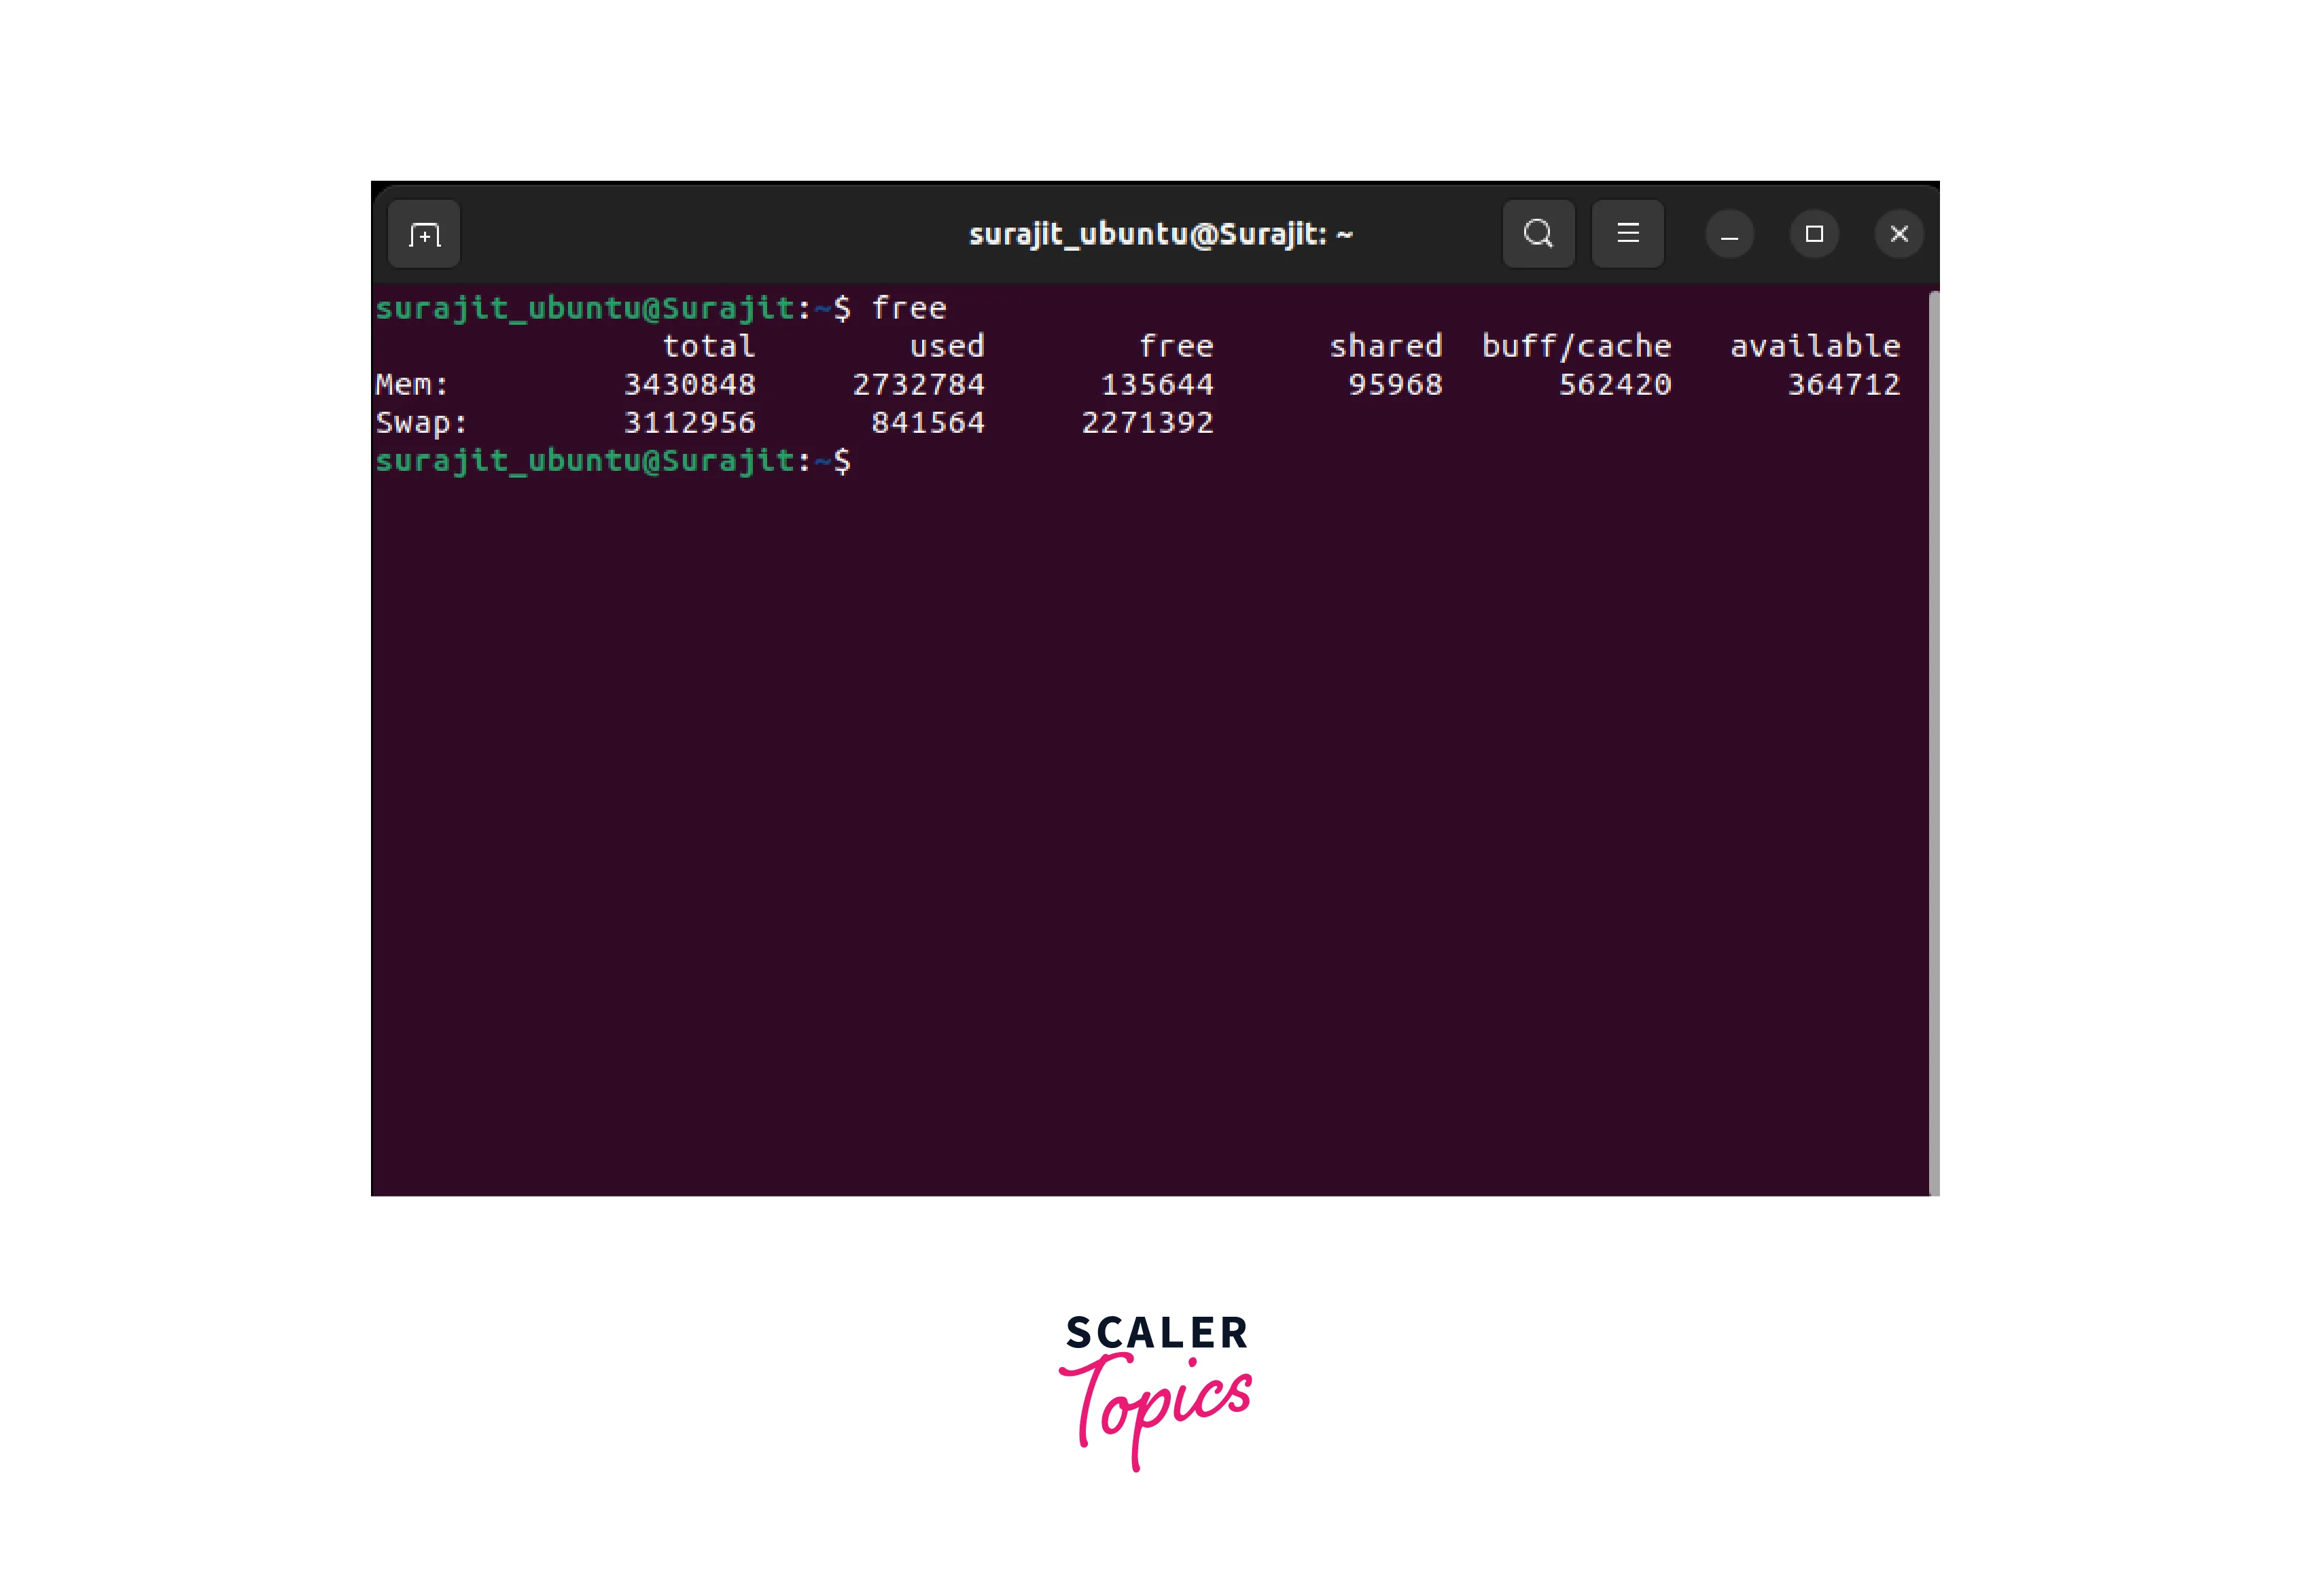
The free command provides a summary of the system's memory utilization. When executed without any options, it displays the information in bytes. However, you can also use the -h option to display the memory sizes in a more human-readable format (e.g., megabytes or gigabytes).
To run the free command, simply type free in the terminal. It will present output with columns indicating total, used, and free memory for both physical RAM and swap space. Additionally, it shows the buffers and cache memory utilized by the system.
The free command is useful for quickly assessing the memory status of a Linux system, helping you identify potential bottlenecks or memory-intensive processes. It is commonly used for system monitoring, troubleshooting, and optimization.
Using the vmstat Command
The vmstat command is a system monitoring tool available in Unix-like operating systems, including Linux. It provides information about various aspects of the system's virtual memory, CPU utilization, and I/O activity. Here's an overview of how to use the vmstat command and interpret its output:
To run vmstat, open a terminal and type the following command:
[options] are additional flags or parameters you can use with the command.
[interval] specifies the time interval between each report update.
[count] indicates the number of reports to be displayed before the command exits.
Here are some commonly used options:
| Options | Function |
|---|---|
| -a | Displays both active and inactive memory pages |
| -f | Shows the number of forks since system startup |
| -m | Provides detailed memory usage statistics |
| -n | Inhibits the display of the header |
| -s | Displays virtual memory statistics |
| -w | Wide output format for better readability |
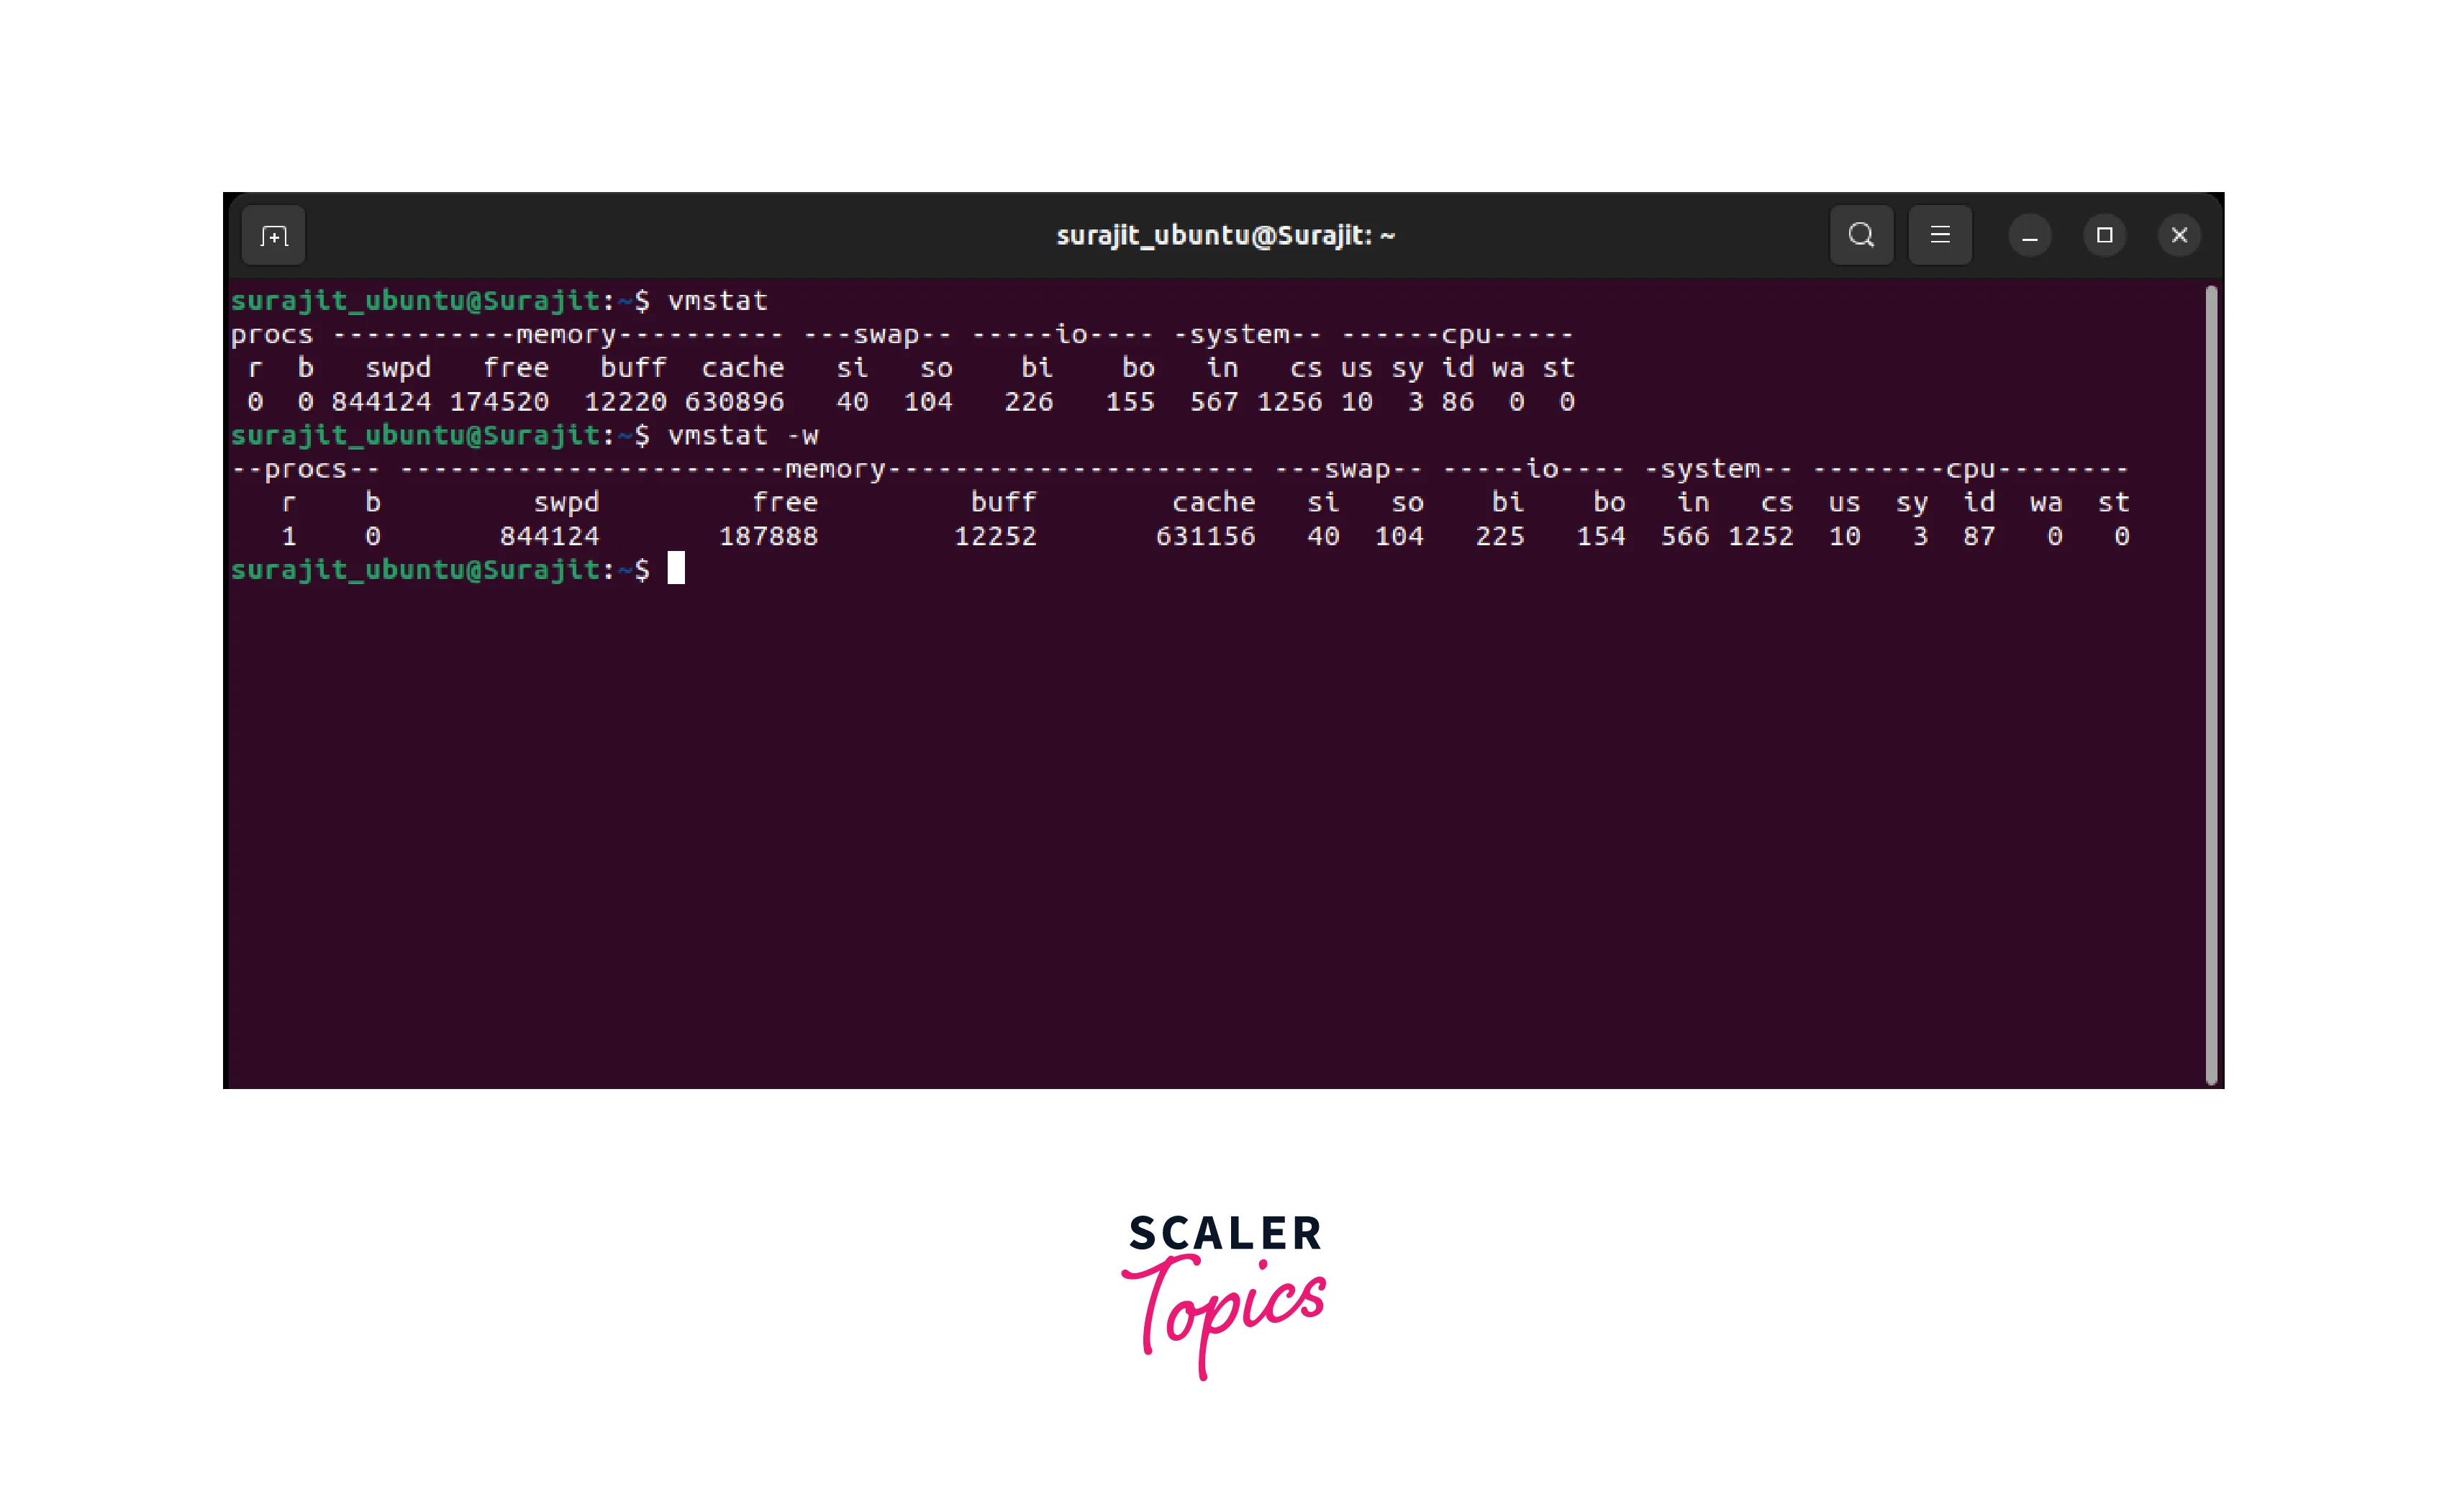
By default, vmstat displays information about processes, memory, swap, I/O, and CPU usage. The values in the columns are typically updated at the specified interval.
Using top/atop/htop/glances Command
The commands top, atop, htop, and glances are system monitoring tools commonly used in Unix-like operating systems, including Linux. They provide real-time information about system resource usage, process activity, and other system statistics. Here's a brief overview of each command:
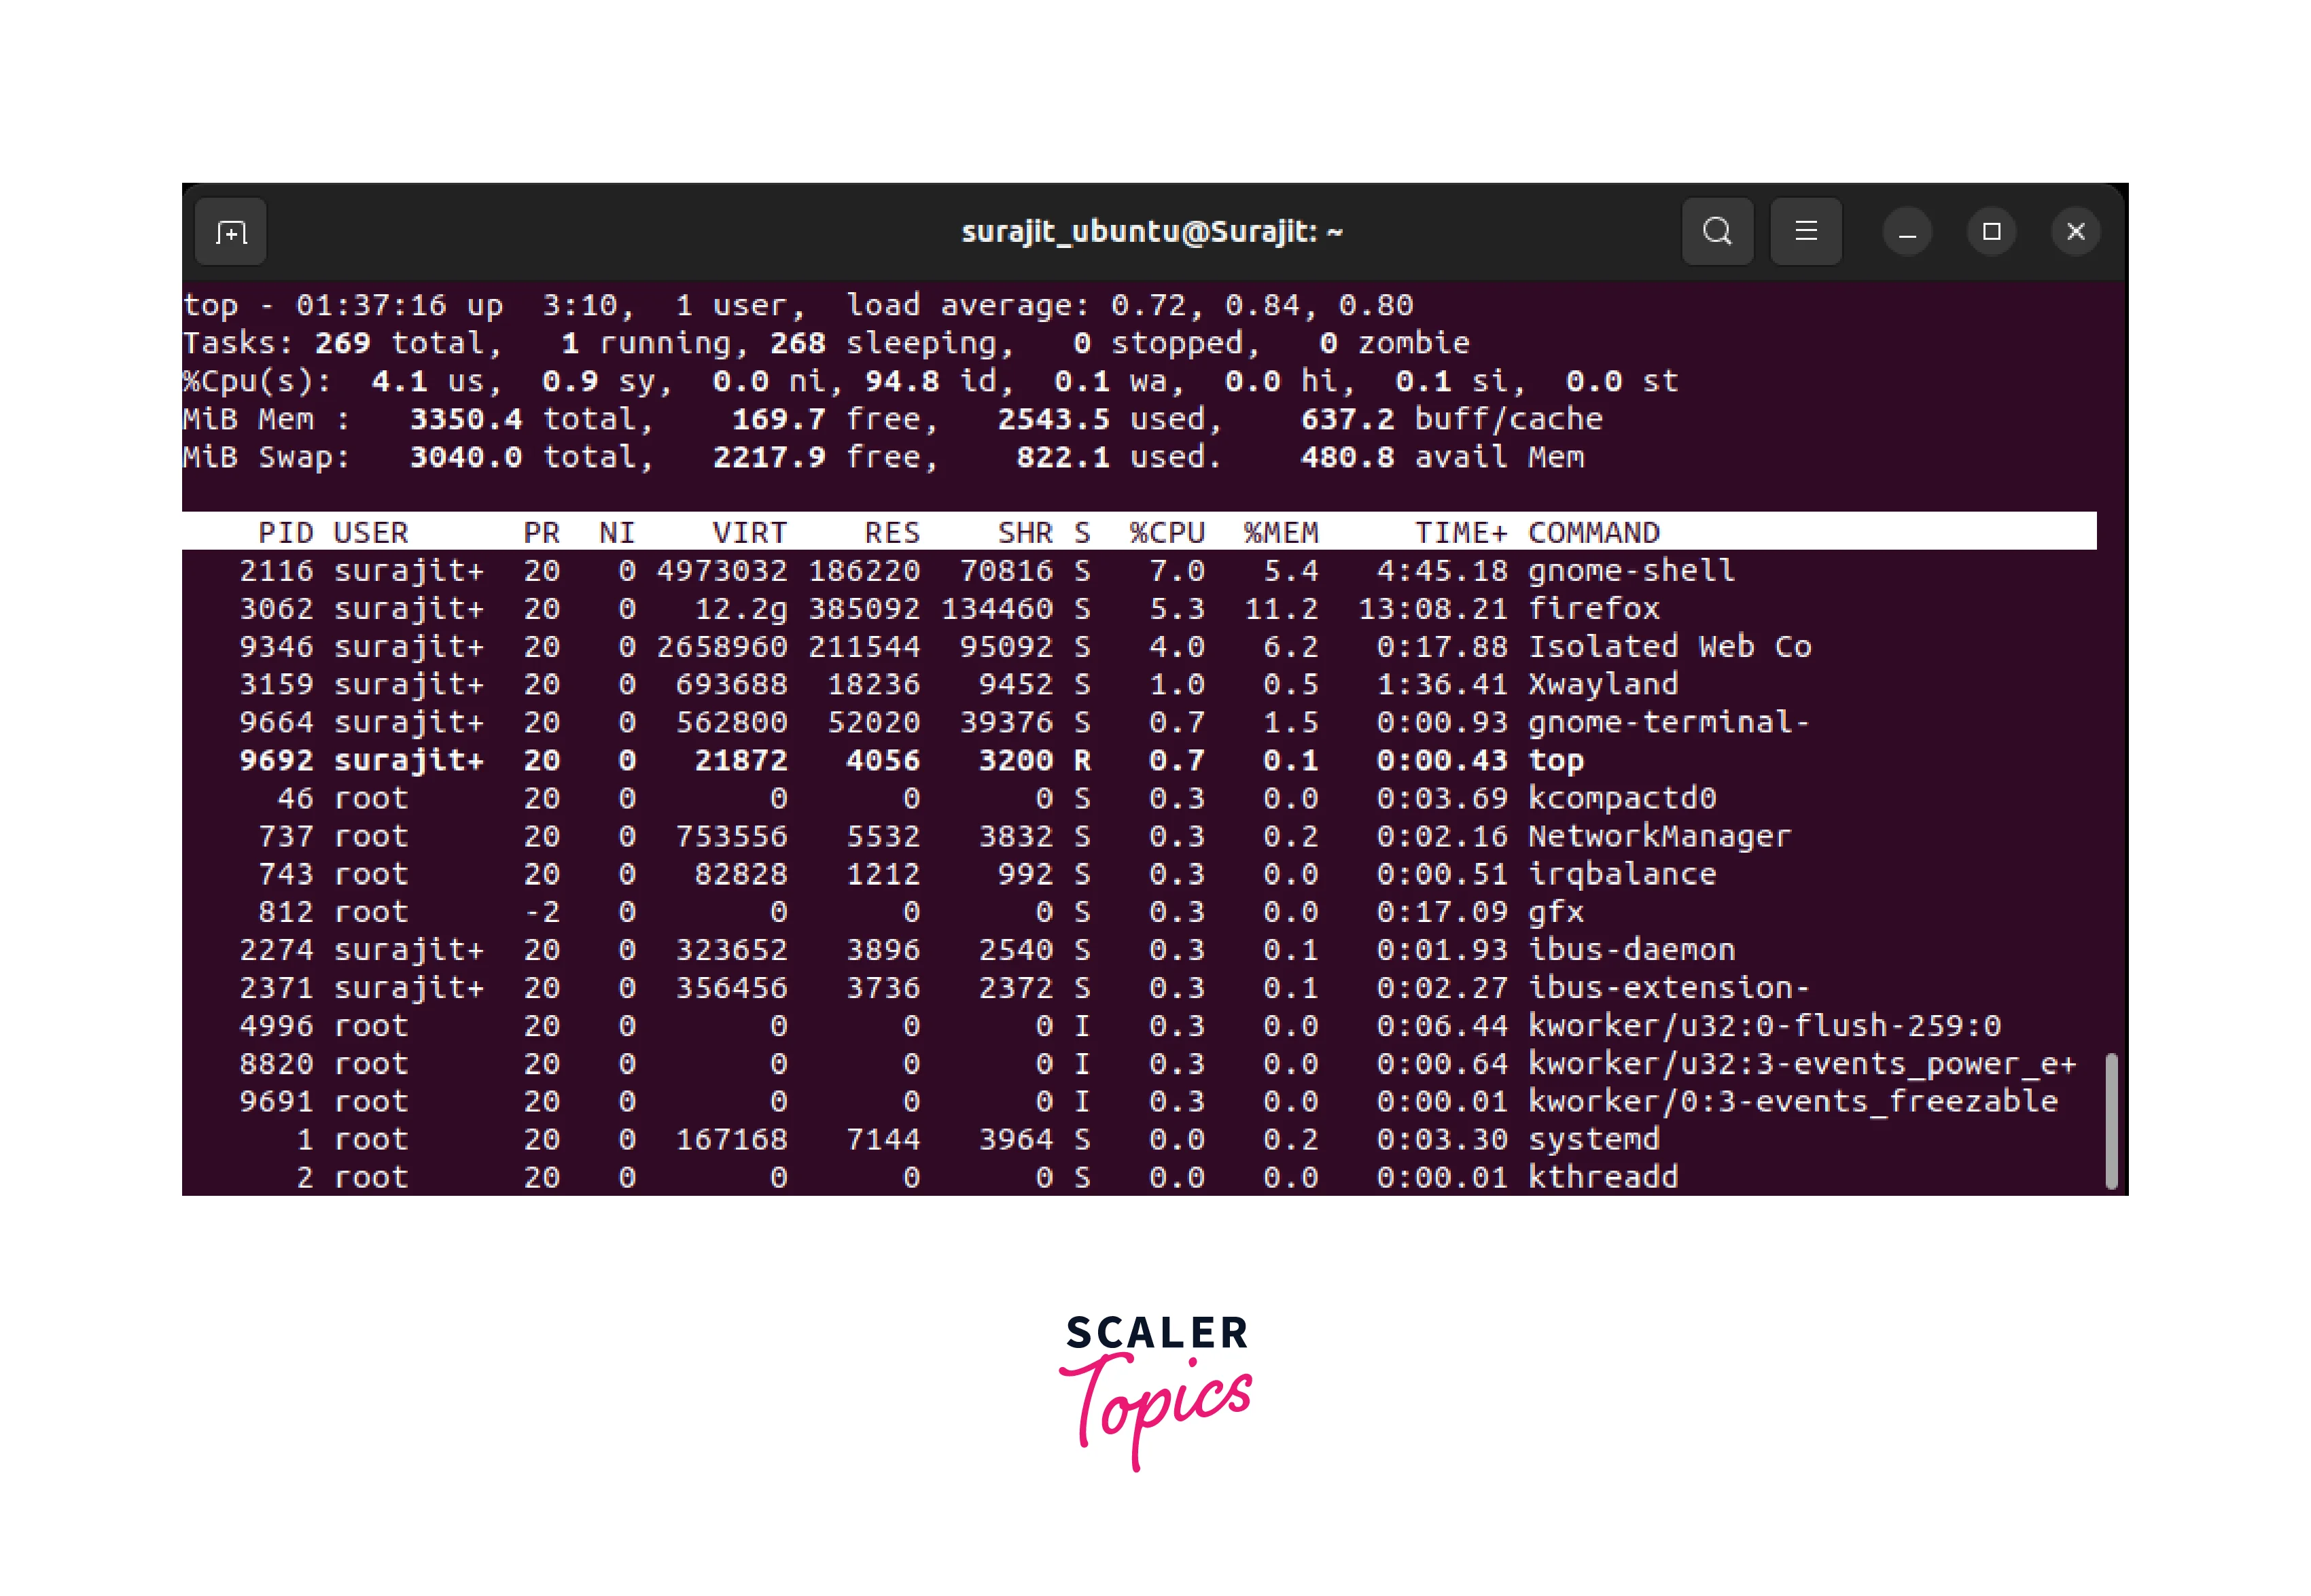
top: top is a widely used command-line tool that provides a dynamic, real-time view of system resource usage. It displays information about processes, CPU usage, memory usage, load averages, and more. To run top, open a terminal and simply type top. By default, it updates the display every few seconds.
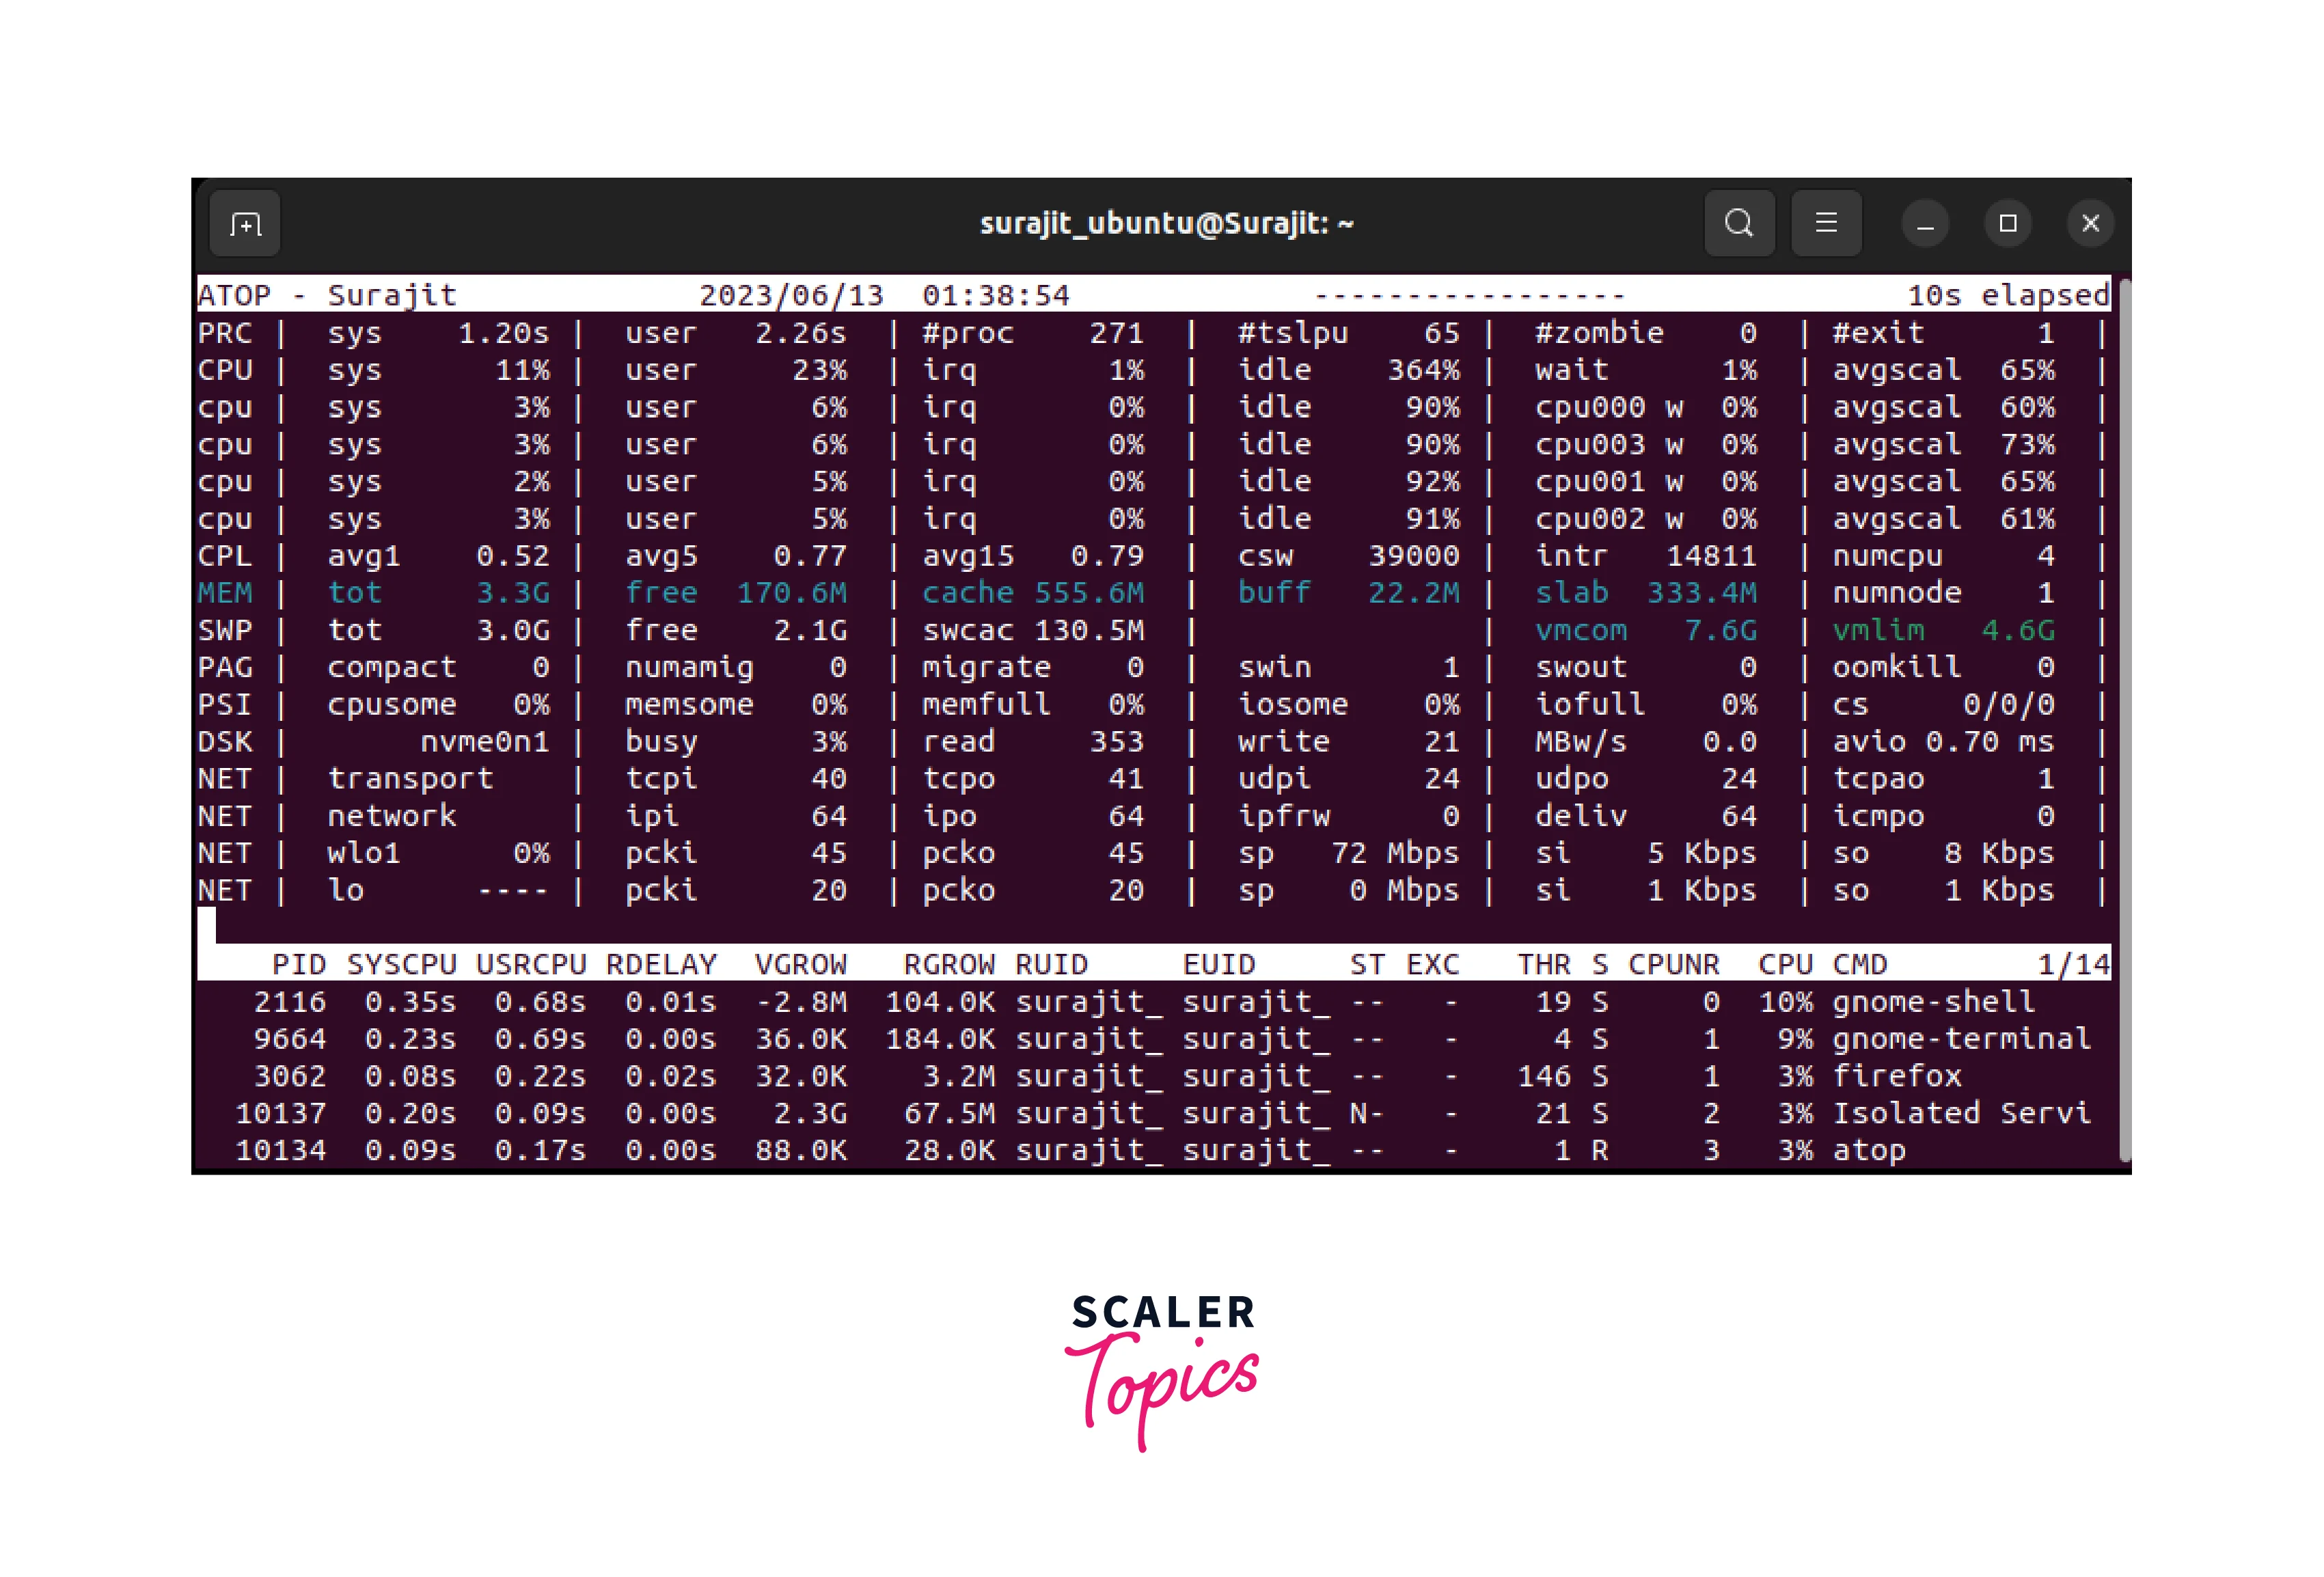
atop: atop is an advanced interactive system and process monitor. It provides a comprehensive view of system activity over time, allowing you to analyze historical data. To run atop, open a terminal and type atop. It presents a series of screens with various statistics, and you can navigate through them using the arrow keys. Press q to exit.
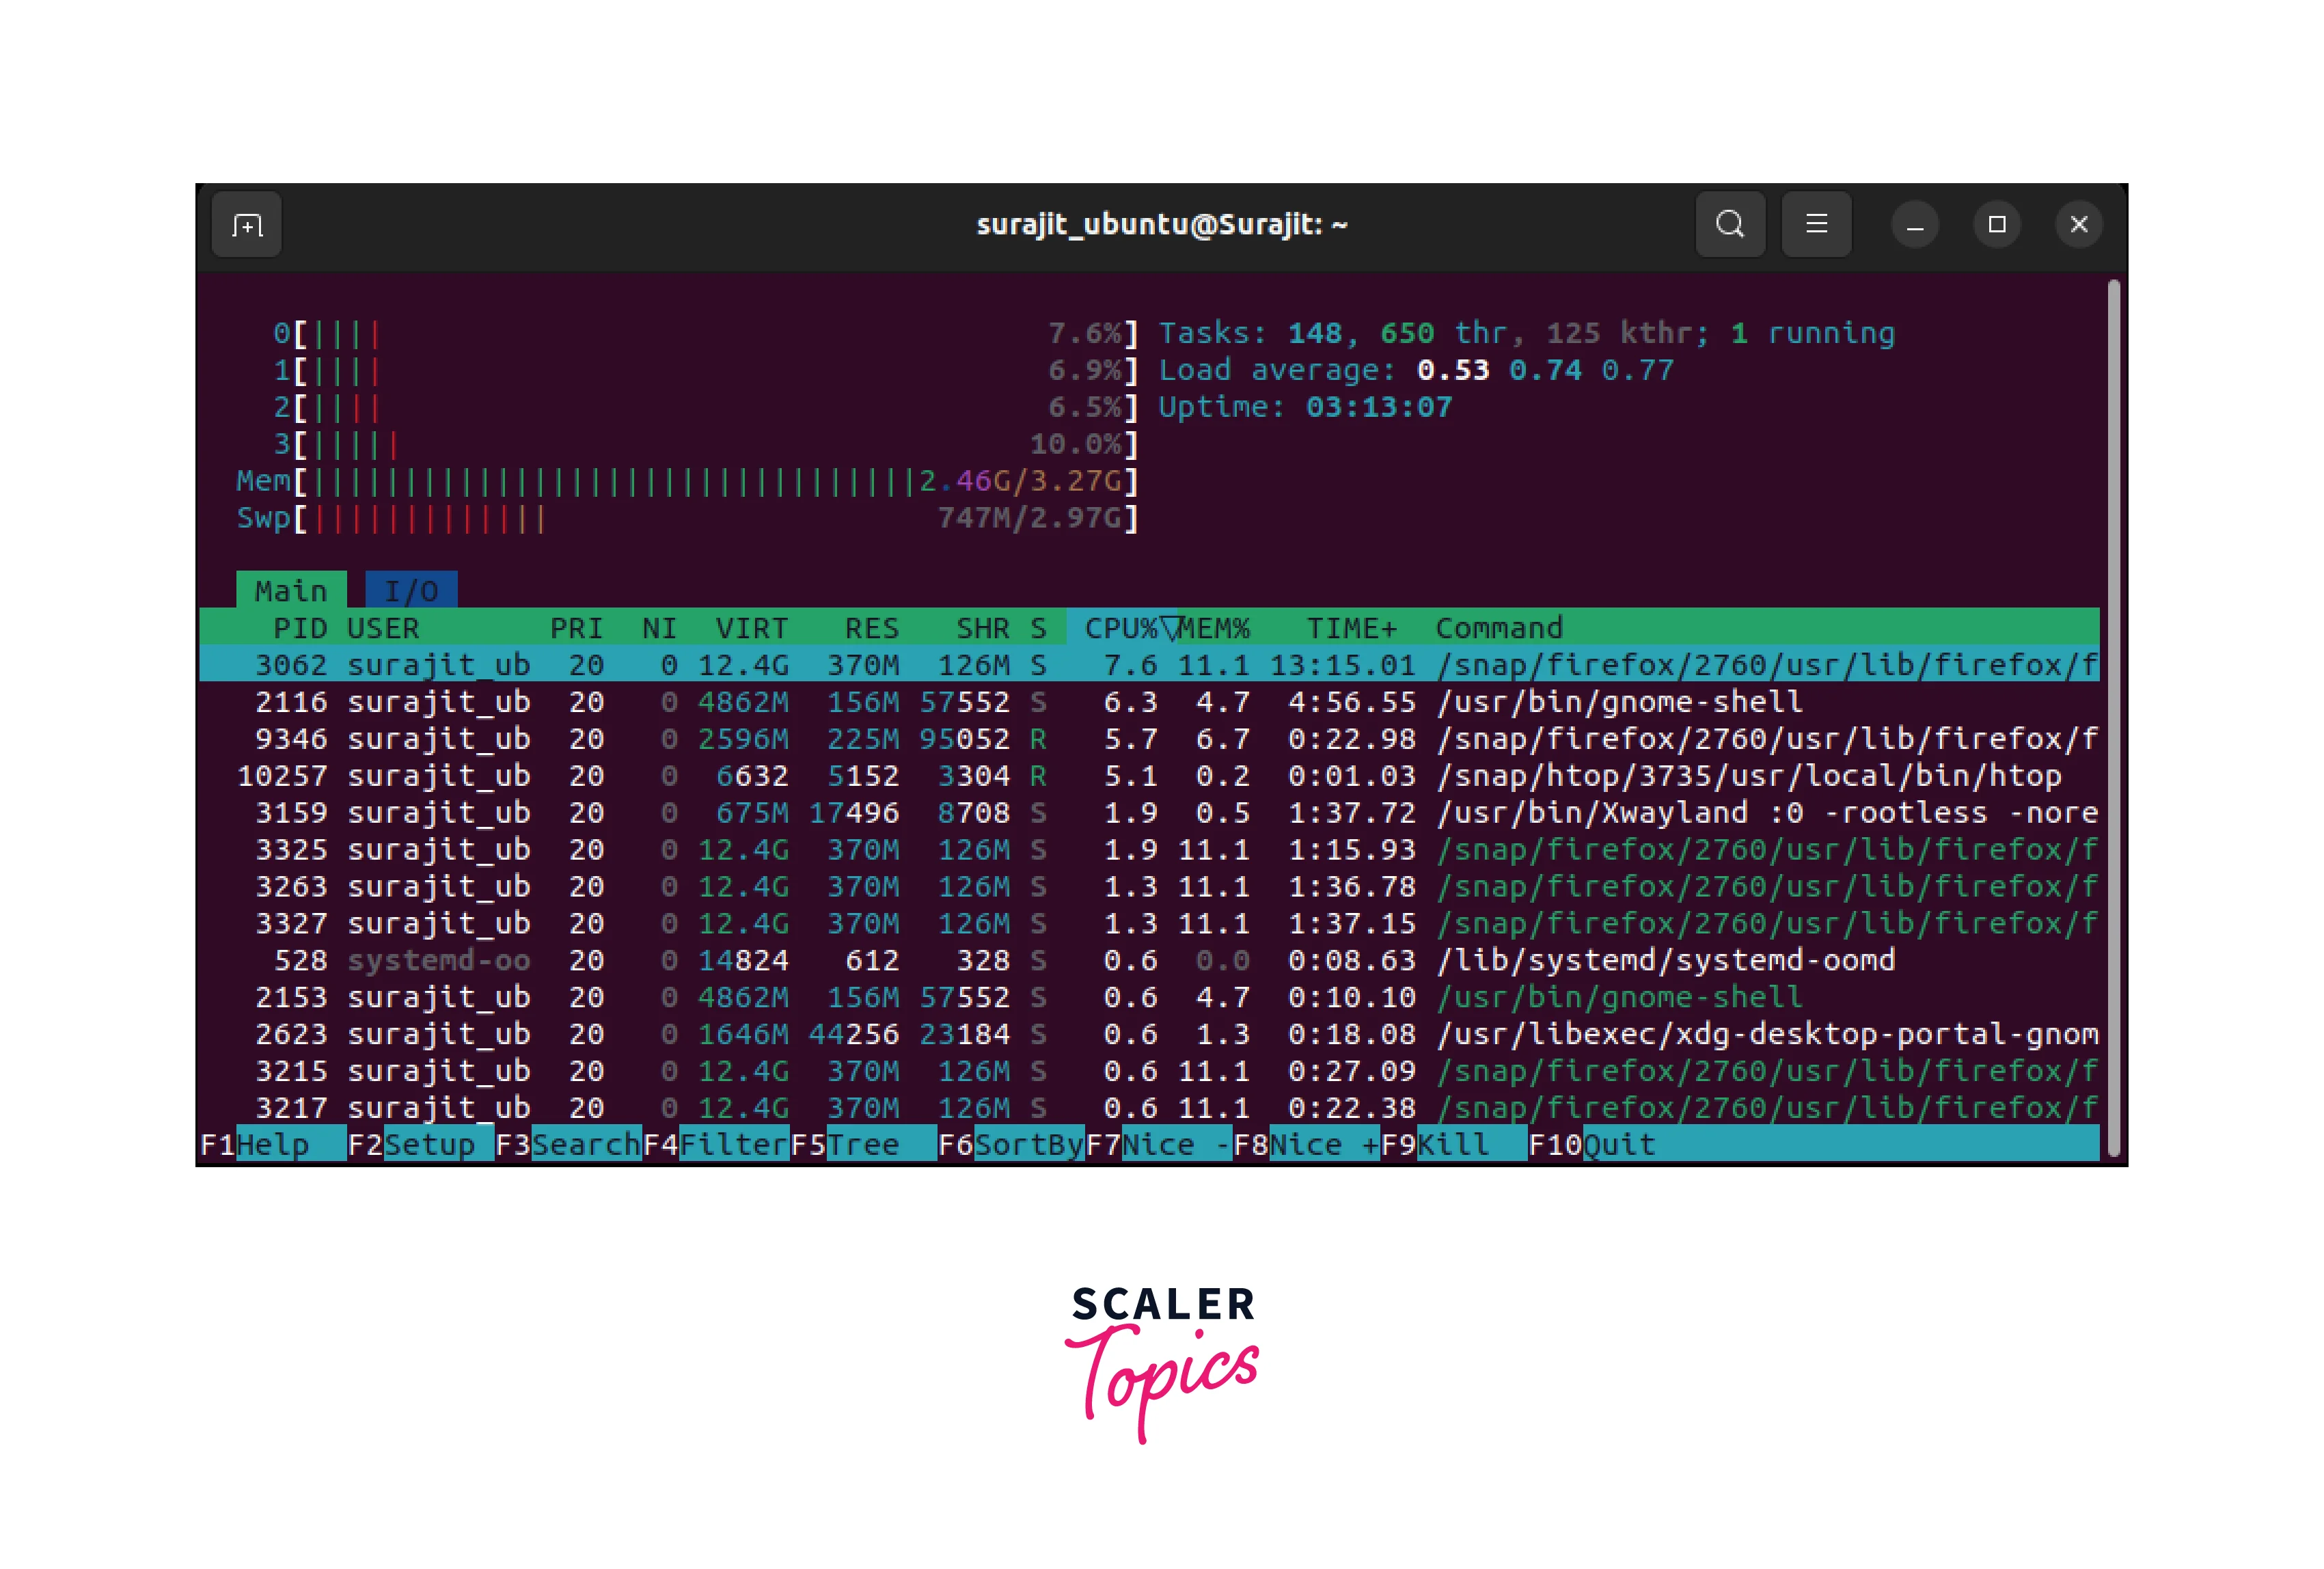
htop: htop is an interactive process viewer and system monitor. It is similar to top but offers a more user-friendly interface with additional features. To run htop, open a terminal and type htop. It displays a color-coded overview of processes, CPU and memory usage, and allows you to sort and filter processes. Press q to exit.
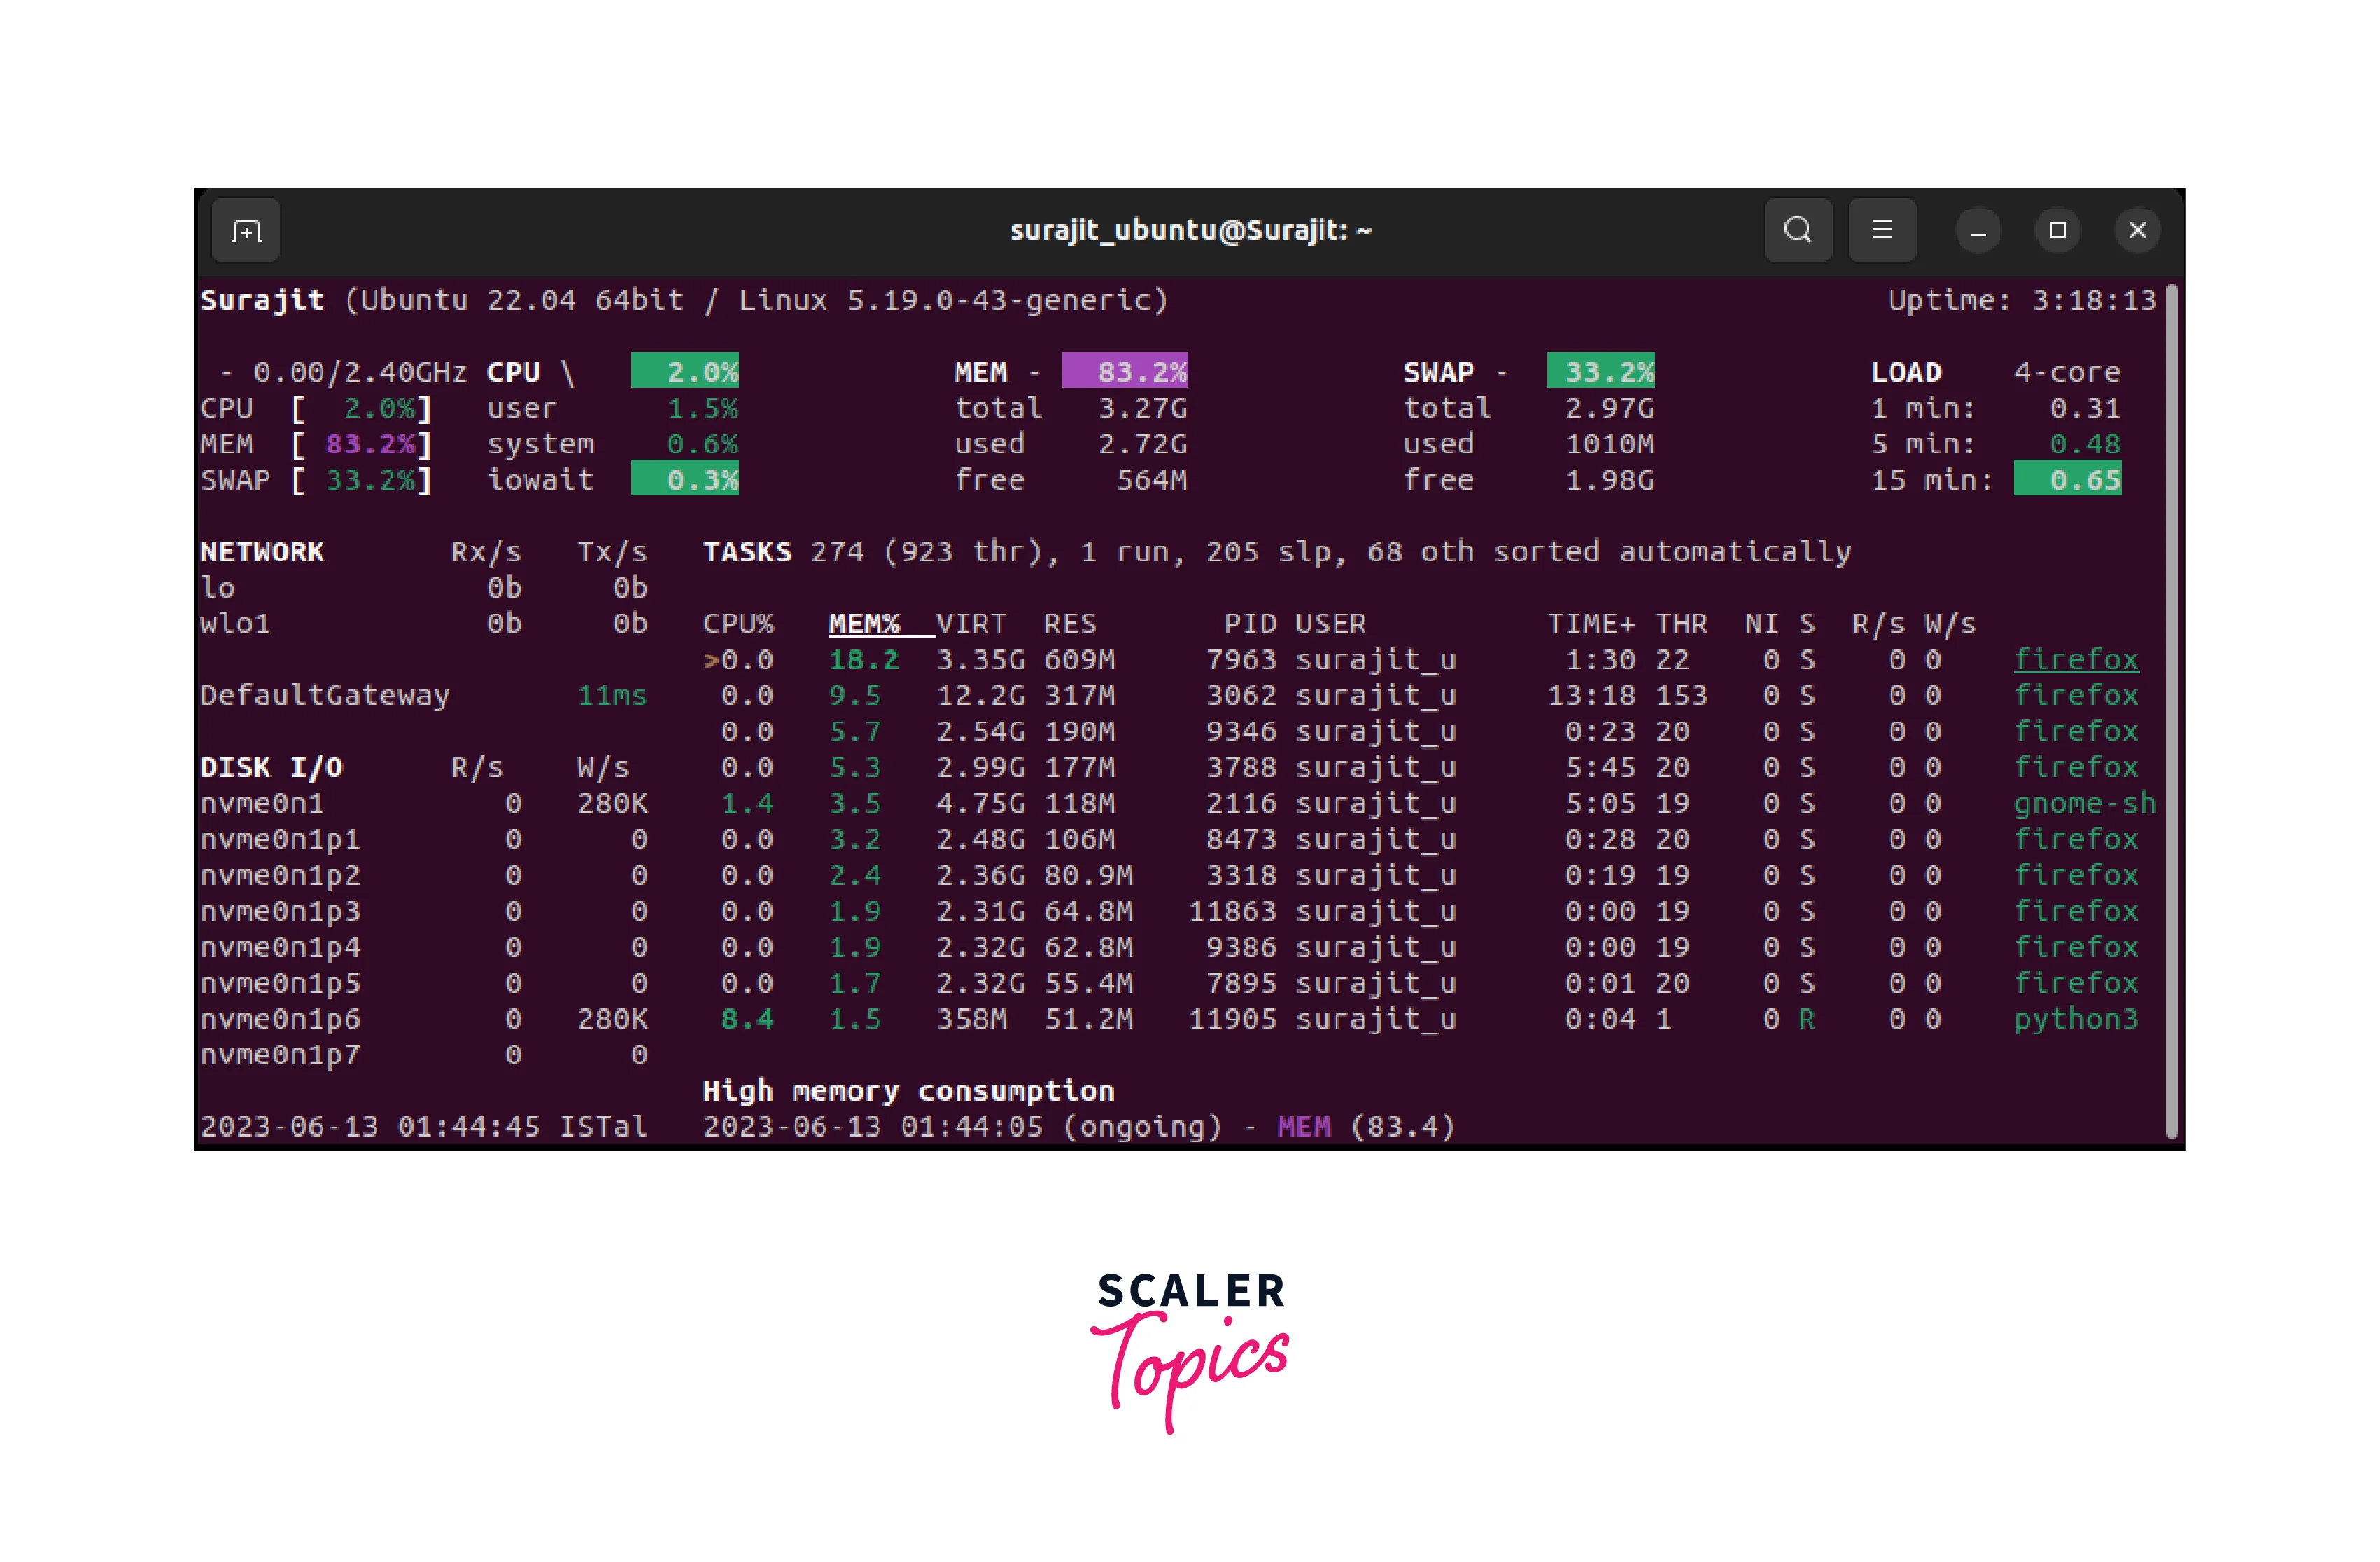
glances: glances is a cross-platform system monitoring tool that provides a simplified and comprehensive overview of system resources. It displays real-time information about CPU, memory, network, disk I/O, and more. To run glances, open a terminal and type glances. It presents a single screen with various sections. Press q to exit.
Using Linux GUI Tool
Linux also offers several GUI (Graphical User Interface) tools for system monitoring and resource management. Here is the most acommonly used GUI tools in Linux:
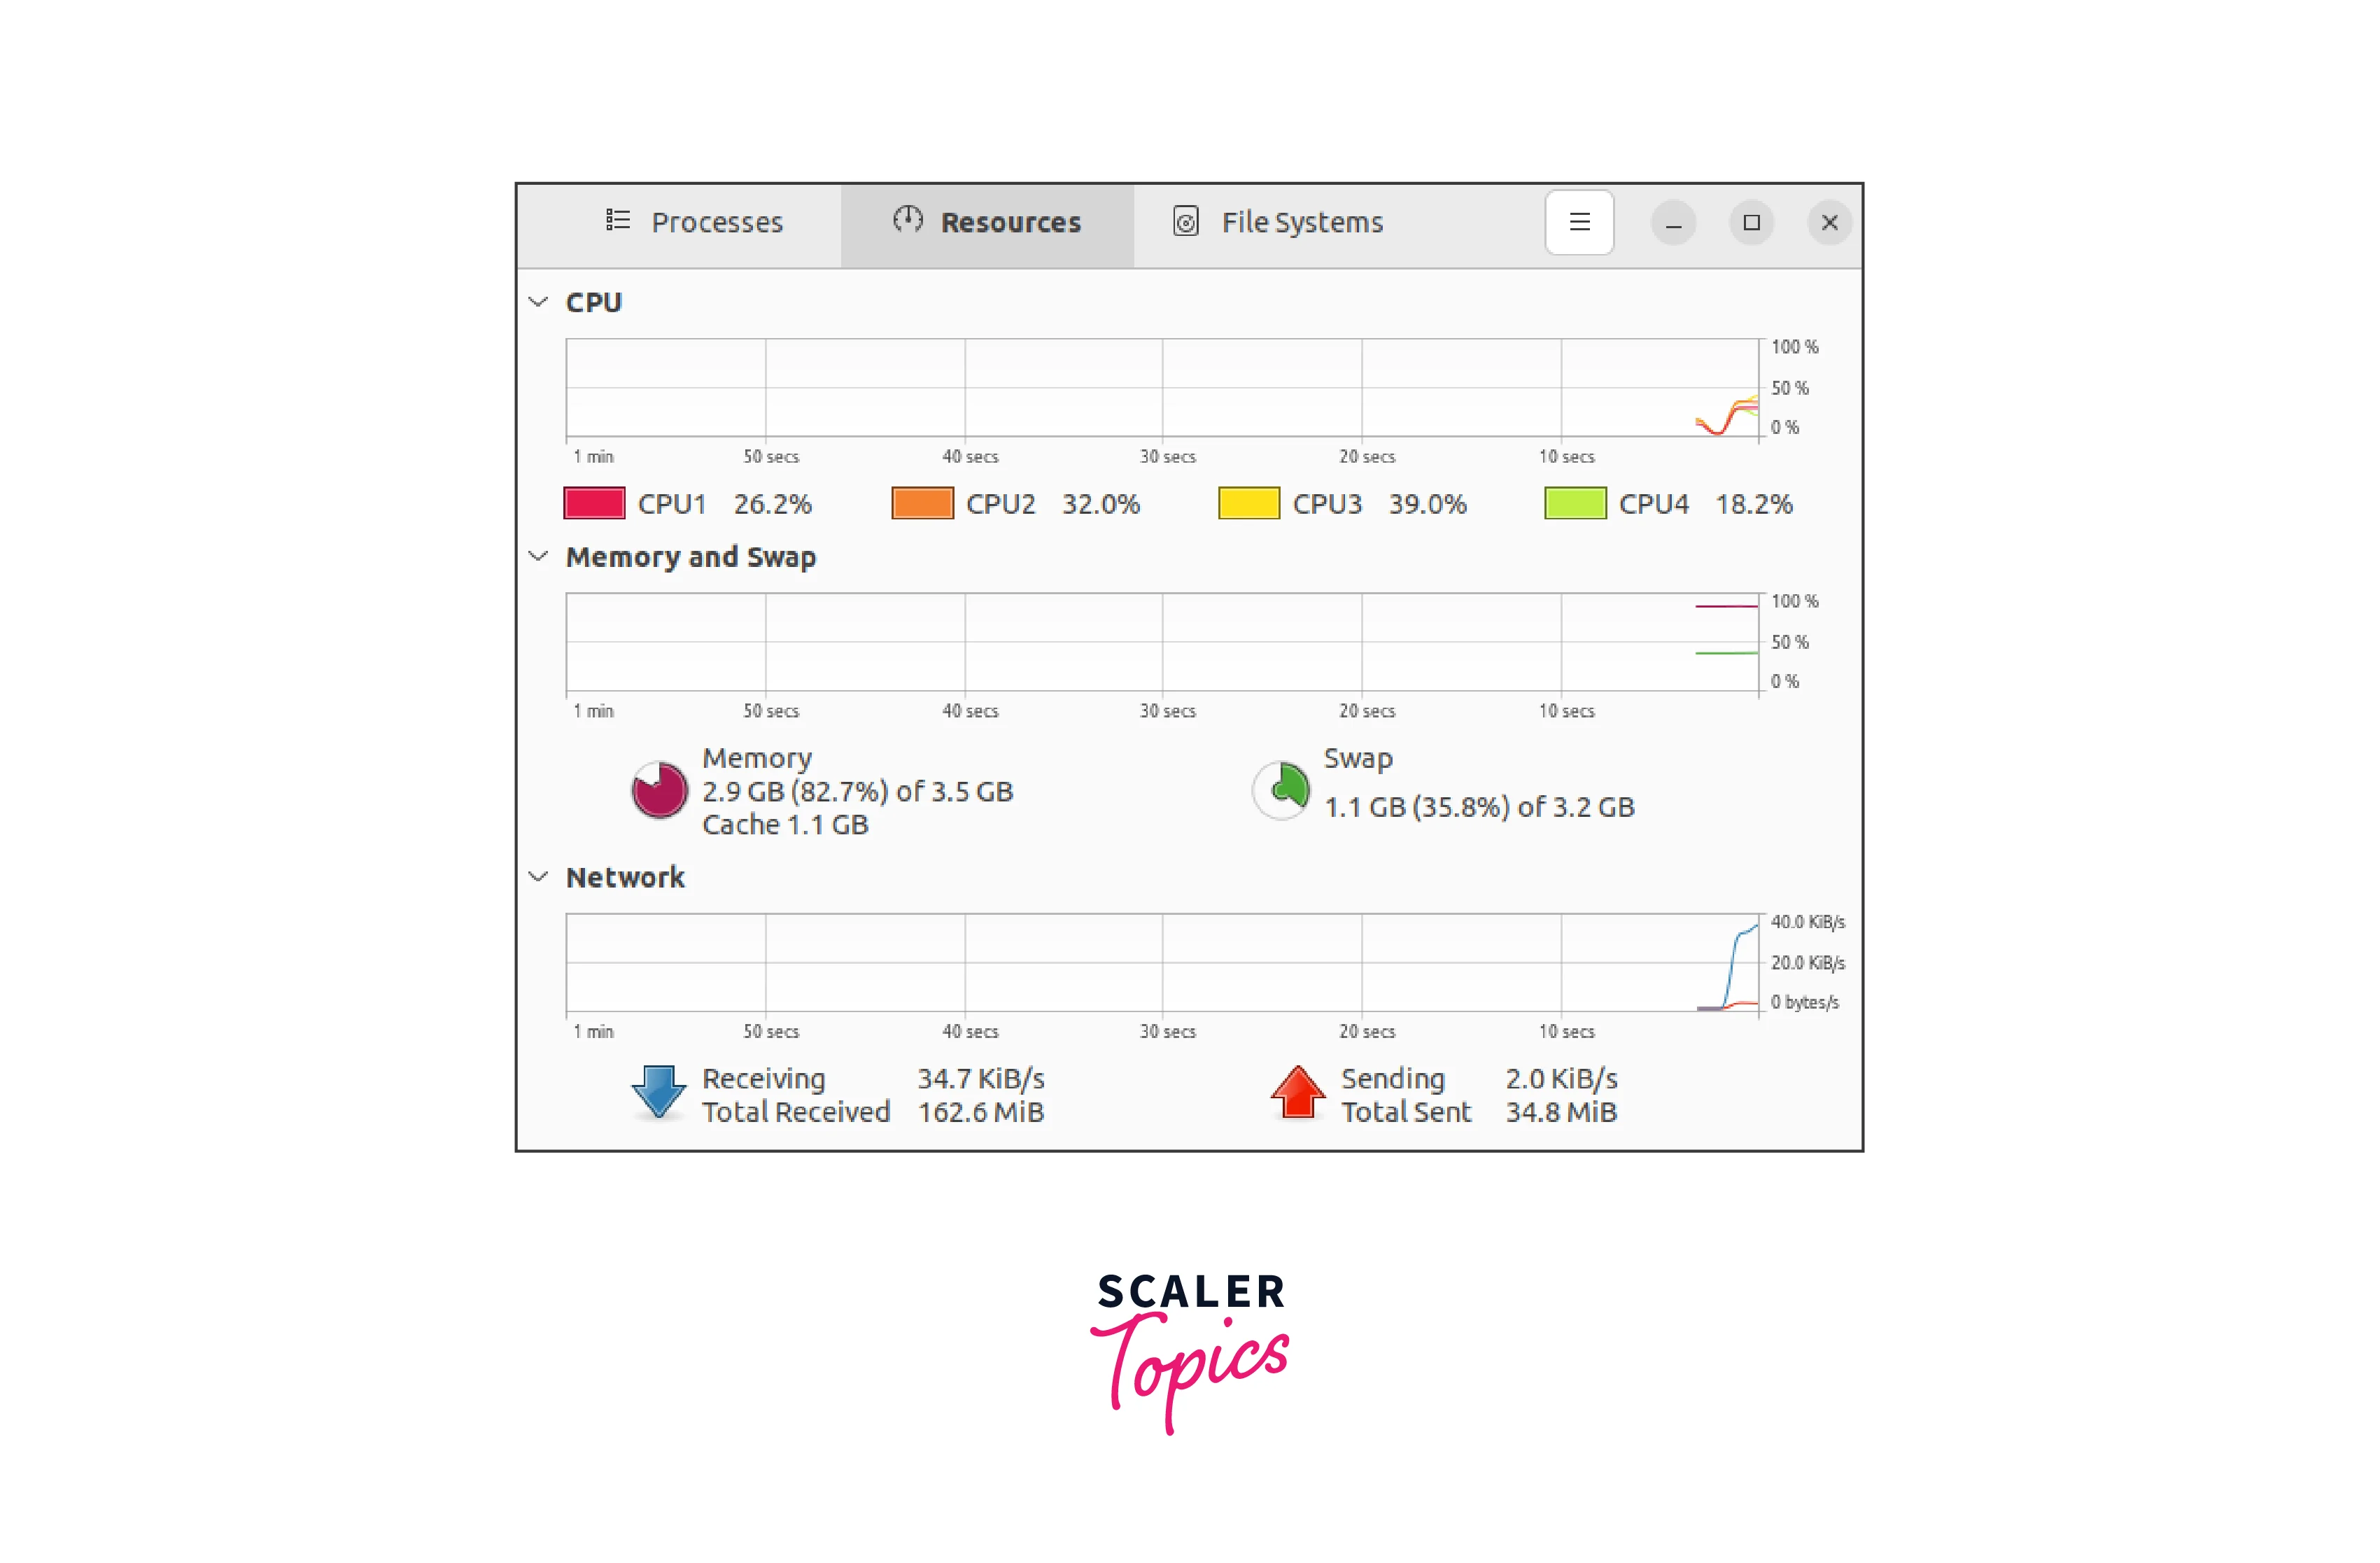
GNOME System Monitor: GNOME System Monitor is a graphical tool available in GNOME-based desktop environments. It provides a user-friendly interface to monitor system resources, including CPU usage, memory usage, swap-space usage, disk activity, and network activity. You can launch it by searching for "System Monitor" in the applications menu.
Conclusion
-
In this article we have discussed how to check swap space in Linux.
-
Swap space, or virtual memory, is a crucial component of Linux systems that helps manage memory usage and prevent performance issues.
-
Linux provides various methods to check swap space usage, such as the swapon and swapoff commands, as well as examining files like /proc/swaps and using tools like free and vmstat.
-
These tools offer insights into swap space availability, utilization, and configuration, allowing users to optimize system performance. Additionally, command-line tools like top, atop, htop, and glances, as well as GUI tools like GNOME System Monitor and KDE System Monitor, provide real-time monitoring of system resources, process activity, and other performance metrics.