Chrome Extensions which Assist in CSS

:::
Overview
Google Chrome's Developer Tools have an assortment of several features that help you do things like make changes to CSS in real-time. It isn't just the editing alone that can be checked and fixed, but also the performance of the web pages can be looked at and improved. Among the things we’ll talk about is some Chrome DevTools features that helps to debug and inspect element in Chrome, such as features to inspect CSS grids, force print preview mode, and ways to change CSS in Google Chrome.
How to Trigger an Element’s State and Expose its CSS Styles in DevTools
An Element's state can be triggered either by the shortcut or a simple right-click on the web page.
- Ctrl + Shift + i on Windows
- cmd + shift + i on Mac
- Right click -> inspect element
The third option is advantageous because it will redirect you to the HTML element you clicked on.
Output:

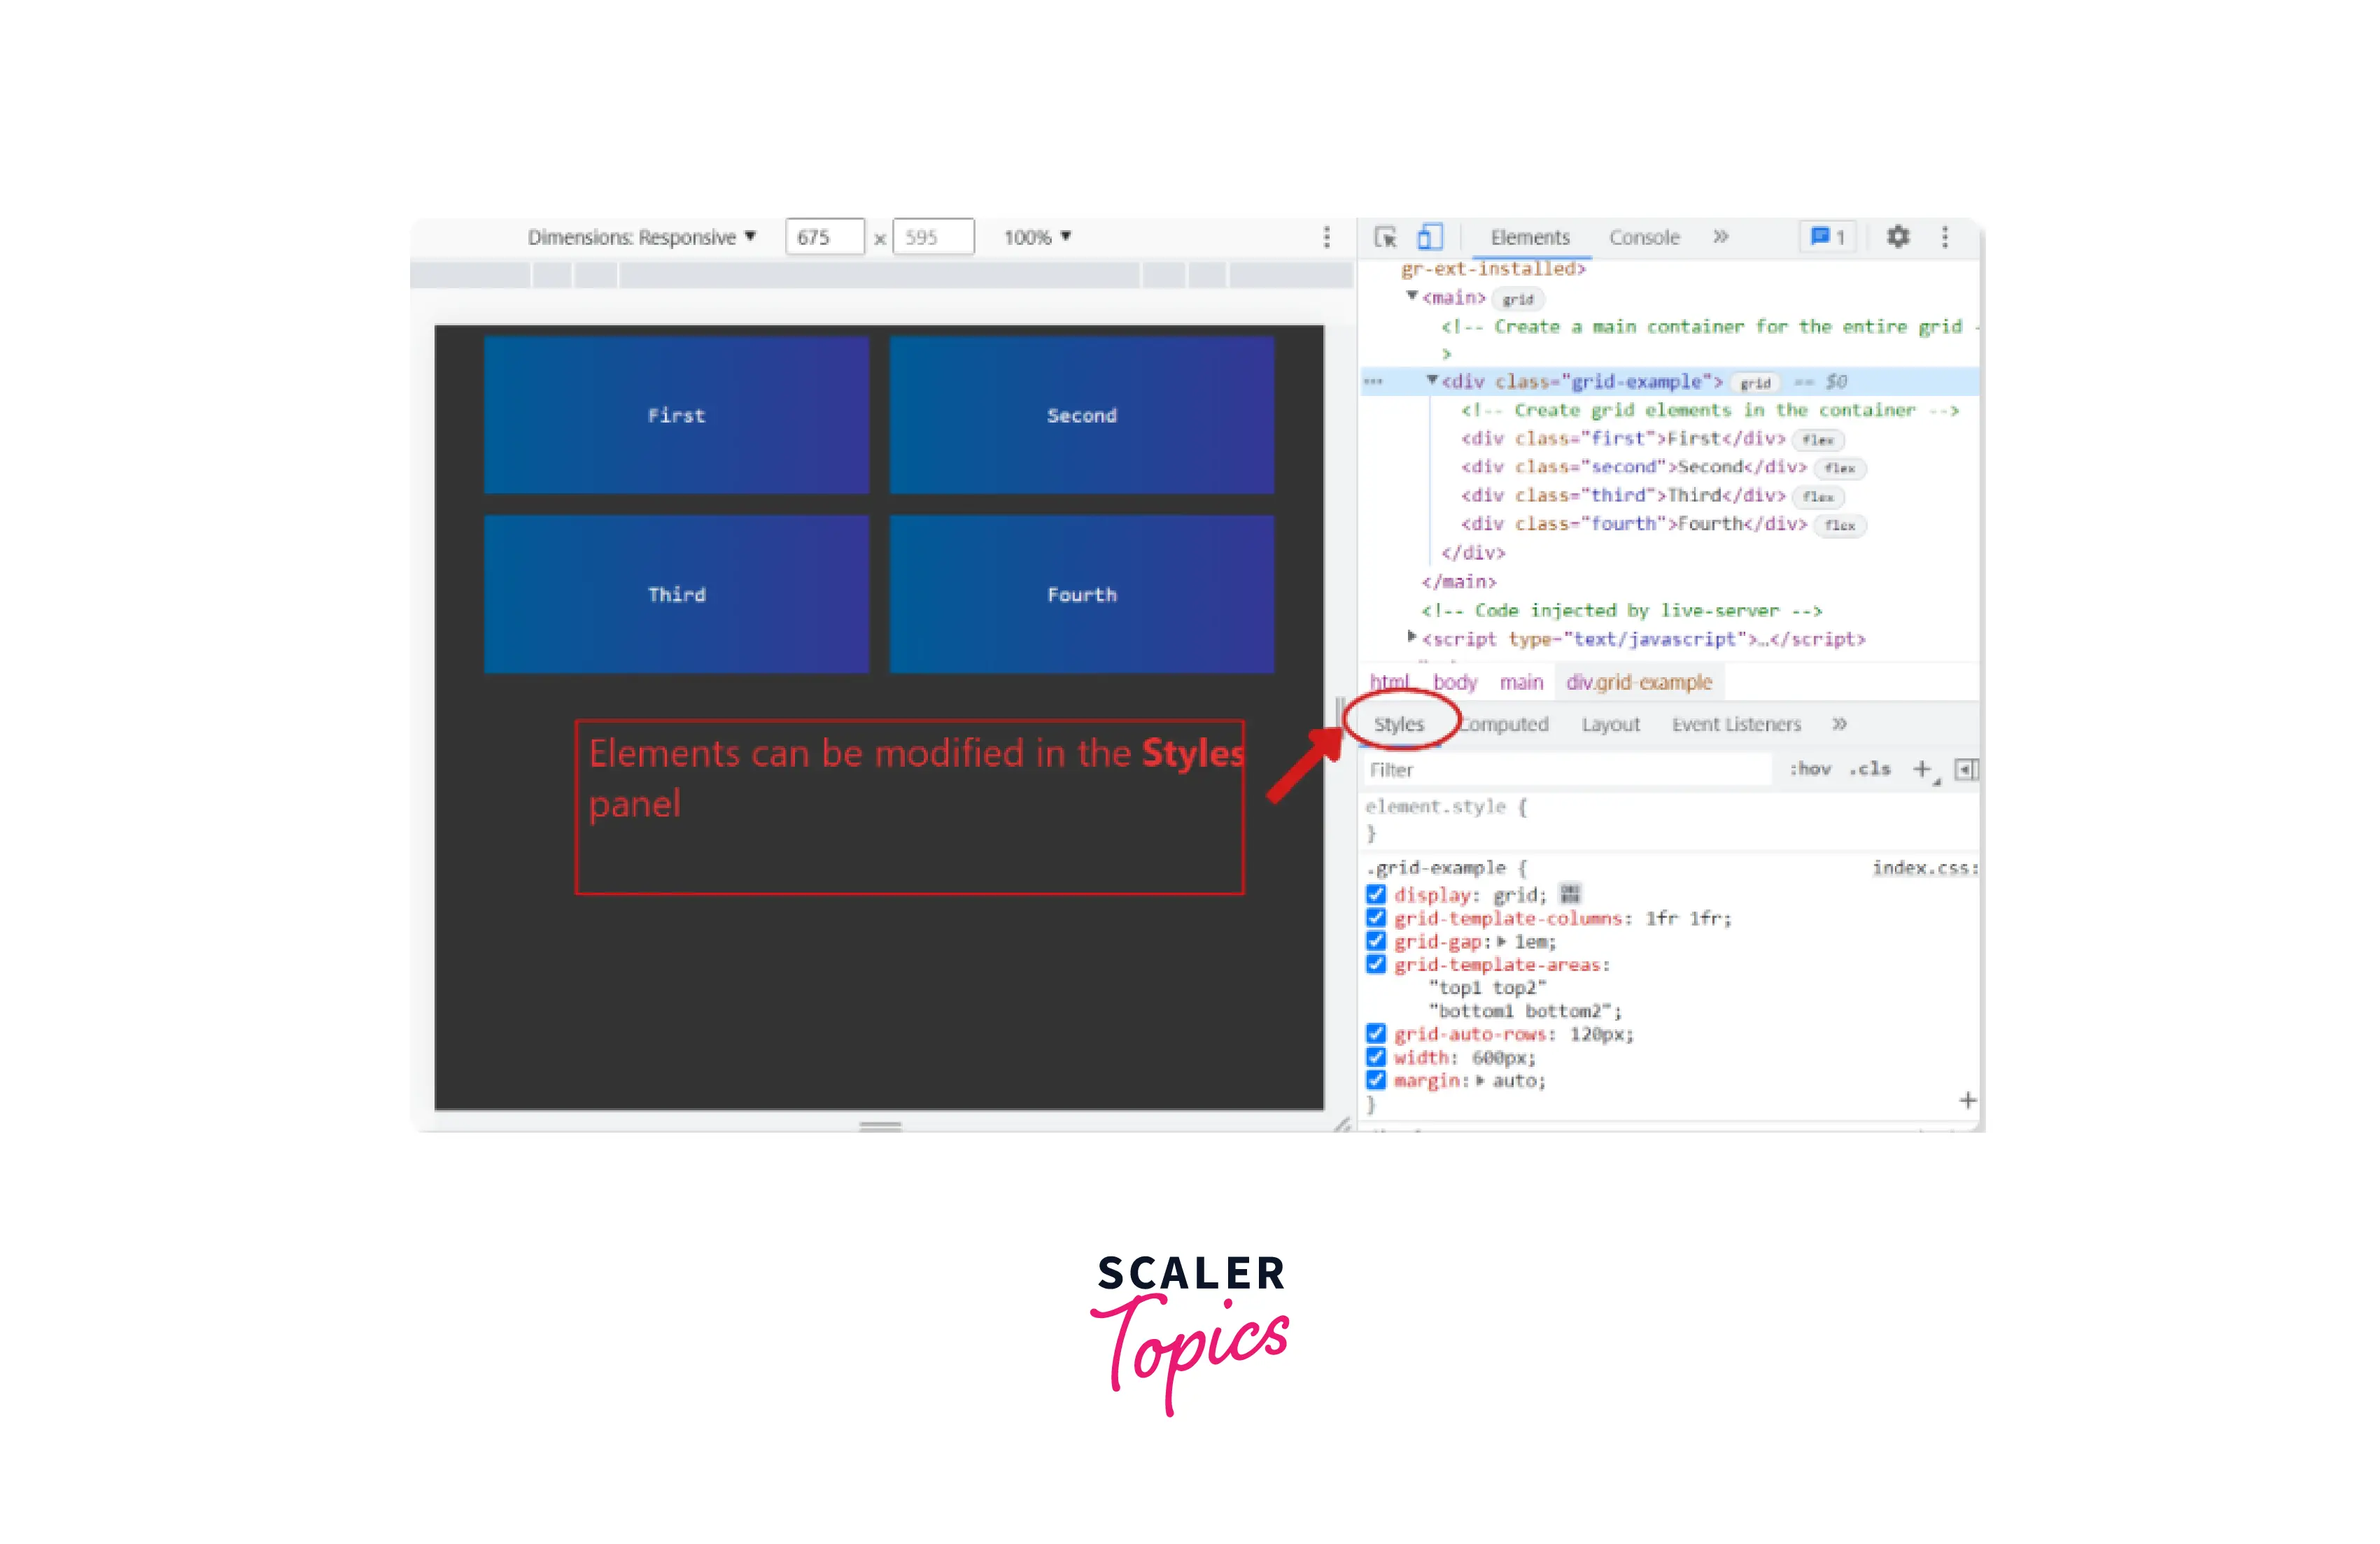
Although you can see the CSS attributes attached inside the style tag, it's better to move to the Styles panel to get a clear view of the styles.
On the right pane, you can see all the styles in detail, similar to this:
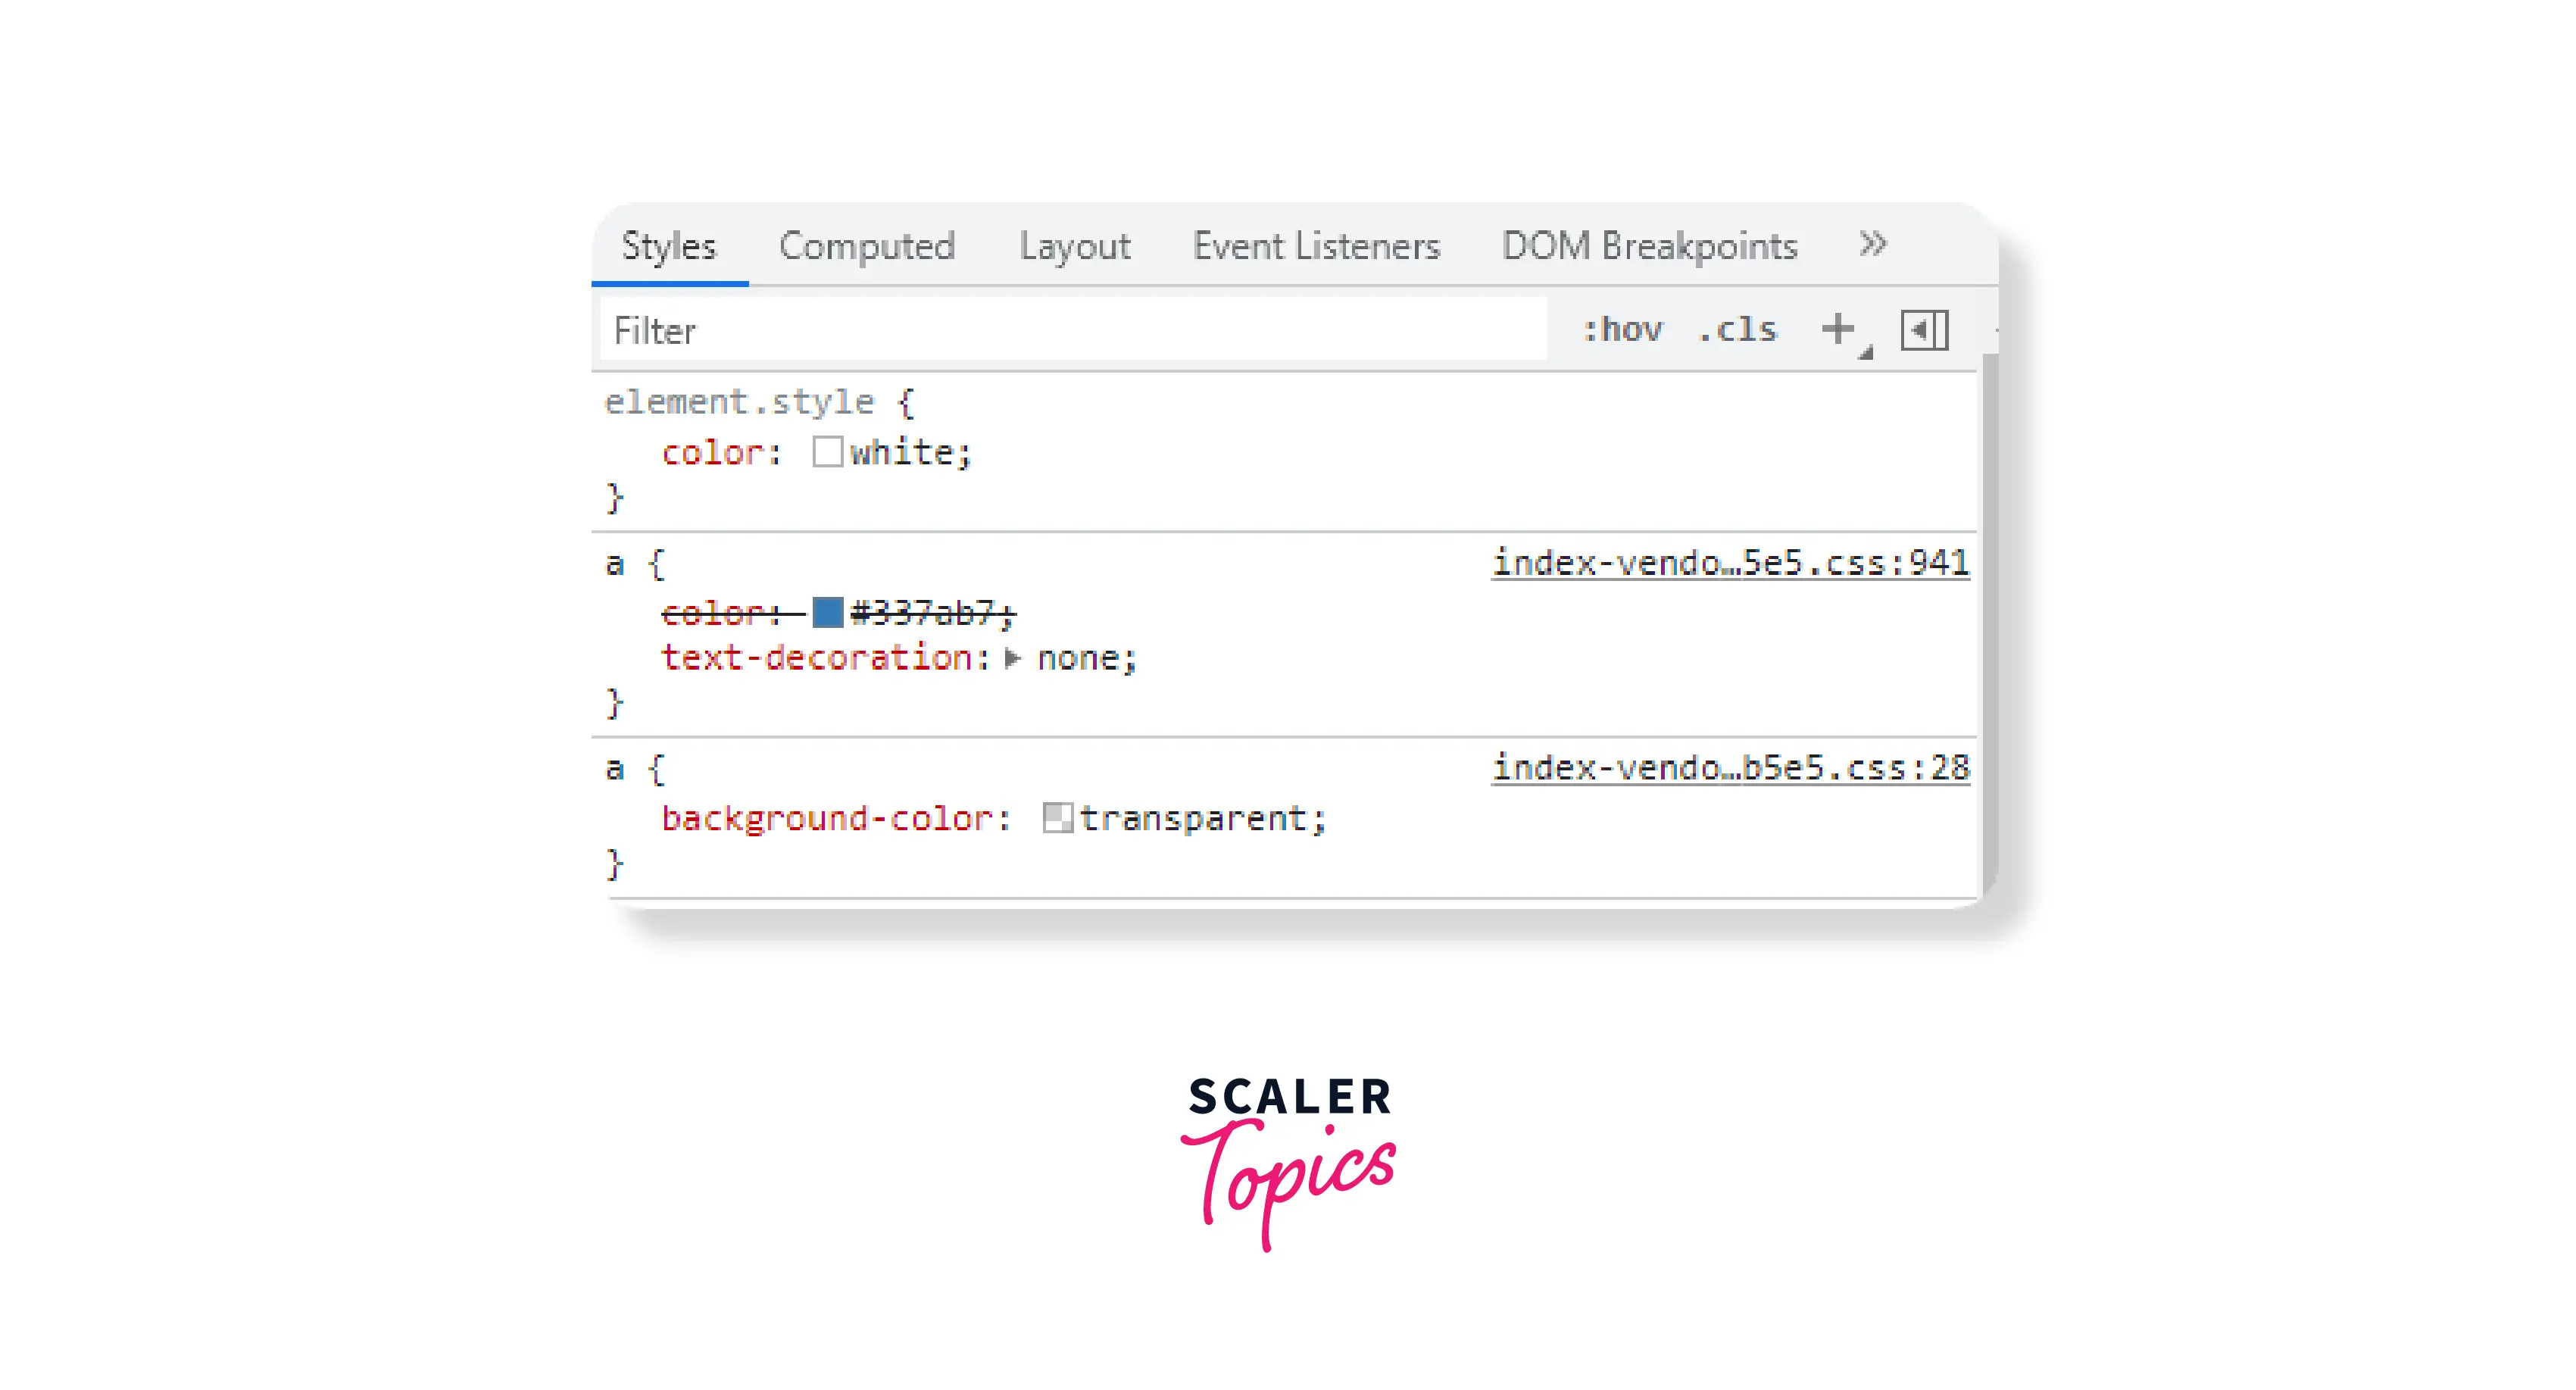
Note that styling may differ slightly based on your device.
Features in Chrome DevTools for Effective Debugging
Steps to Add/Remove CSS Class
-
Right-click on the box below and choose to inspect the element
-
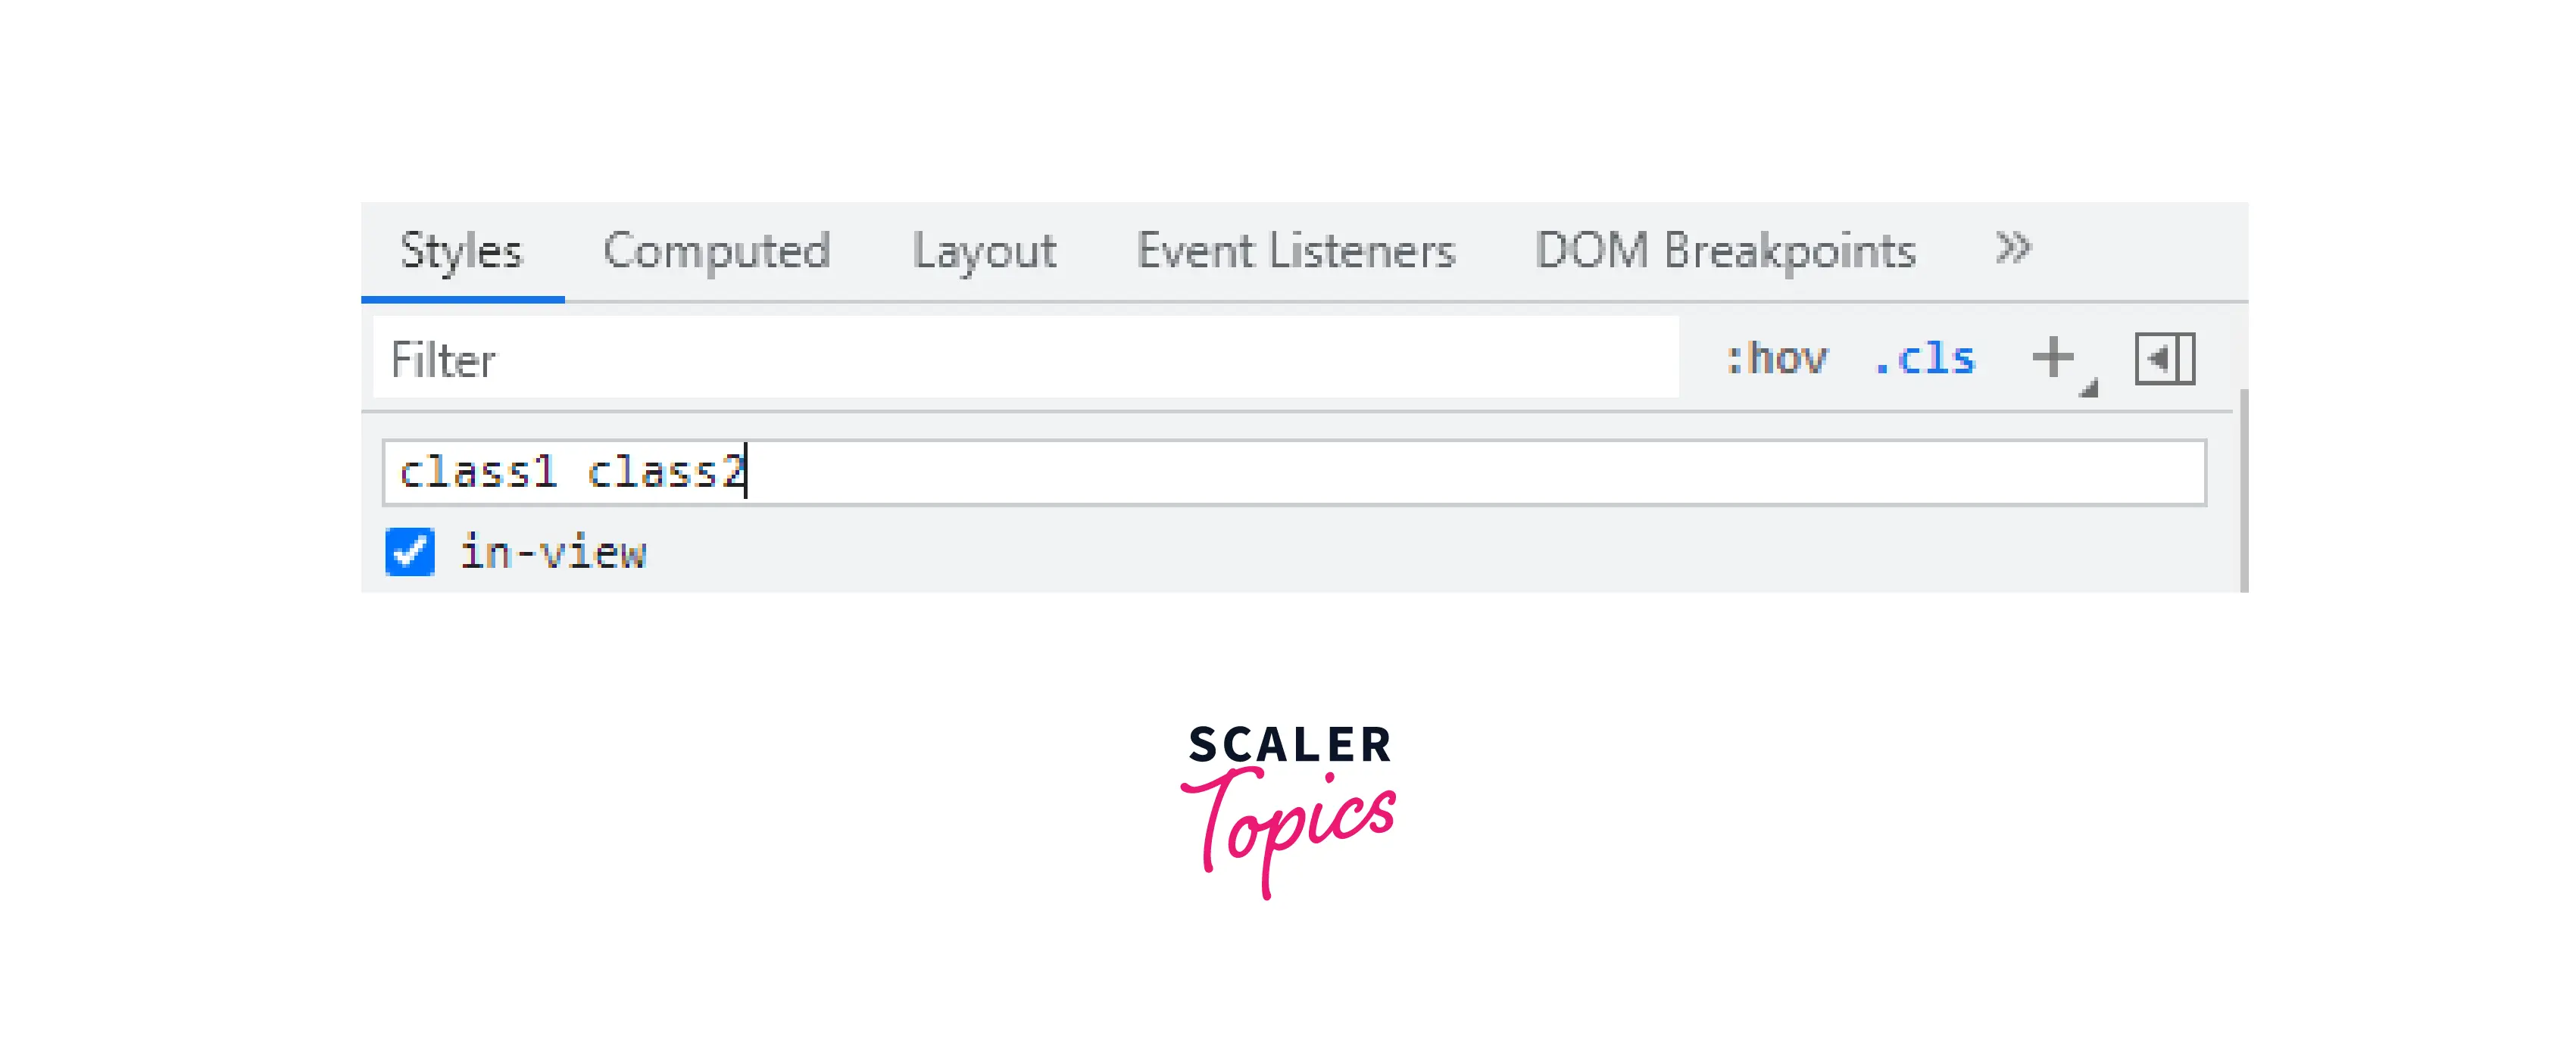
Click on the .cls button

-
Add your class. You can give multiple classes with a space. Press enter once done.
-
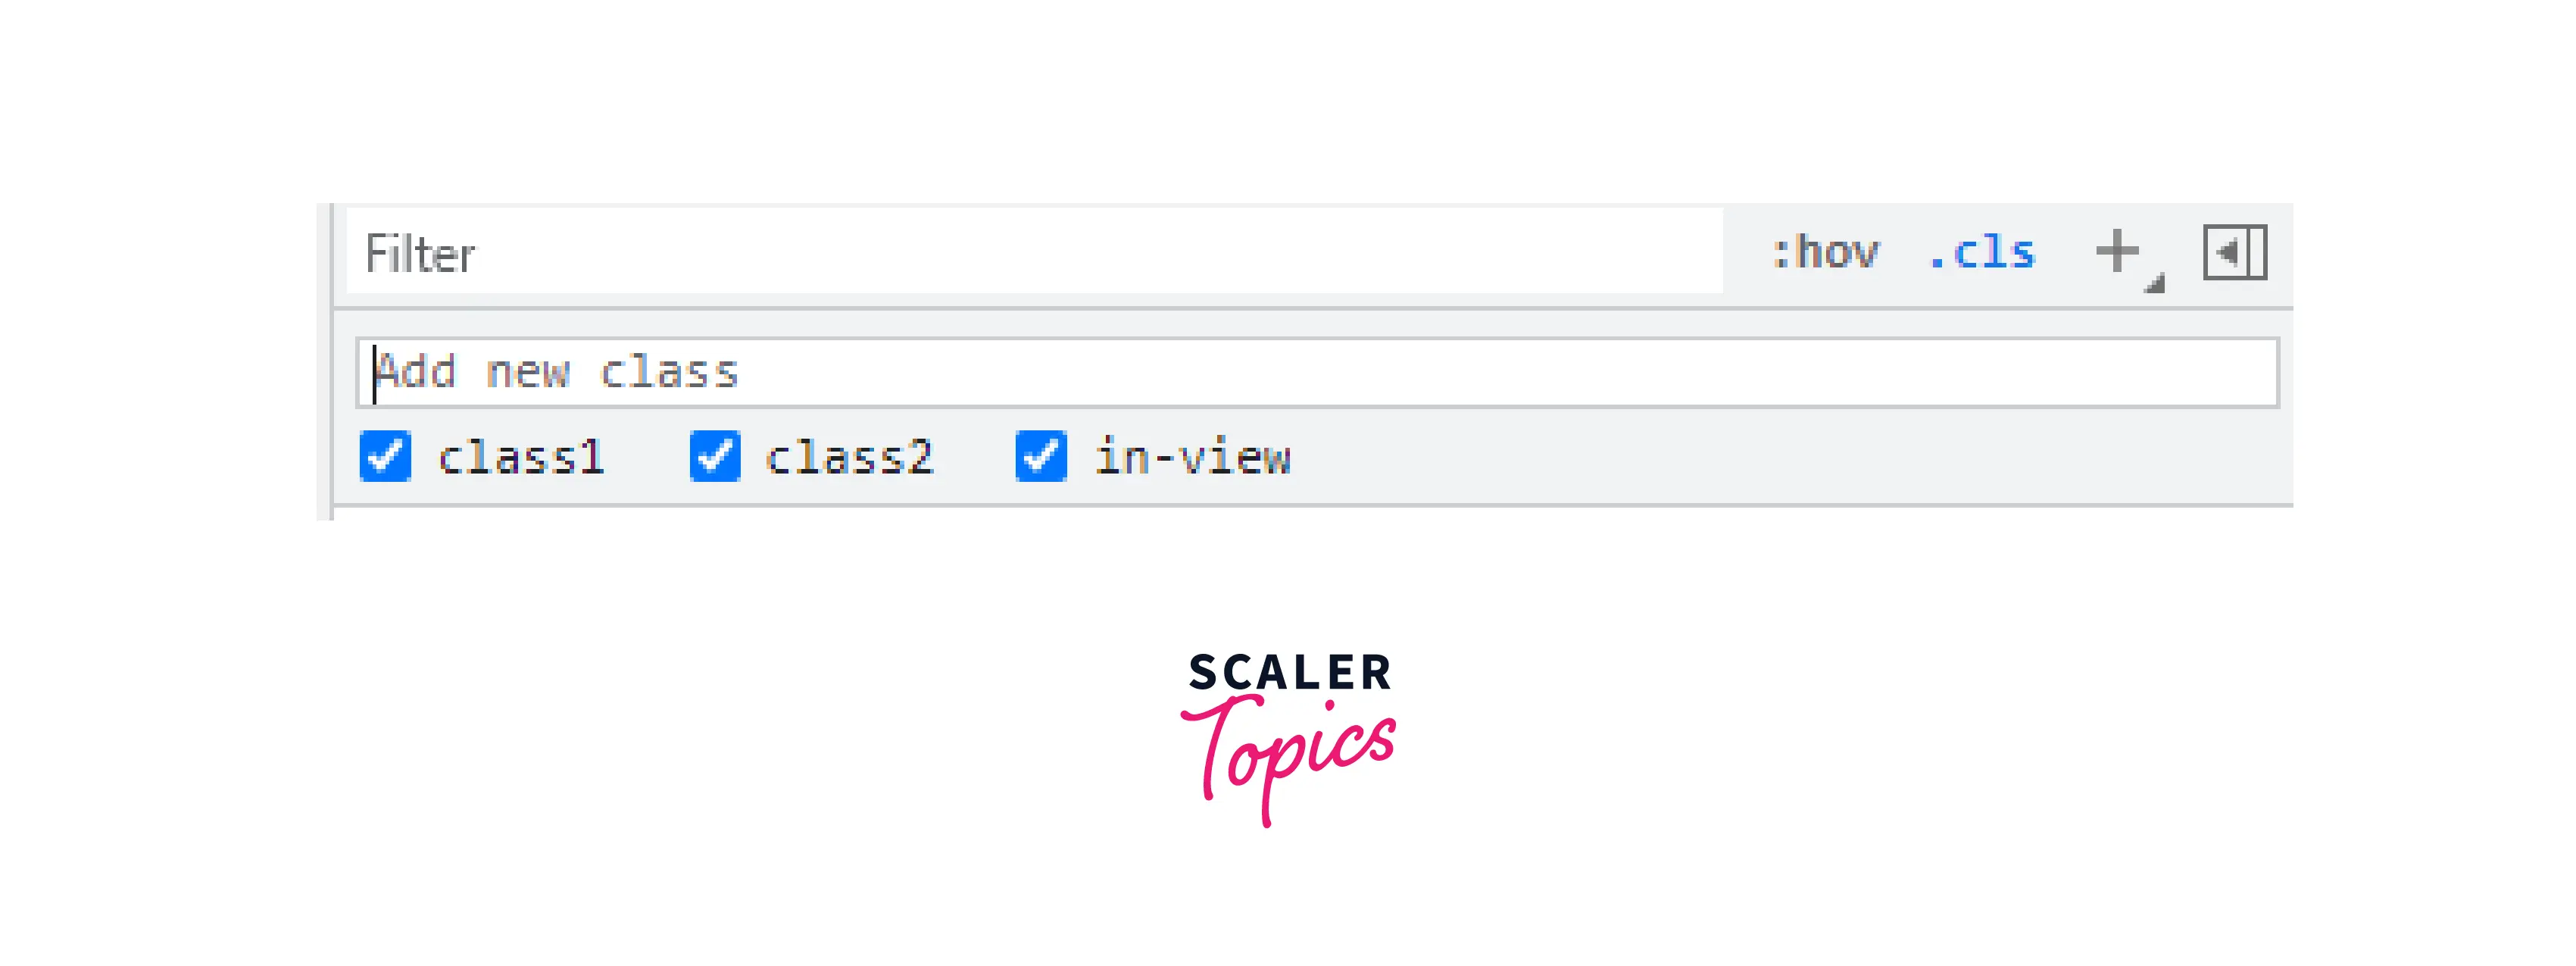
You can check/uncheck them to able/disable them.
Demo:

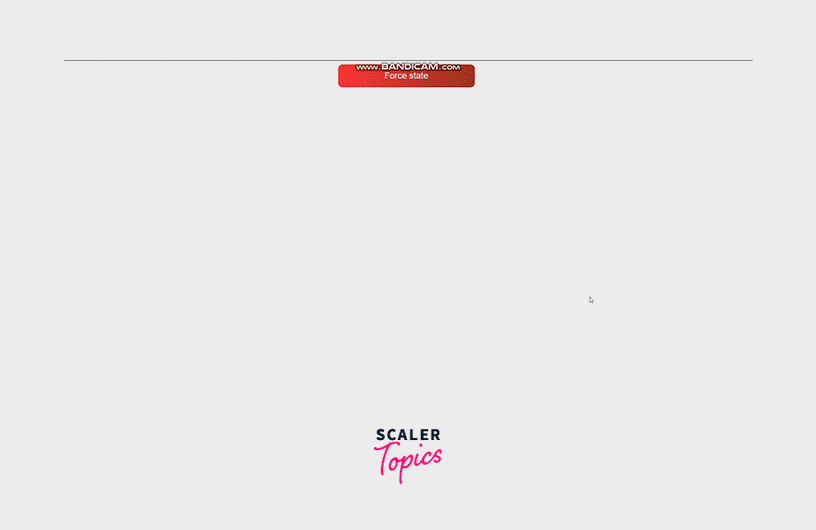
Toggle a Pseudo-Class (Force State)
Pseudo-Classes are meant to represent the special state of any element. The use of pseudo-classes can help increase the experience of any user significantly.
There are a plethora of instances where pseudo-classes can help you show how the element would behave in a particular state. Let's consider hovering a button and noticing the changes.
You can try hovering the button given below and observe how there's a slight change in the colour. Also, the colour will be changed to Royal Blue until you keep the button pressed.

Now, right-click on the button and click on Inspect. Since the element is already selected, right-clicking again on the HTML element will open up the menu where you can Force state option.
The button's colour would change by either clicking on :active or :focus.
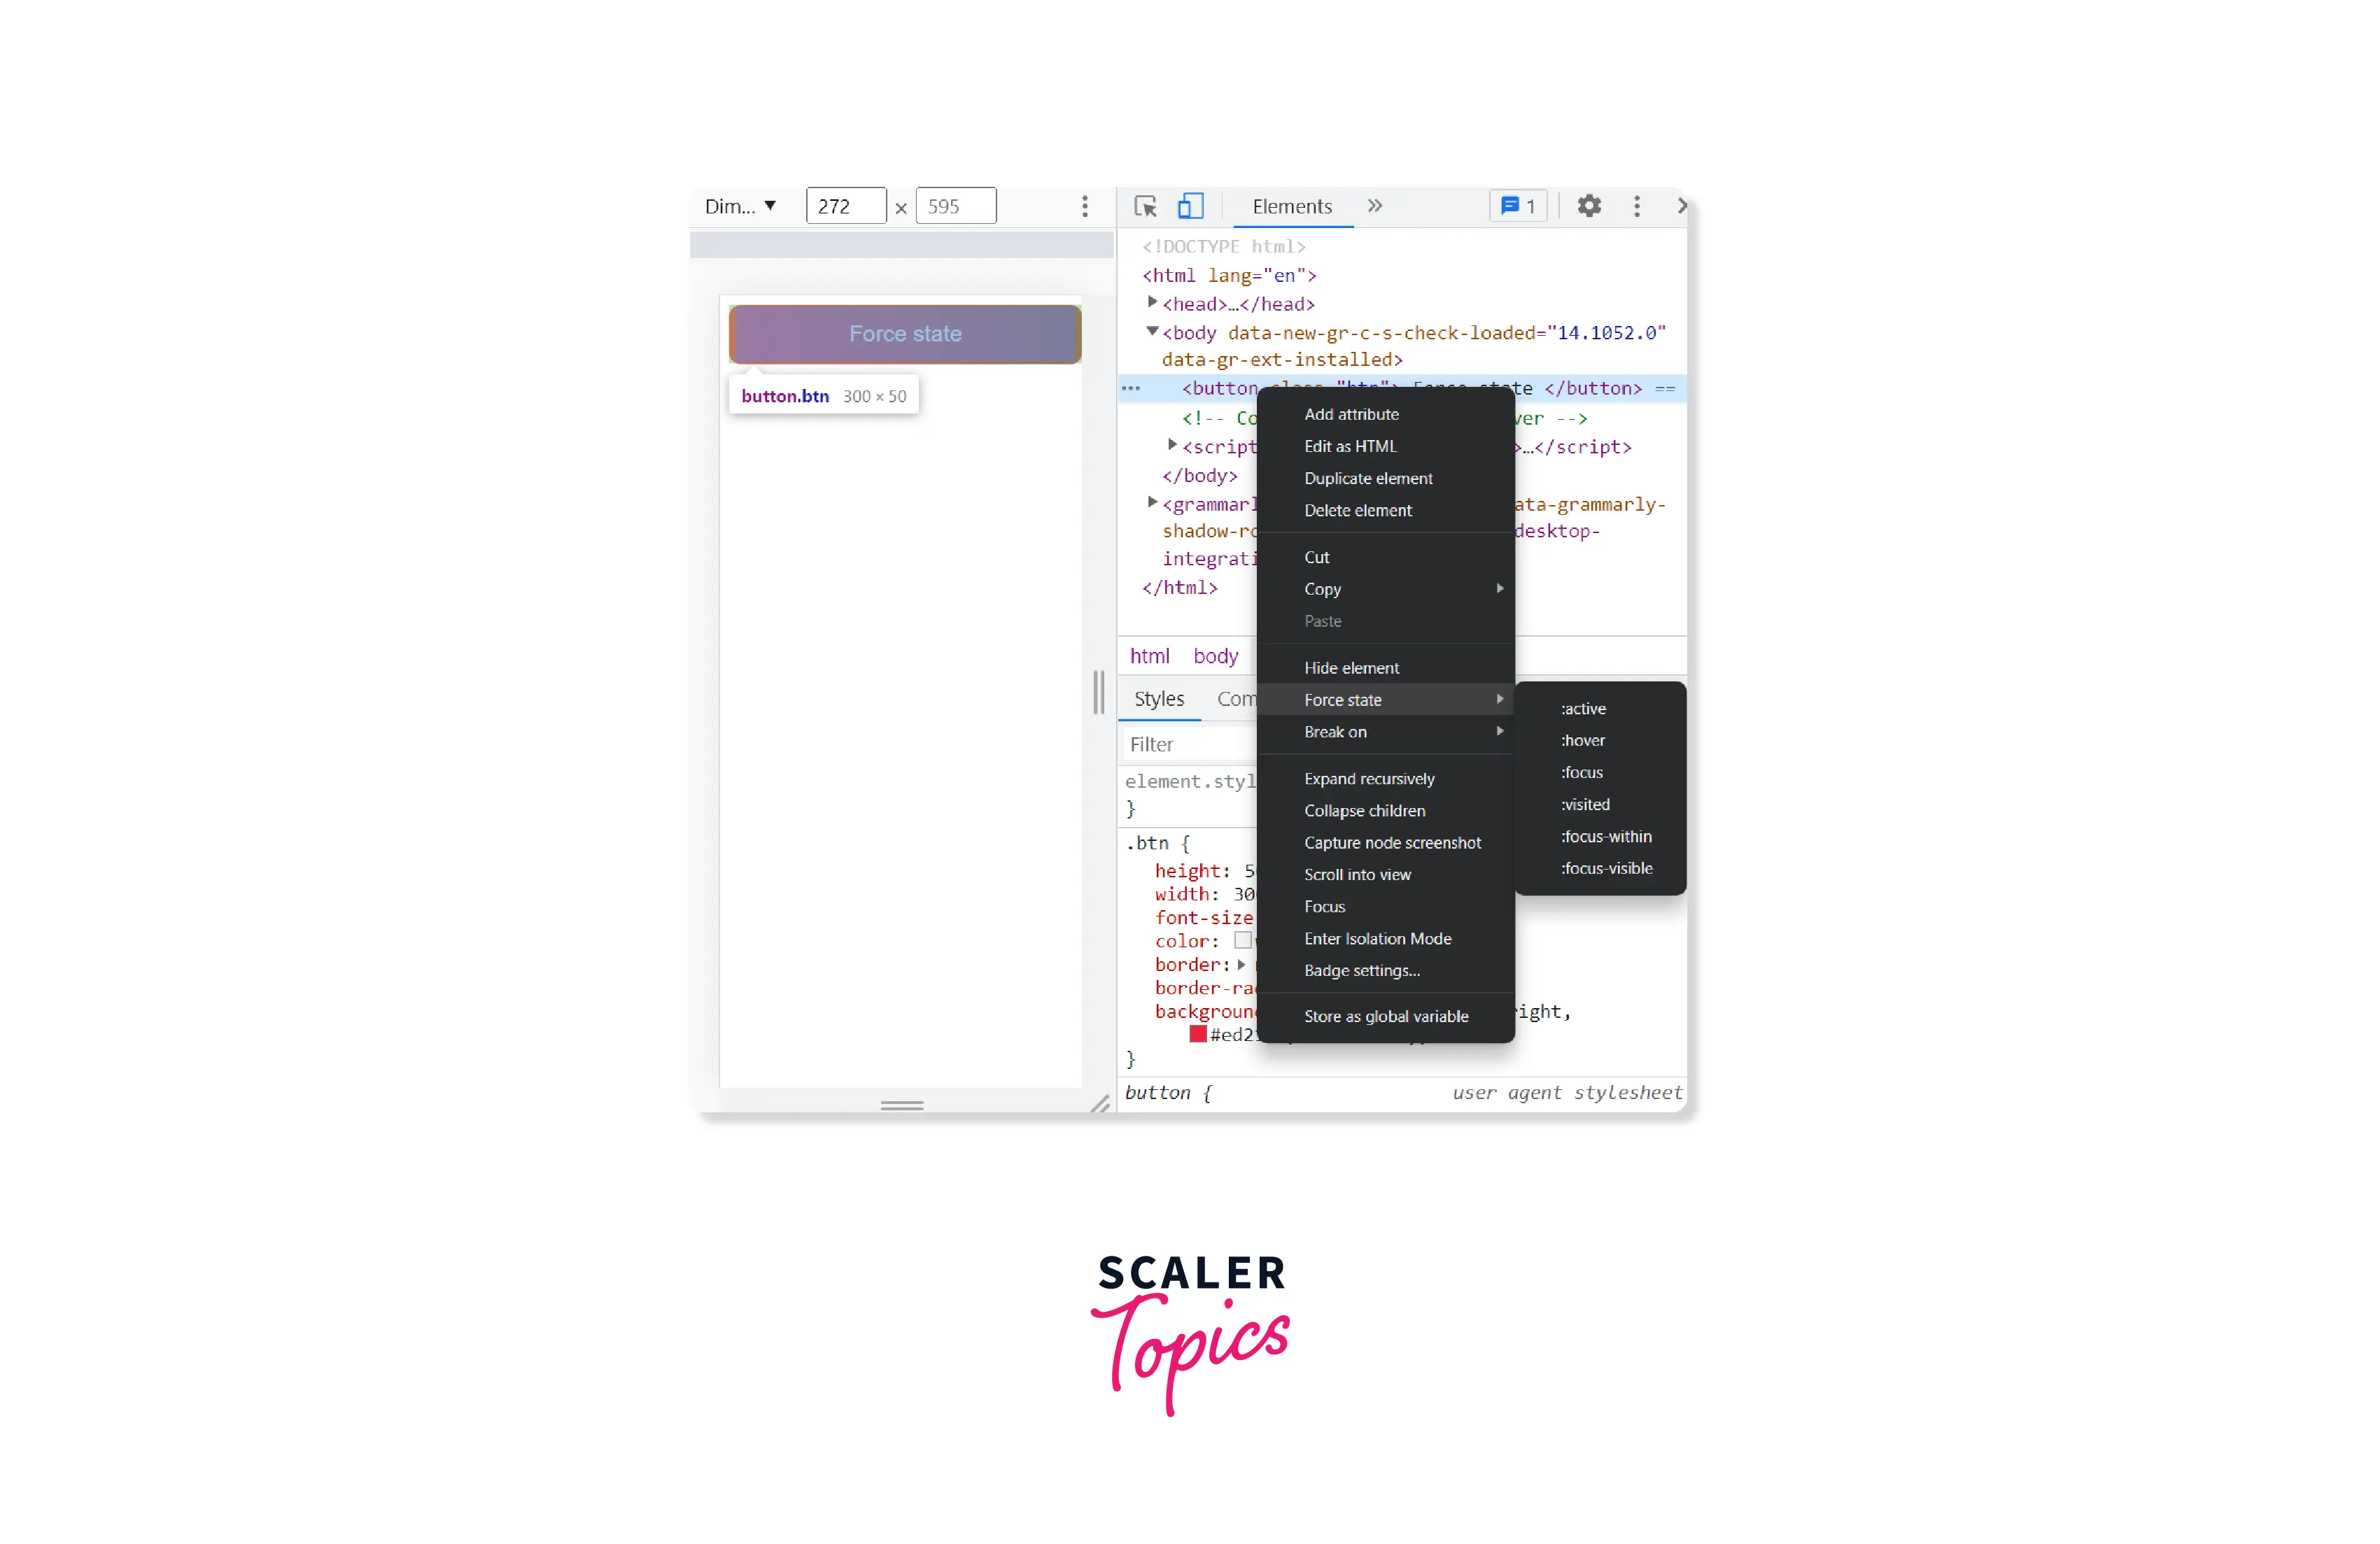
Clicking on :active changes the button's colour.

Given below are some of the states that act as the user interacts with an element.
| Pseudo-class | Behaviour |
|---|---|
| The mouse cursor being pointed at the element | |
| When the element is being focused by a click (Commonly used for taking inputs) | |
| The element is activated by the user (Pressing and releasing a button) | |
| When a parent or child element is clicked |
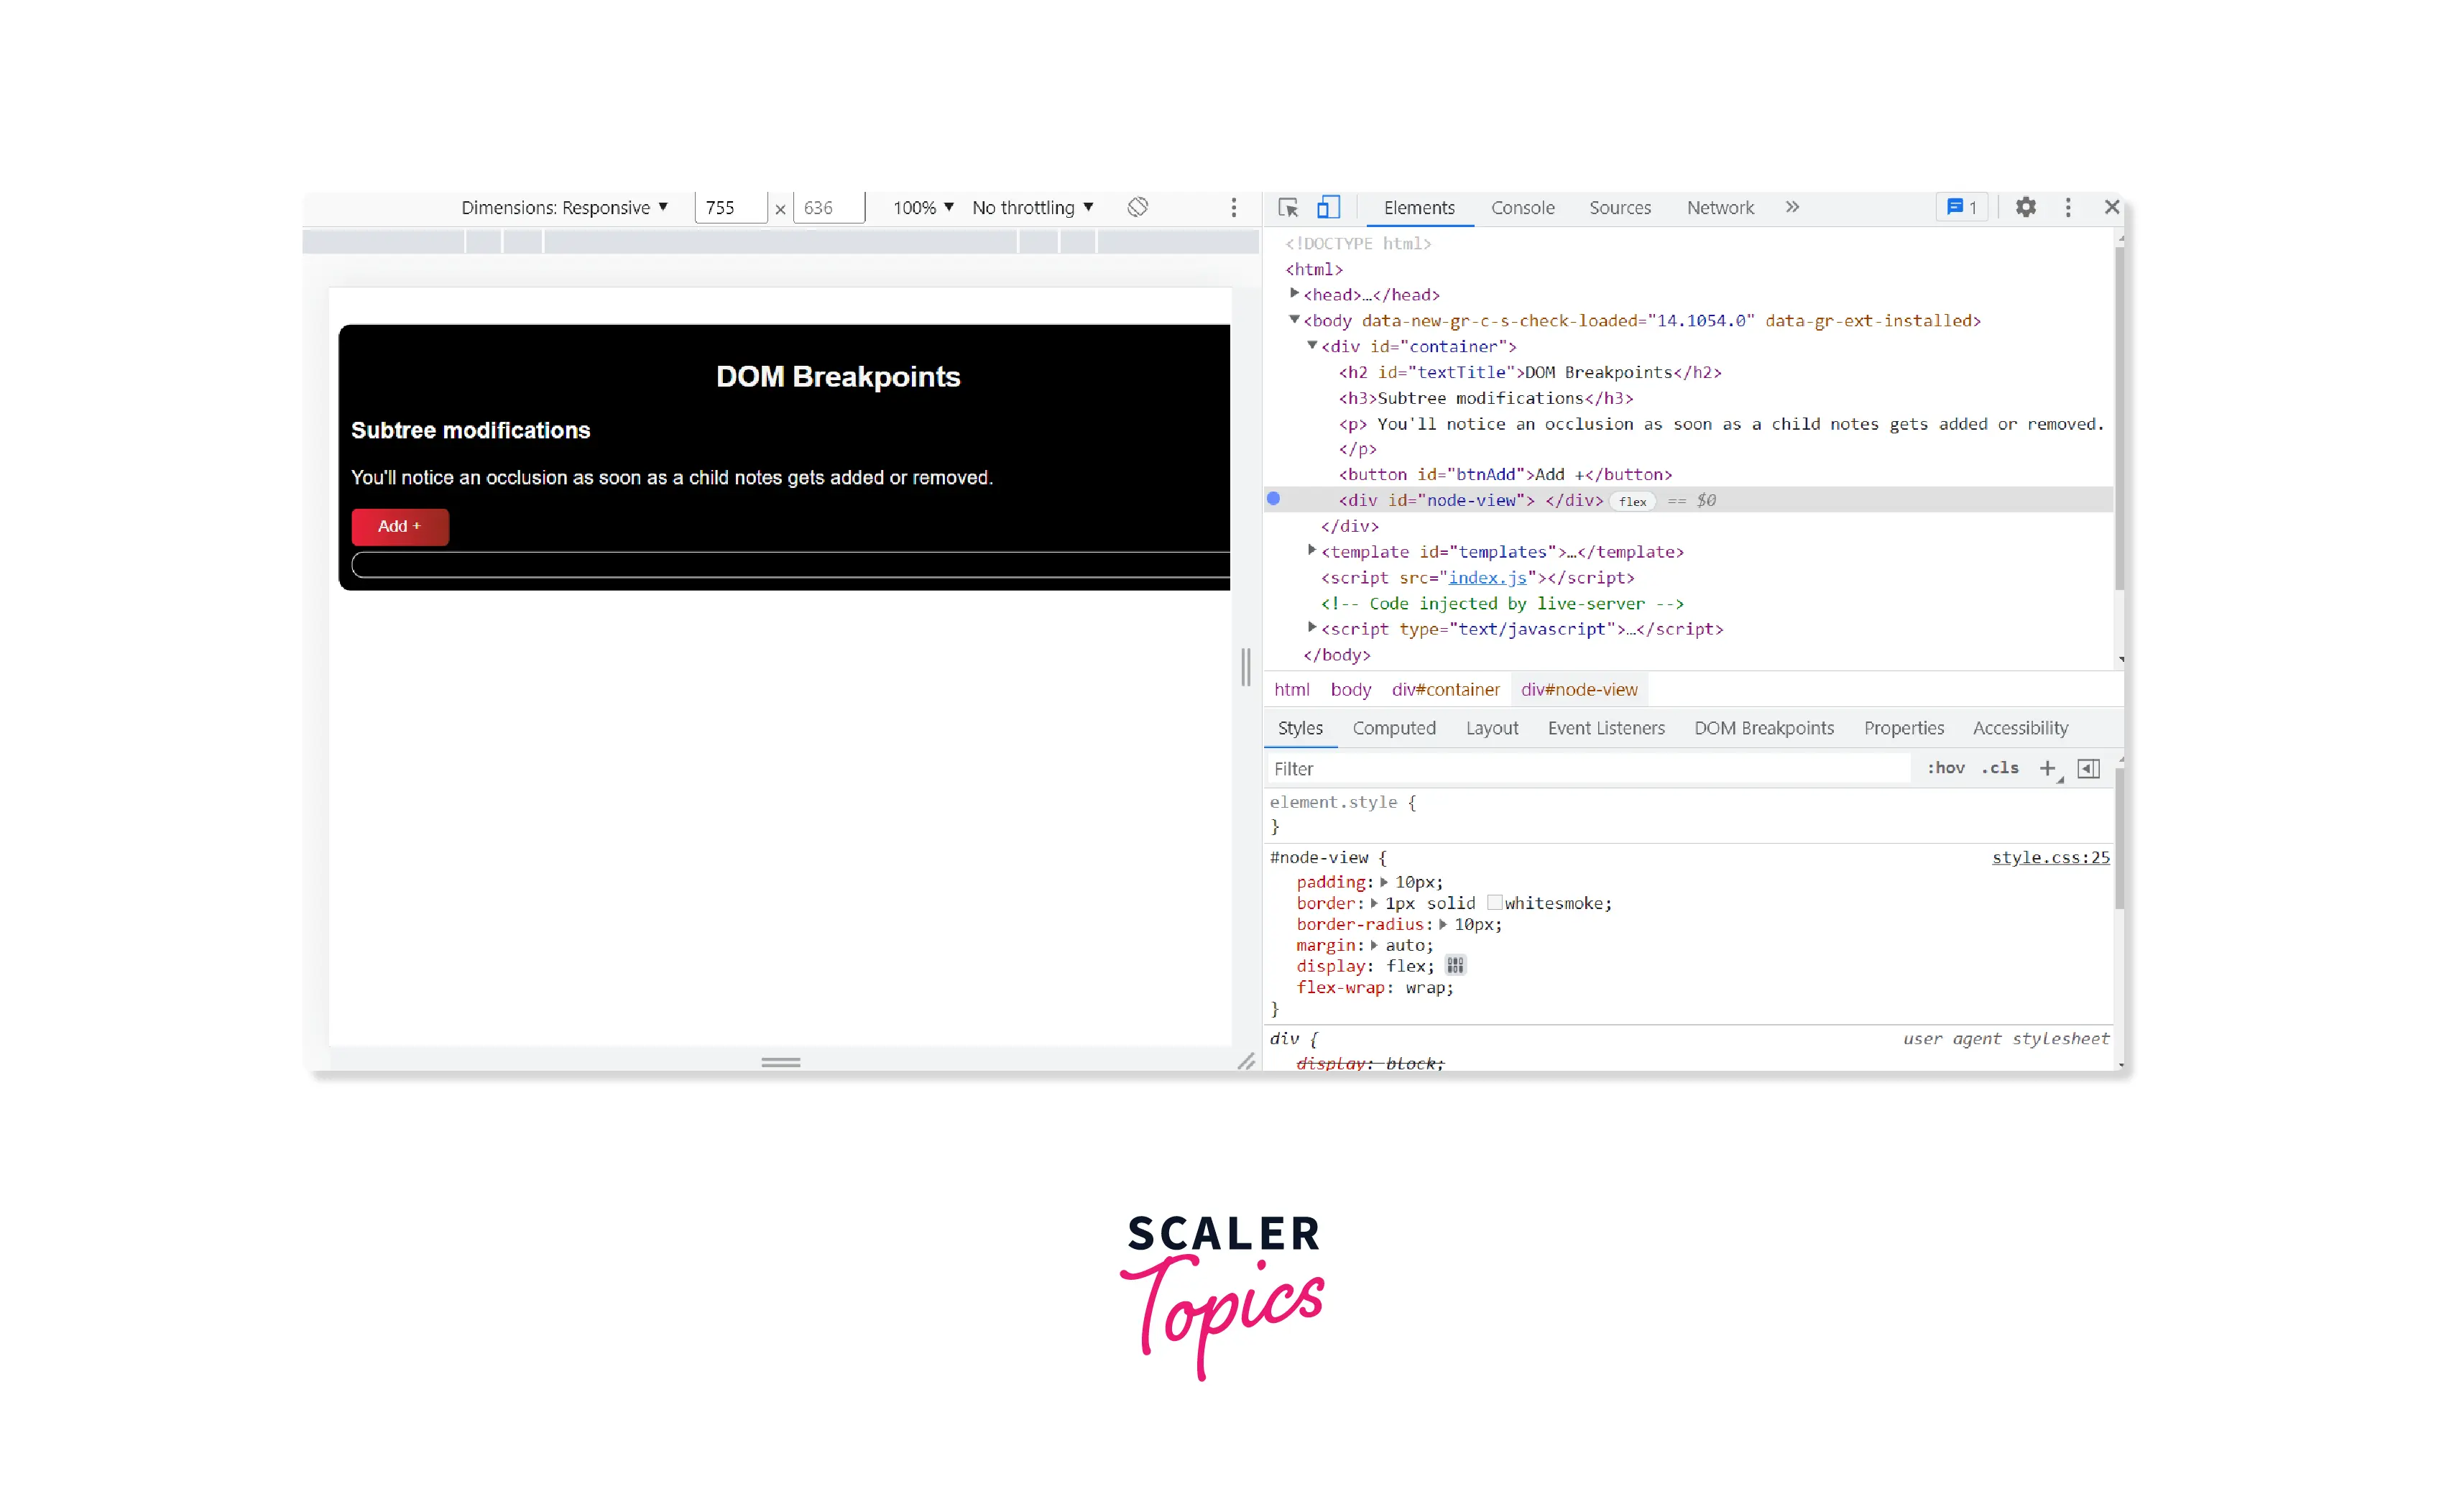
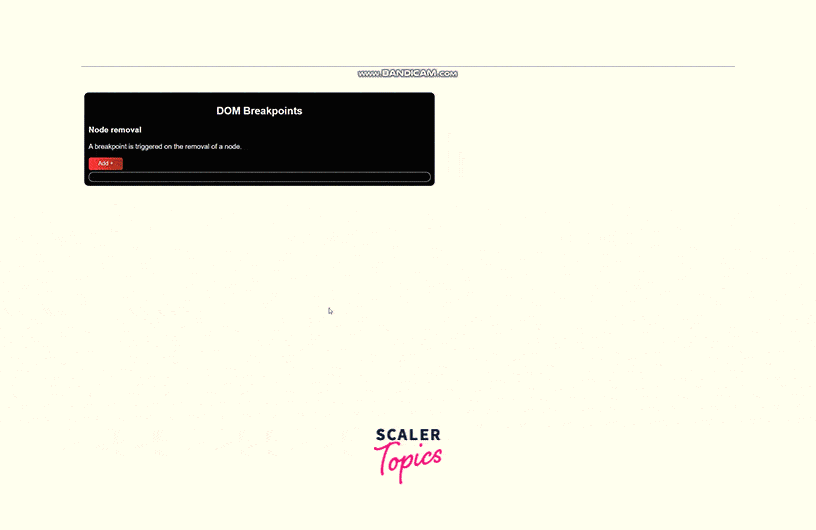
Add Breakpoints on DOM Change
To inspect elements in Chrome more precisely, it is sometimes required to look at the transition of an element from one state to another. The DOM breakpoints let you examine the changes in the state of the elements. Putting a breakpoint lets you peregrinate to the cause (code in this case) of the change when an event (like clicking a button, or removing a node) occurs.
To Add a Breakpoint:
- Right-click on an element and choose to inspect the element, or use the keyboard shortcut
- Right-click on html of the element from the dev tools and choose the break option. You will get three options at the time of writing this article that you can choose from:
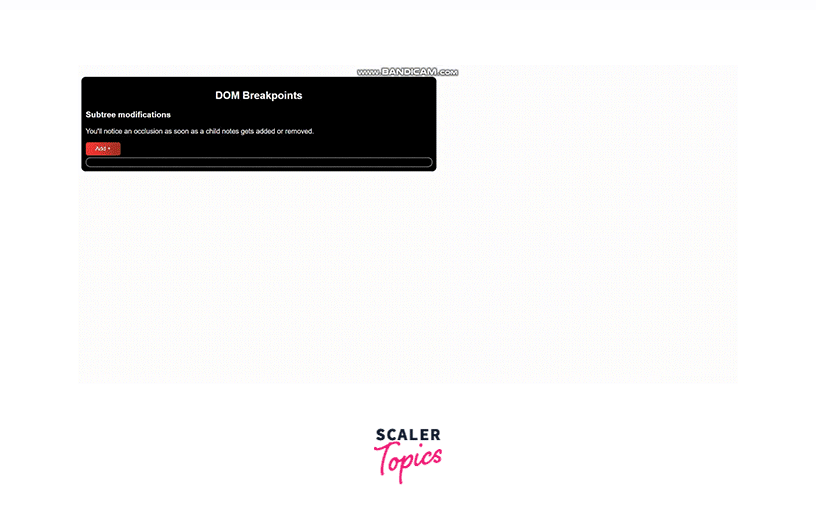
- Subtree modifications: Responds when a child of a currently selected HTML element (henceforth referred to as node) gets added/removed. Let us take an example to show how a breakpoint is triggered for subtree modifications.
HTML:
CSS:
JavaScript:
 As can be seen in the image, the element marked with a breakpoint is highlighted with a solid blue circle.
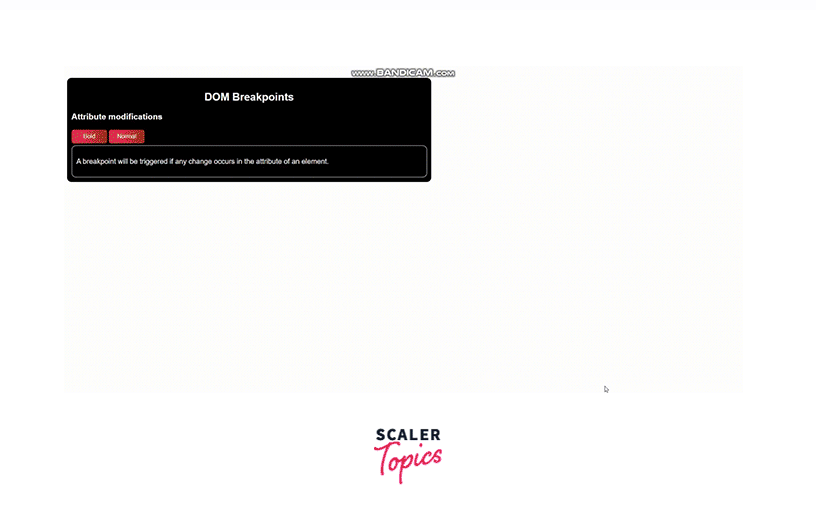
- Attribute Modifications: Any modifications in the attribute of an element can be identified with the help of Attribute modifications. An attribute can be anything like id, name, class and the style of the text. Let us look at a different code to see what the above statement means. We'll figure out the changes by making the text bold and then normal.
HTML:
CSS:
JavaScript:
-
Node Removal: A breakpoint is triggered when a node gets removed. To show how this works, let us modify the code used for Subtree modifications.
HTML:
There would be no change in CSS here.
JavaScript:
Also, in the JavaScript code, we have implemented the feature of removing a node just by clicking on it.
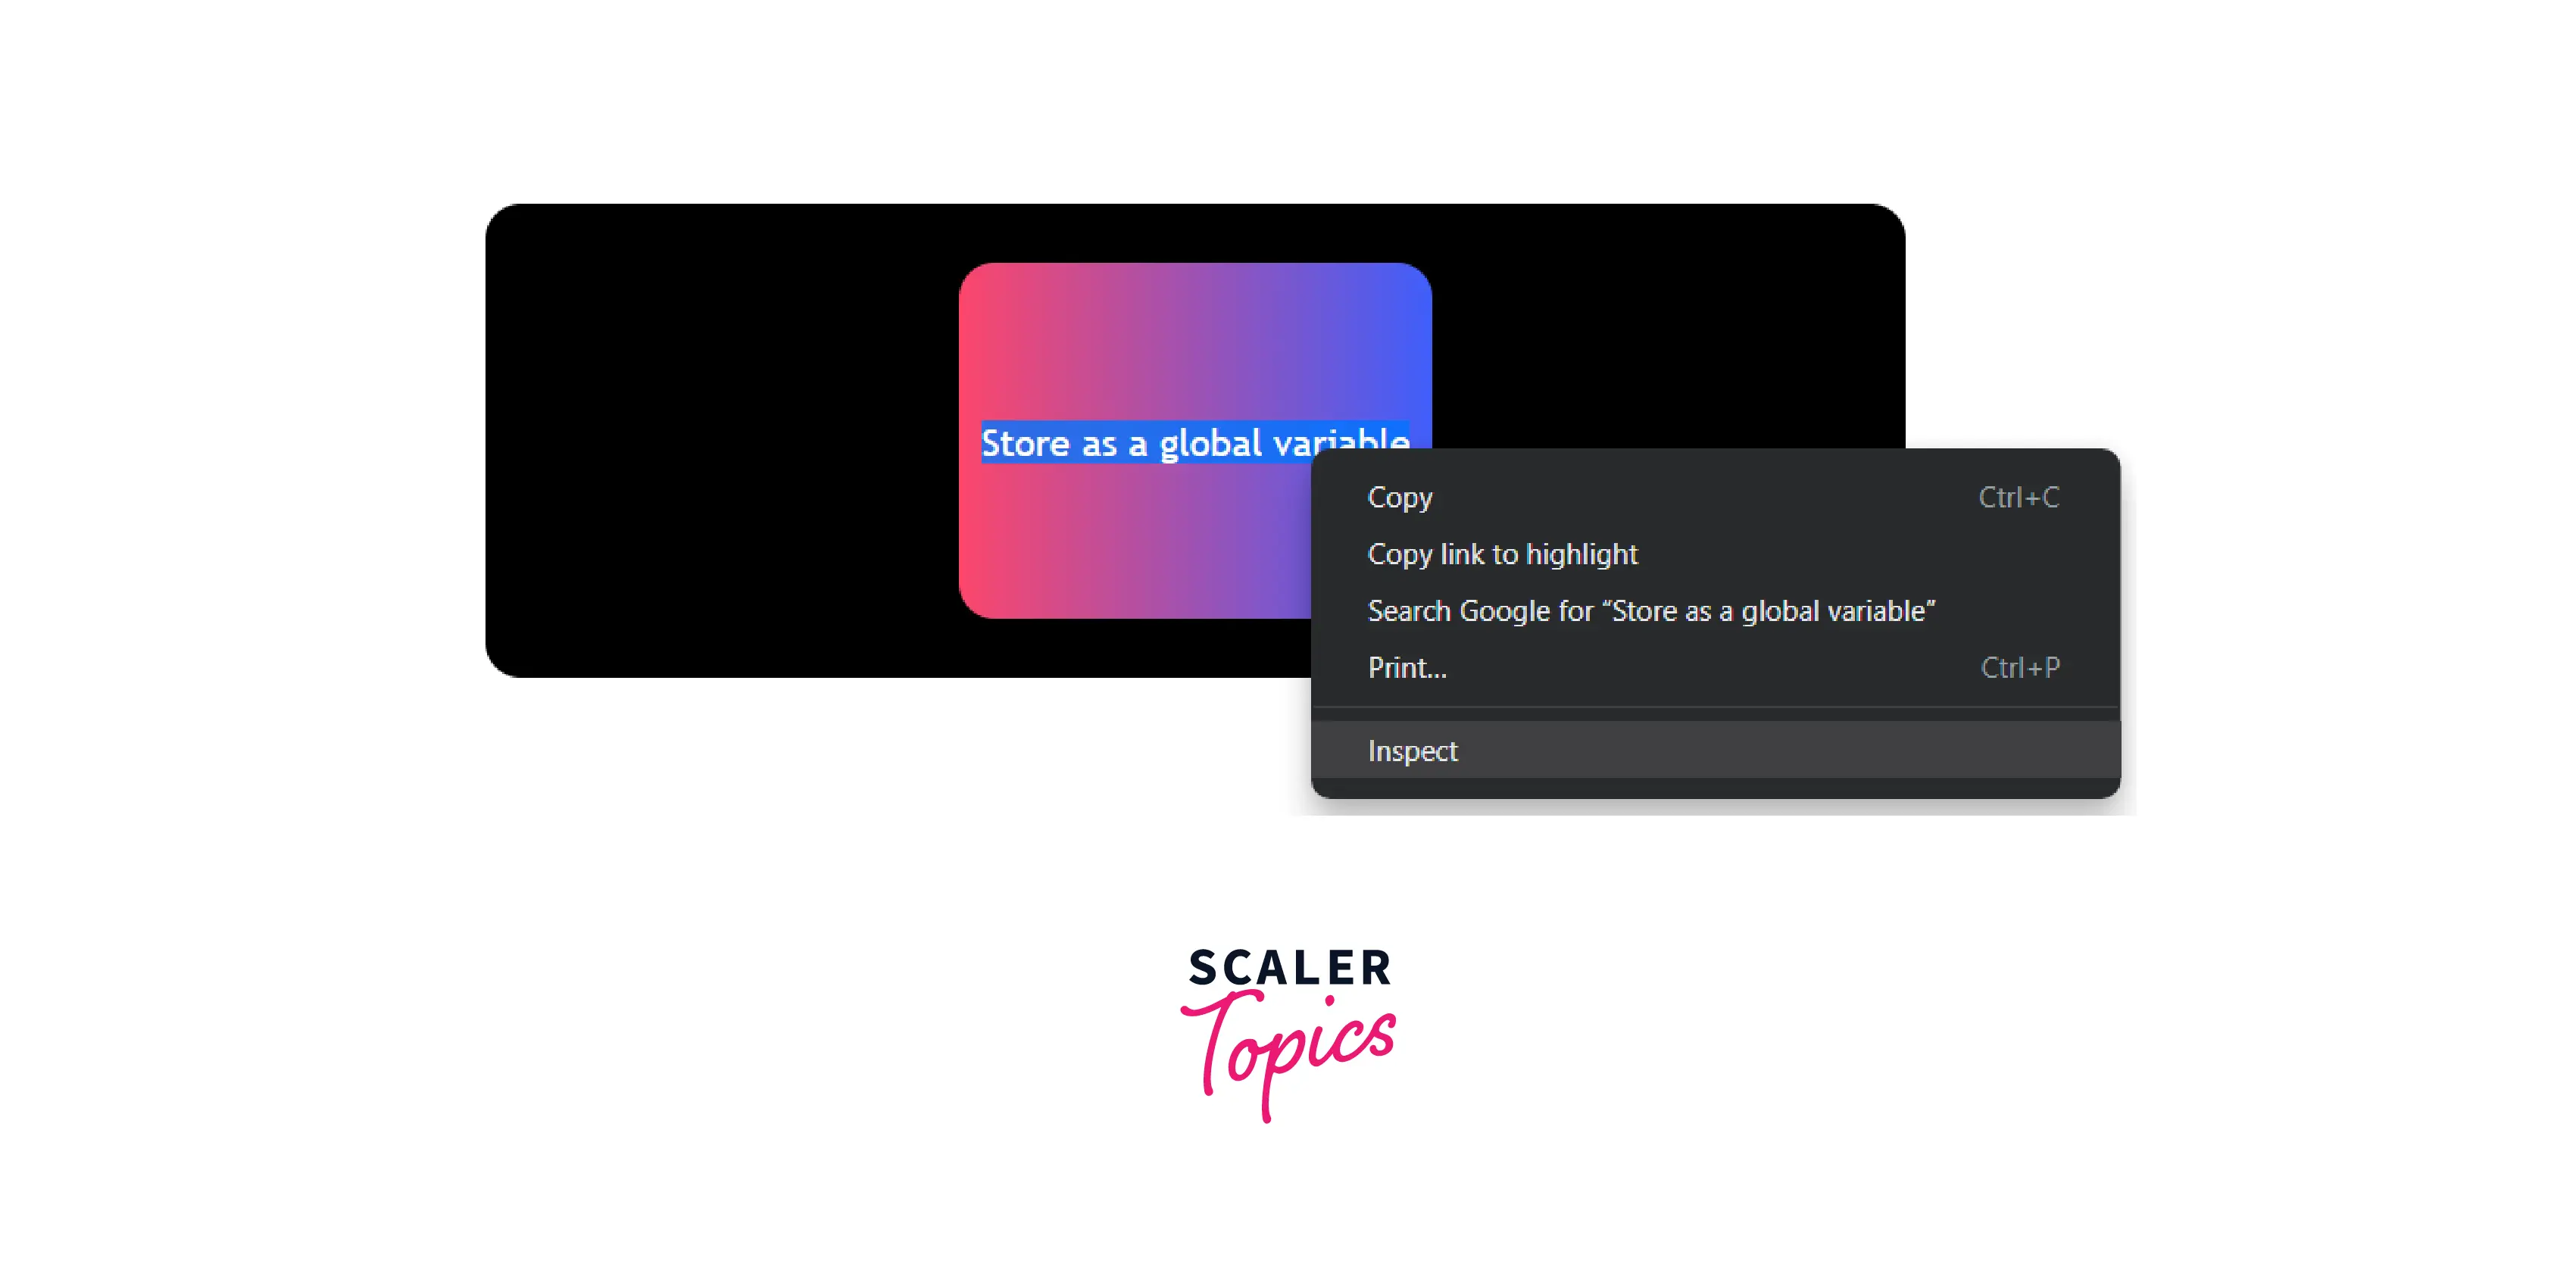
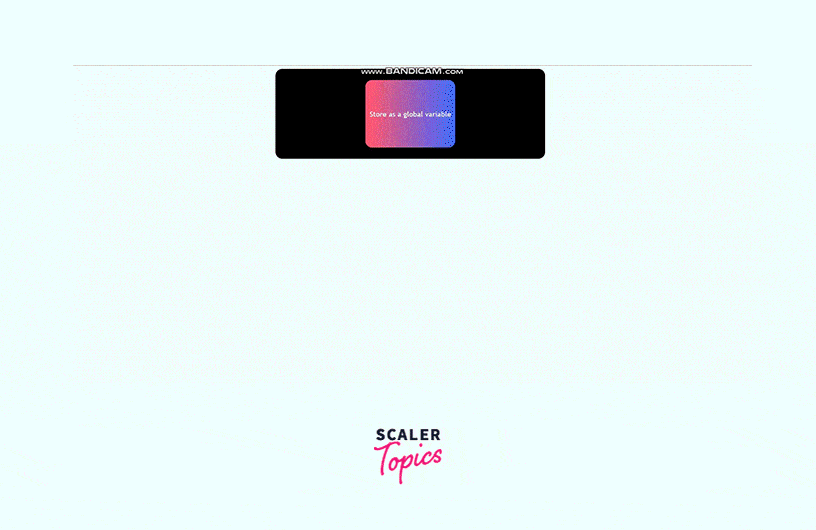
Store as a Global Variable
What if you need to access an HTML element and that too without providing a reference to it? Although we do know that the use of DOM methods such as document.querySelector and document.getElementById can help you get the reference. However, for debugging purposes, Store as a global variable will be a great advantage.
Here's an example to see what happens with the help of a global variable. We'll be changing the text given in the image to "Hey there!".
Right-click on the text area and go to the DOM tree in the Elements panel and right-click will open up another menu. Scroll down to find the Store as a global variable option.
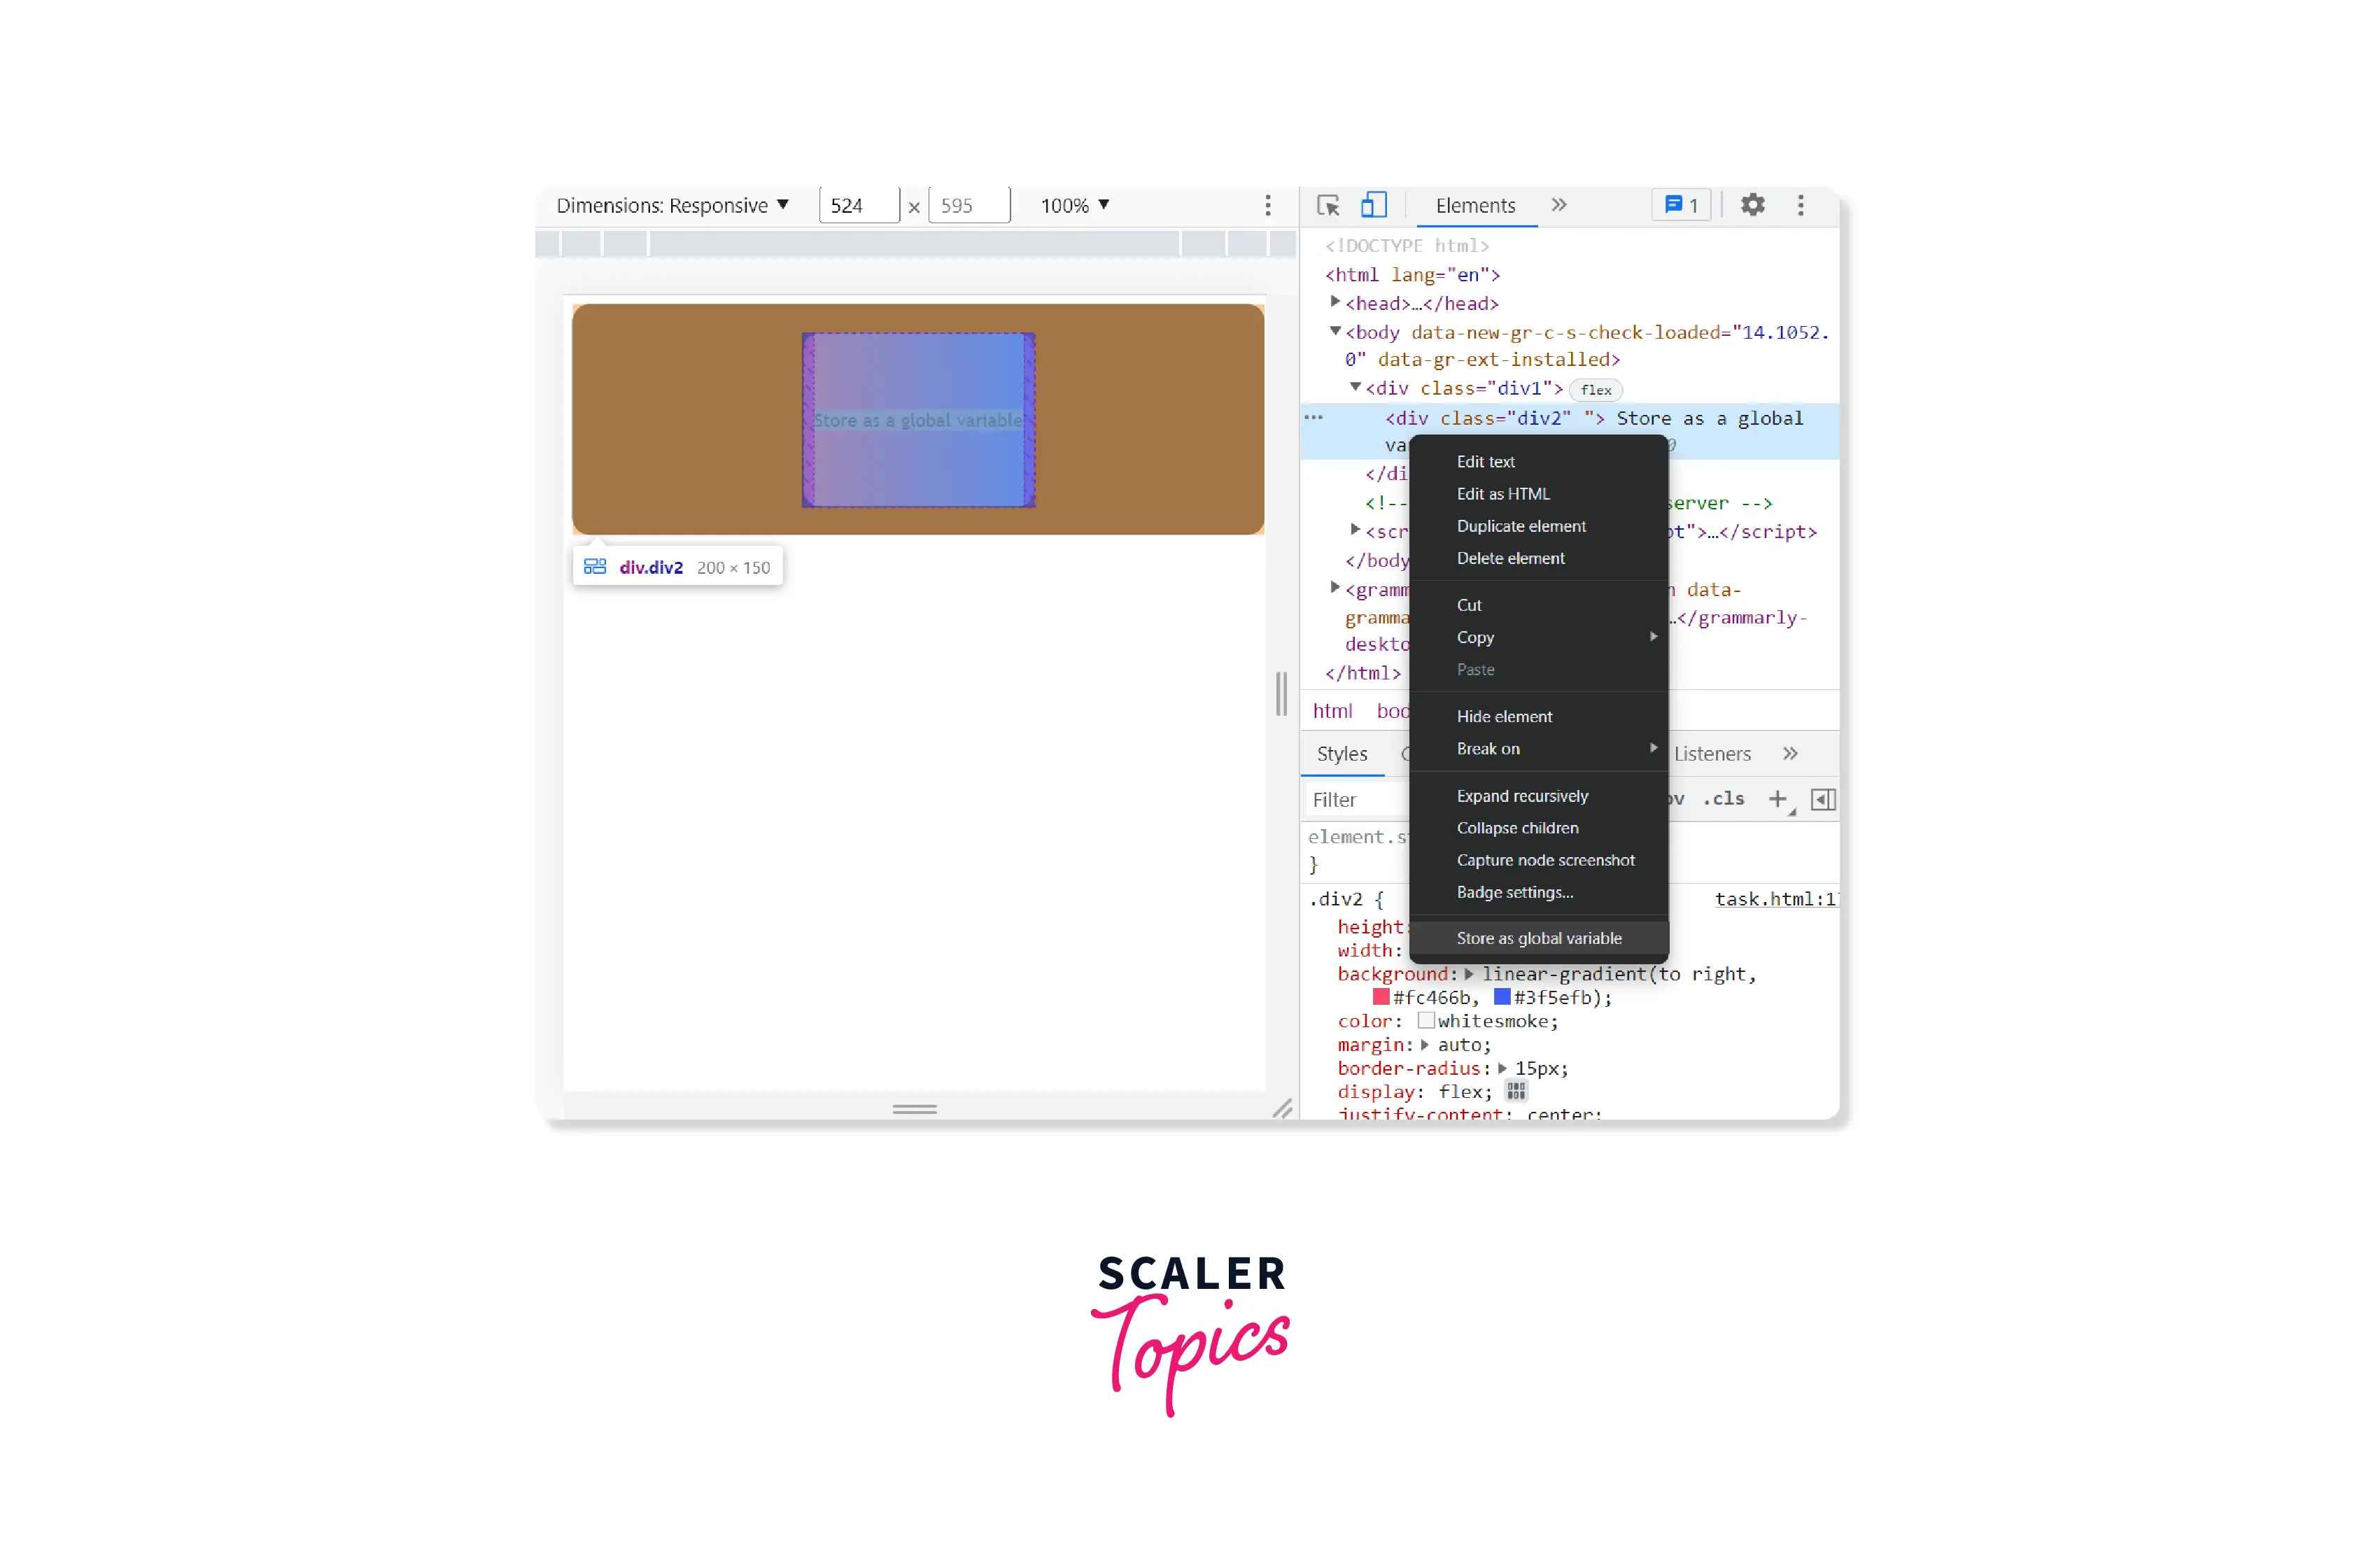
Click on it and move to the Console panel where the JavaScript variable will be created for the selected element. Such variables are often created by the names temp1, temp2, etc. Now, these variables can be used for manipulation as given below.
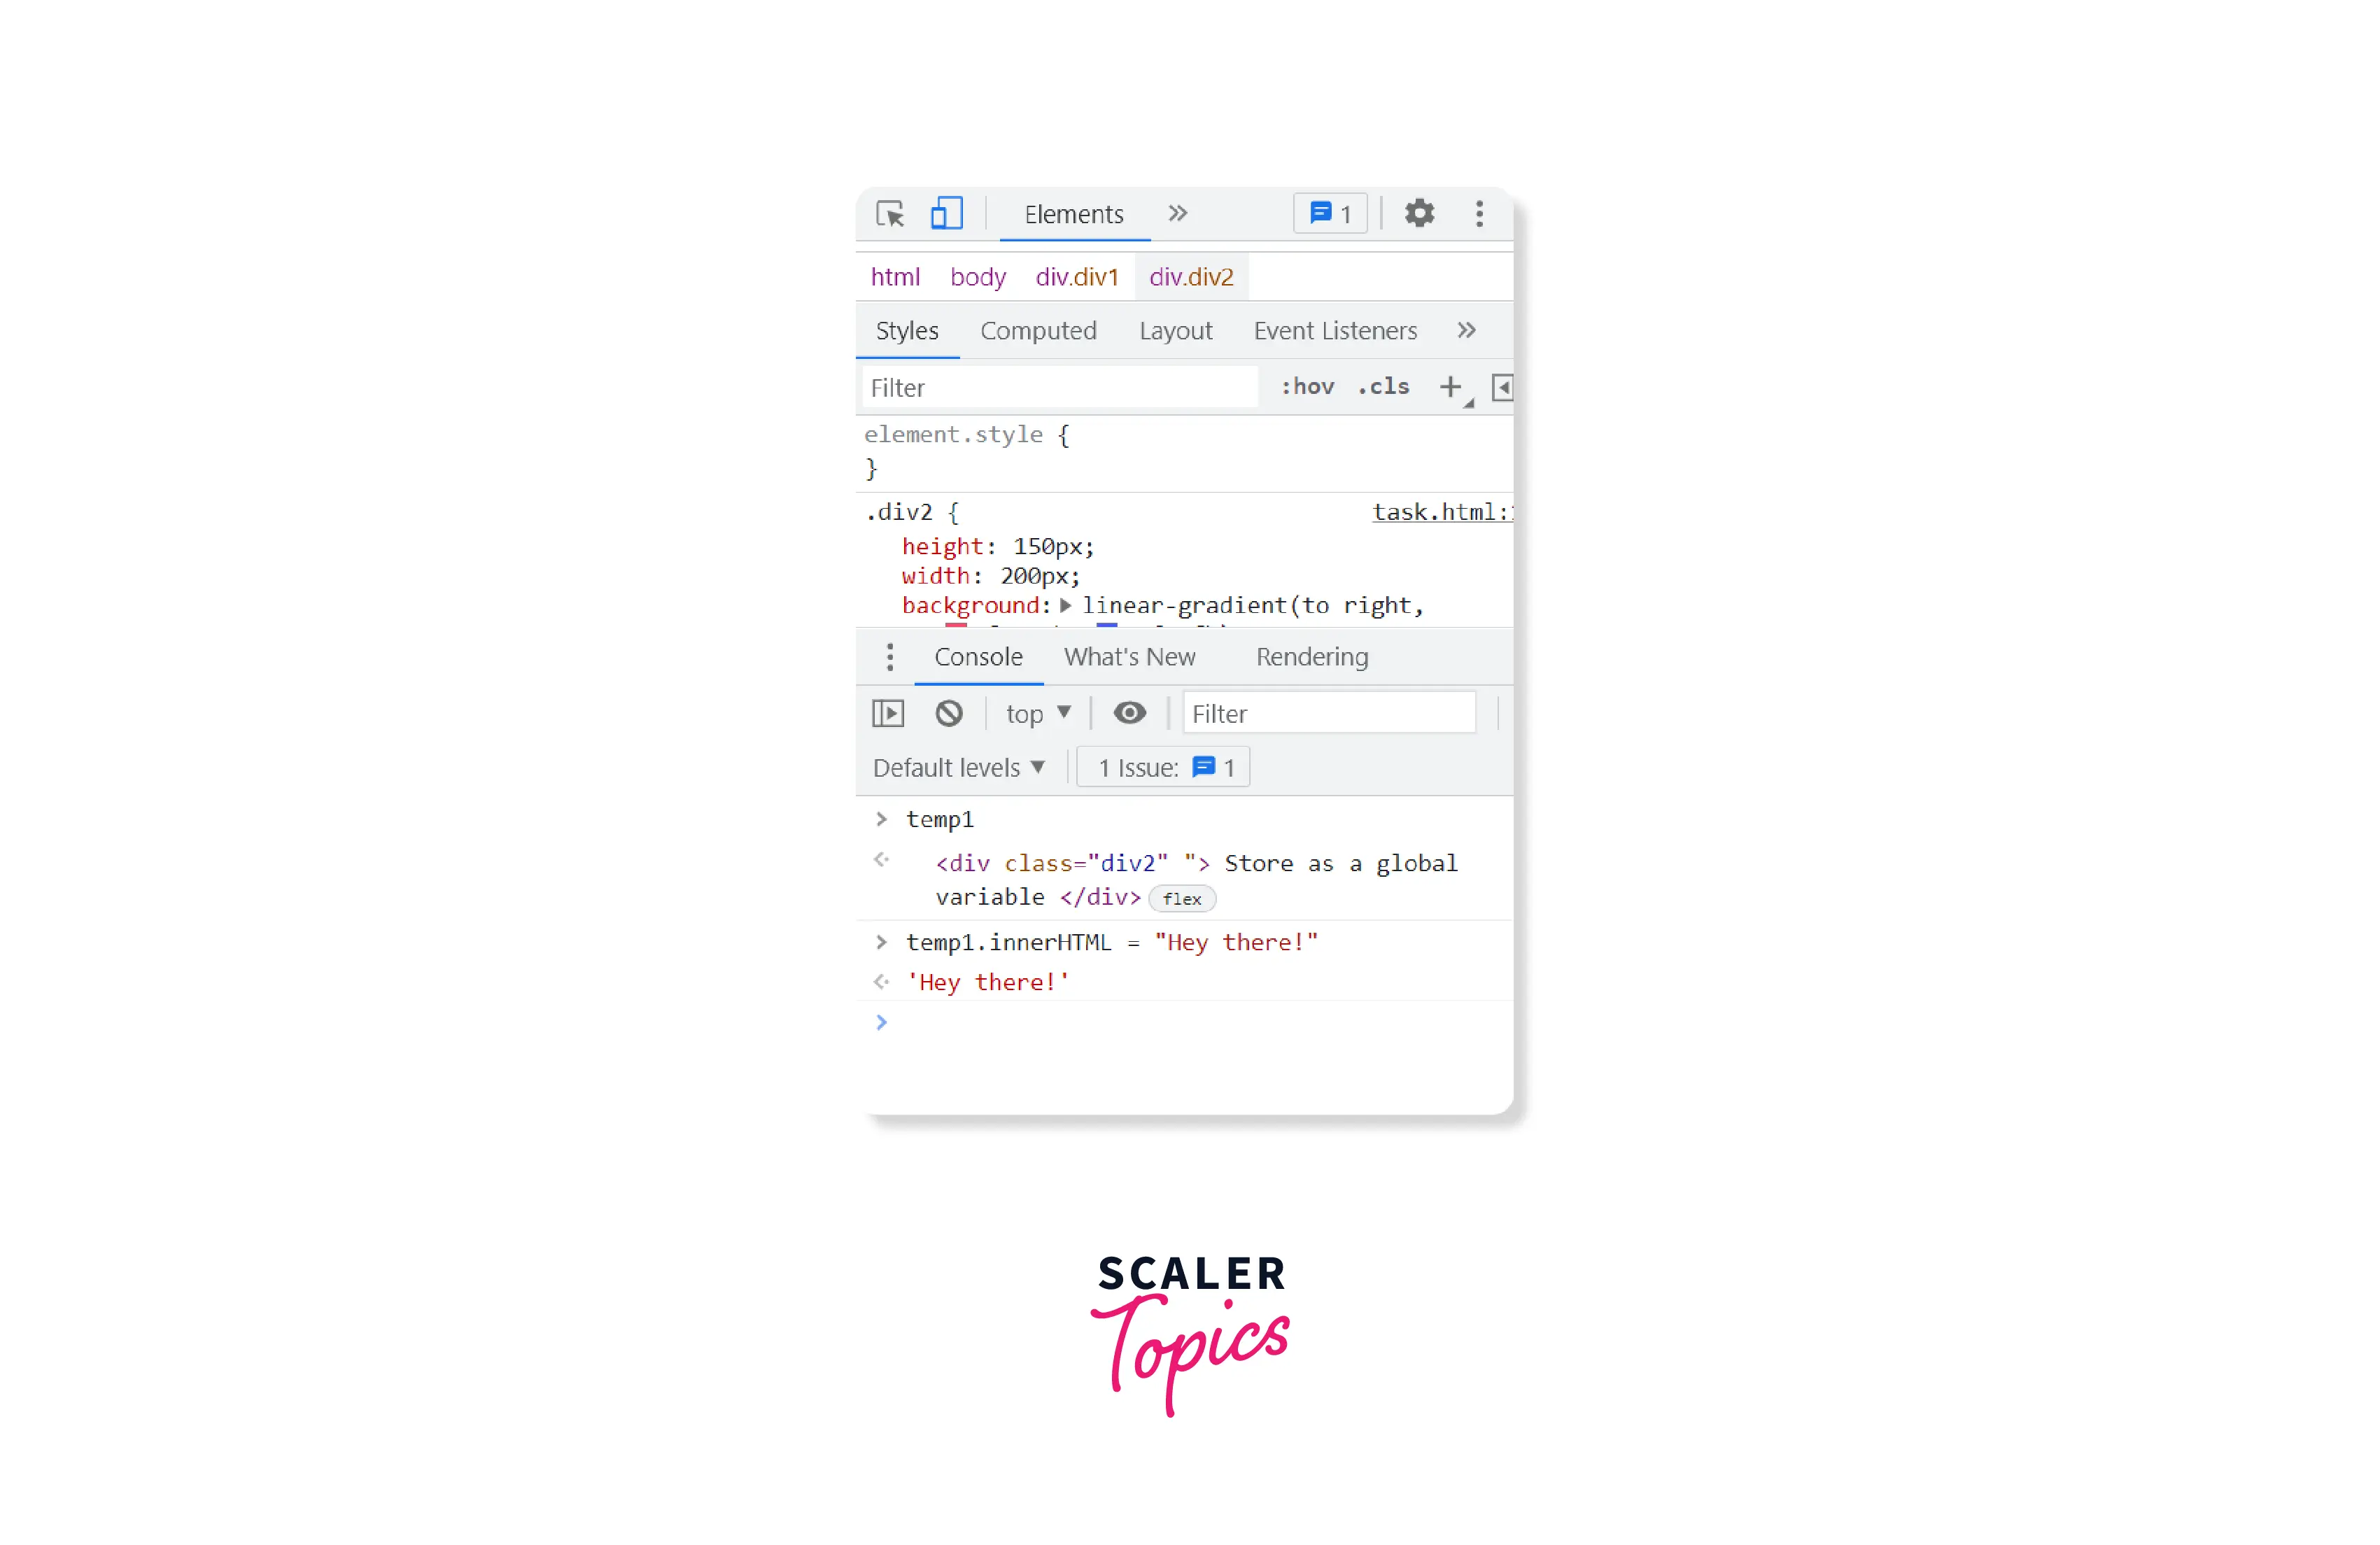
But you can also use $0 for the same purpose as it gives access to the element once you select from the Console panel.
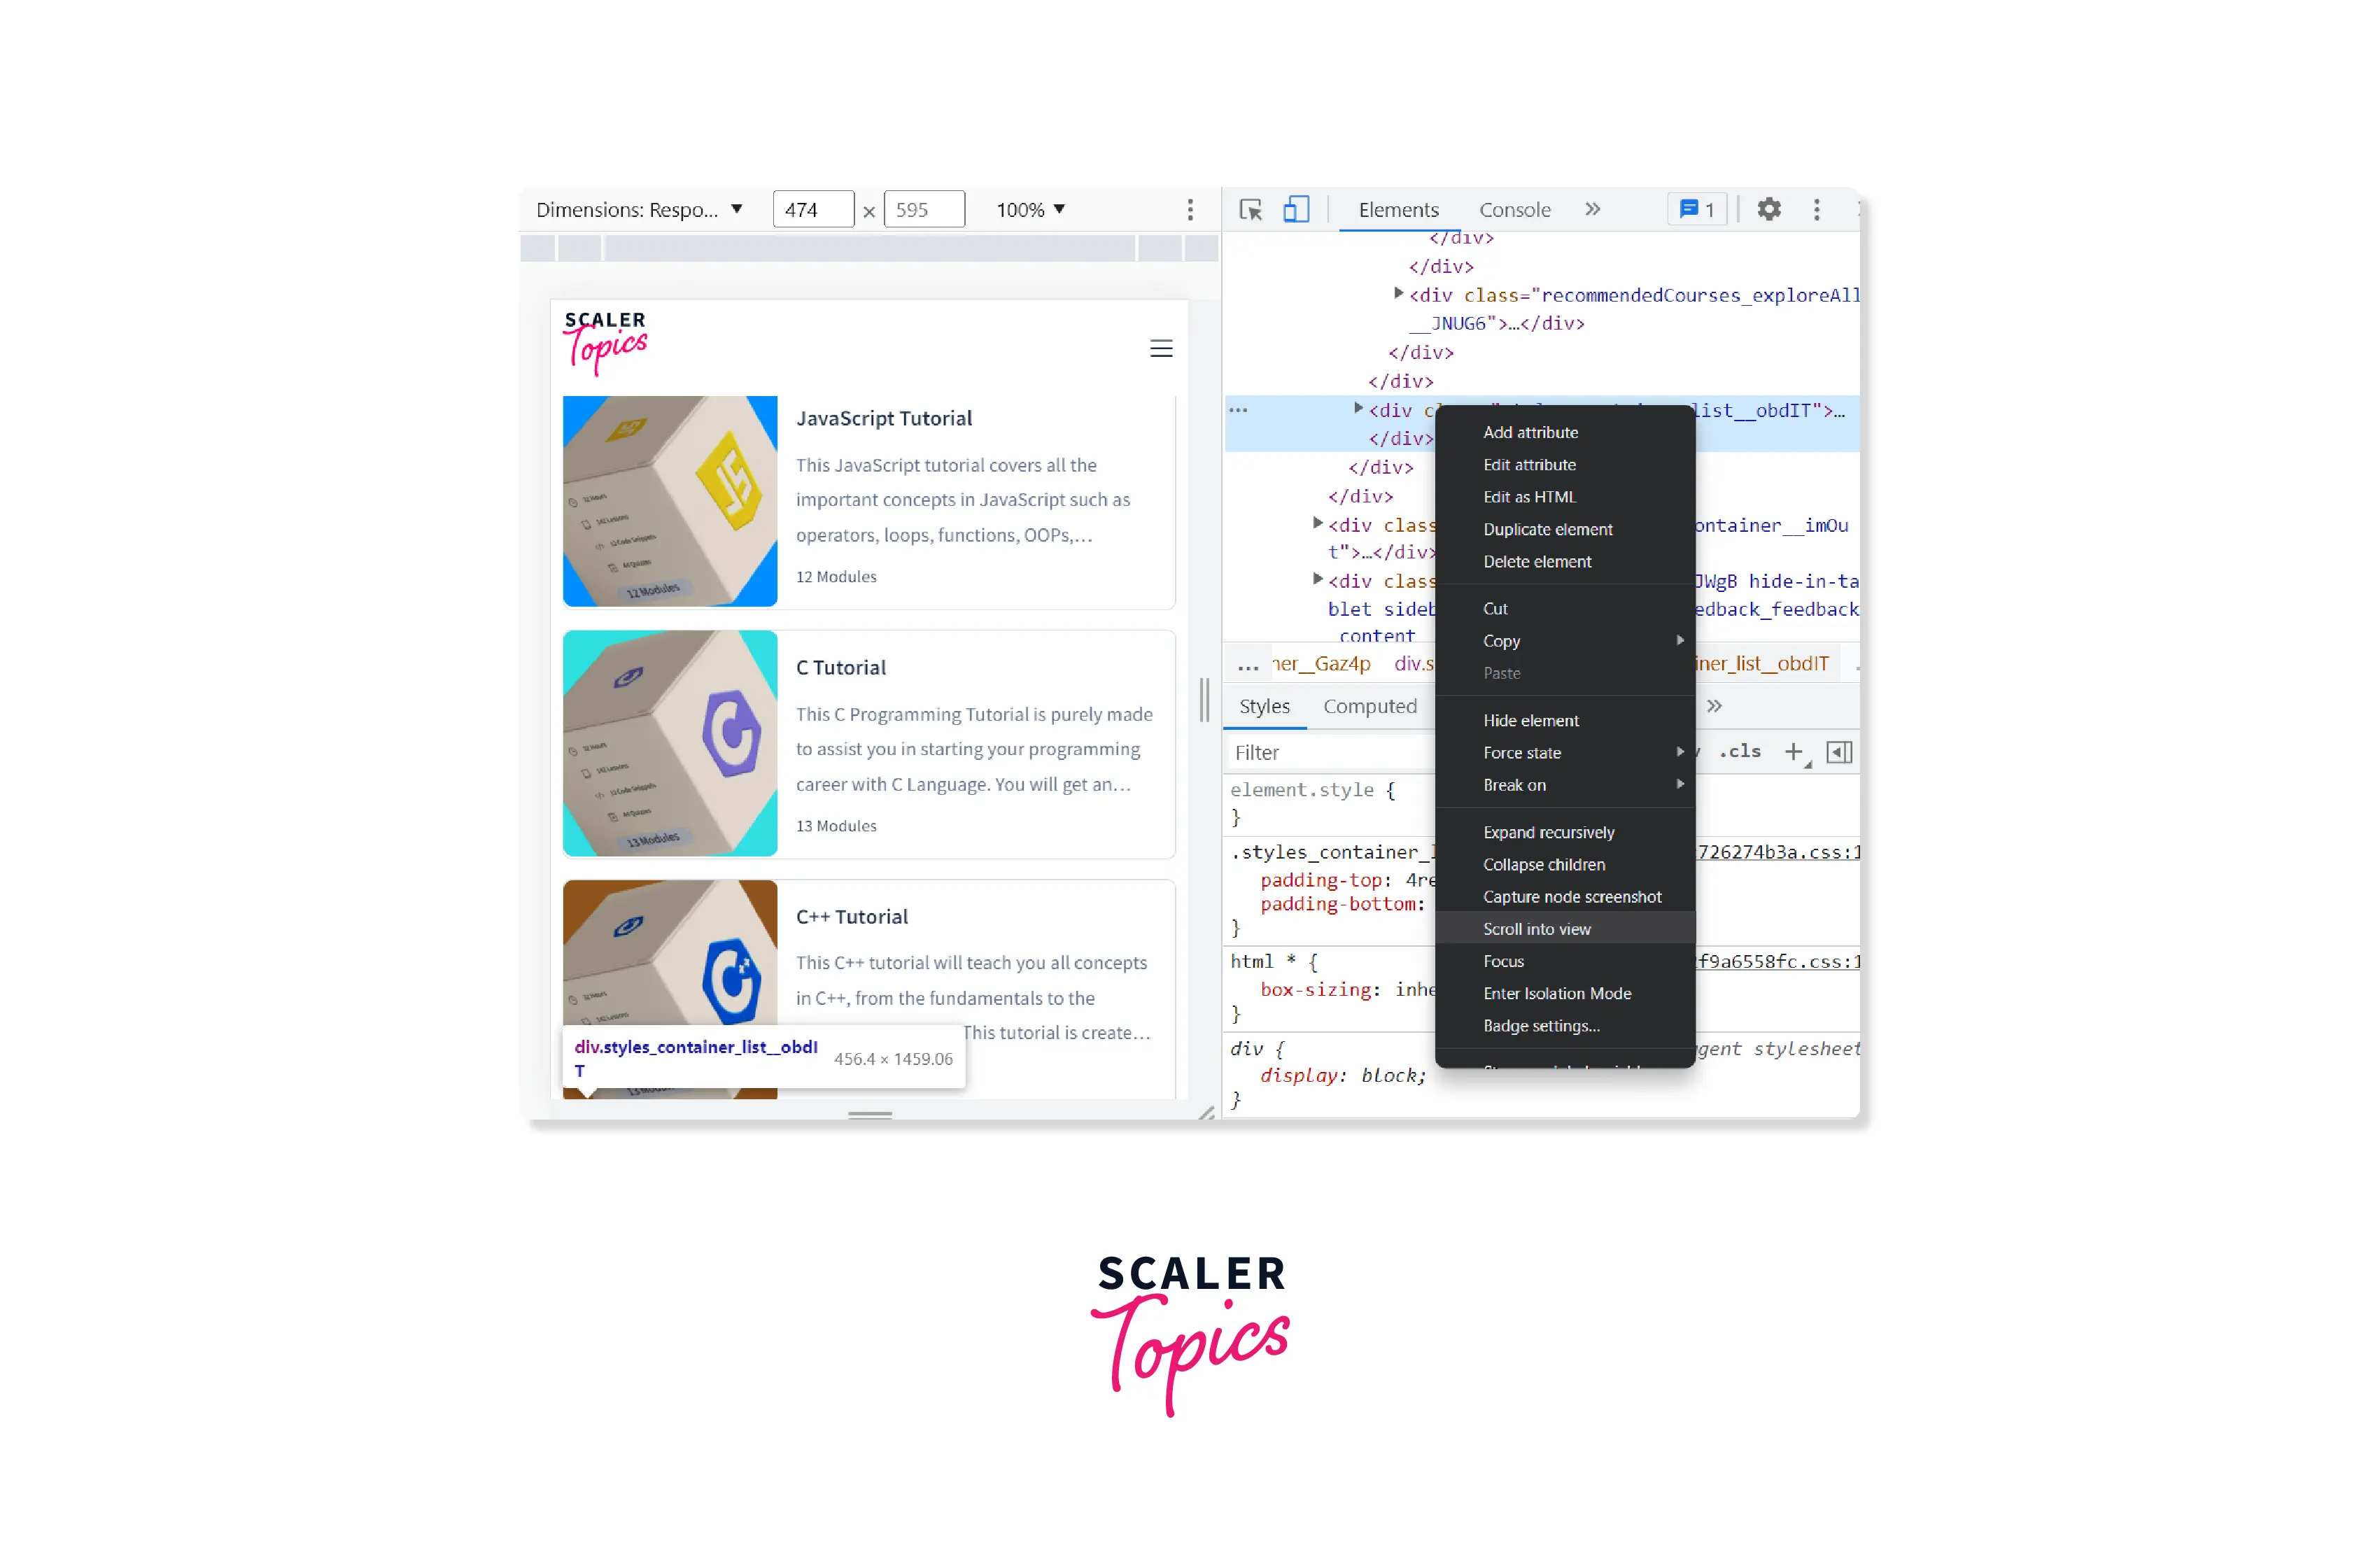
Scroll into View
It might be a need to inspect an element in Chrome which is out of the visible area on the screen but Scroll into view brings it on the screen without any need to scroll manually to find the particular element.
If the selected element in the Elements tab isn't visible in the viewport, Scroll into view helps to bring the element to the visible area.
Inspect CSS Grid
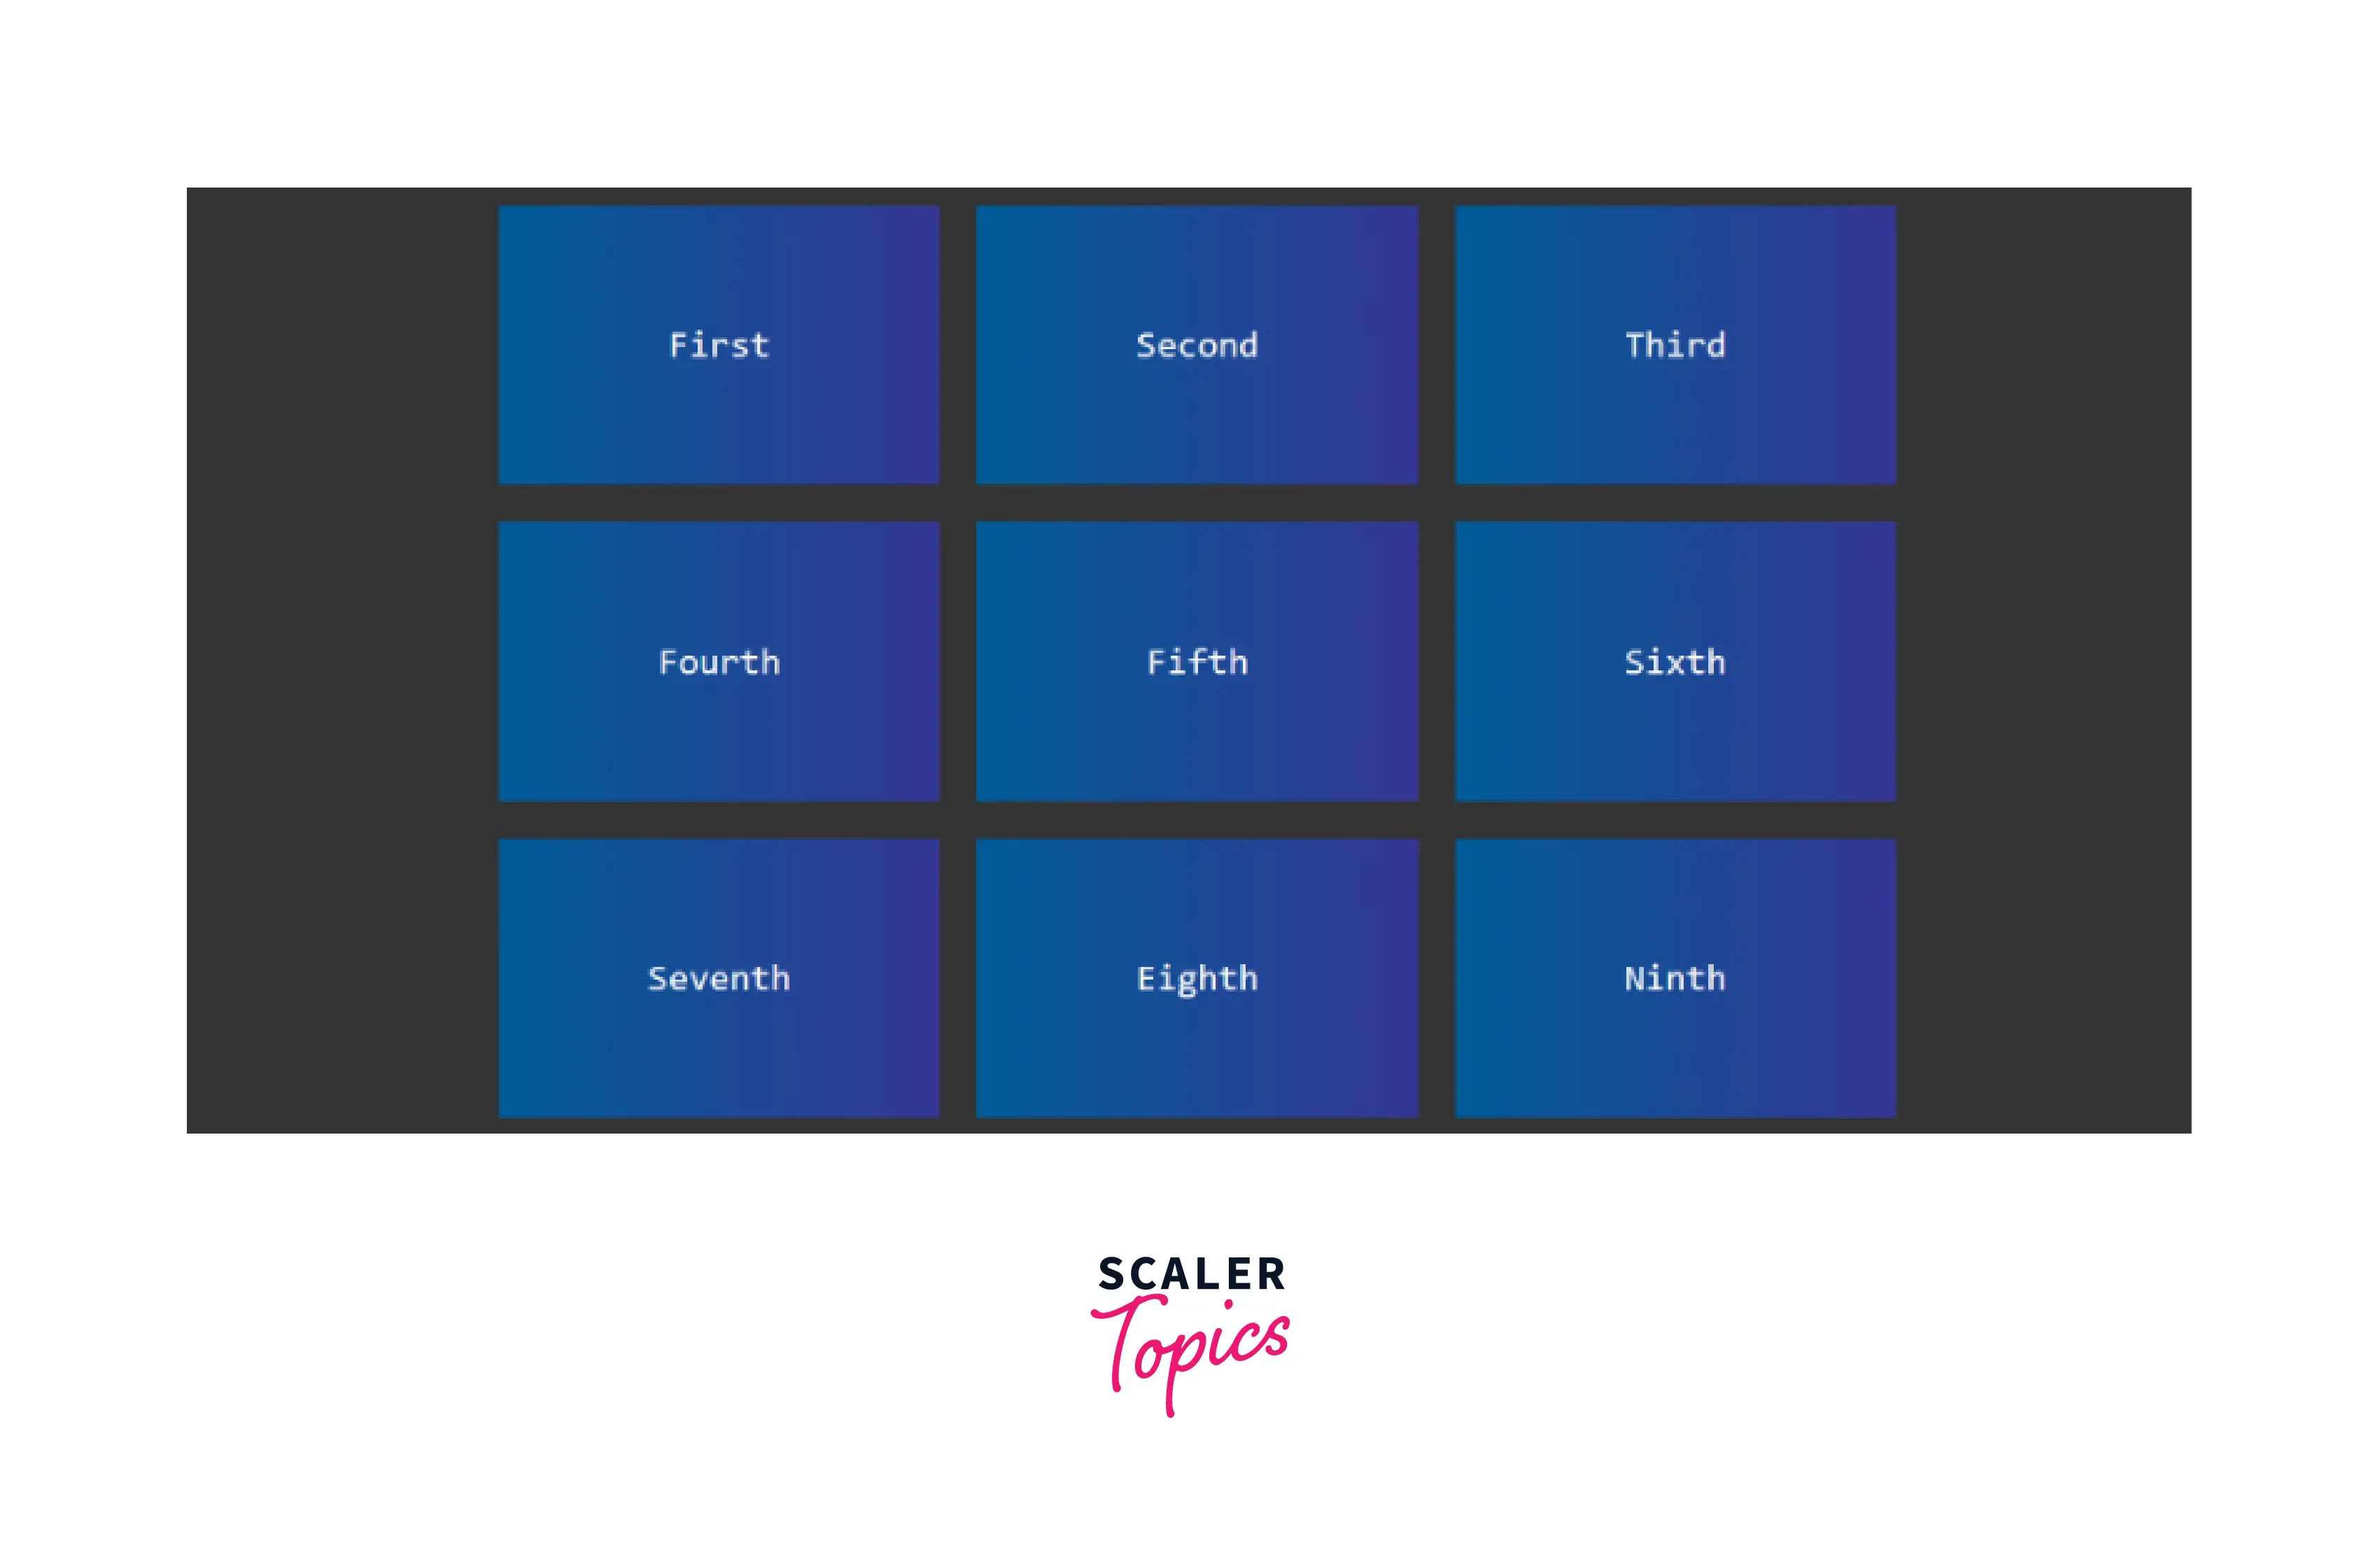
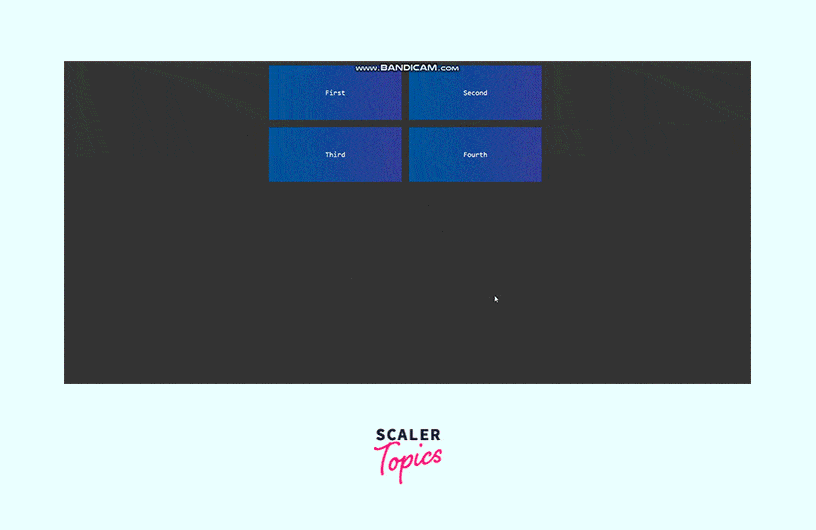
Let us consider an example of CSS grids. The HTML and CSS code for the same has been provided below.
HTML:
CSS:
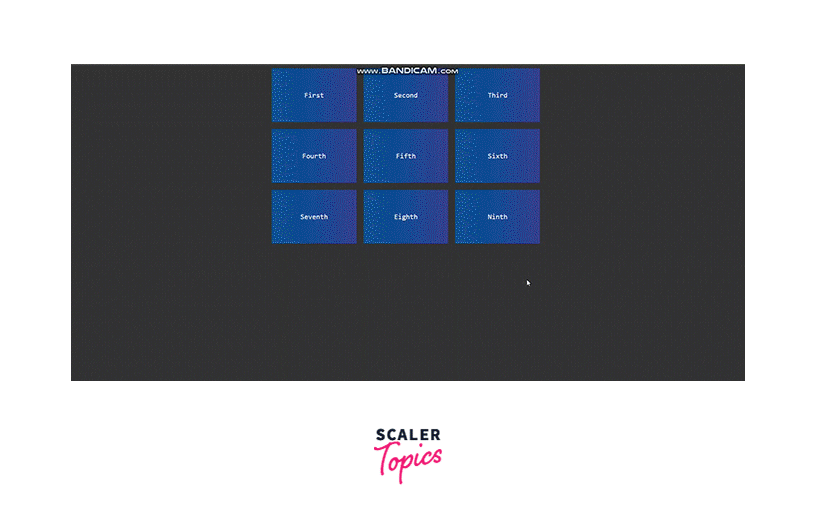
Open it in any browser and this is what it looks like:
There are features galore in the Chrome Dev Tools to explore the behaviour of CSS grids. Moreover, debugging issues in CSS grids can also be done with ease.
- A right-click will make the Inspect option visible in the menu. Click on Inspect and look for the Elements panel in the first place.
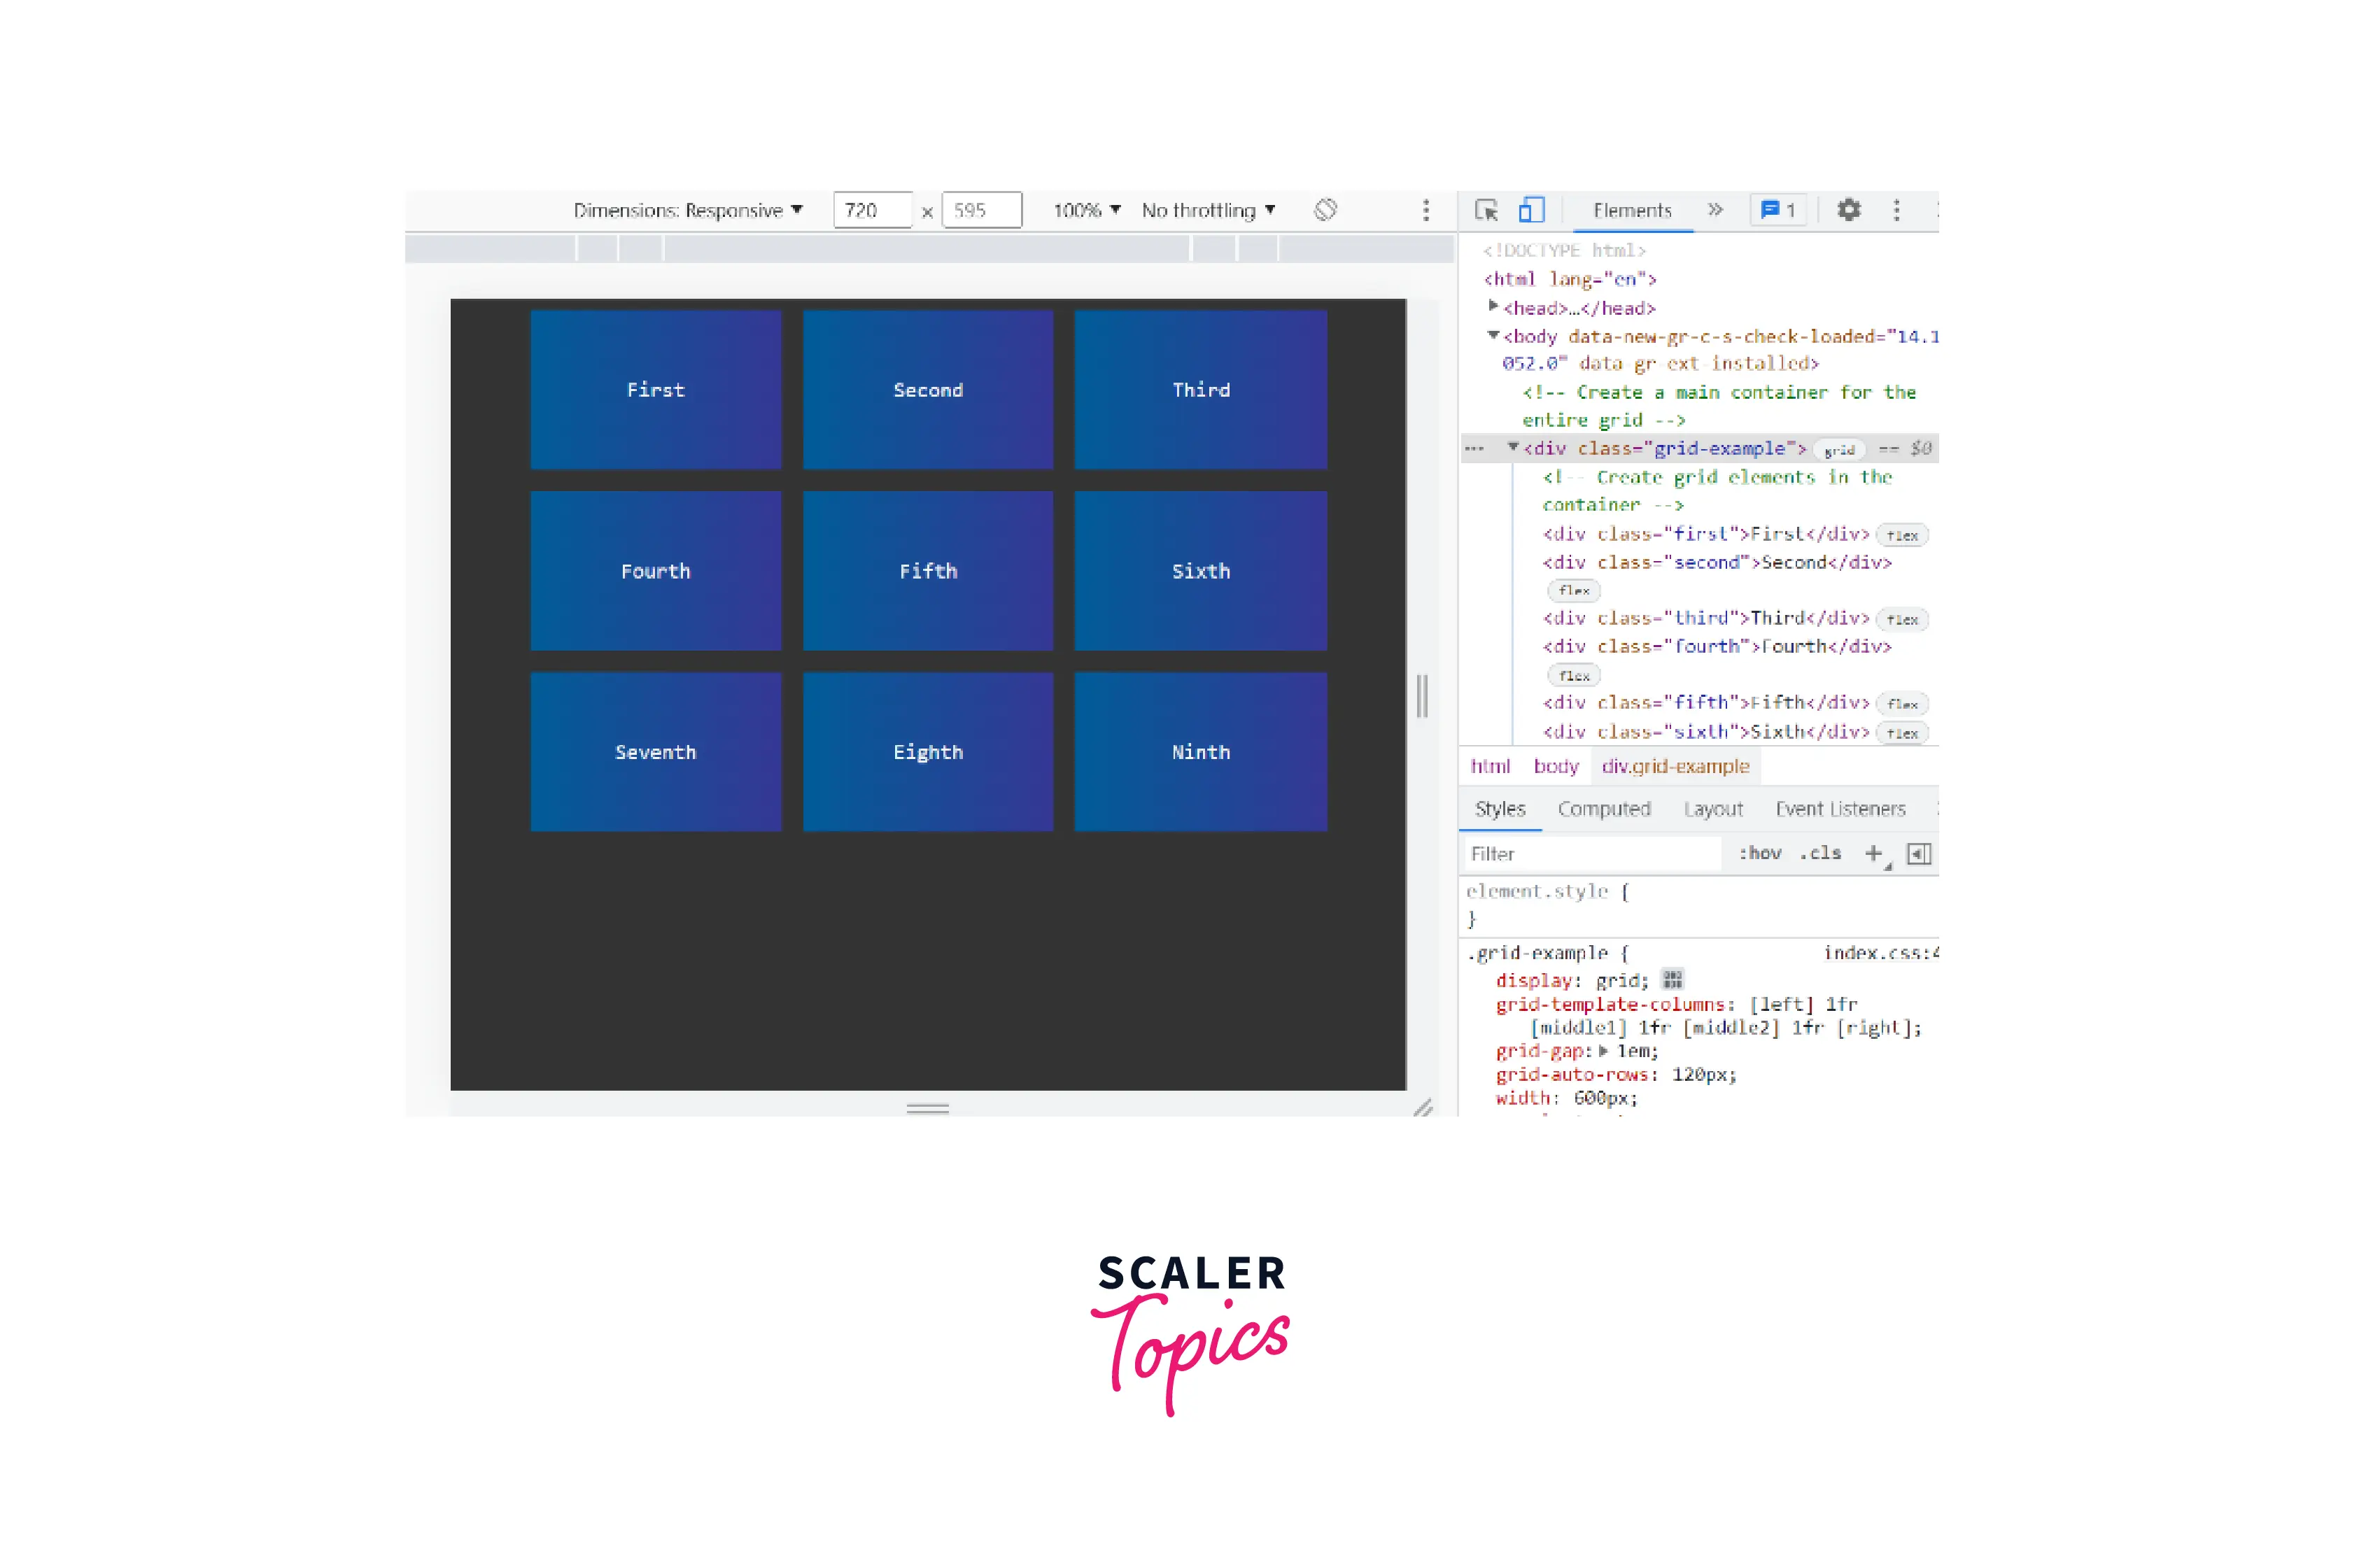
Let us begin with the Elements panel where you can find the DOM tree. A DOM tree is the hierarchy of different elements created by the browser.
Discover CSS Grids
In the above image, we have considered an example of grids. In the Elements panel, any HTML element that exhibits the behaviour of grids will have a grid badge assigned to it. Notice that this is due to the element having either display: grid or display: inline-grid.
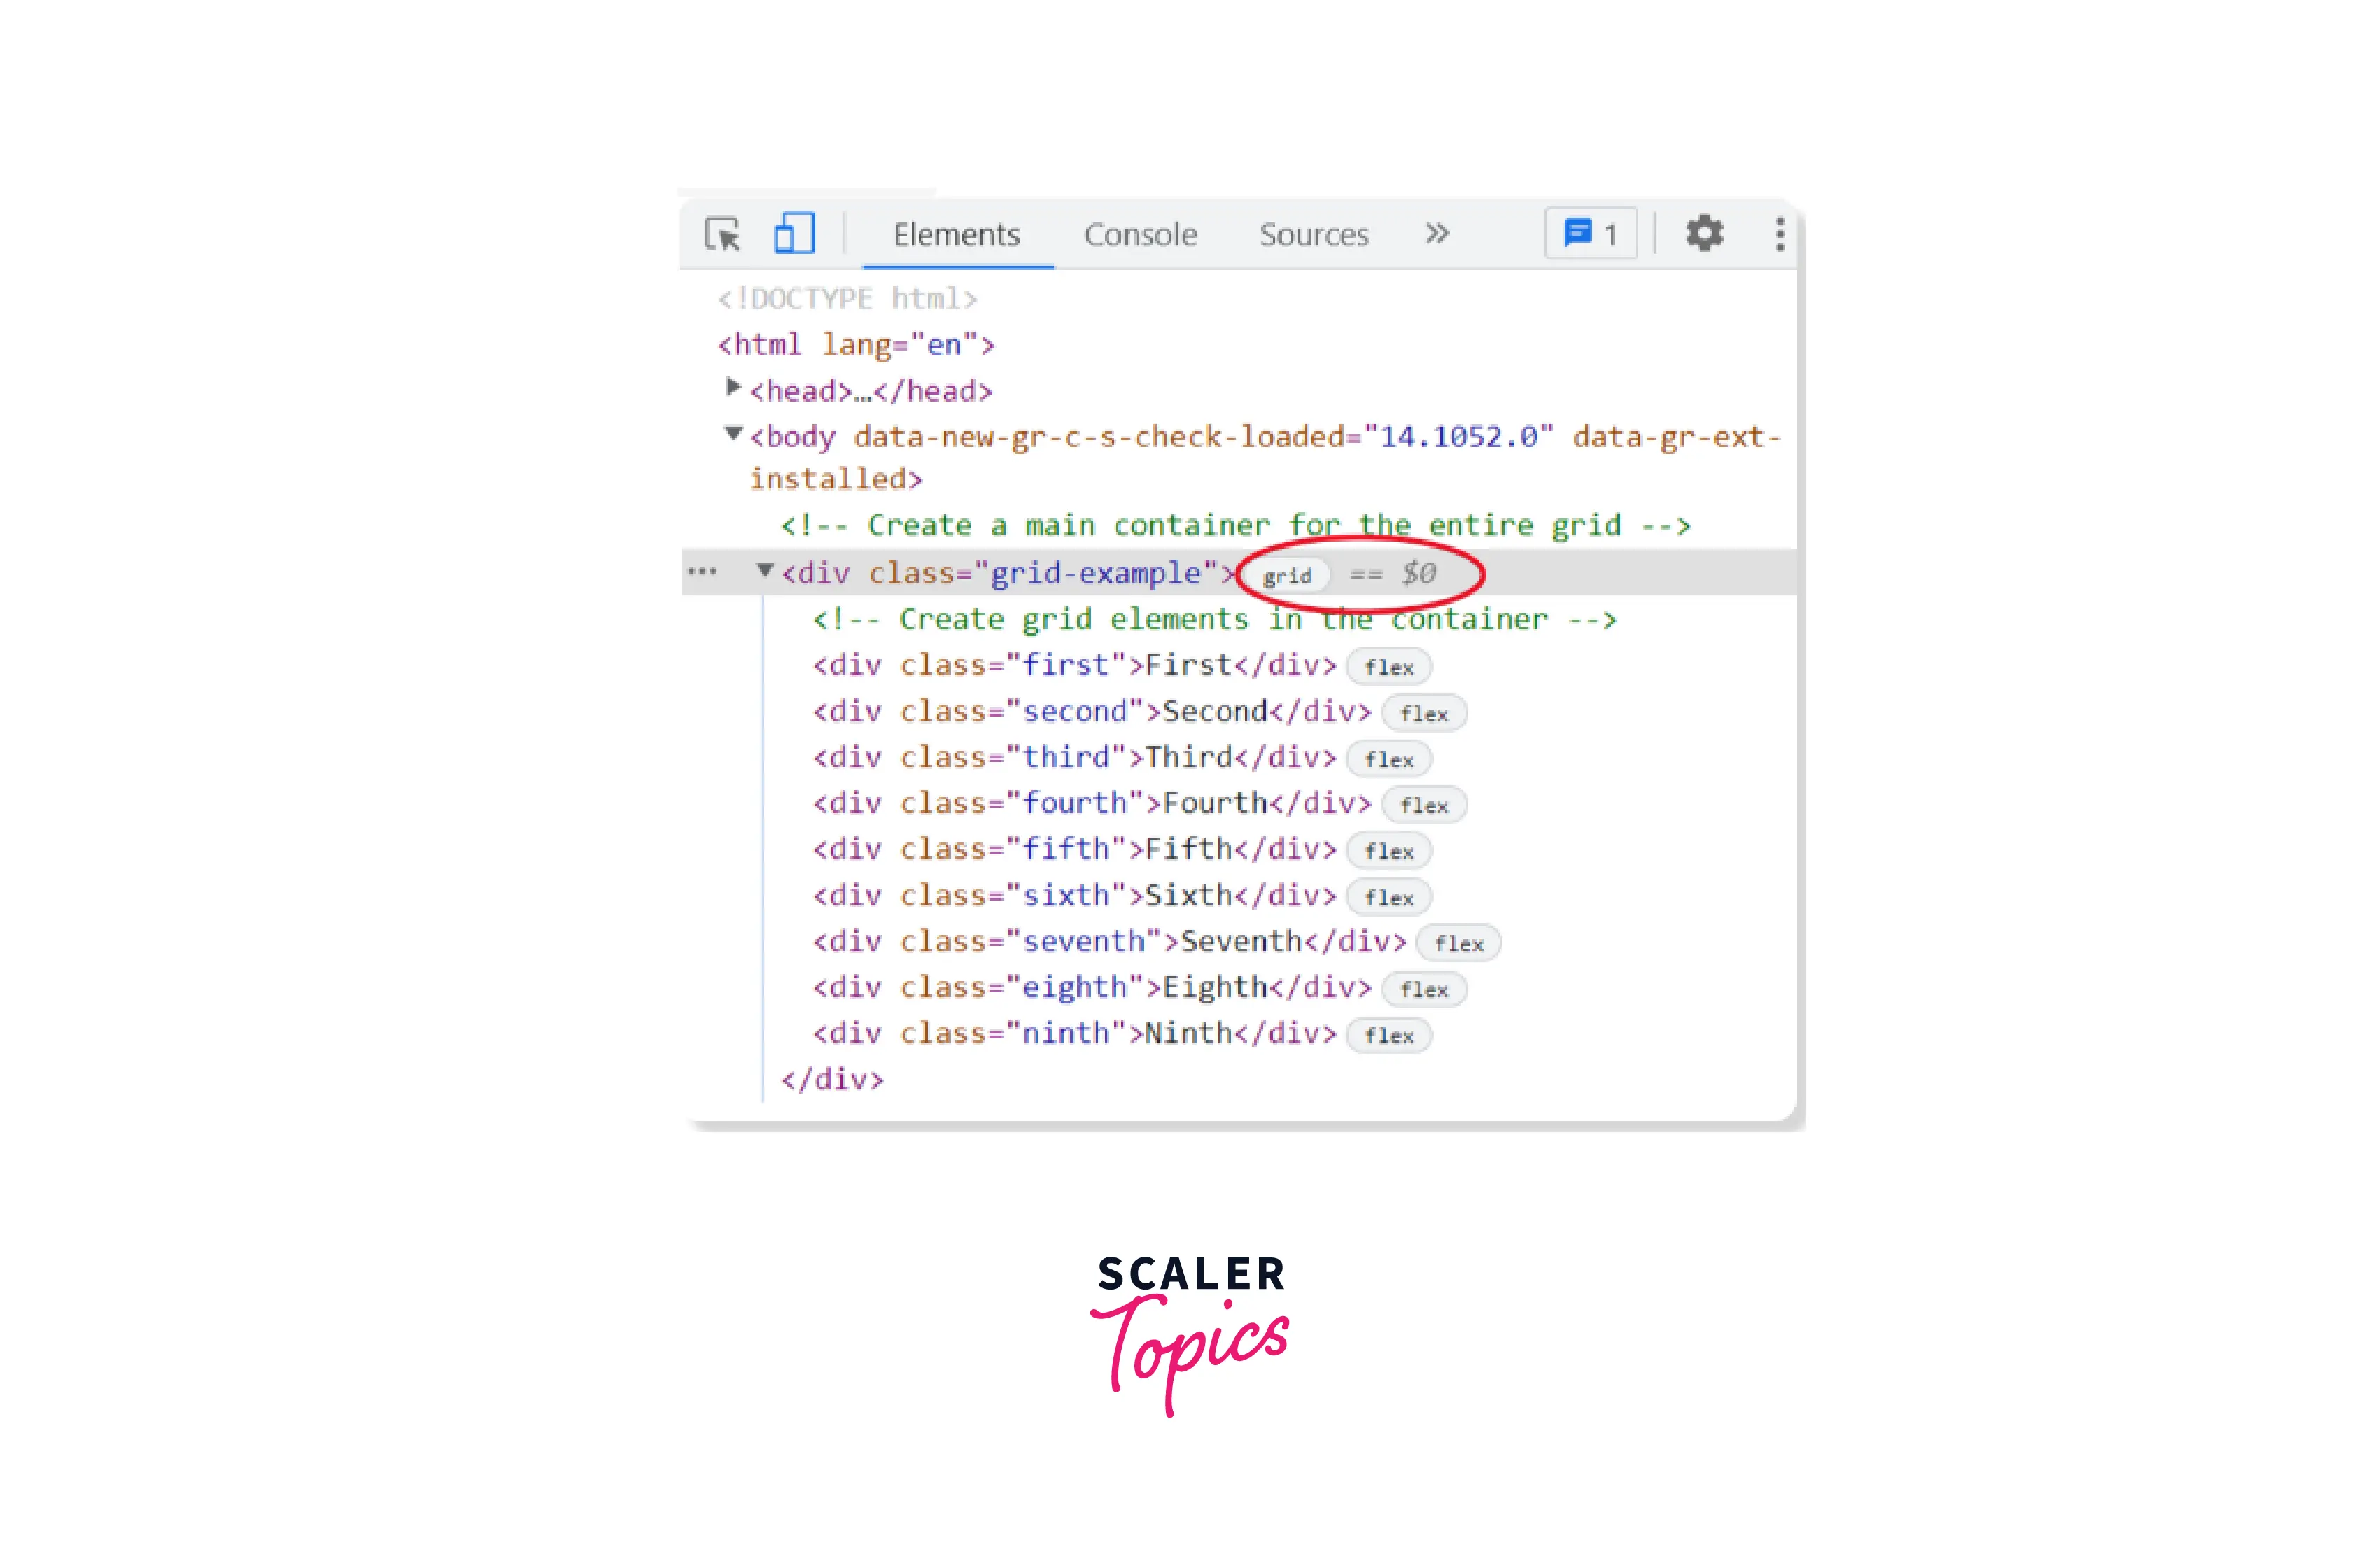
Click on the grid badge and the grid overlay will appear on the entire grid element that highlights the grid line numbers.
Once the grid lines are visible, open the Layout pane where you can see several options to view grids and comprehend them better.
We'll be discussing these viewing options in the next section.
Grid Viewing Options
When grid lines are visible on the page, the Layout panel shows the Grid section that is further divided into two different sub-sections:
- Overlay Display Settings
- Grid Overlays
Overlay Display Settings:
This section focuses on the different visibility options for the grid lines. They can either be presented by line numbers, labels, areas, etc. Moreover, if it's unnecessary, you can hide them as well.
Grid Overlays:
Grid Overlays shows the different areas where display: grid or display: inline-grid and you'll be provided with checkboxes to select one or multiple grids on which you need to examine using grid lines.
Overlay Display Settings
Show Line Numbers:
- In the Layout panel, head to the Overlay display settings and look for the dropdown menu.
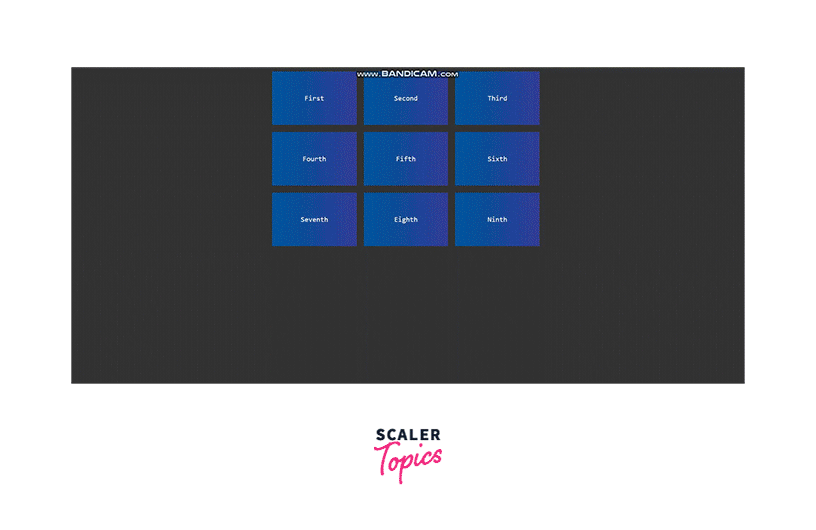
- Here, you'll find the option Show line numbers. Clicking on it will make line numbers visible on the page.
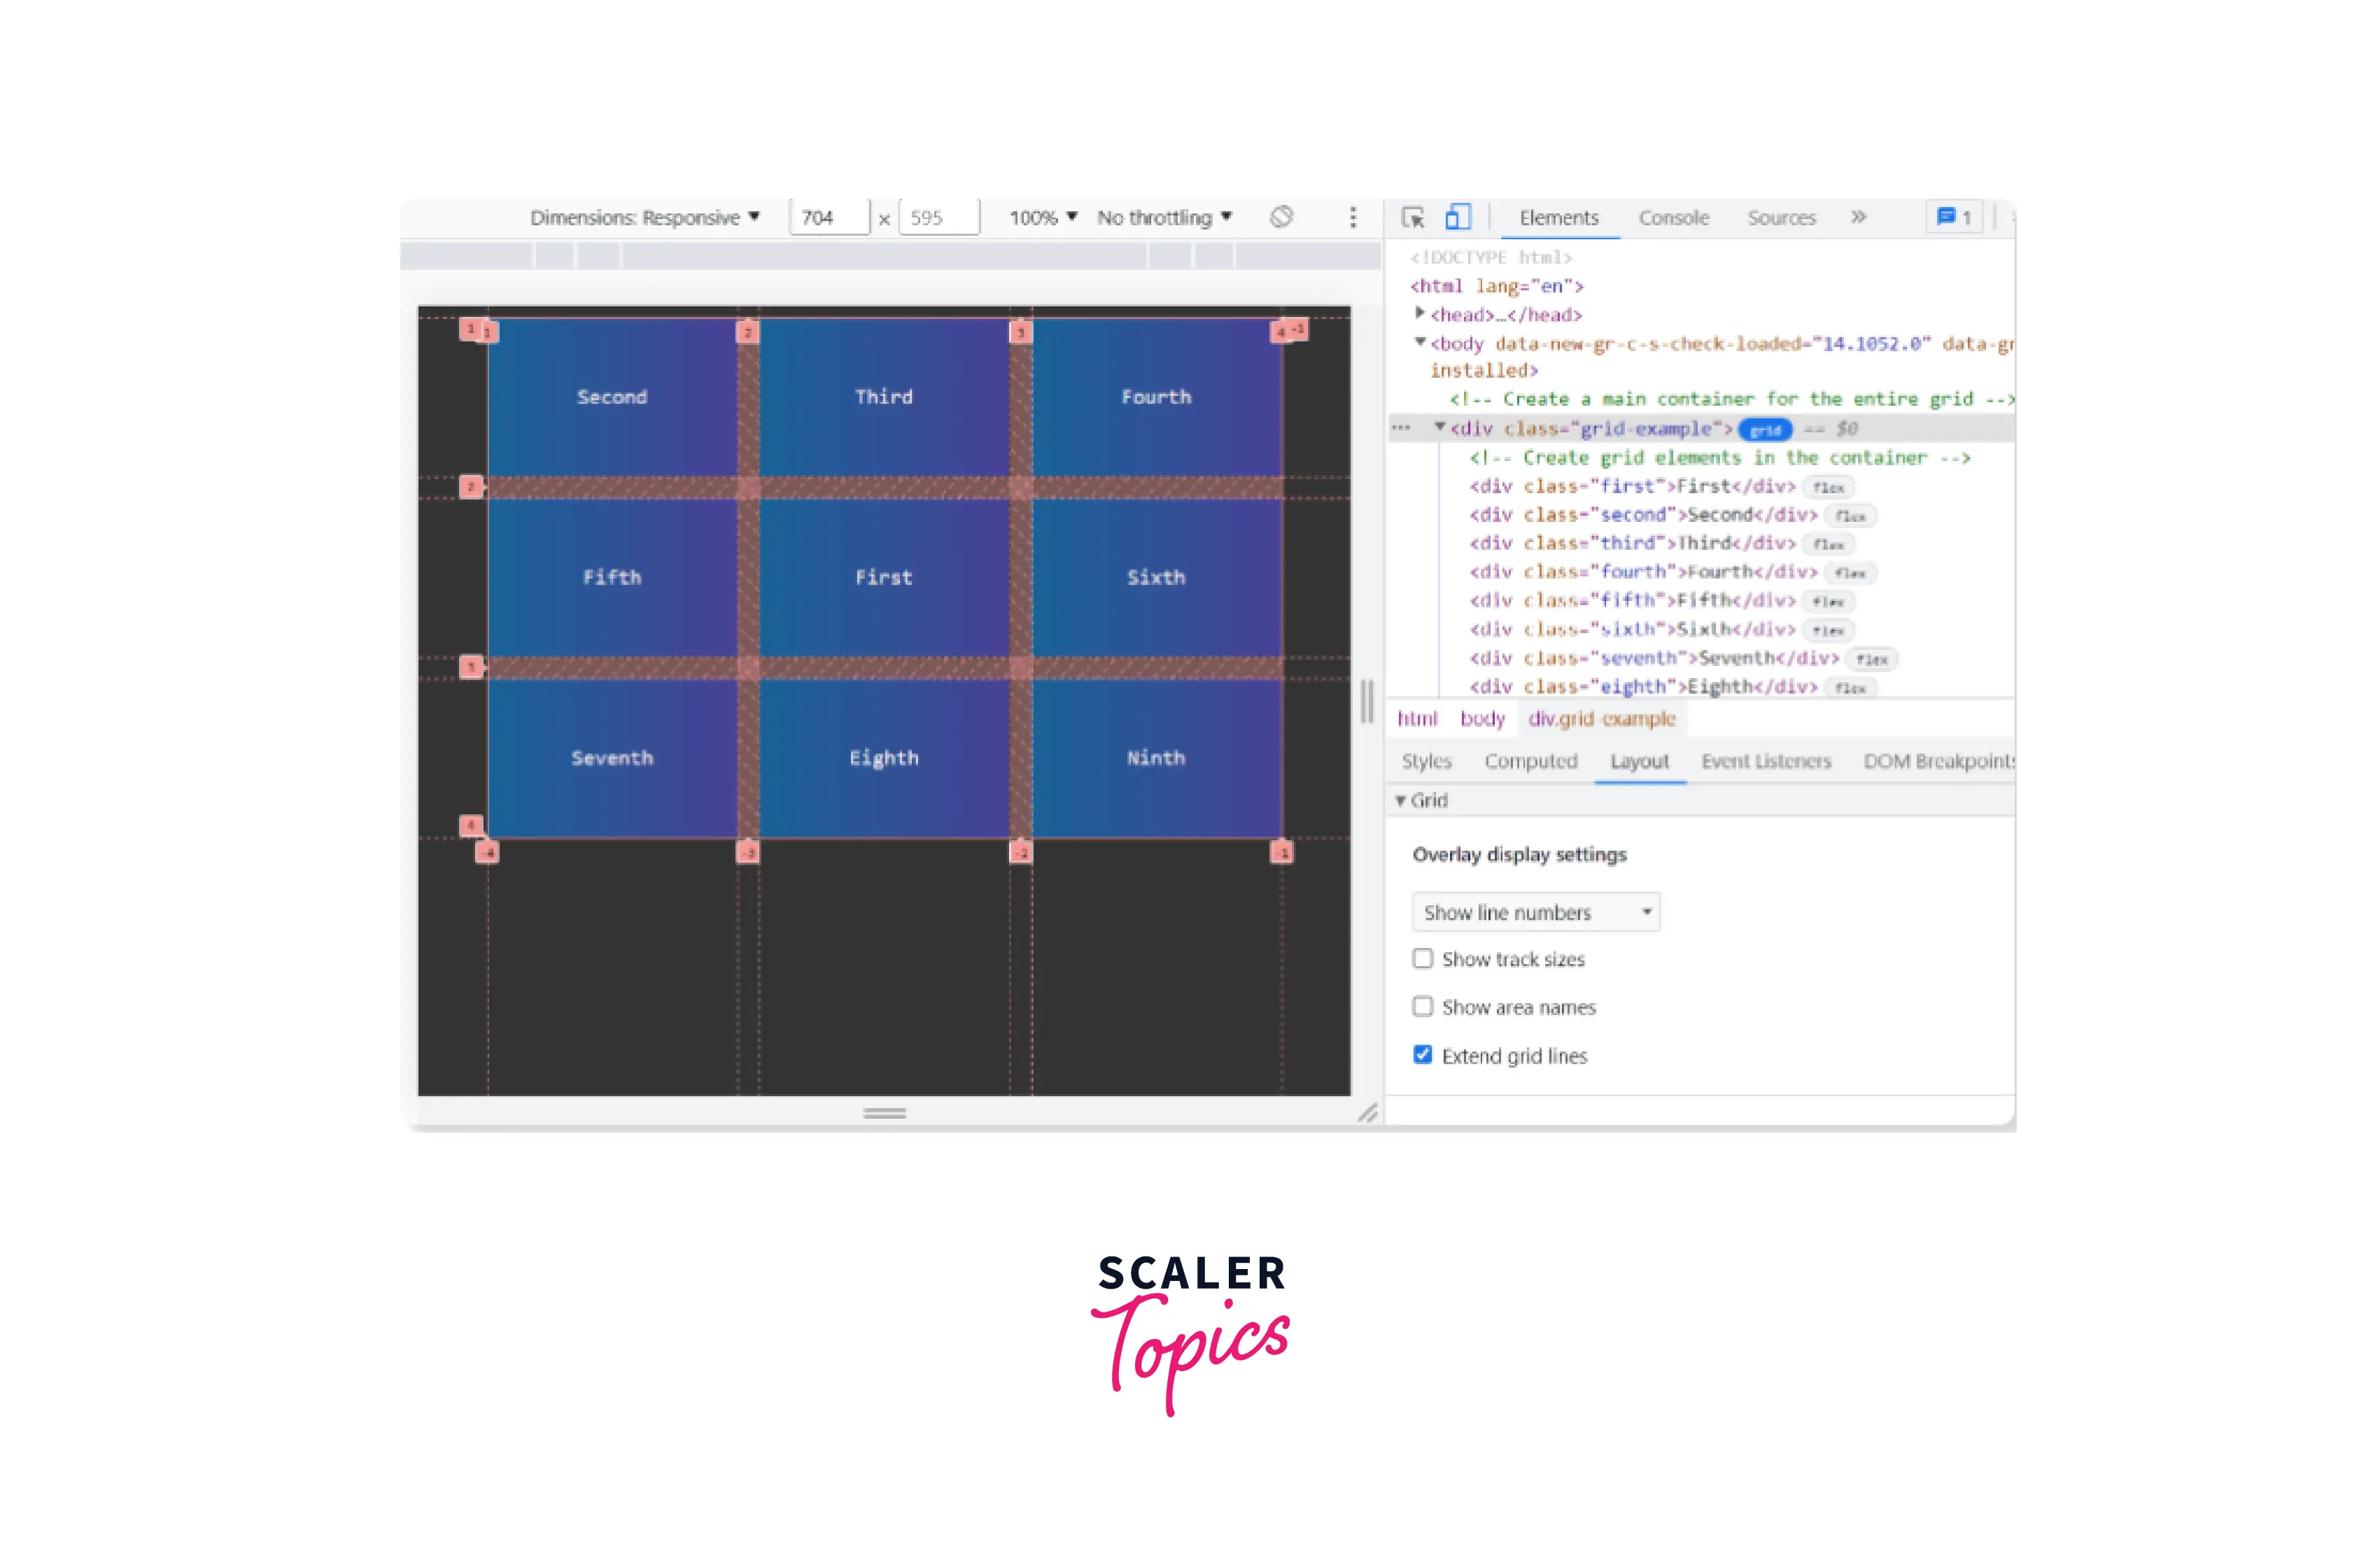
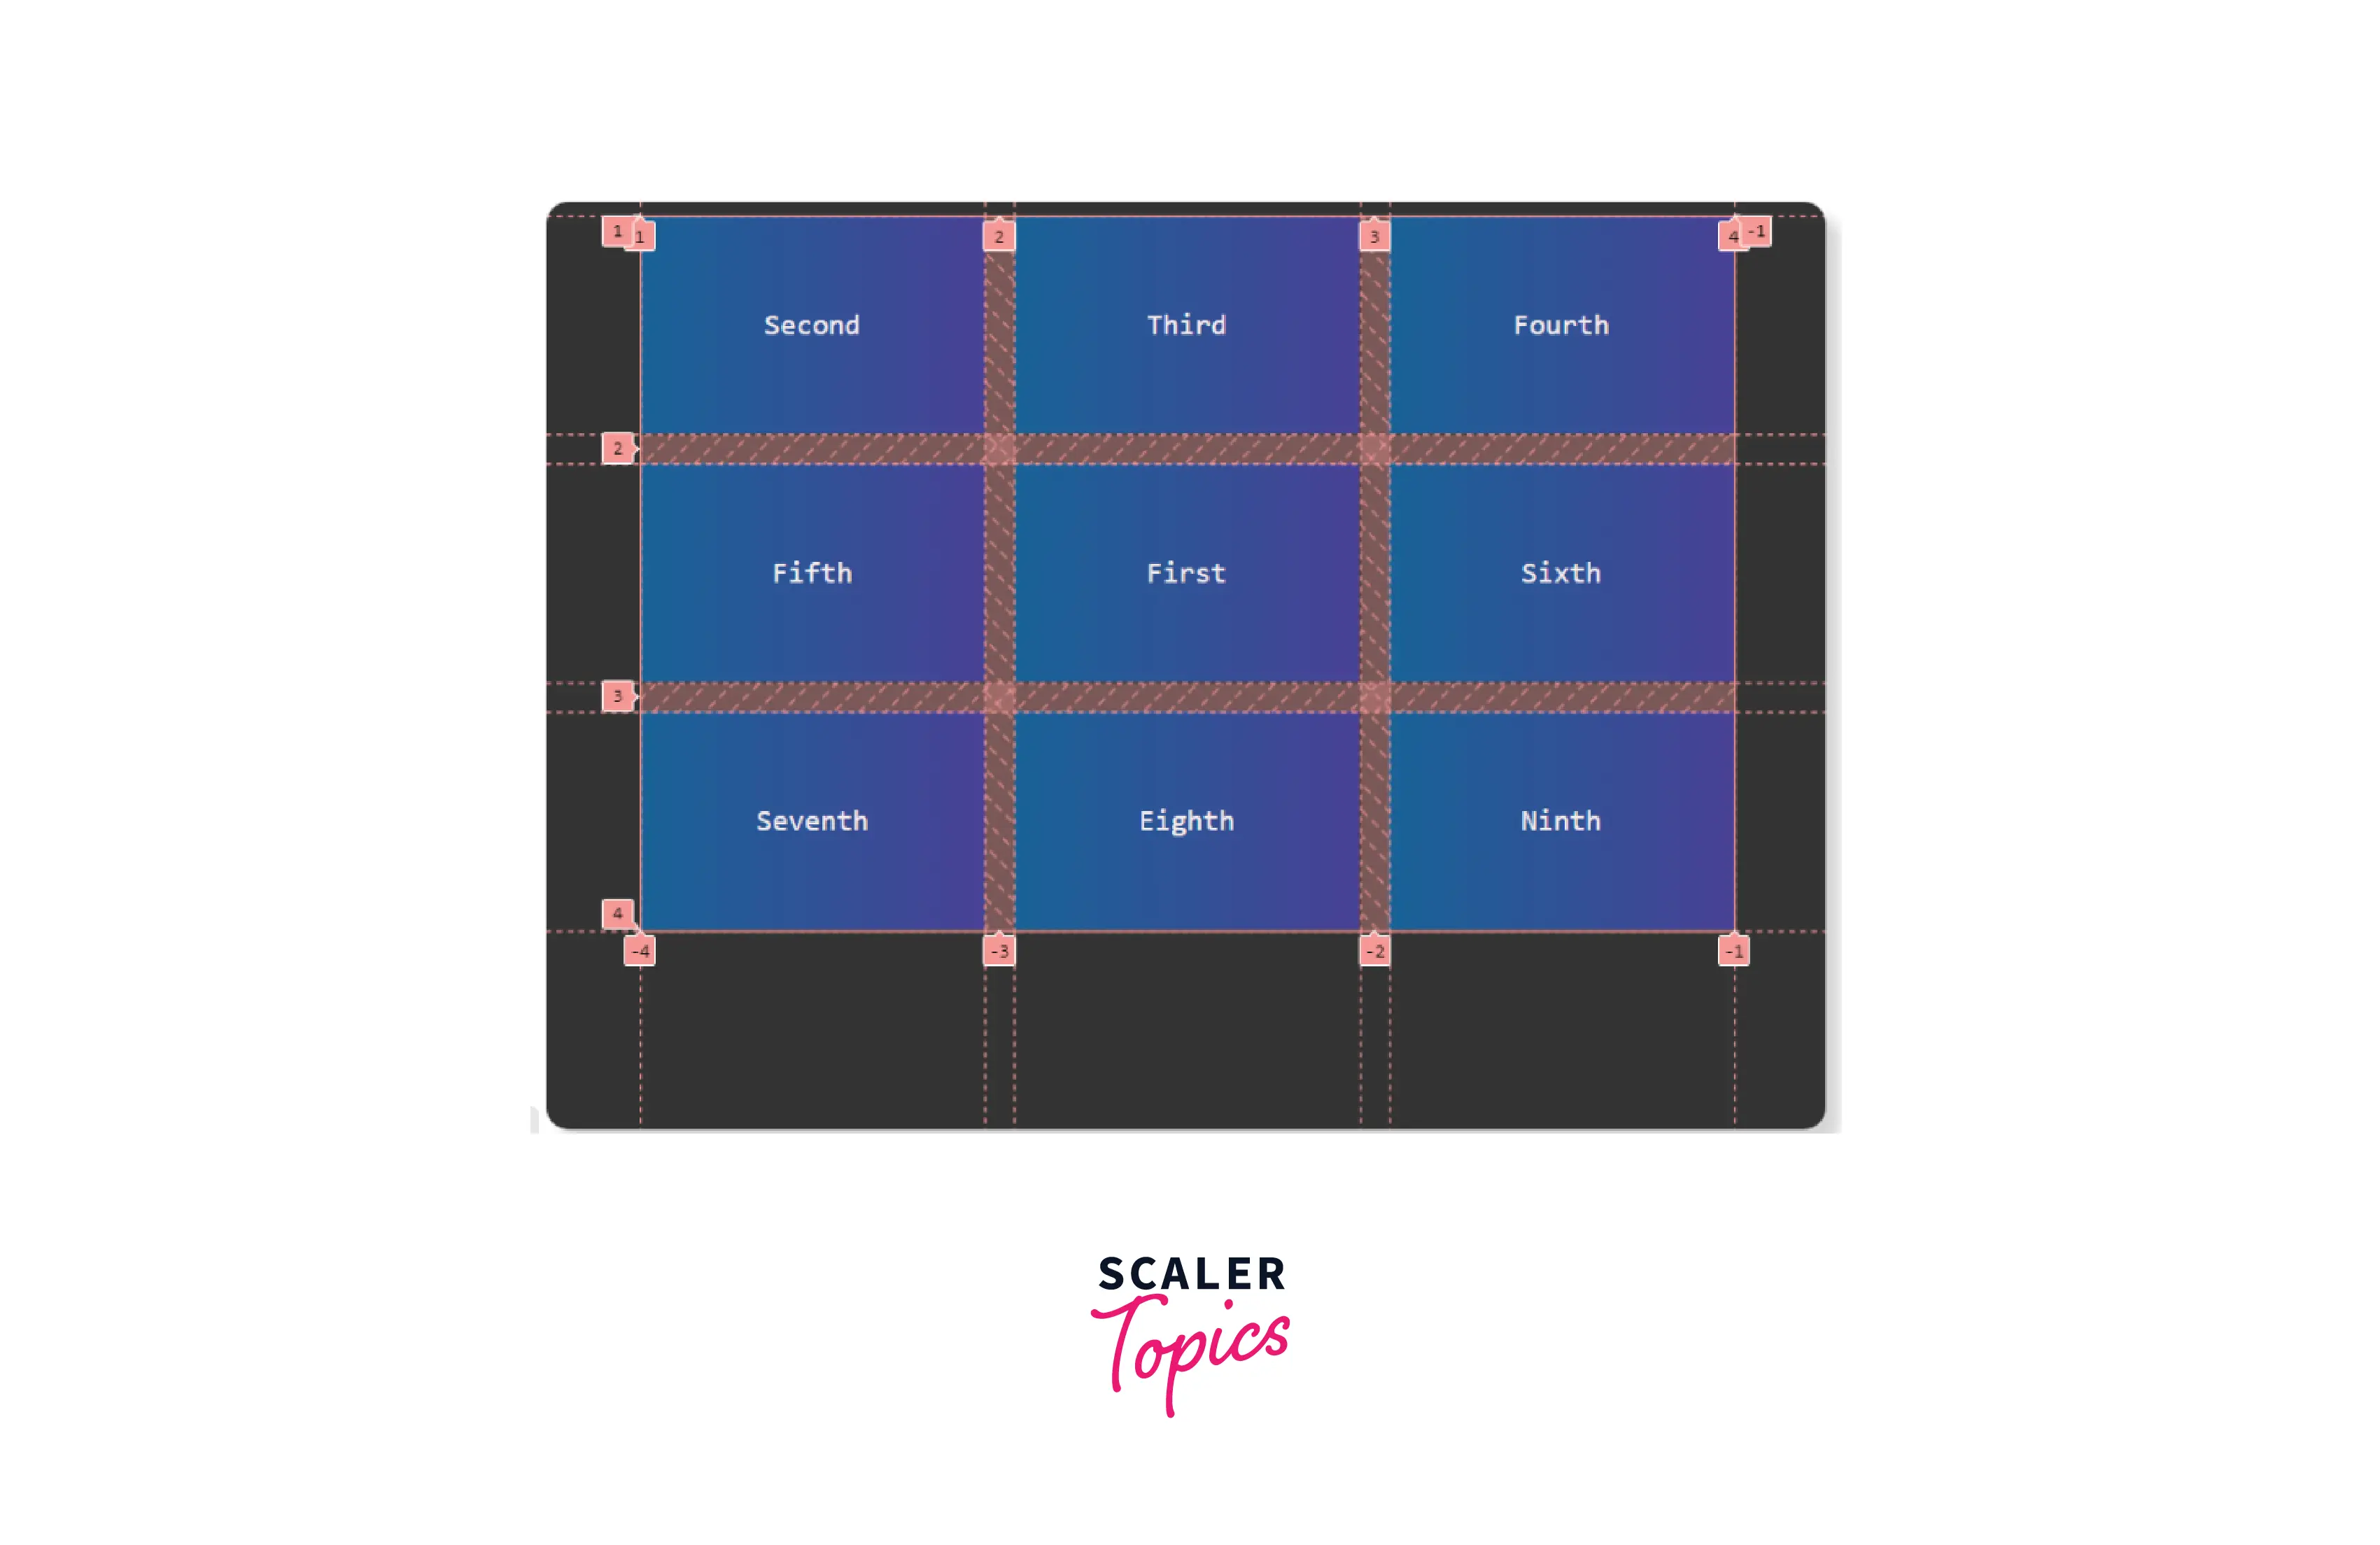
There will be positive numbers from left to right and top to bottom.
Plus, negative numbers will also be visible, starting from the right bottom to its left and also extending to the top.
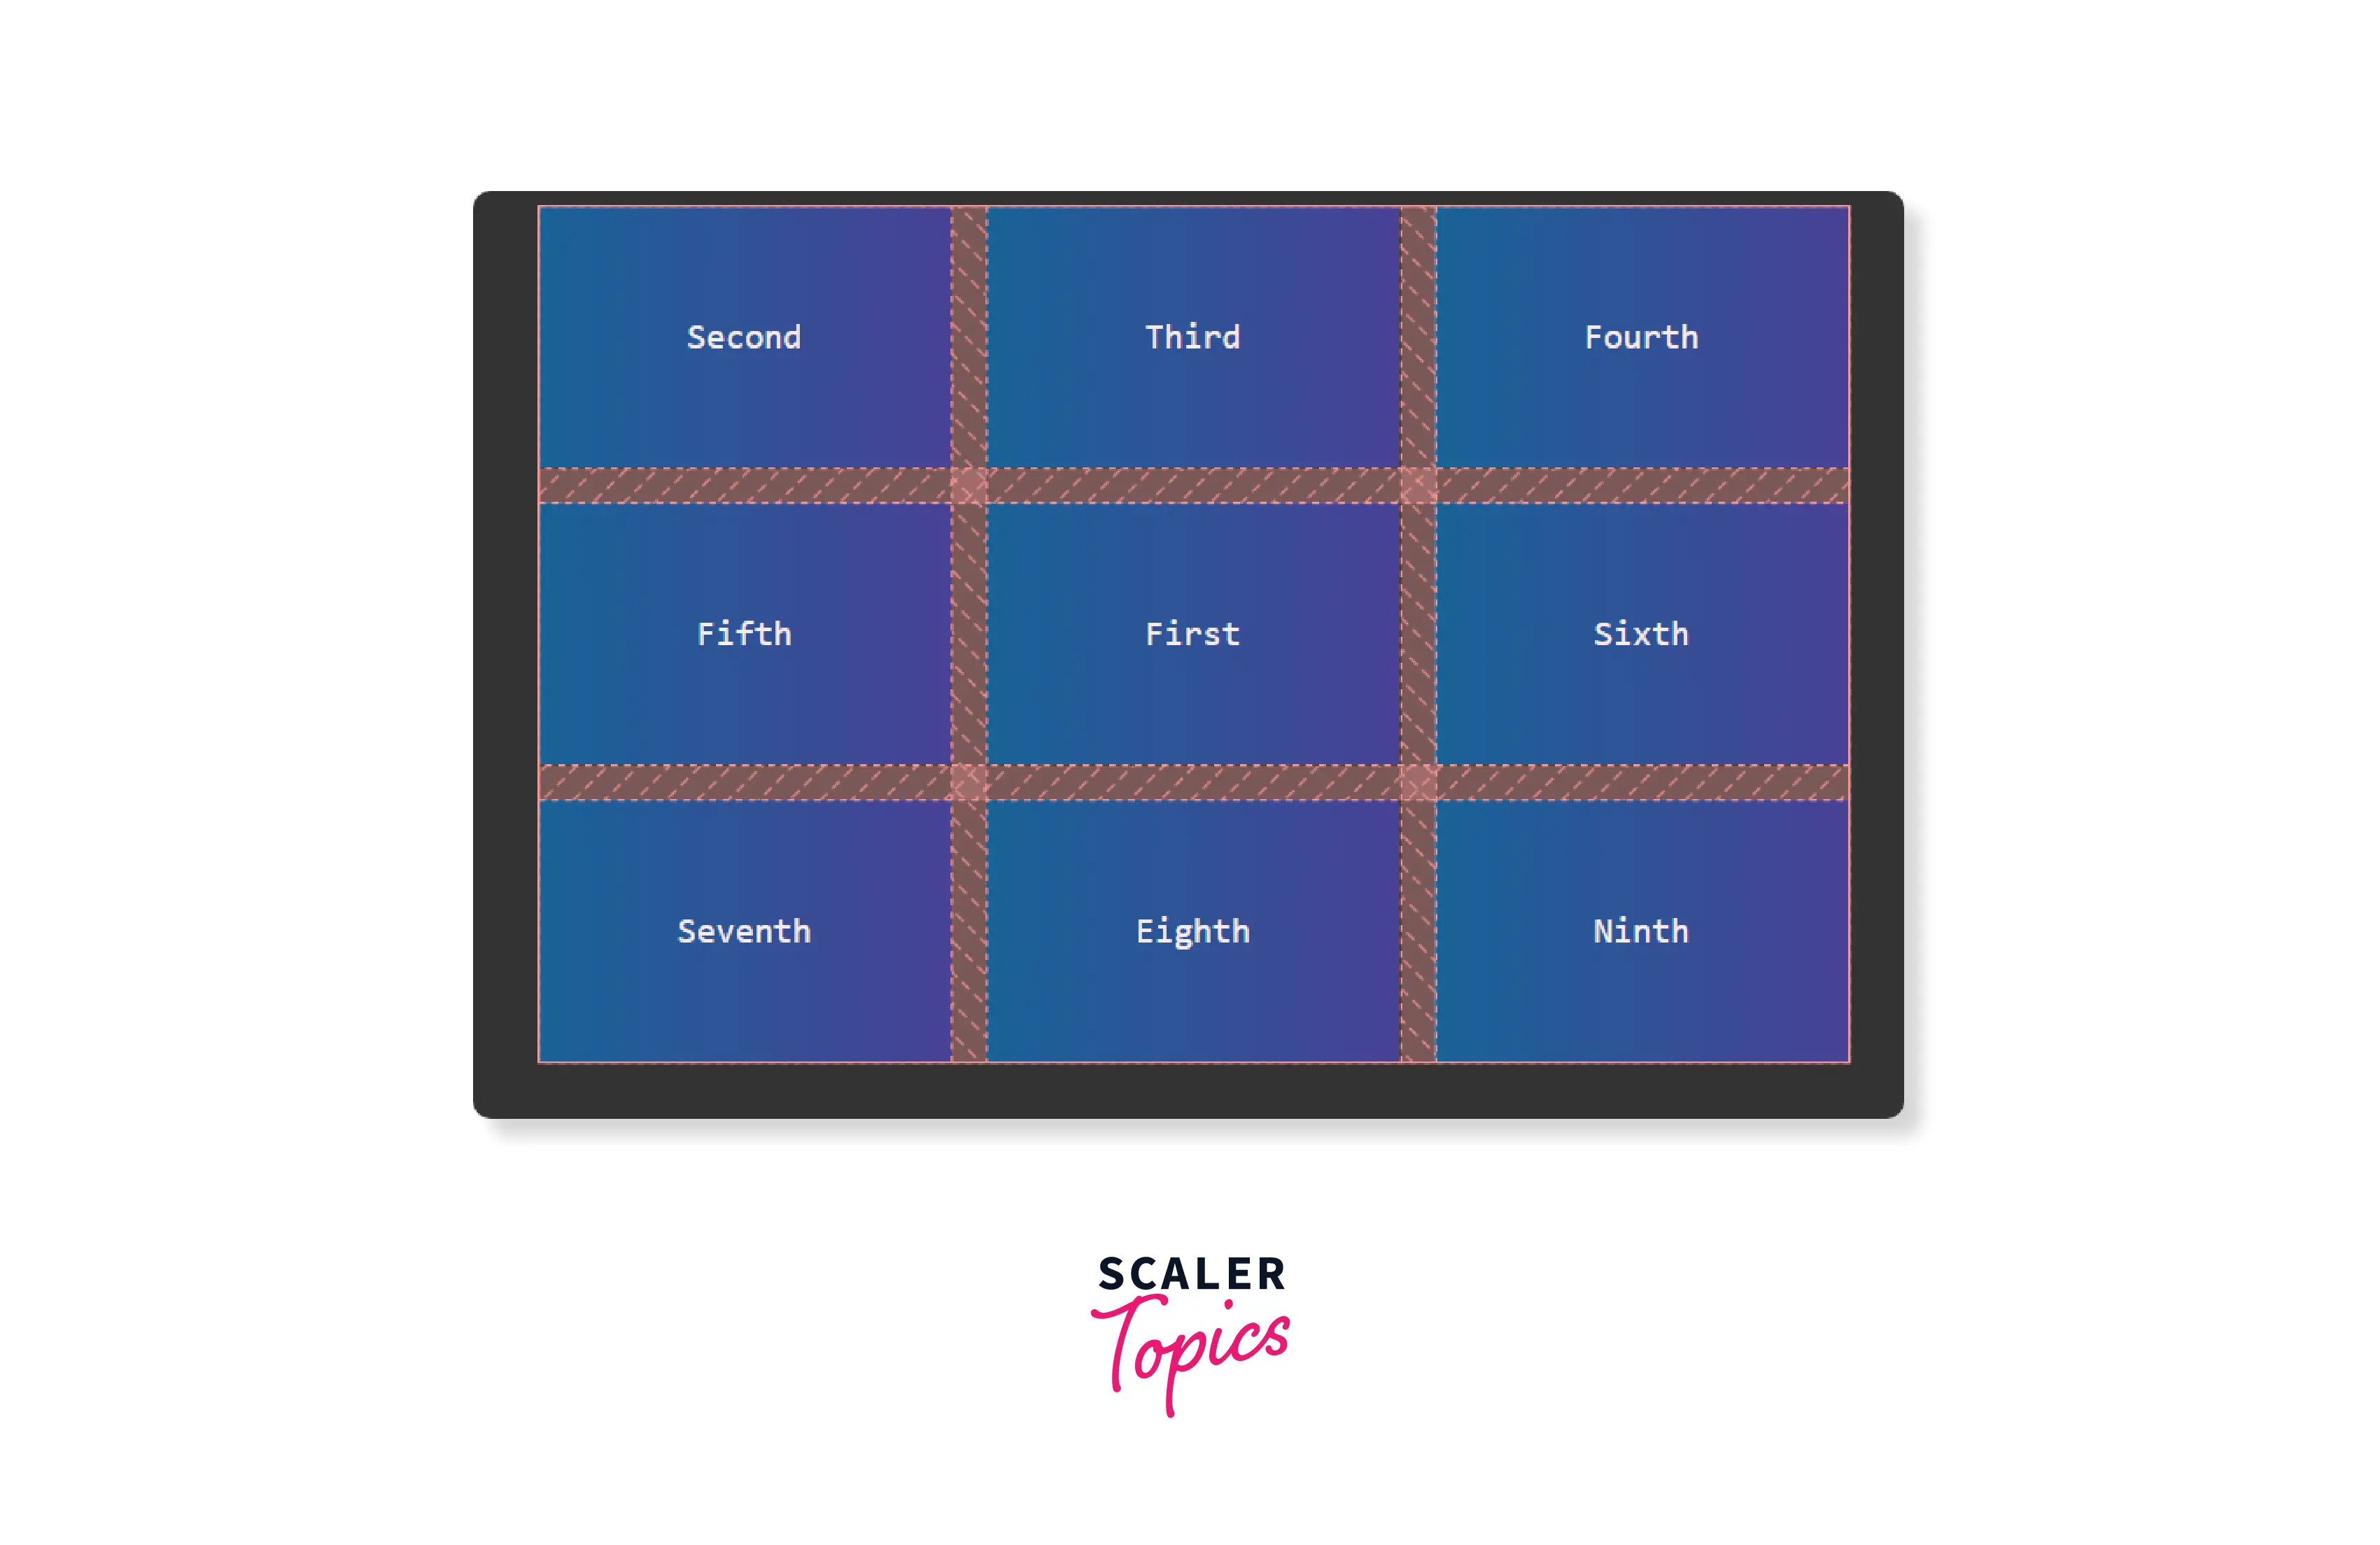
Let us see how we can make use of these numbers:
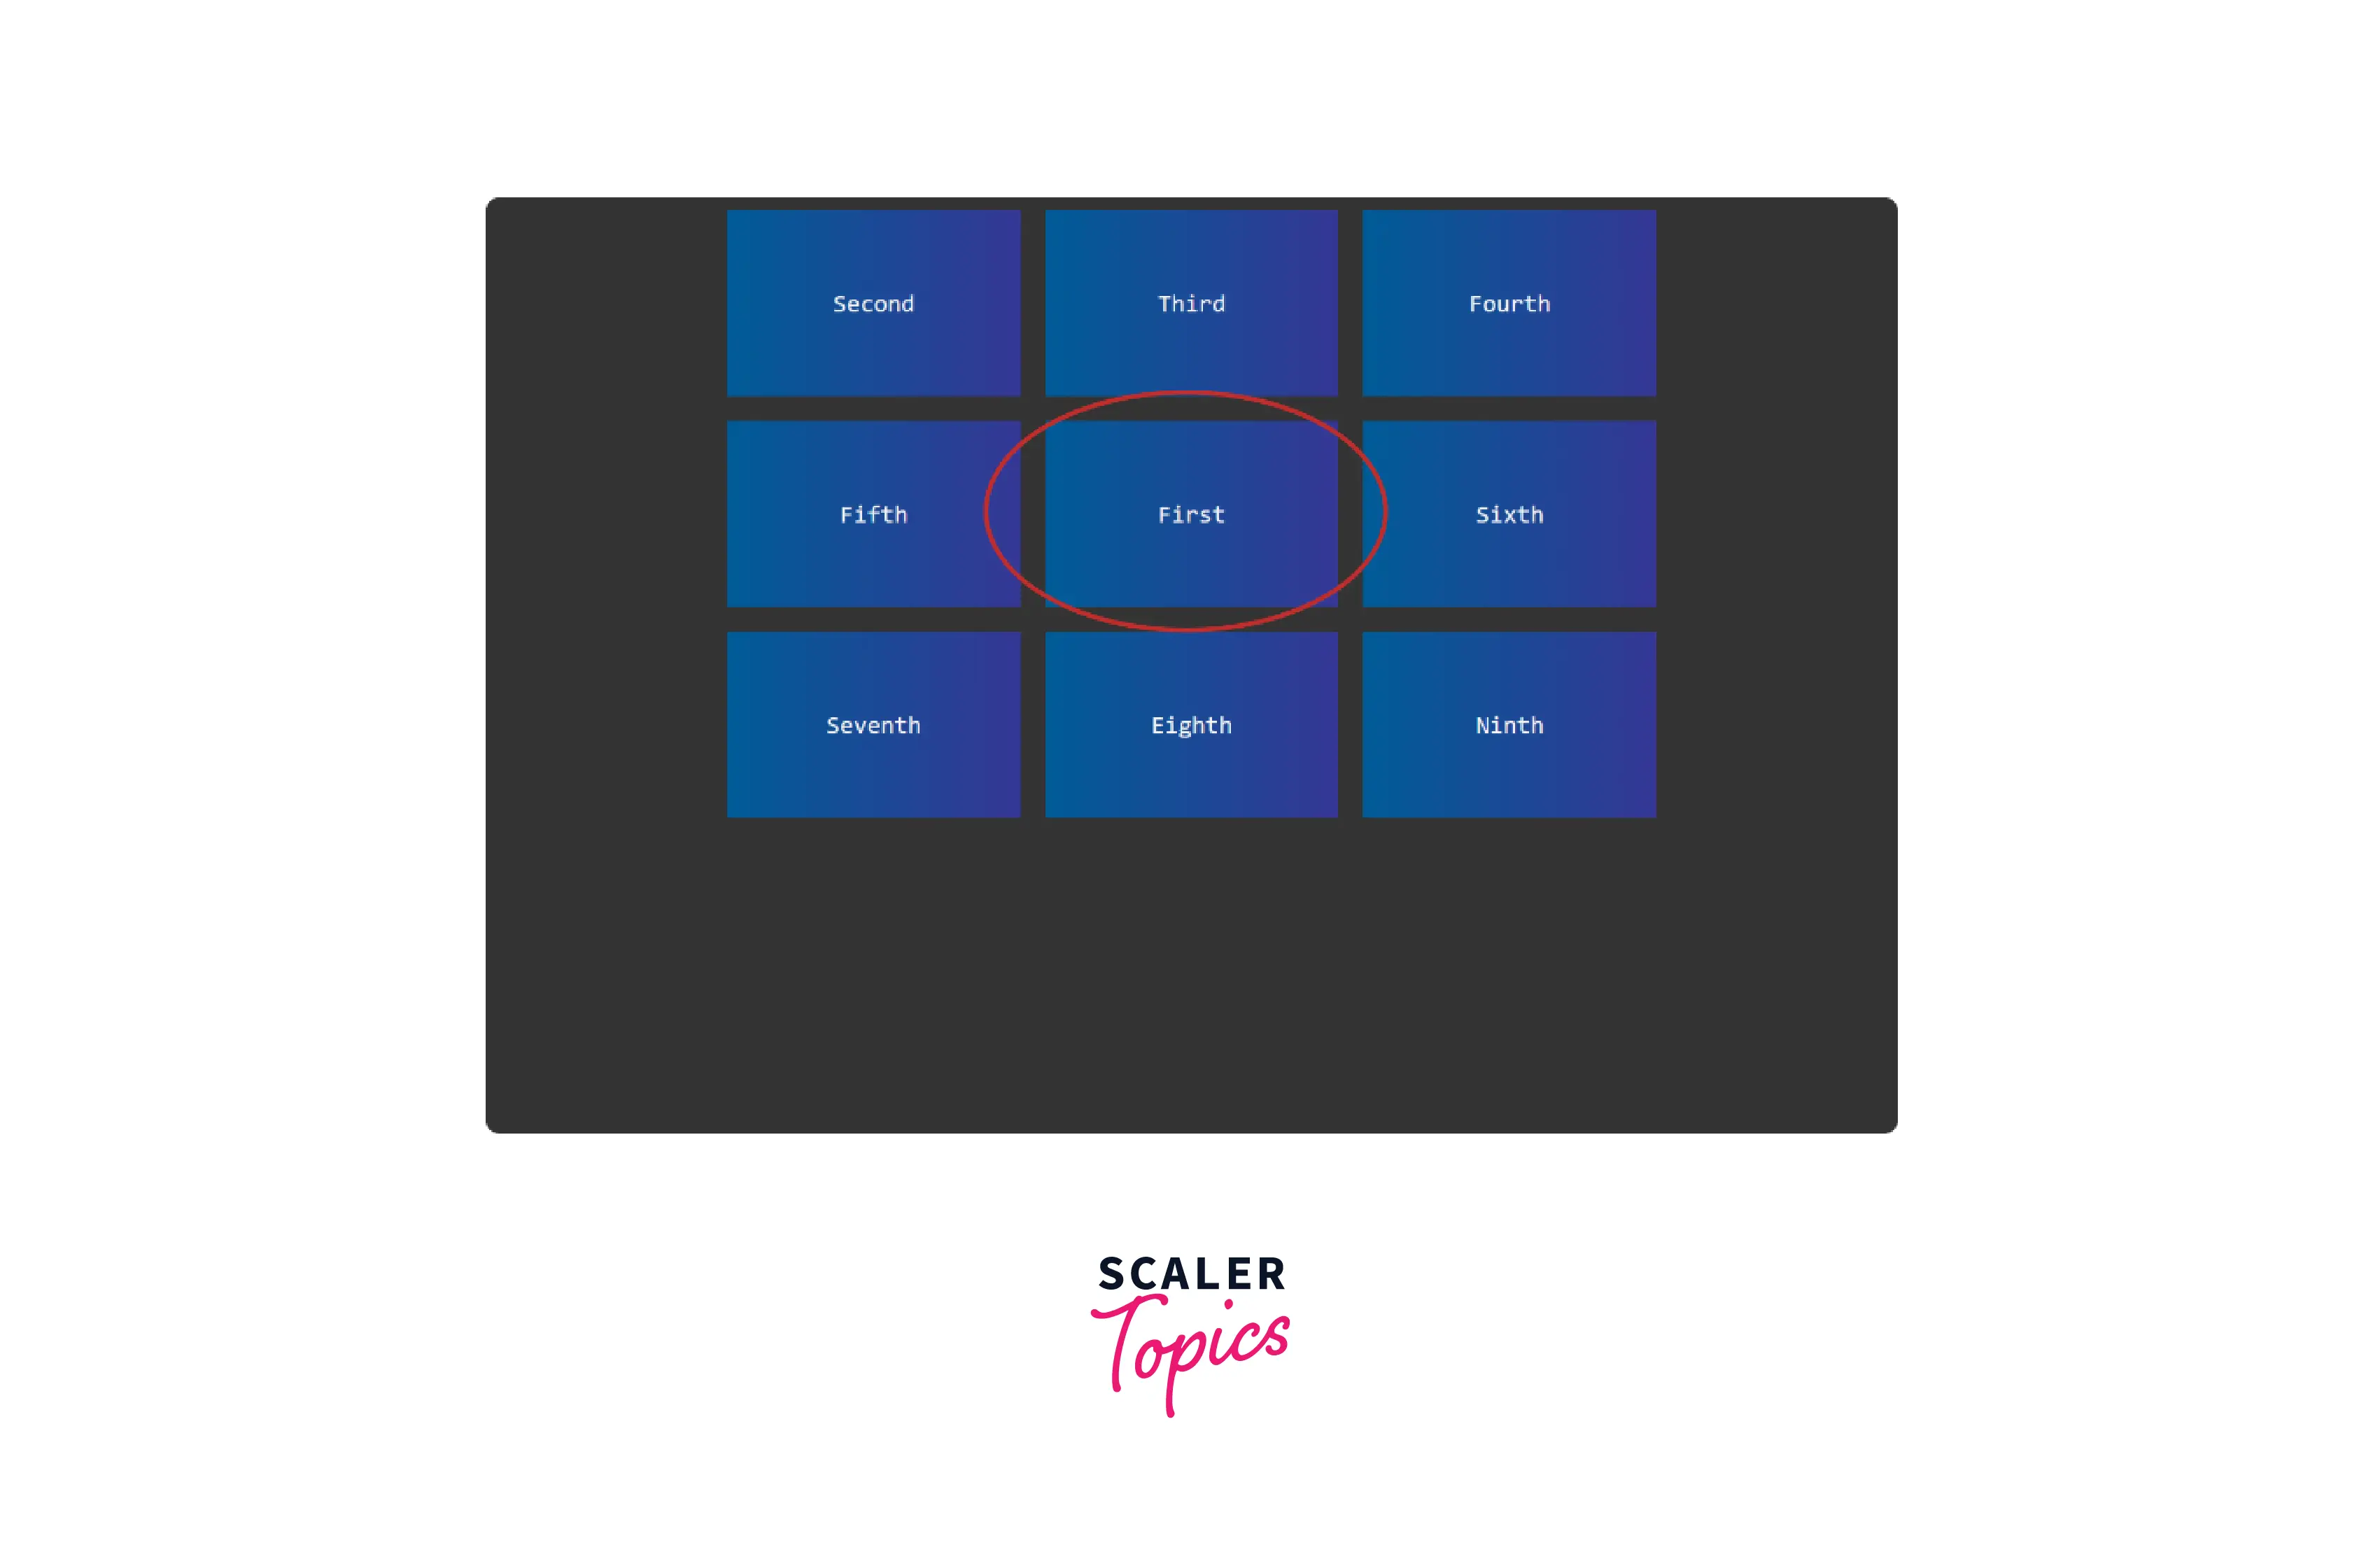
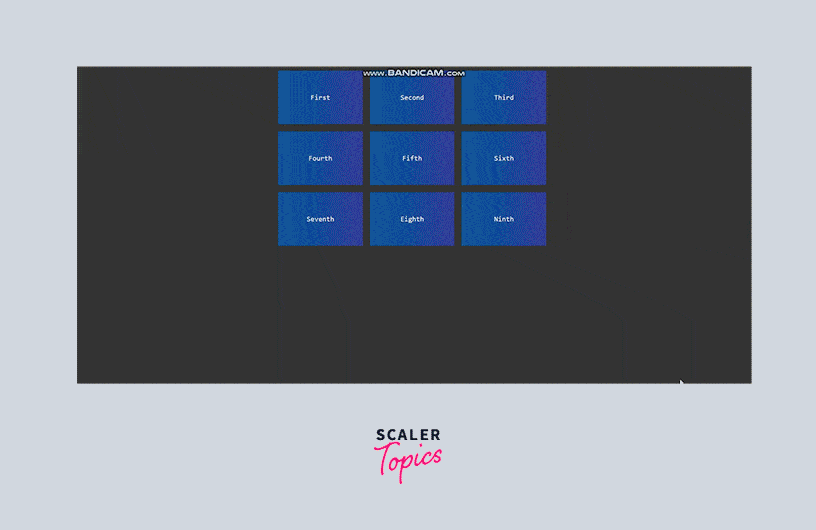
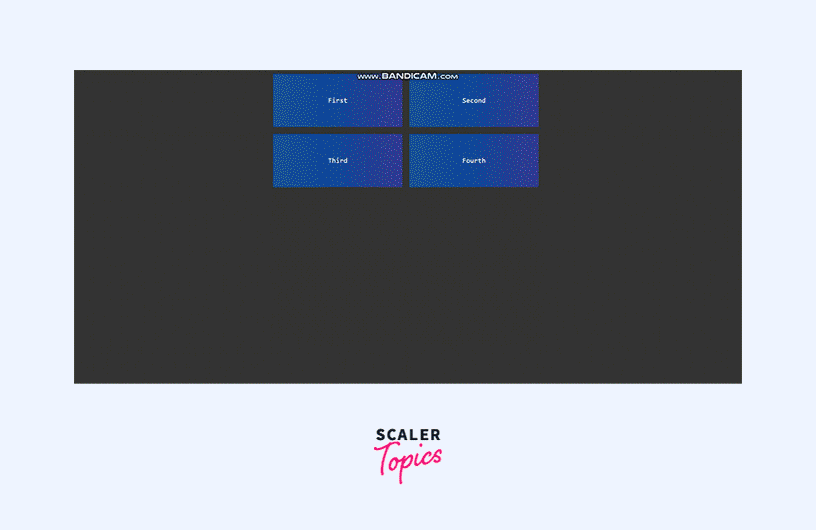
If you wish the grid First to appear in the place of Fifth, we can add the CSS code for it along with the existing code provided above.
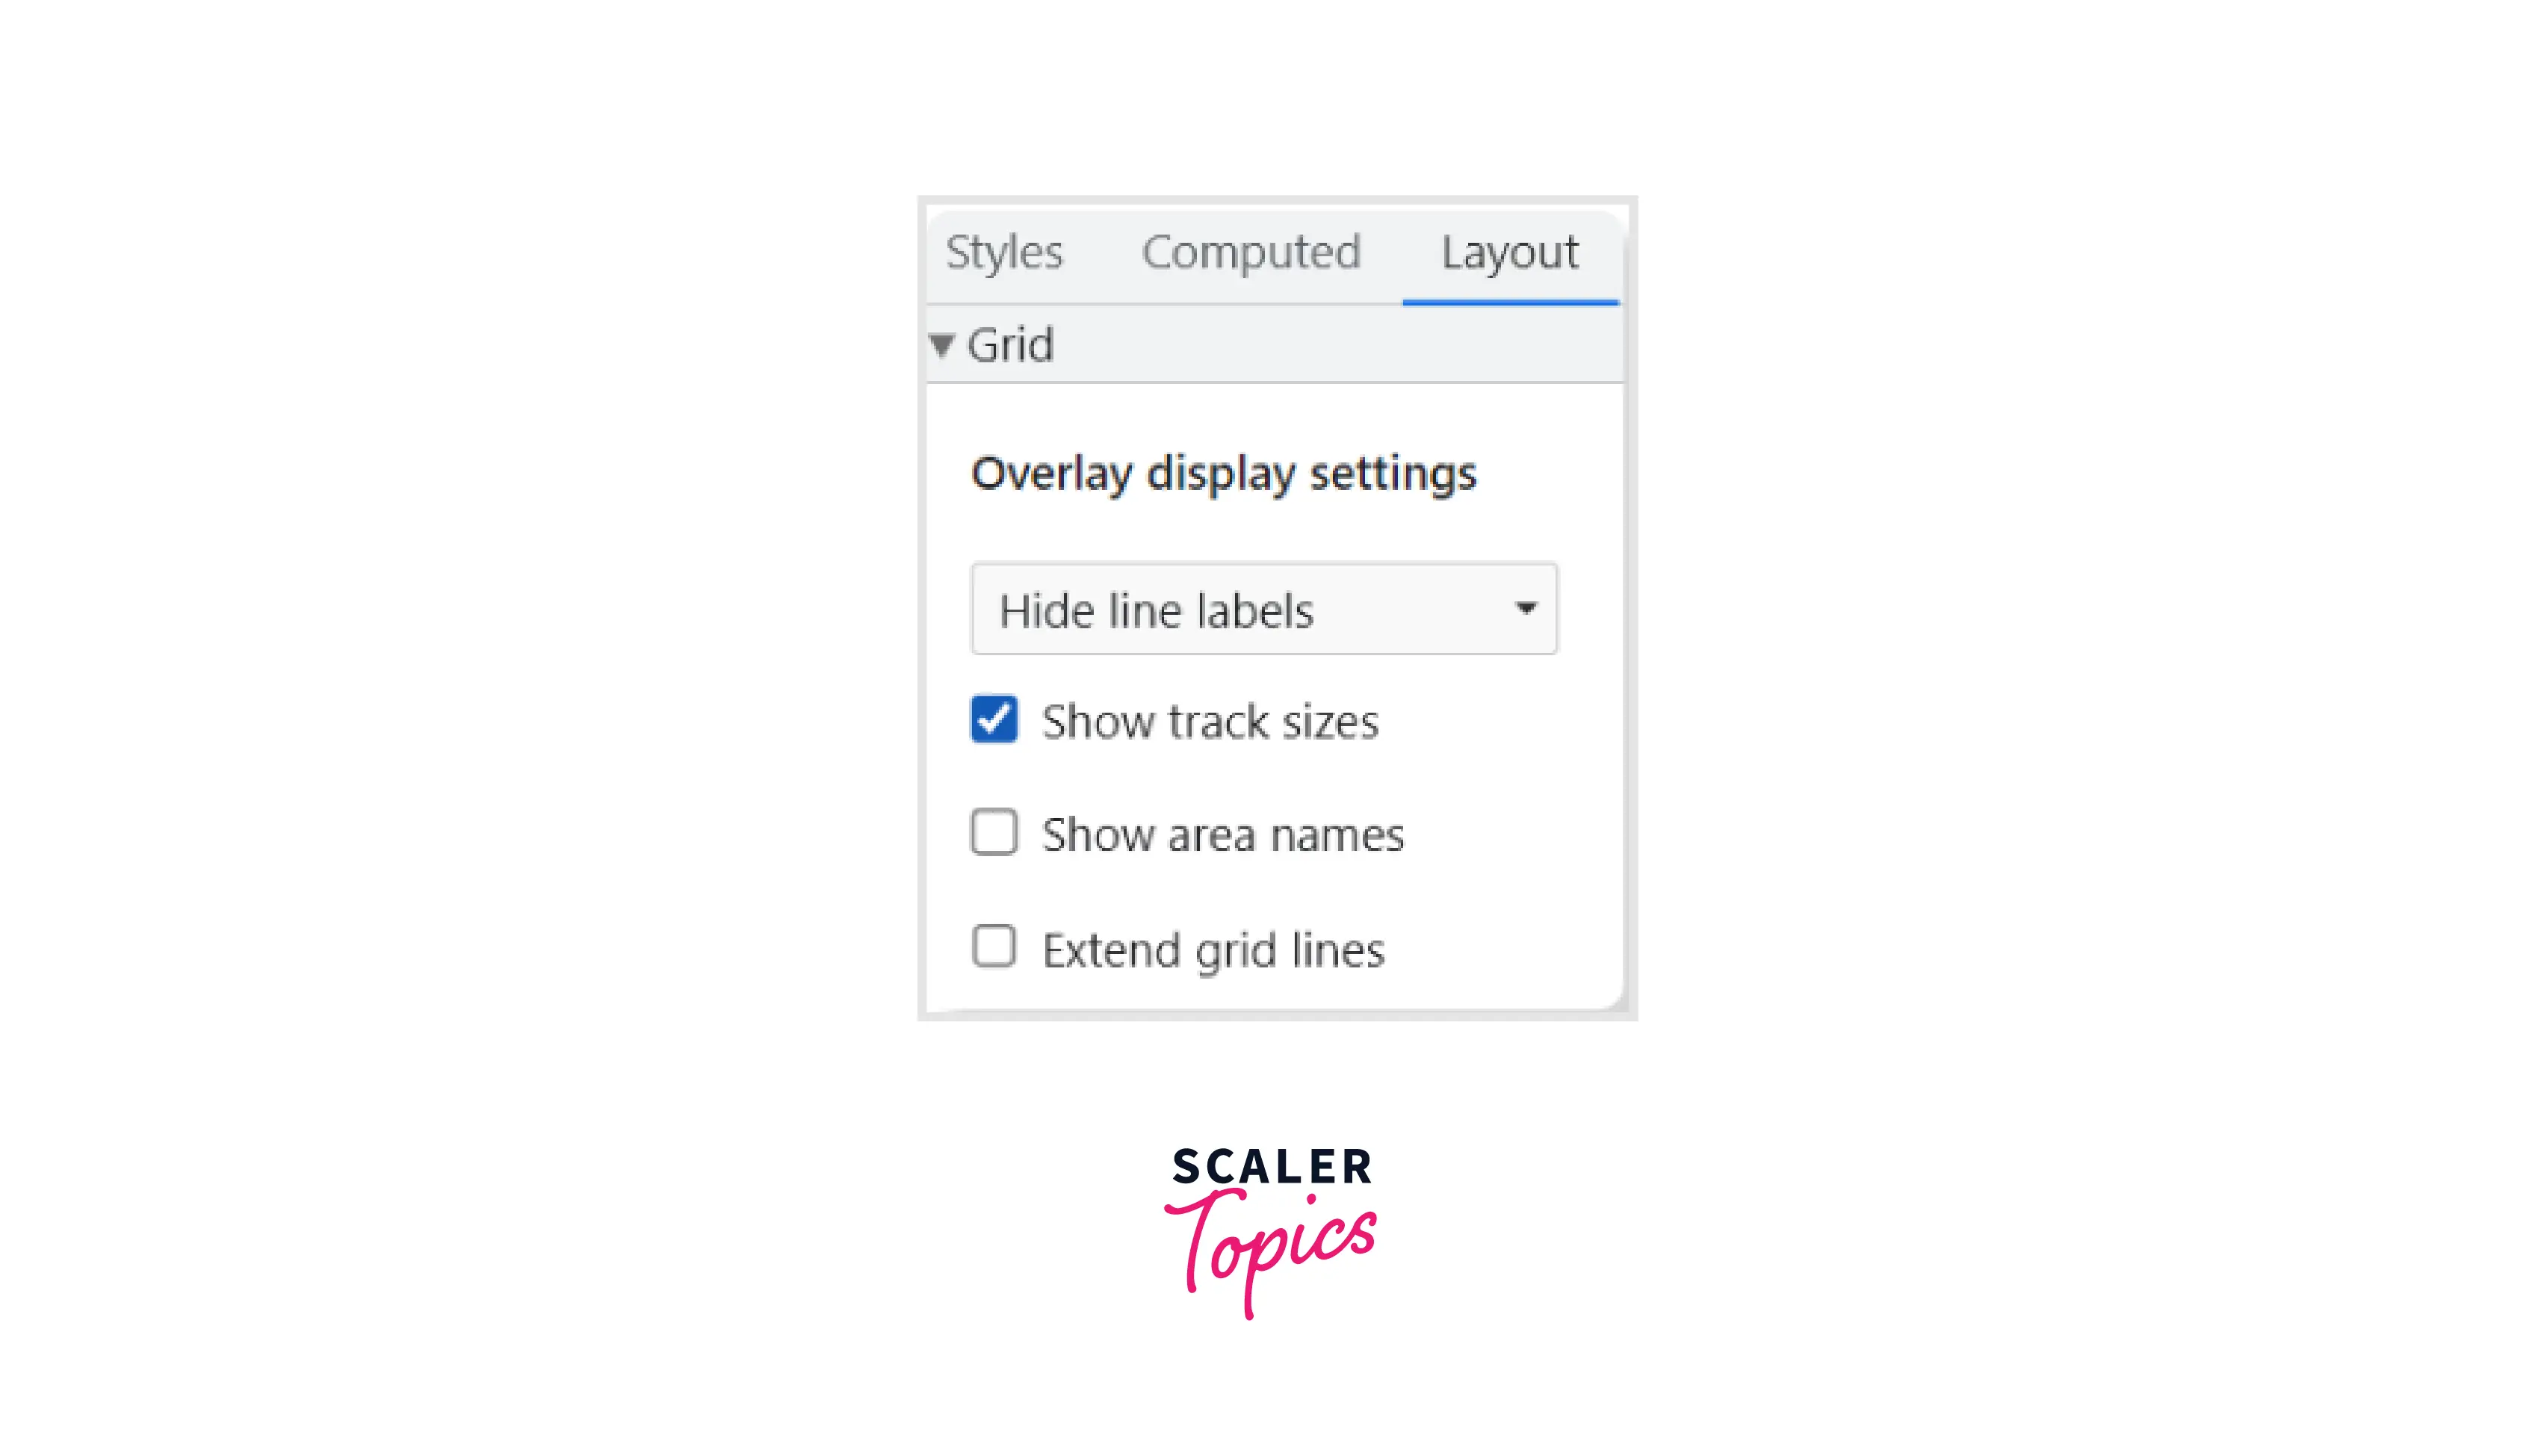
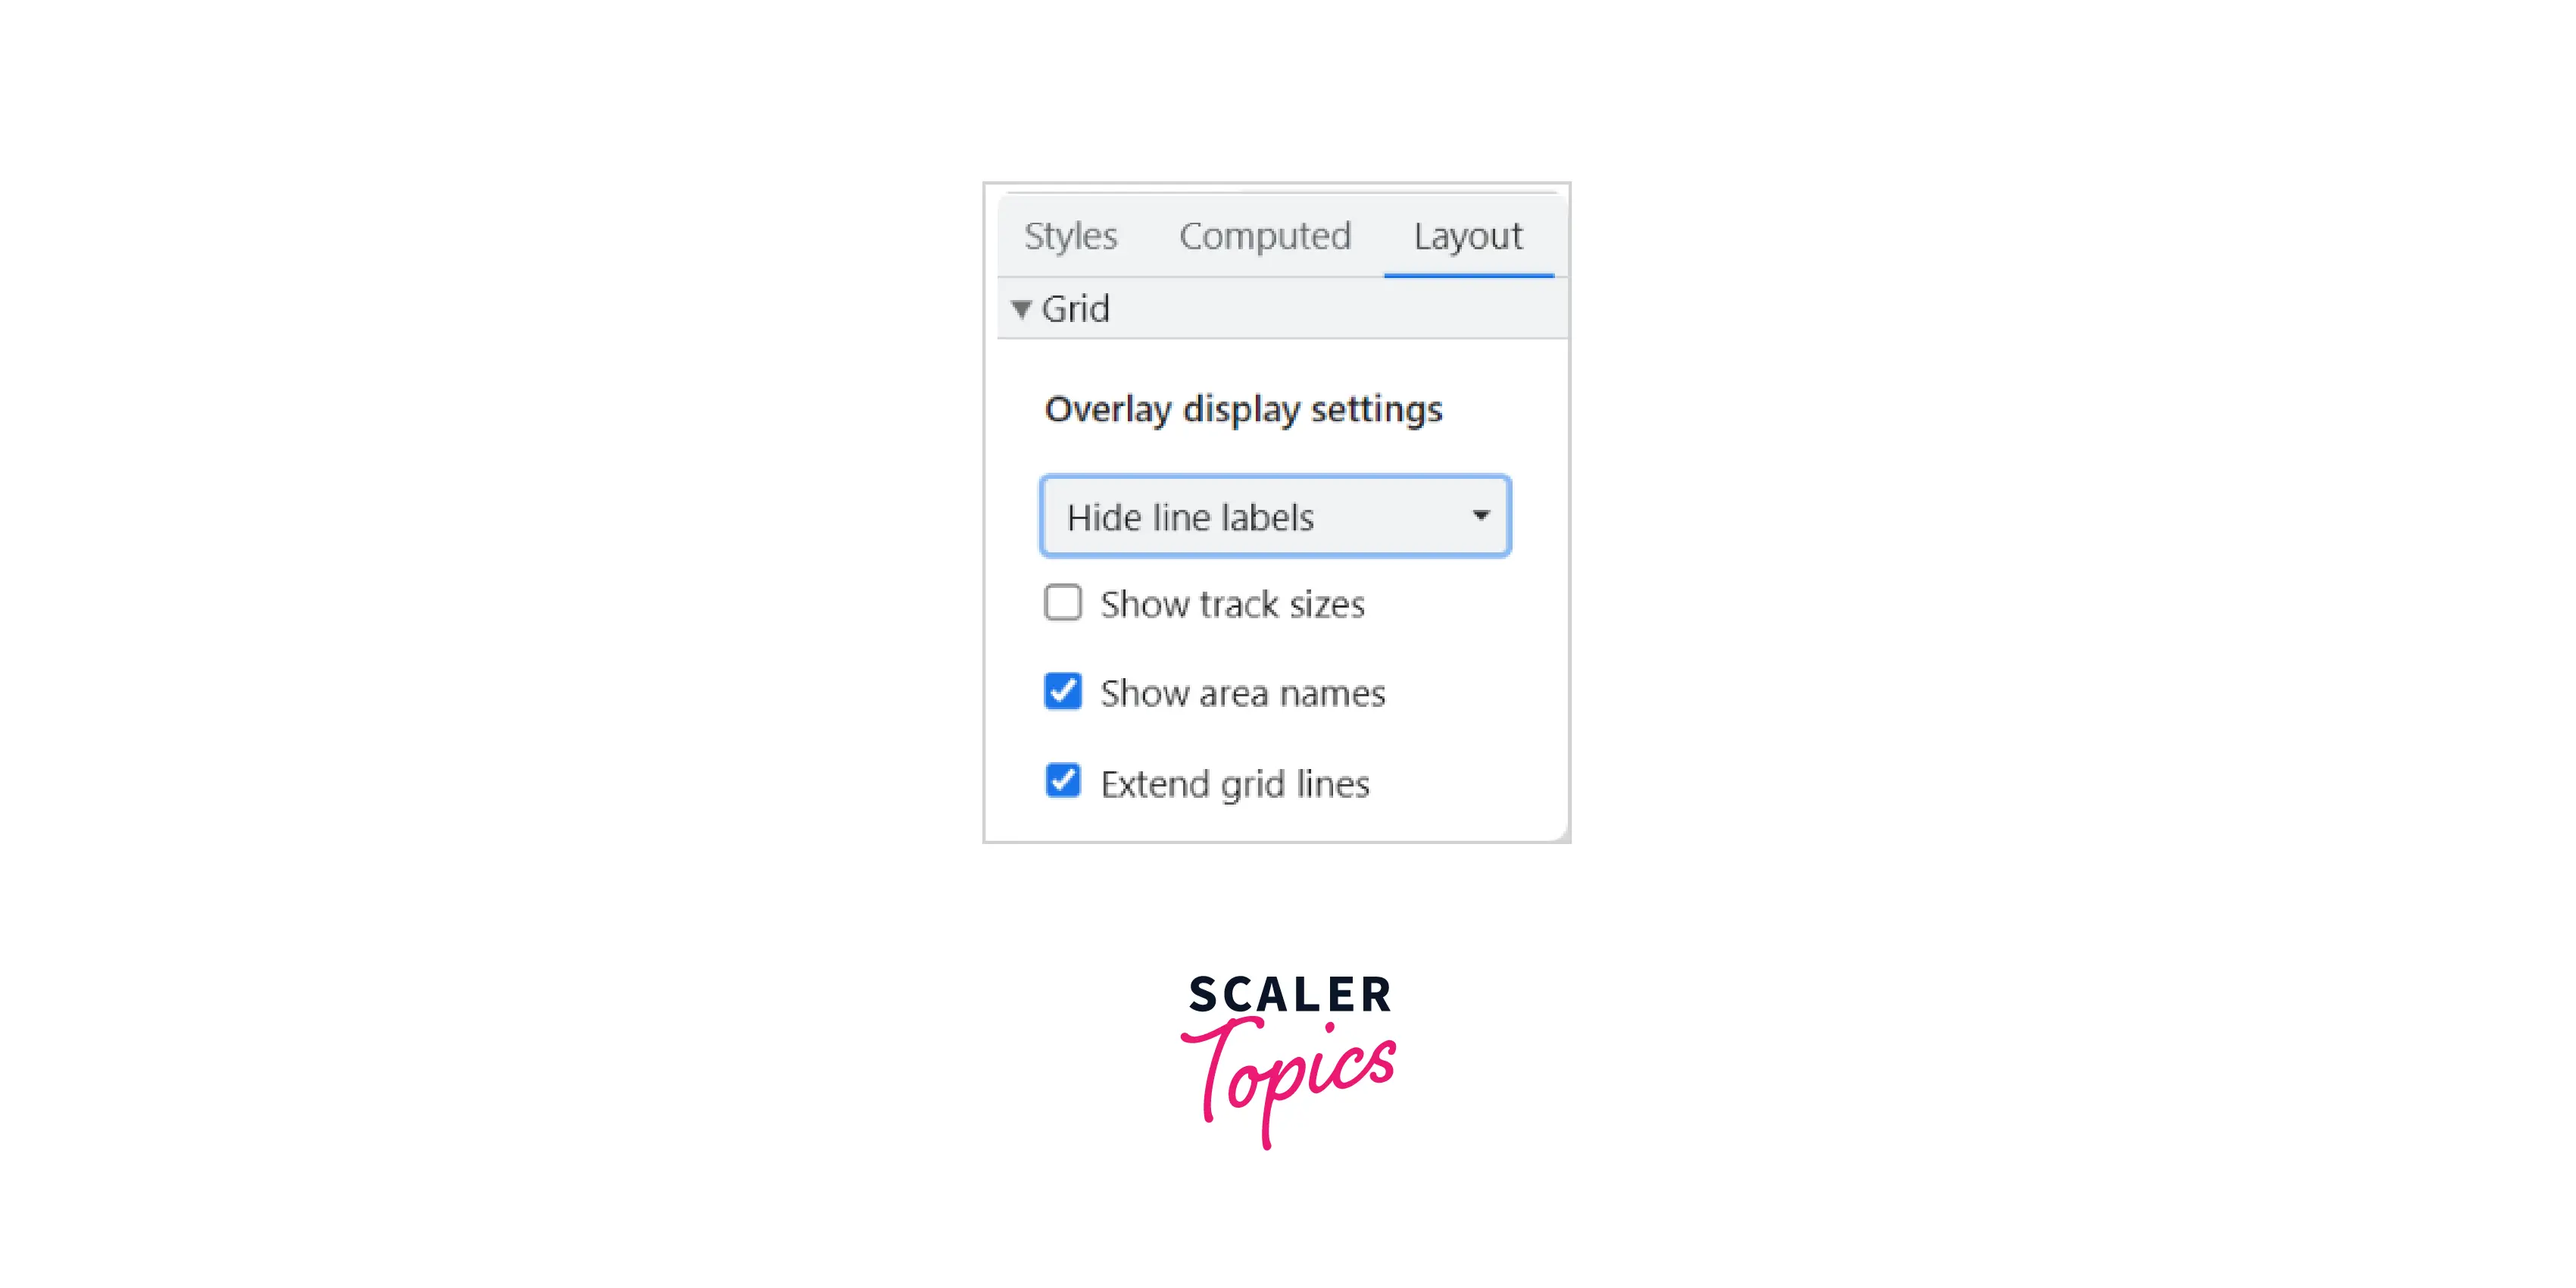
Hide Line Labels:
Hide line labels are an option to hide any form of grid labels visible on the page. Only the grid element will be highlighted.
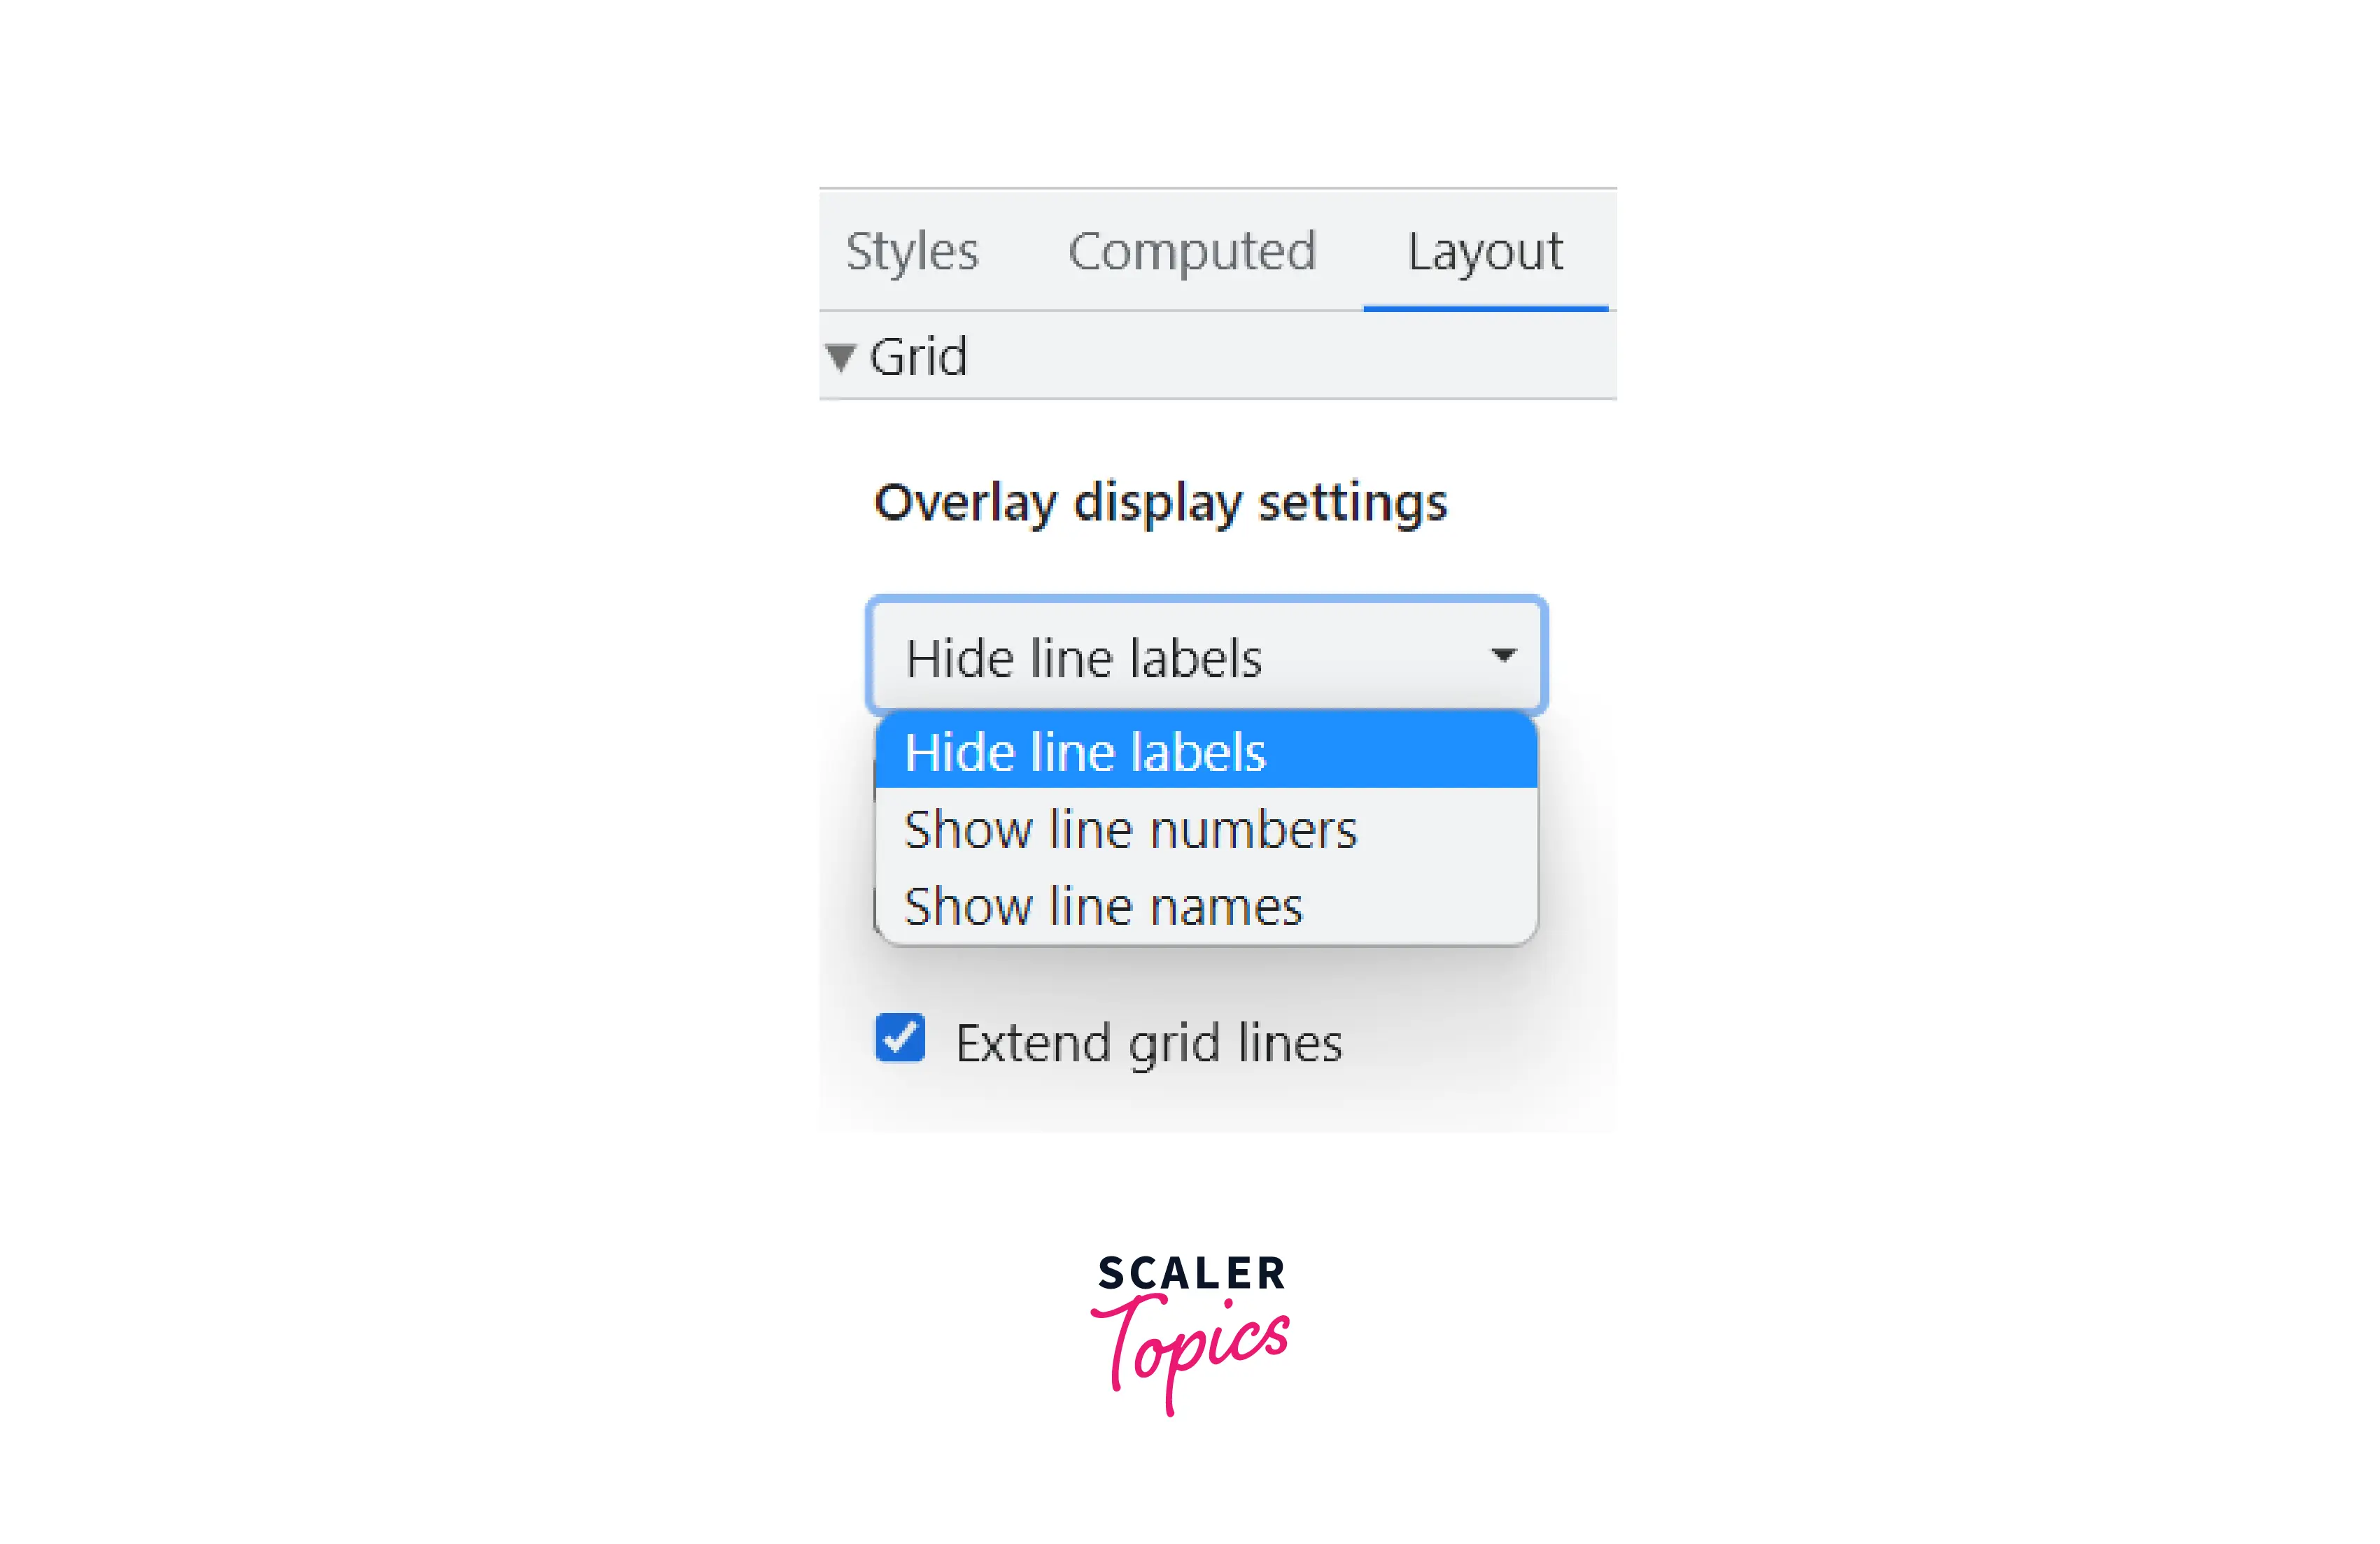
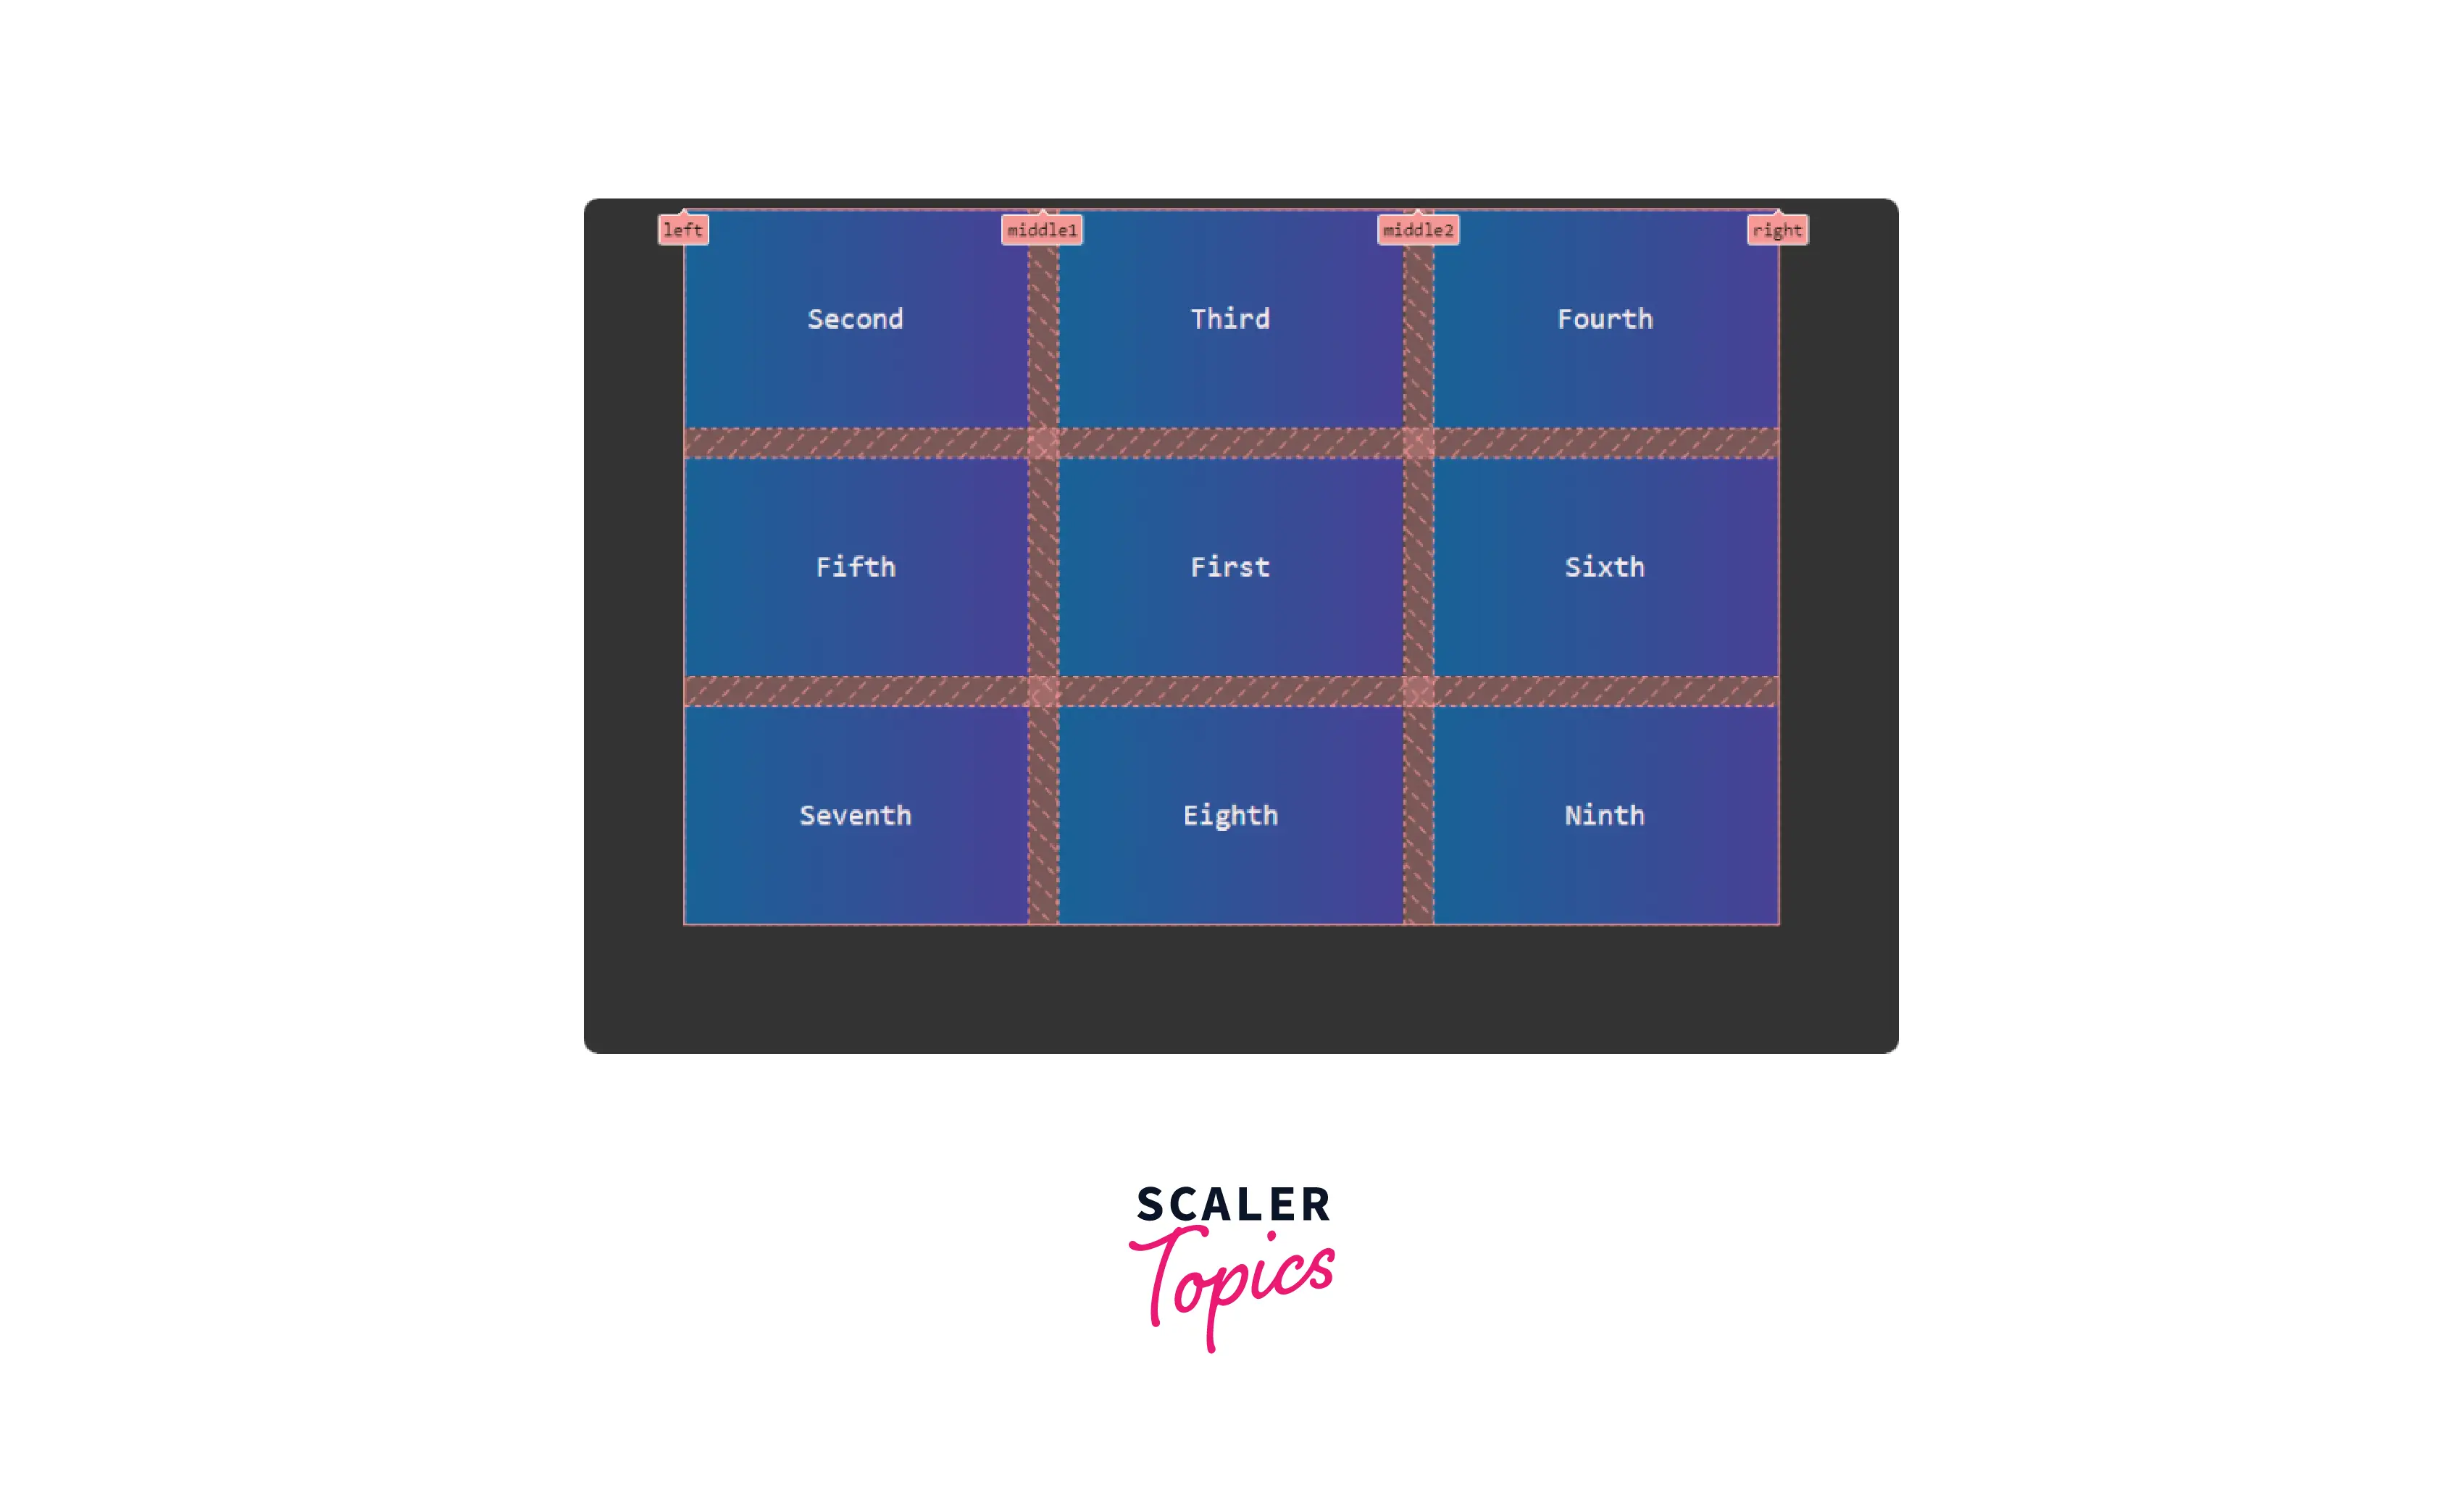
Show Line Labels:
It's ideal to work with numbers when you have less number of grids but as the grids increase, numbers will start to create a mess and it can be complicated.
Show line names is more helpful in this scenario.
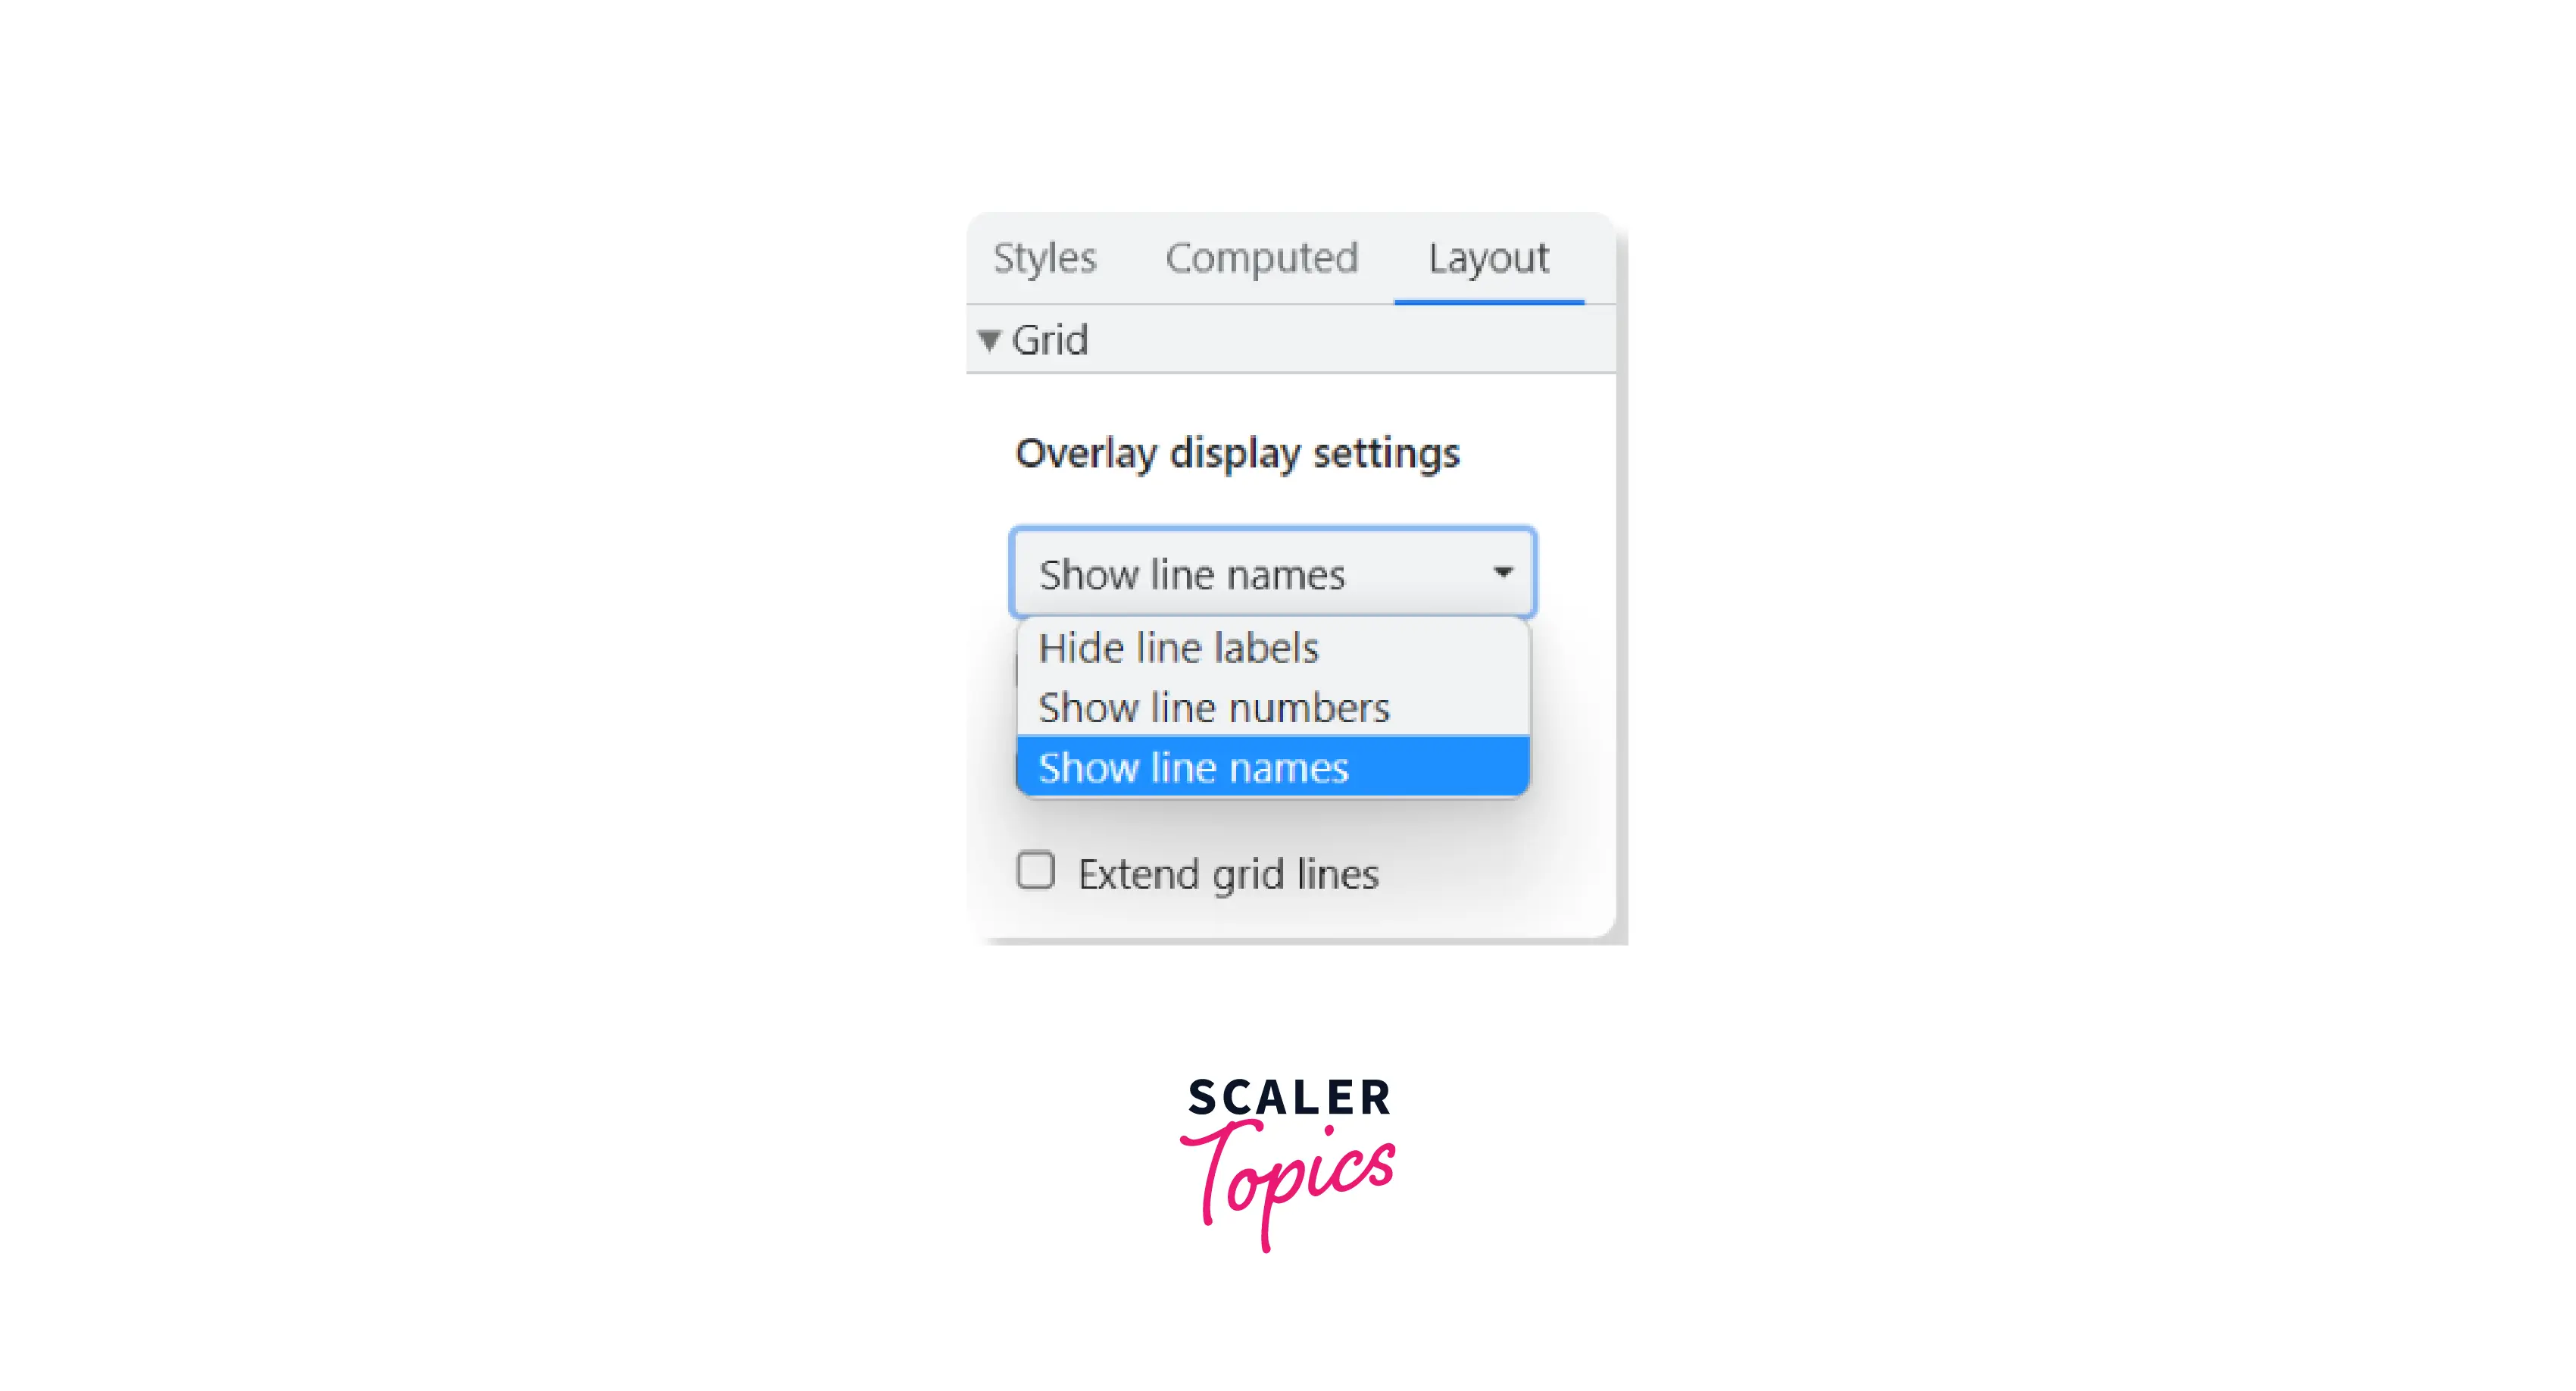
We have four different names for the grid lines: left, right, and middle1, and middle2 for the two lines in the middle.
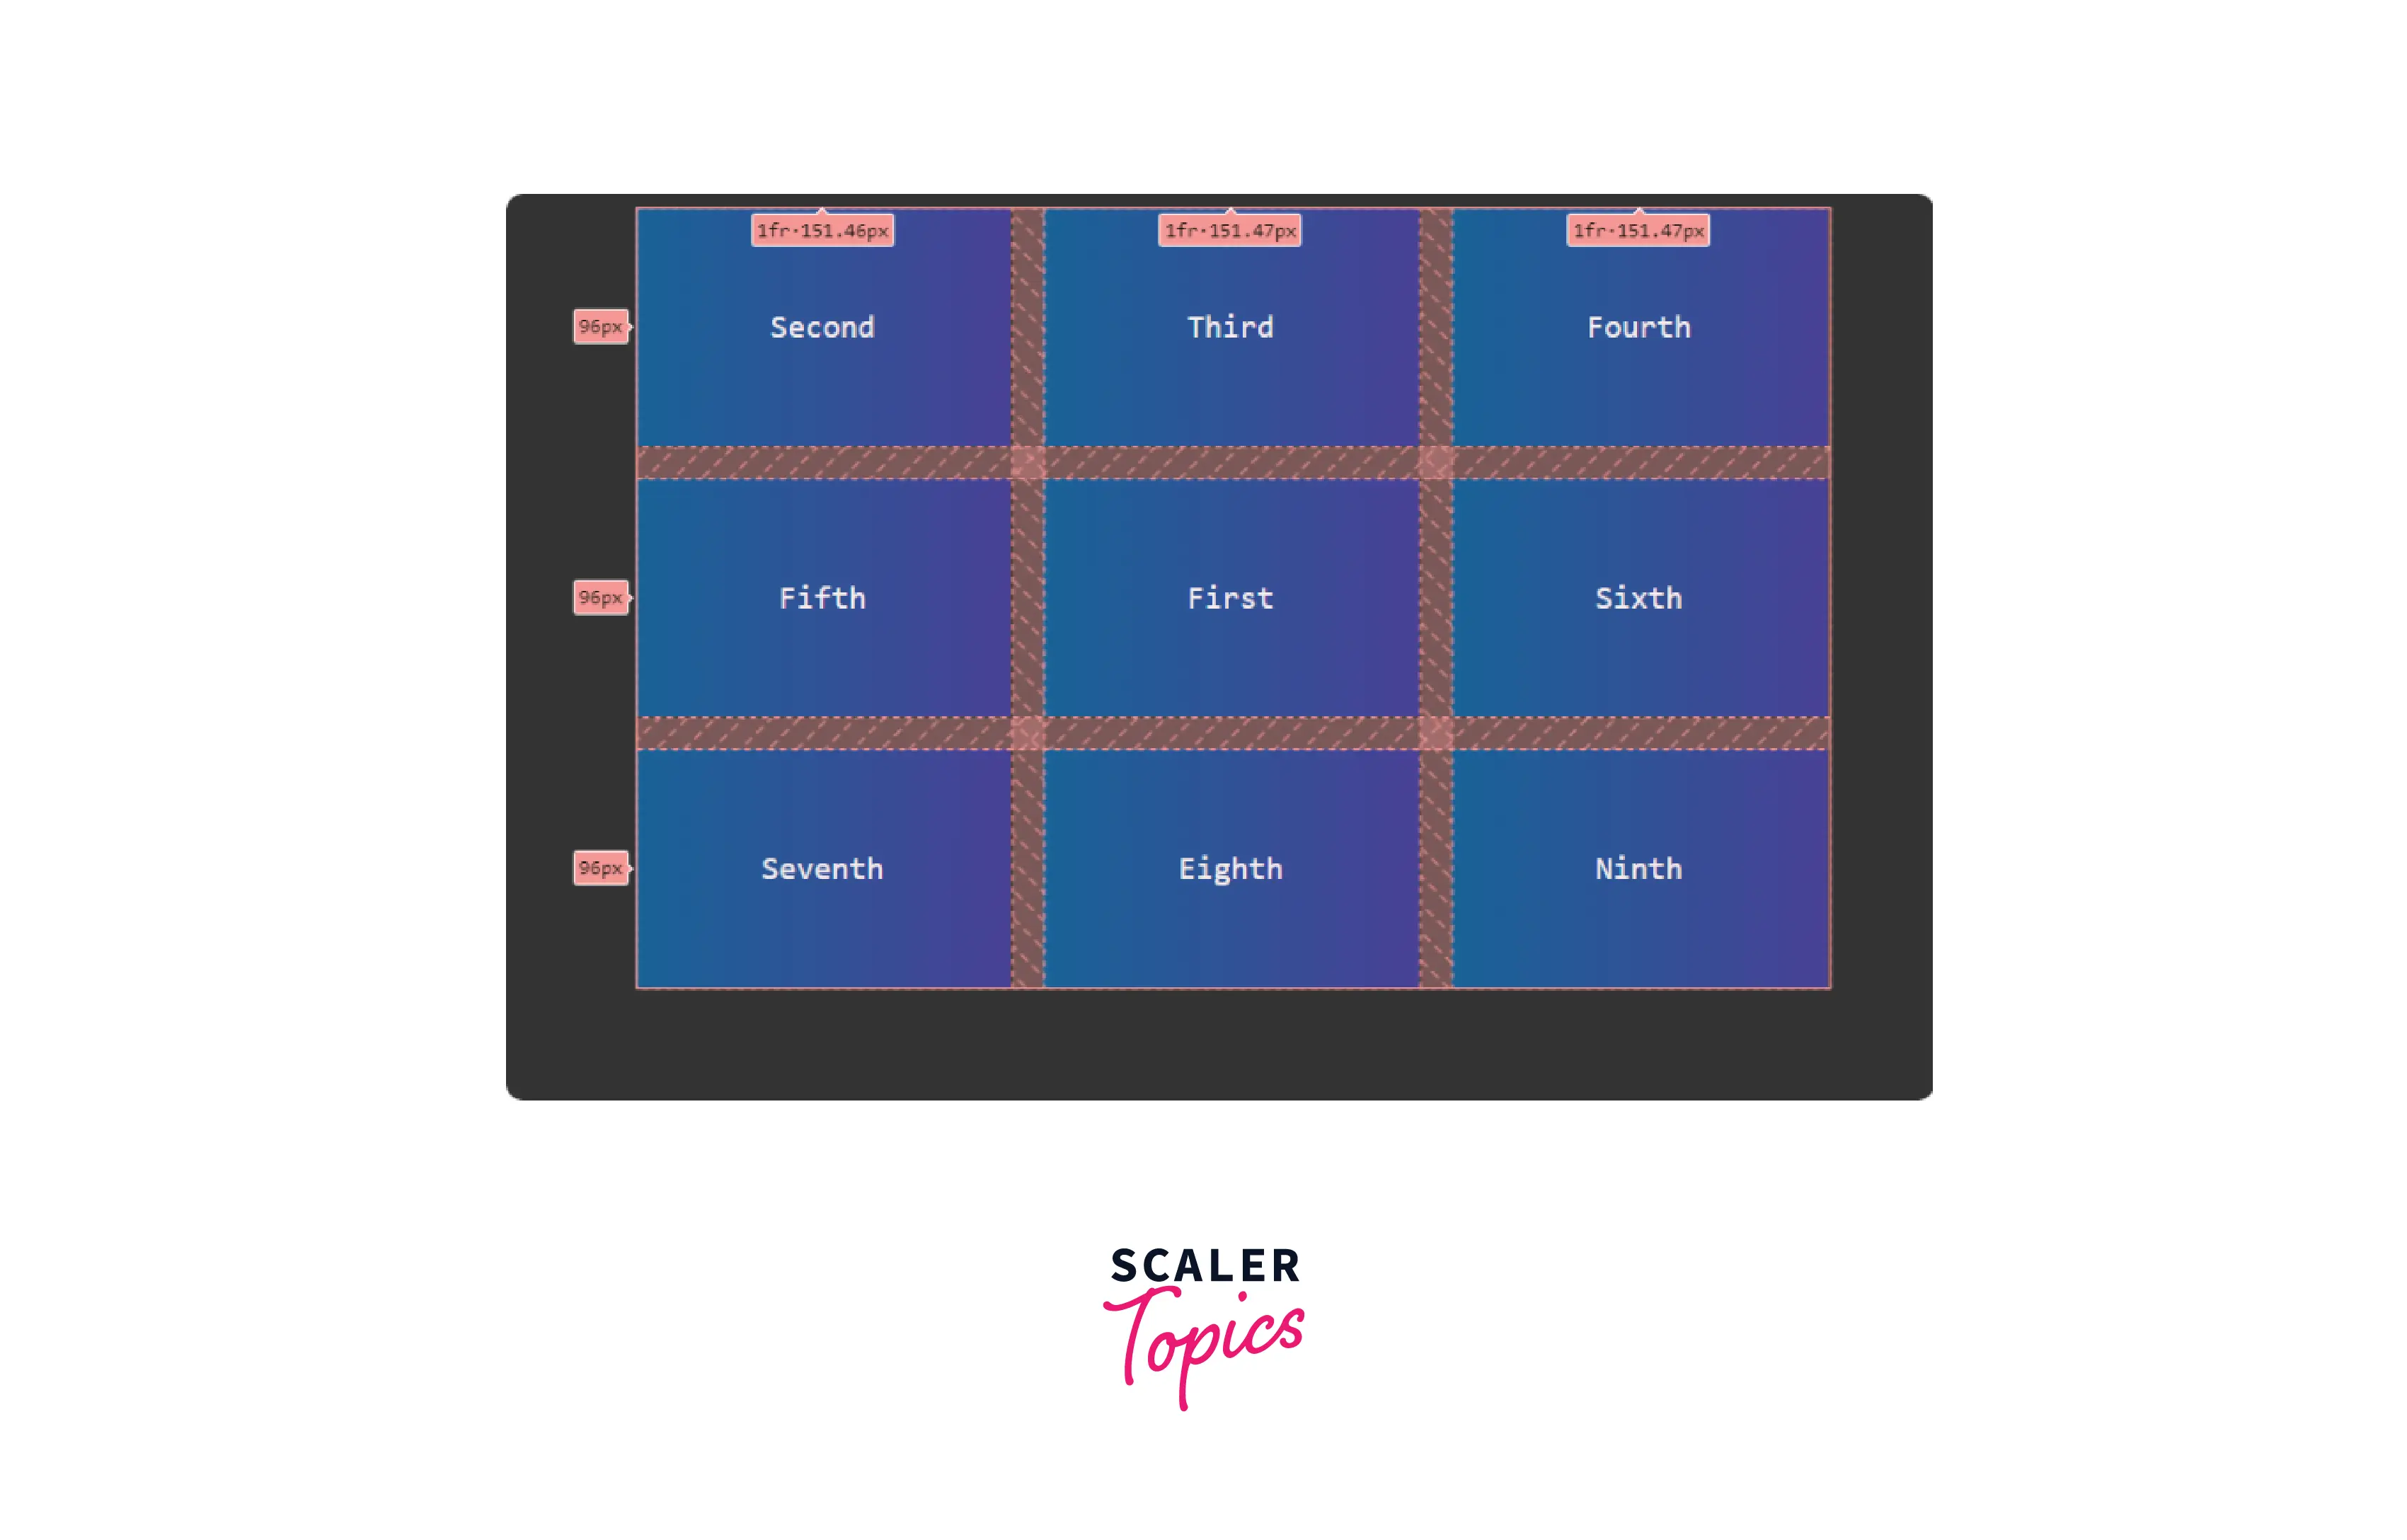
Show Track Sizes:
Show track sizes are used to indicate the track sizes of the grids. On marking its checkbox, every grid child row and column will be represented by the authorized size and computed size connected with a - hyphen.
Authorized size is the size assigned by developers (like us) in our stylesheet.
Computed size, on the other hand, shows the computed size in terms of the actual area of the screen.
Since we have mentioned the columns to have 1fr (fractional unit) of the screen, the track size will be displayed as 1fr-151.47px (authorized - computed). Rows, on the other hand, have no authorized value, so only their computed size (96px) will be displayed.
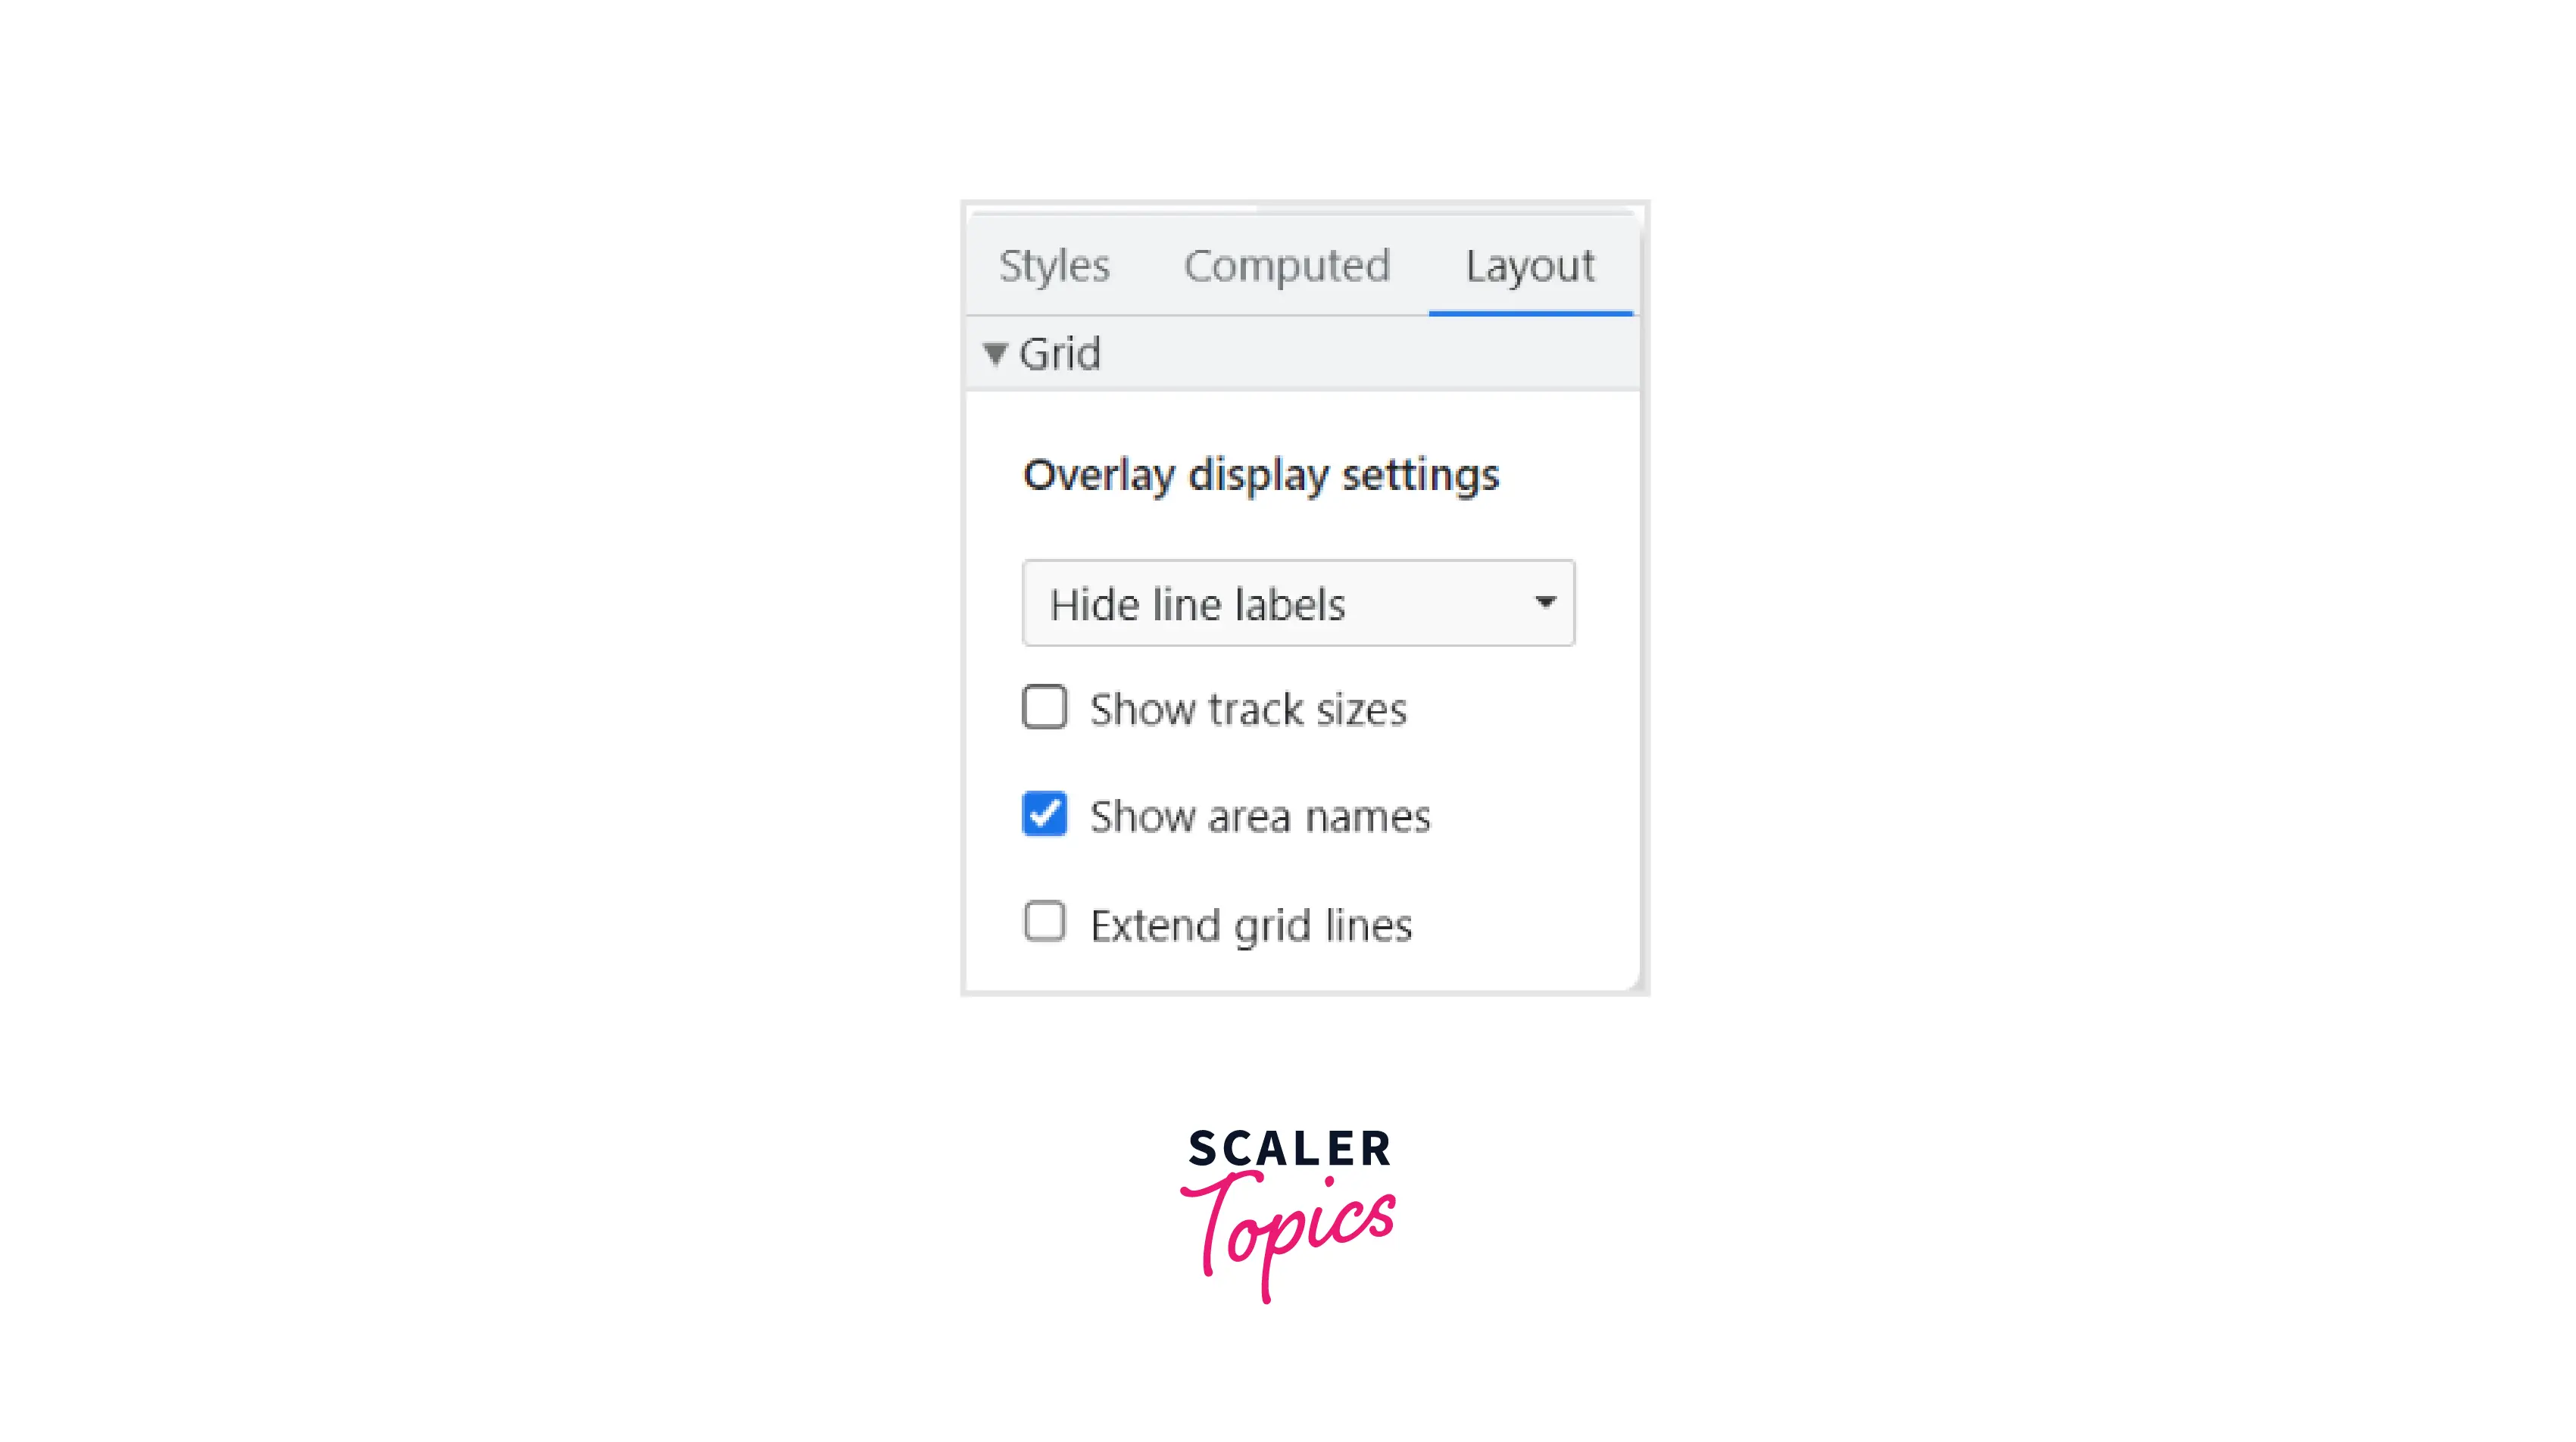
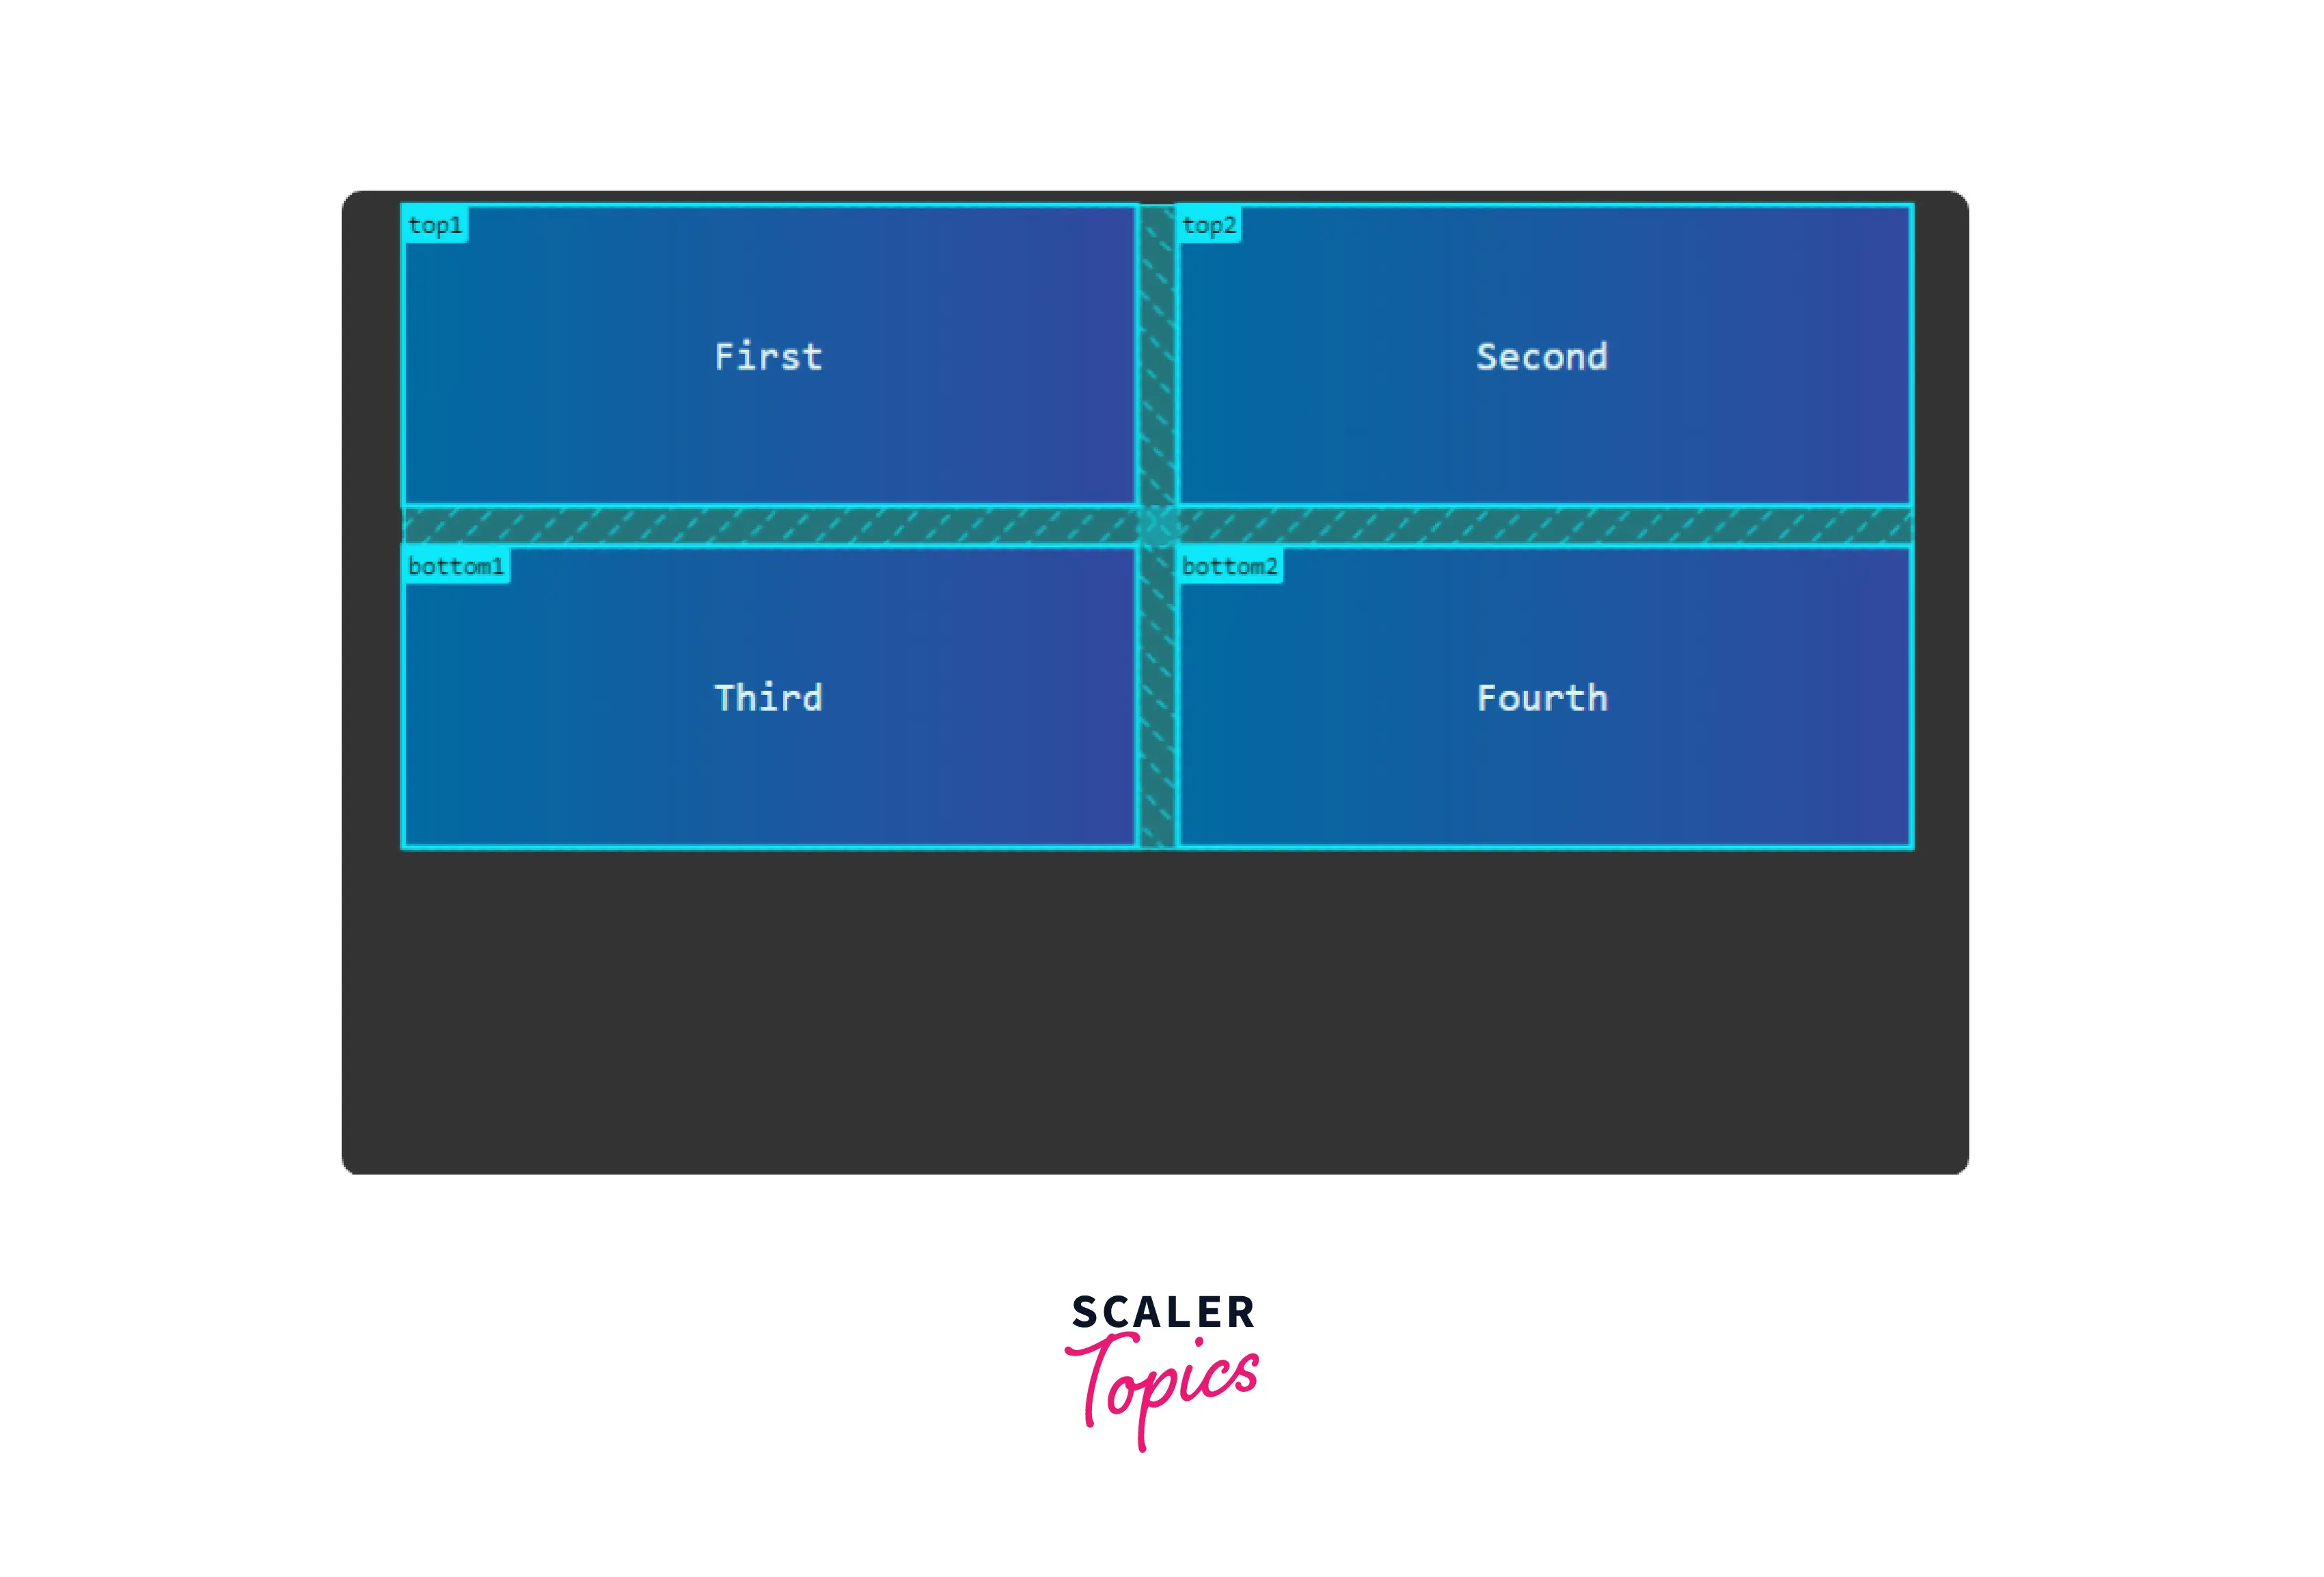
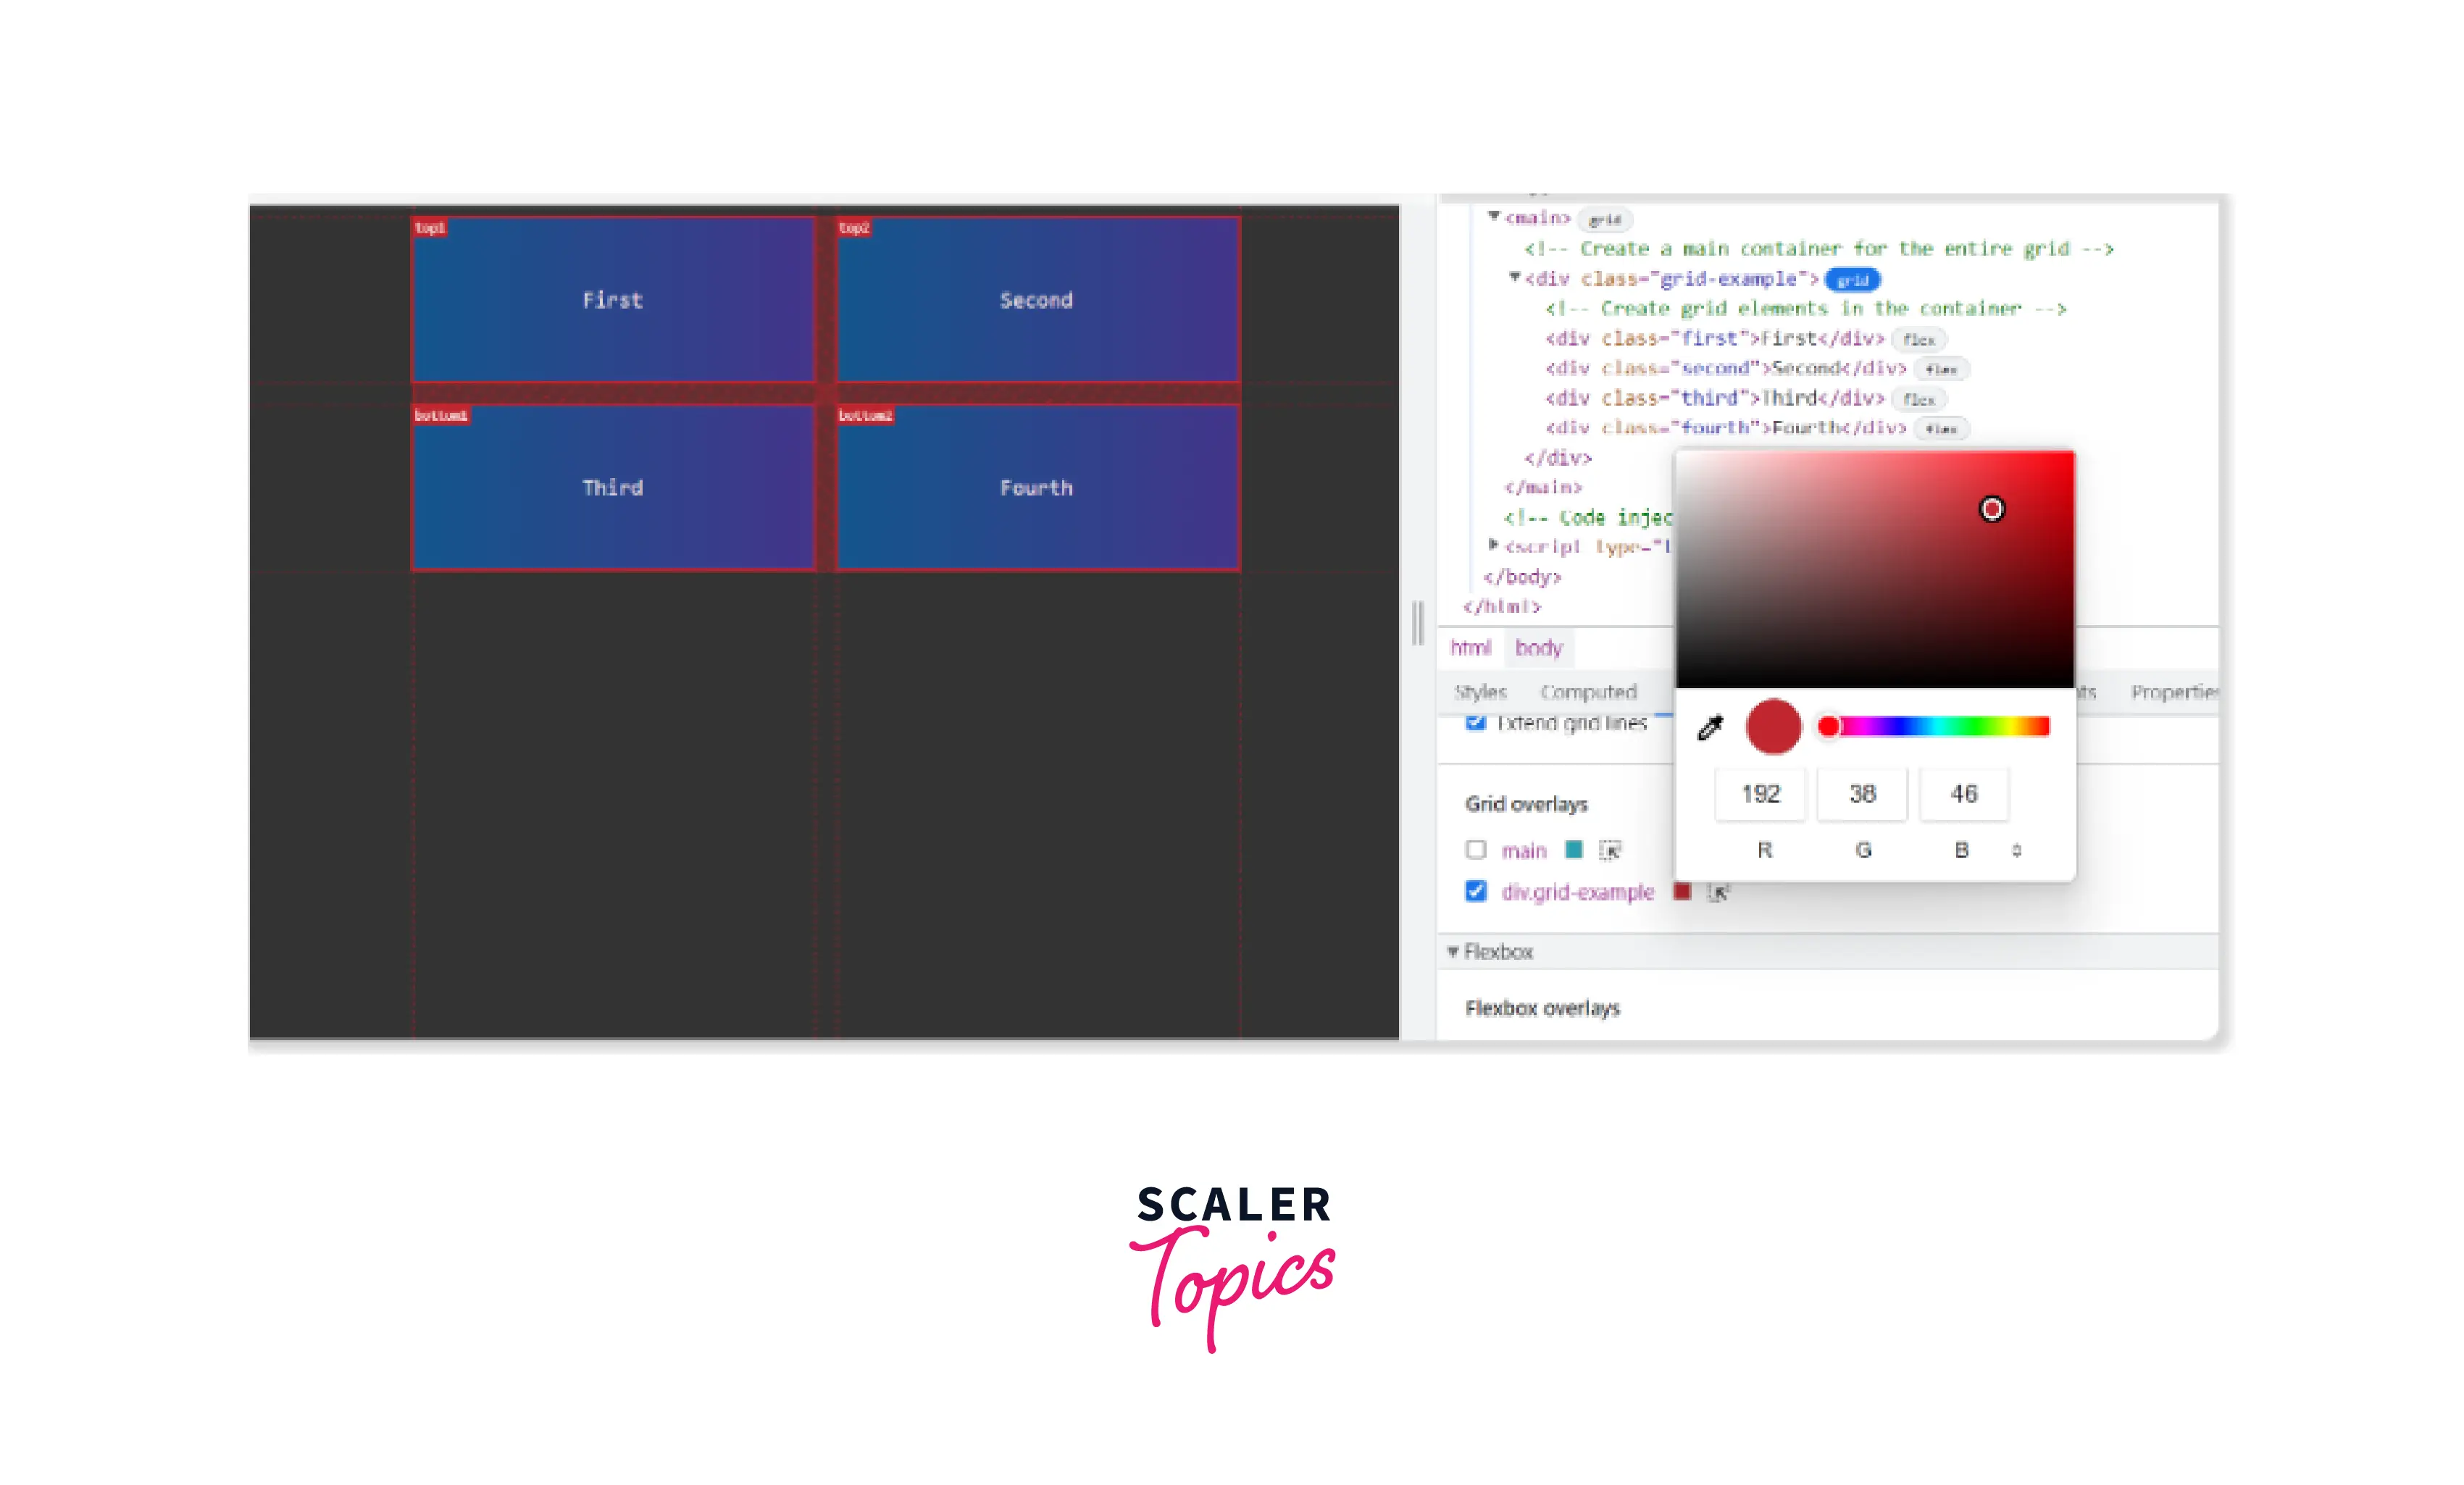
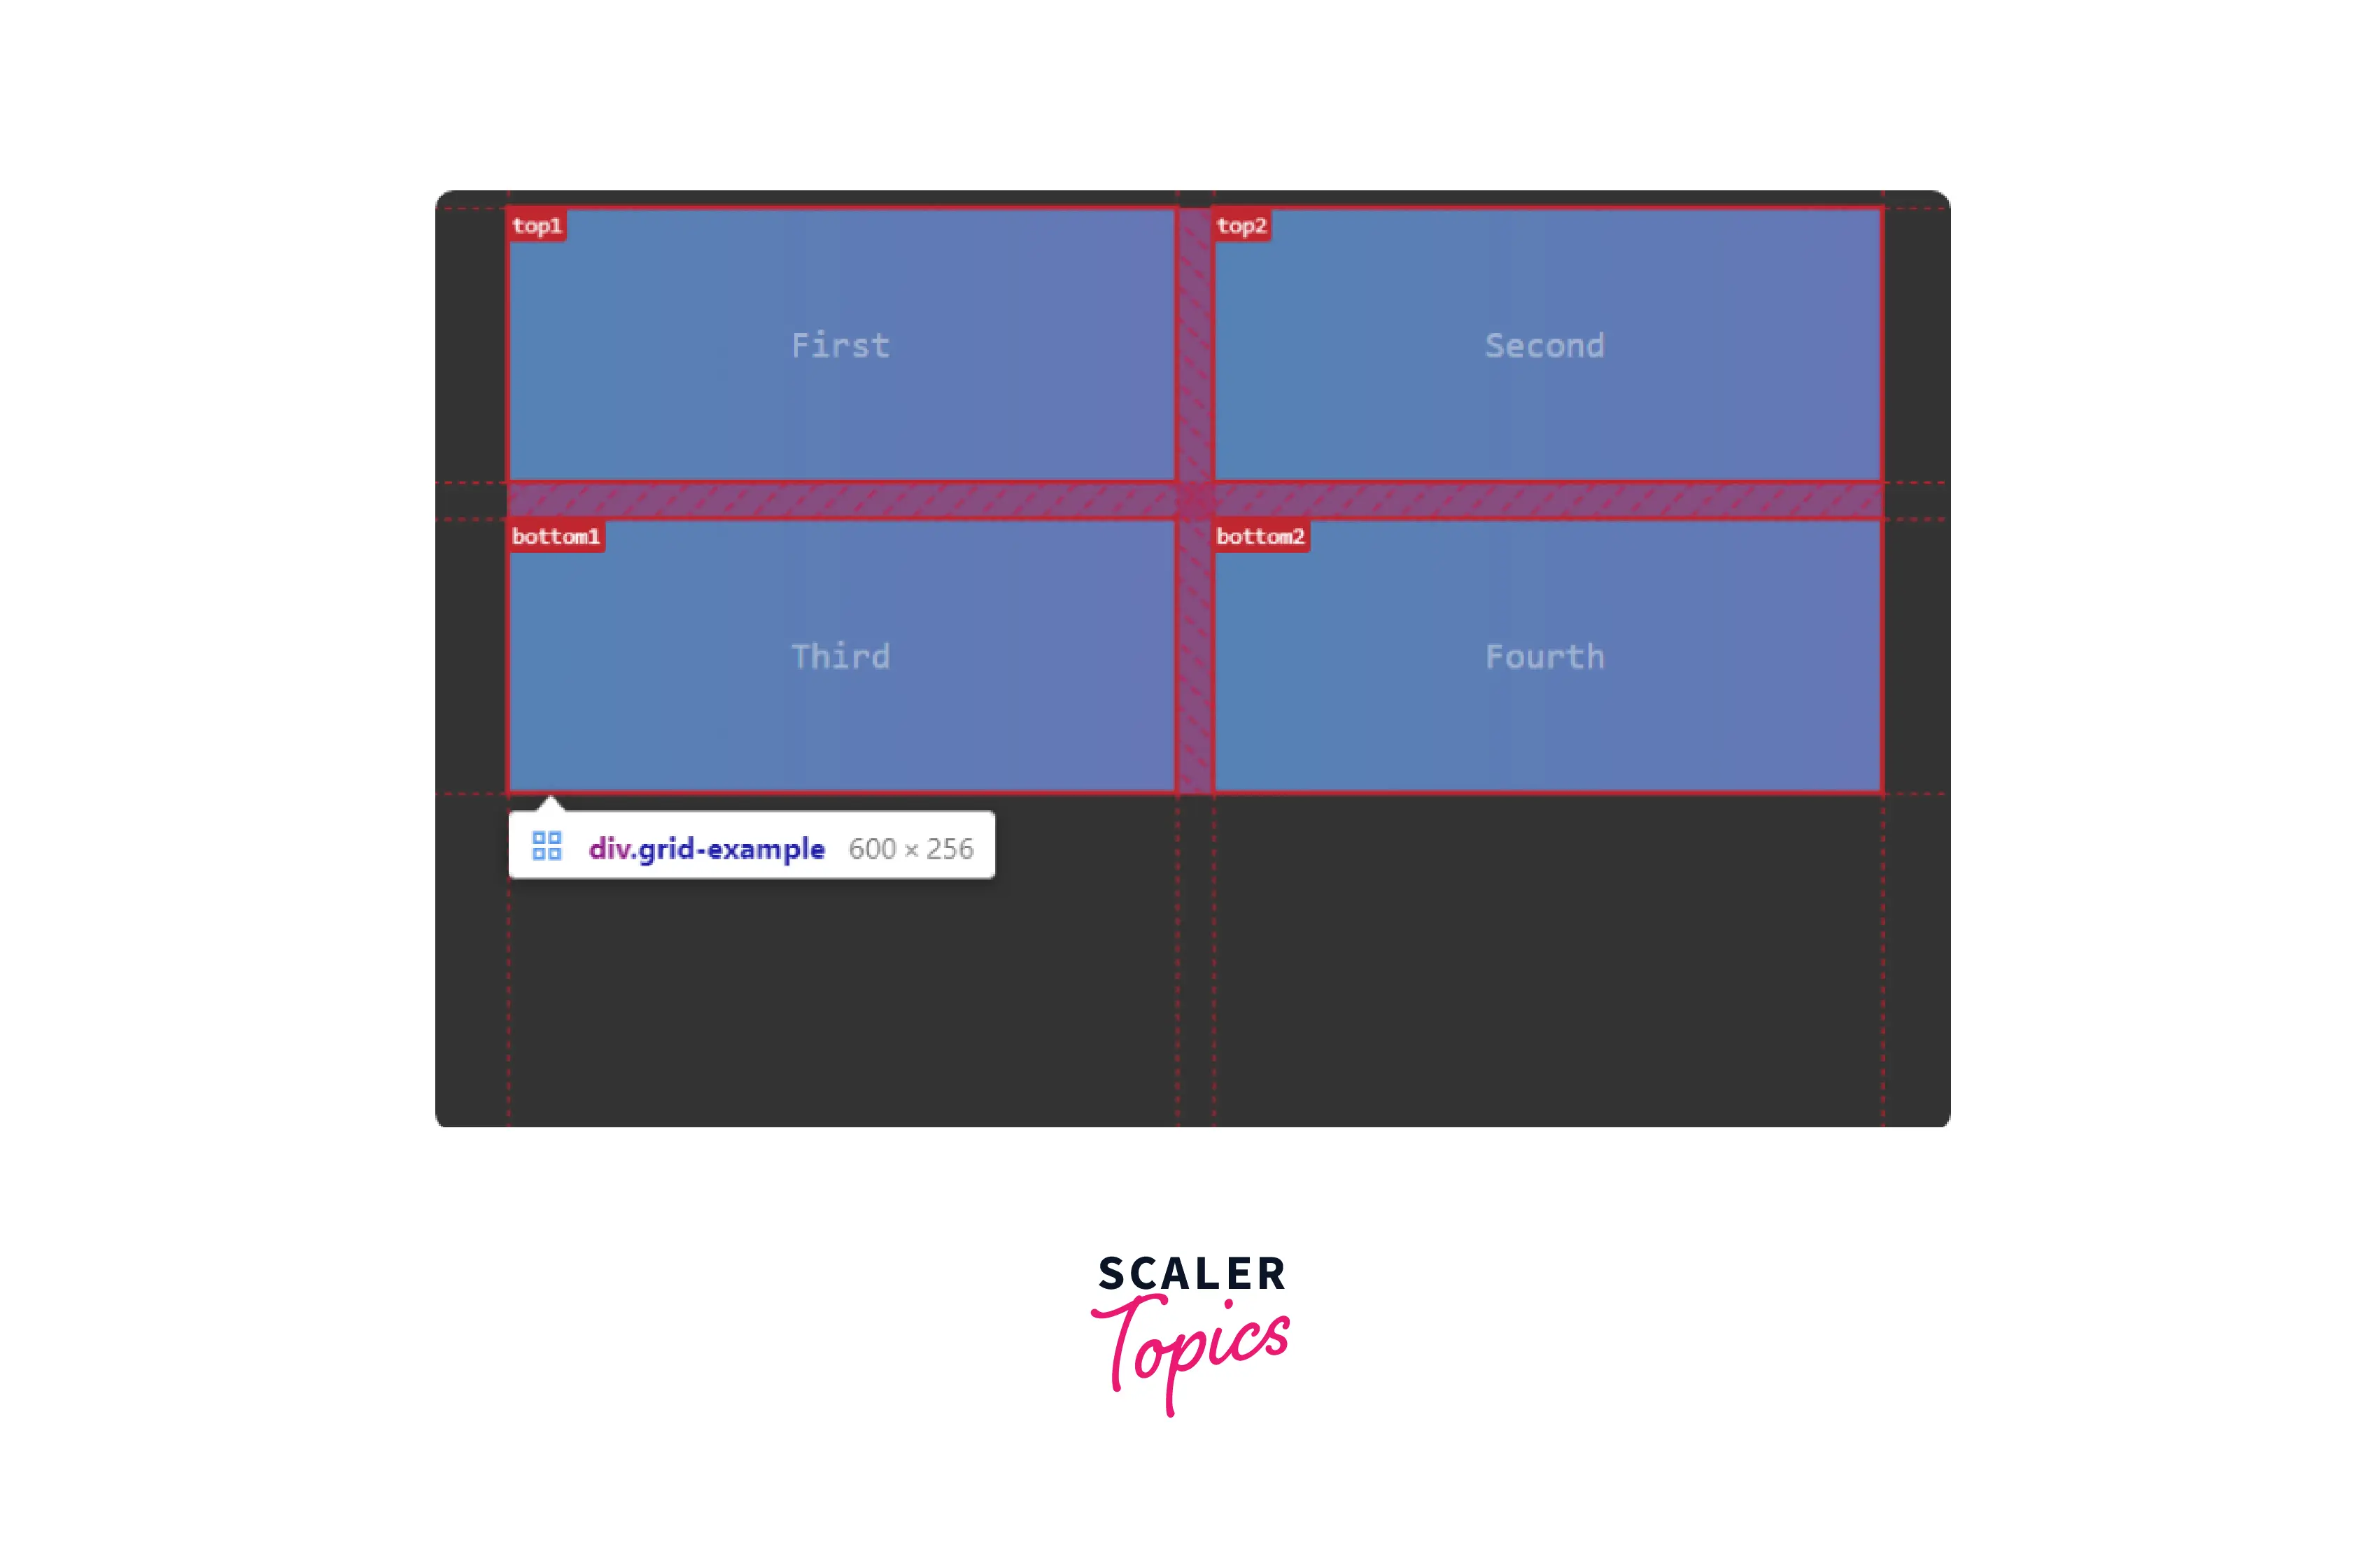
Show Area Names: Let us take up a different code to understand the grid areas properly.
HTML:
A grid area represents the grid cells constituting an area of the entire grid. The property grid-area defines the position and area that a grid cell acquires.
Here, we have taken four grid cells which divided the grid area into top1, top2, bottom1 and bottom2.
CSS:
Under the Layout panel, click on the checkbox Show area names.
The result with the mentioned area names would appear like this:
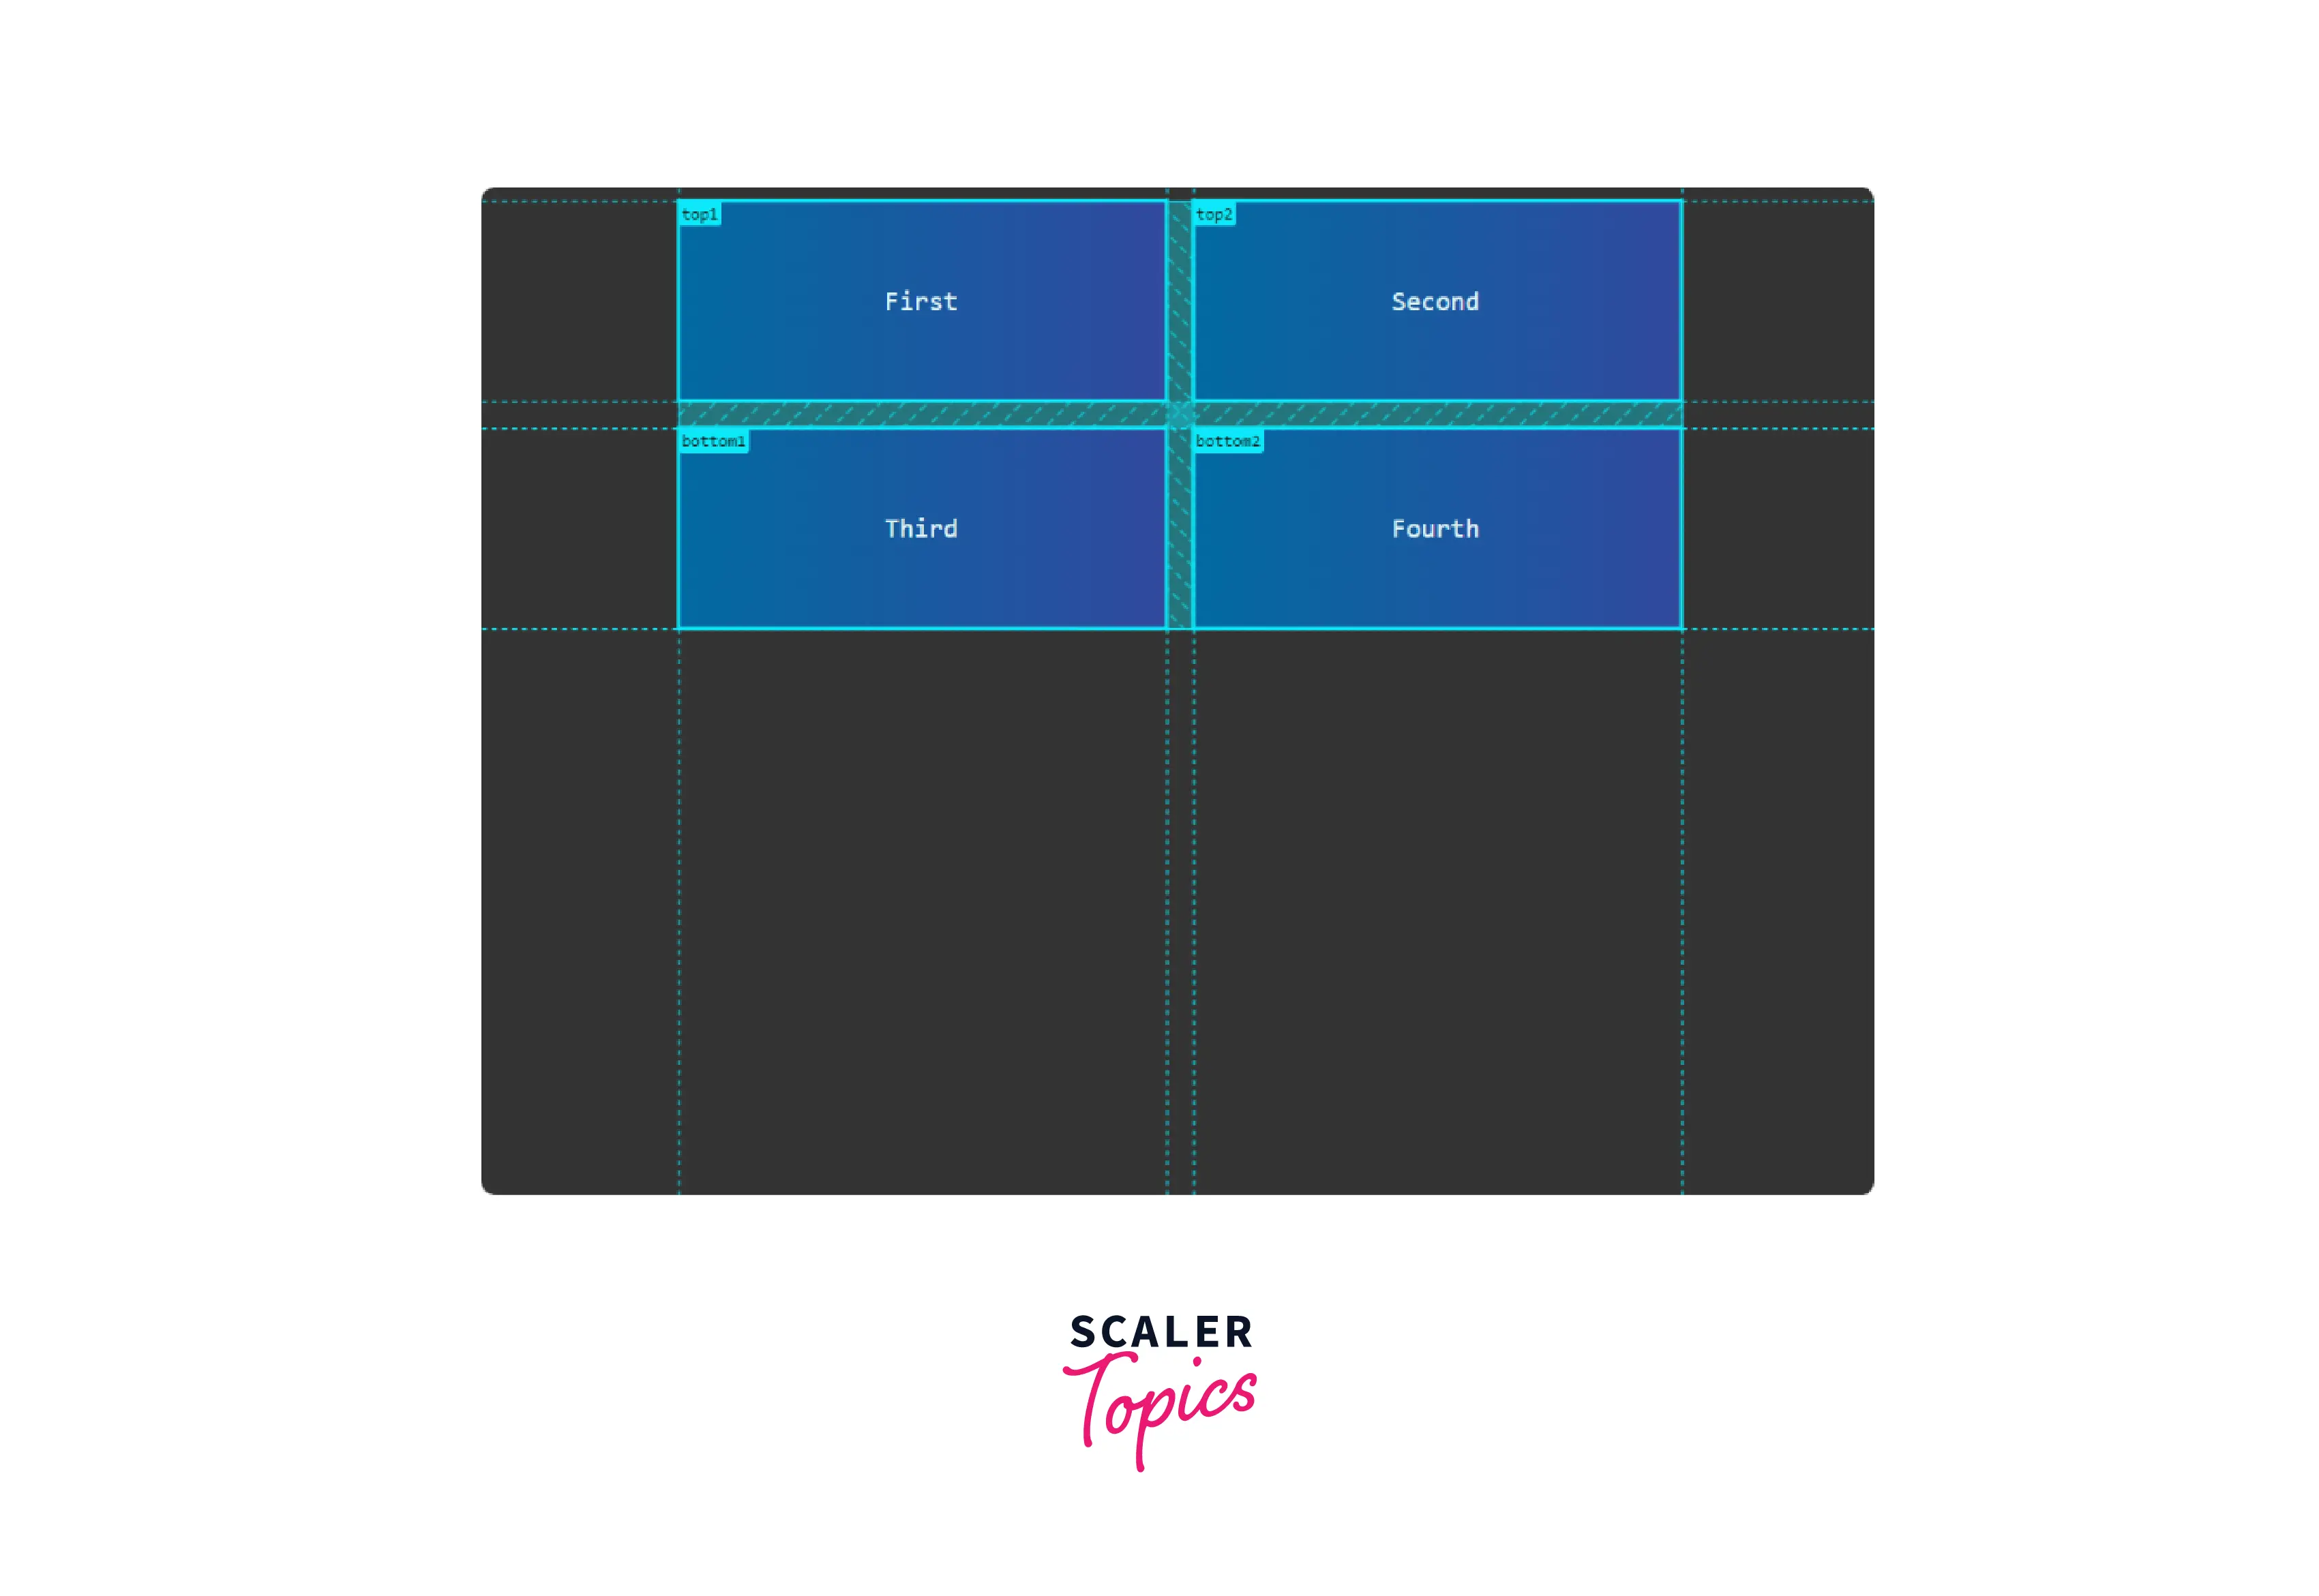
Extend Grid Lines:
If you wish to see the alignment of the grid concerning the viewport (visible area on the screen), you can extend the grid lines to the extremes of the viewport.
The Extend grid lines option is present under the Show area names in the Overlay display settings.
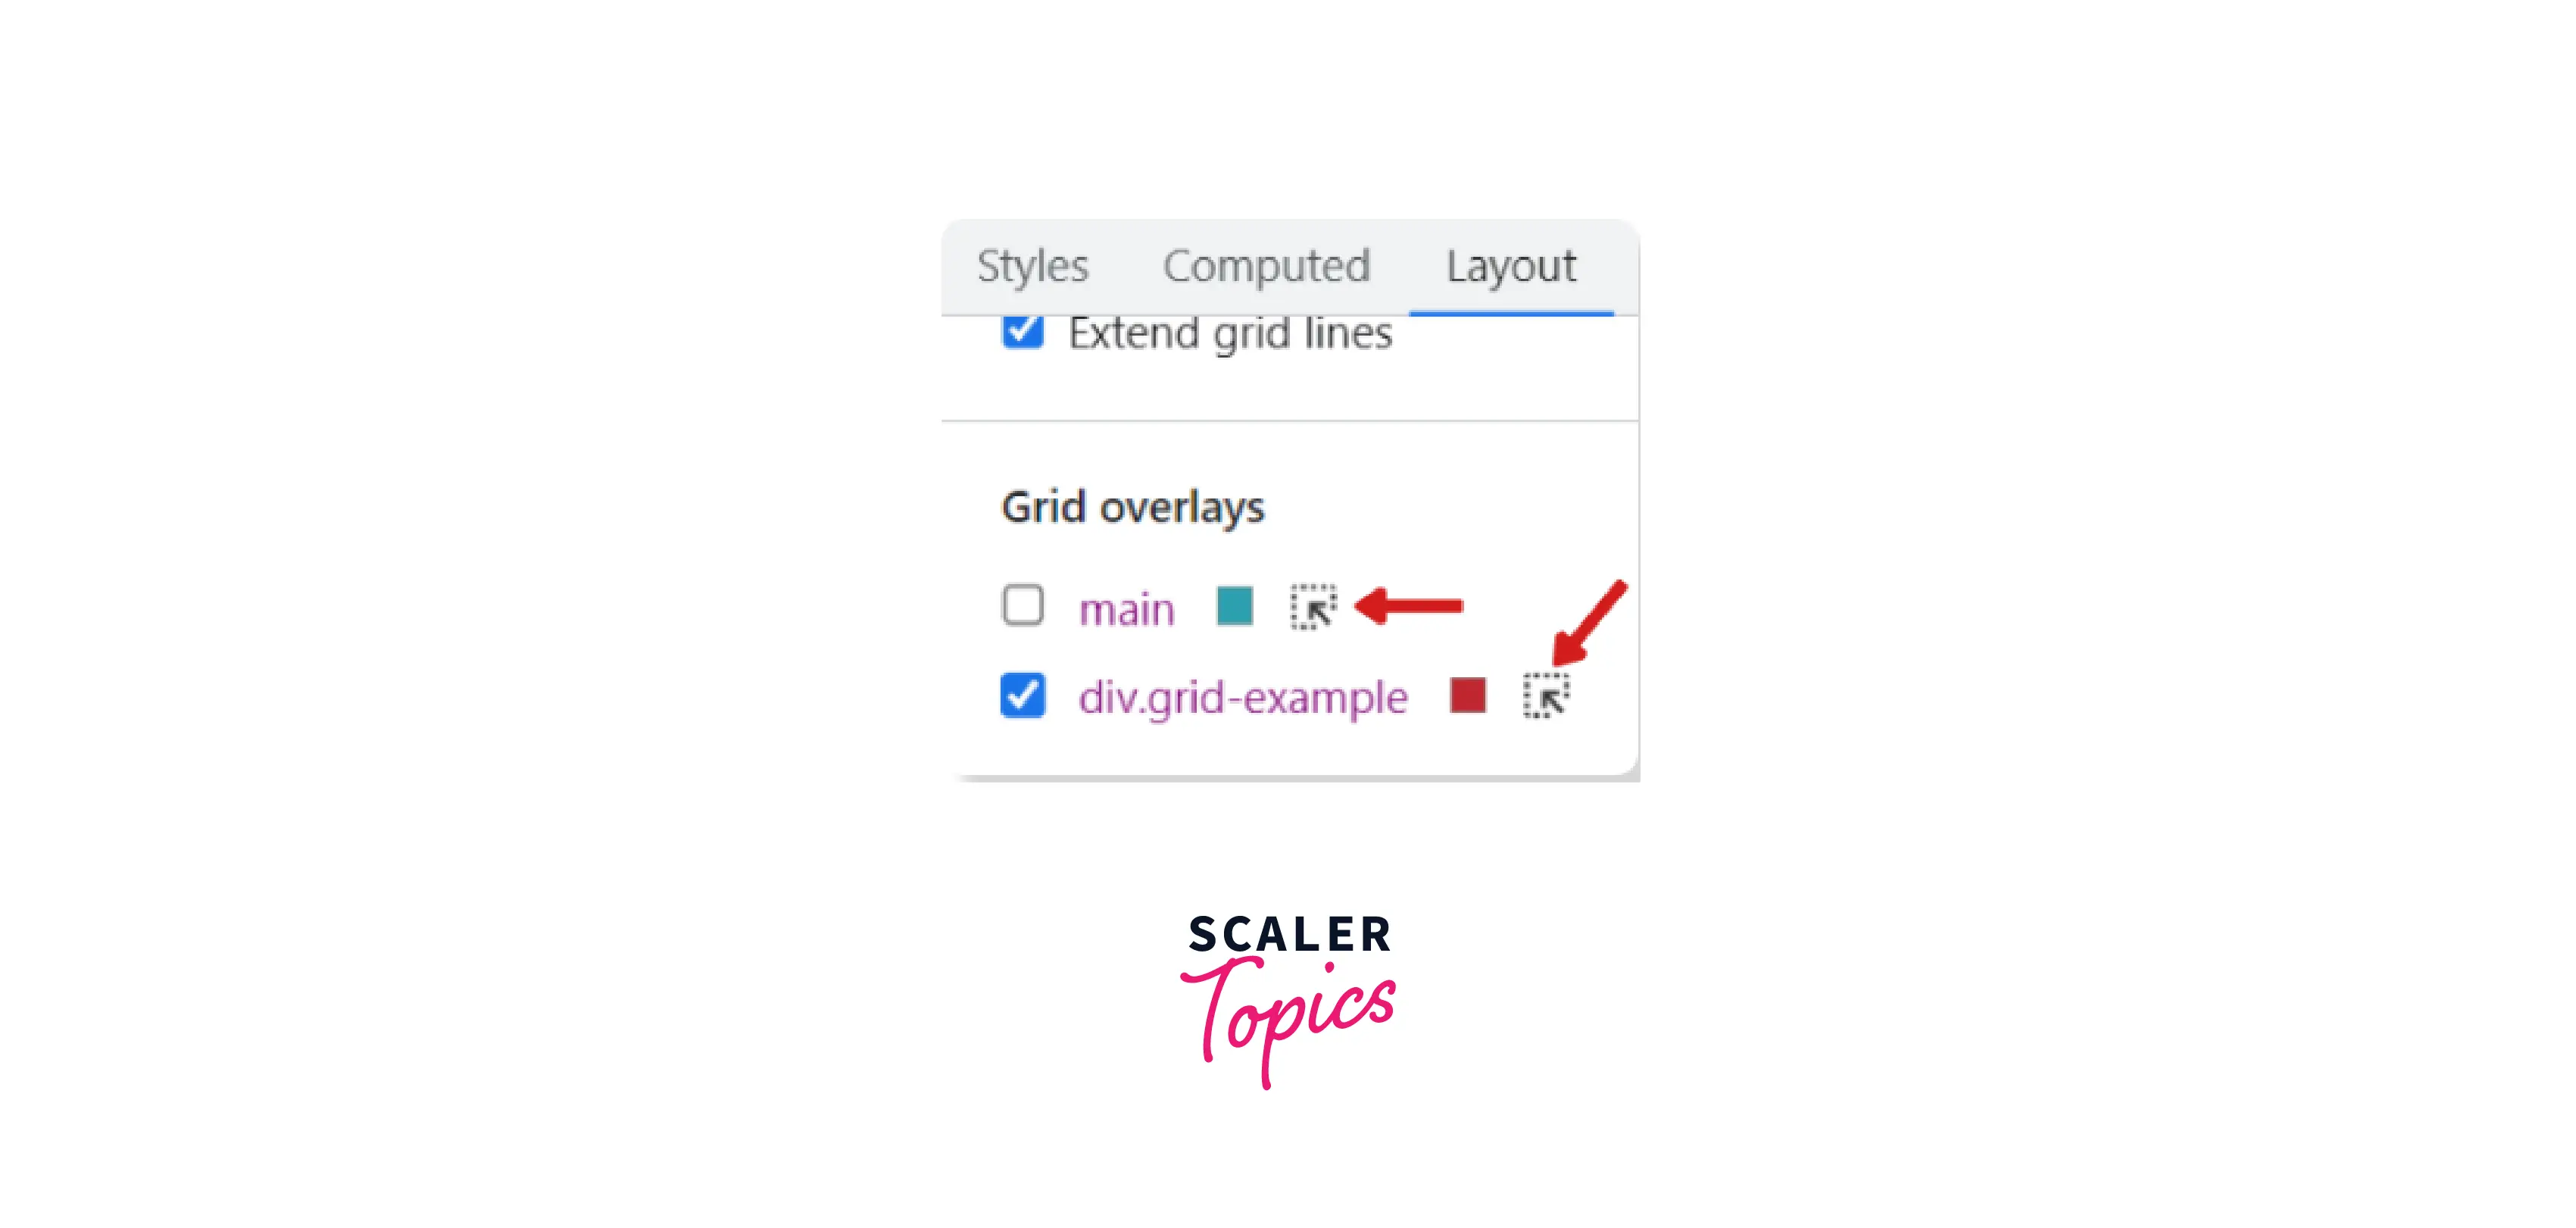
Grid overlays
Enable overlay views of multiple grids:
You can choose to see the overlay view of multiple grids at a time. The HTML element with display: grid or display: inline-grid will be shown in this area where you can choose to see the overlay view of one or more grids.
In the Layout panel, scroll down to the Grid overlays section after the Overlay display settings.
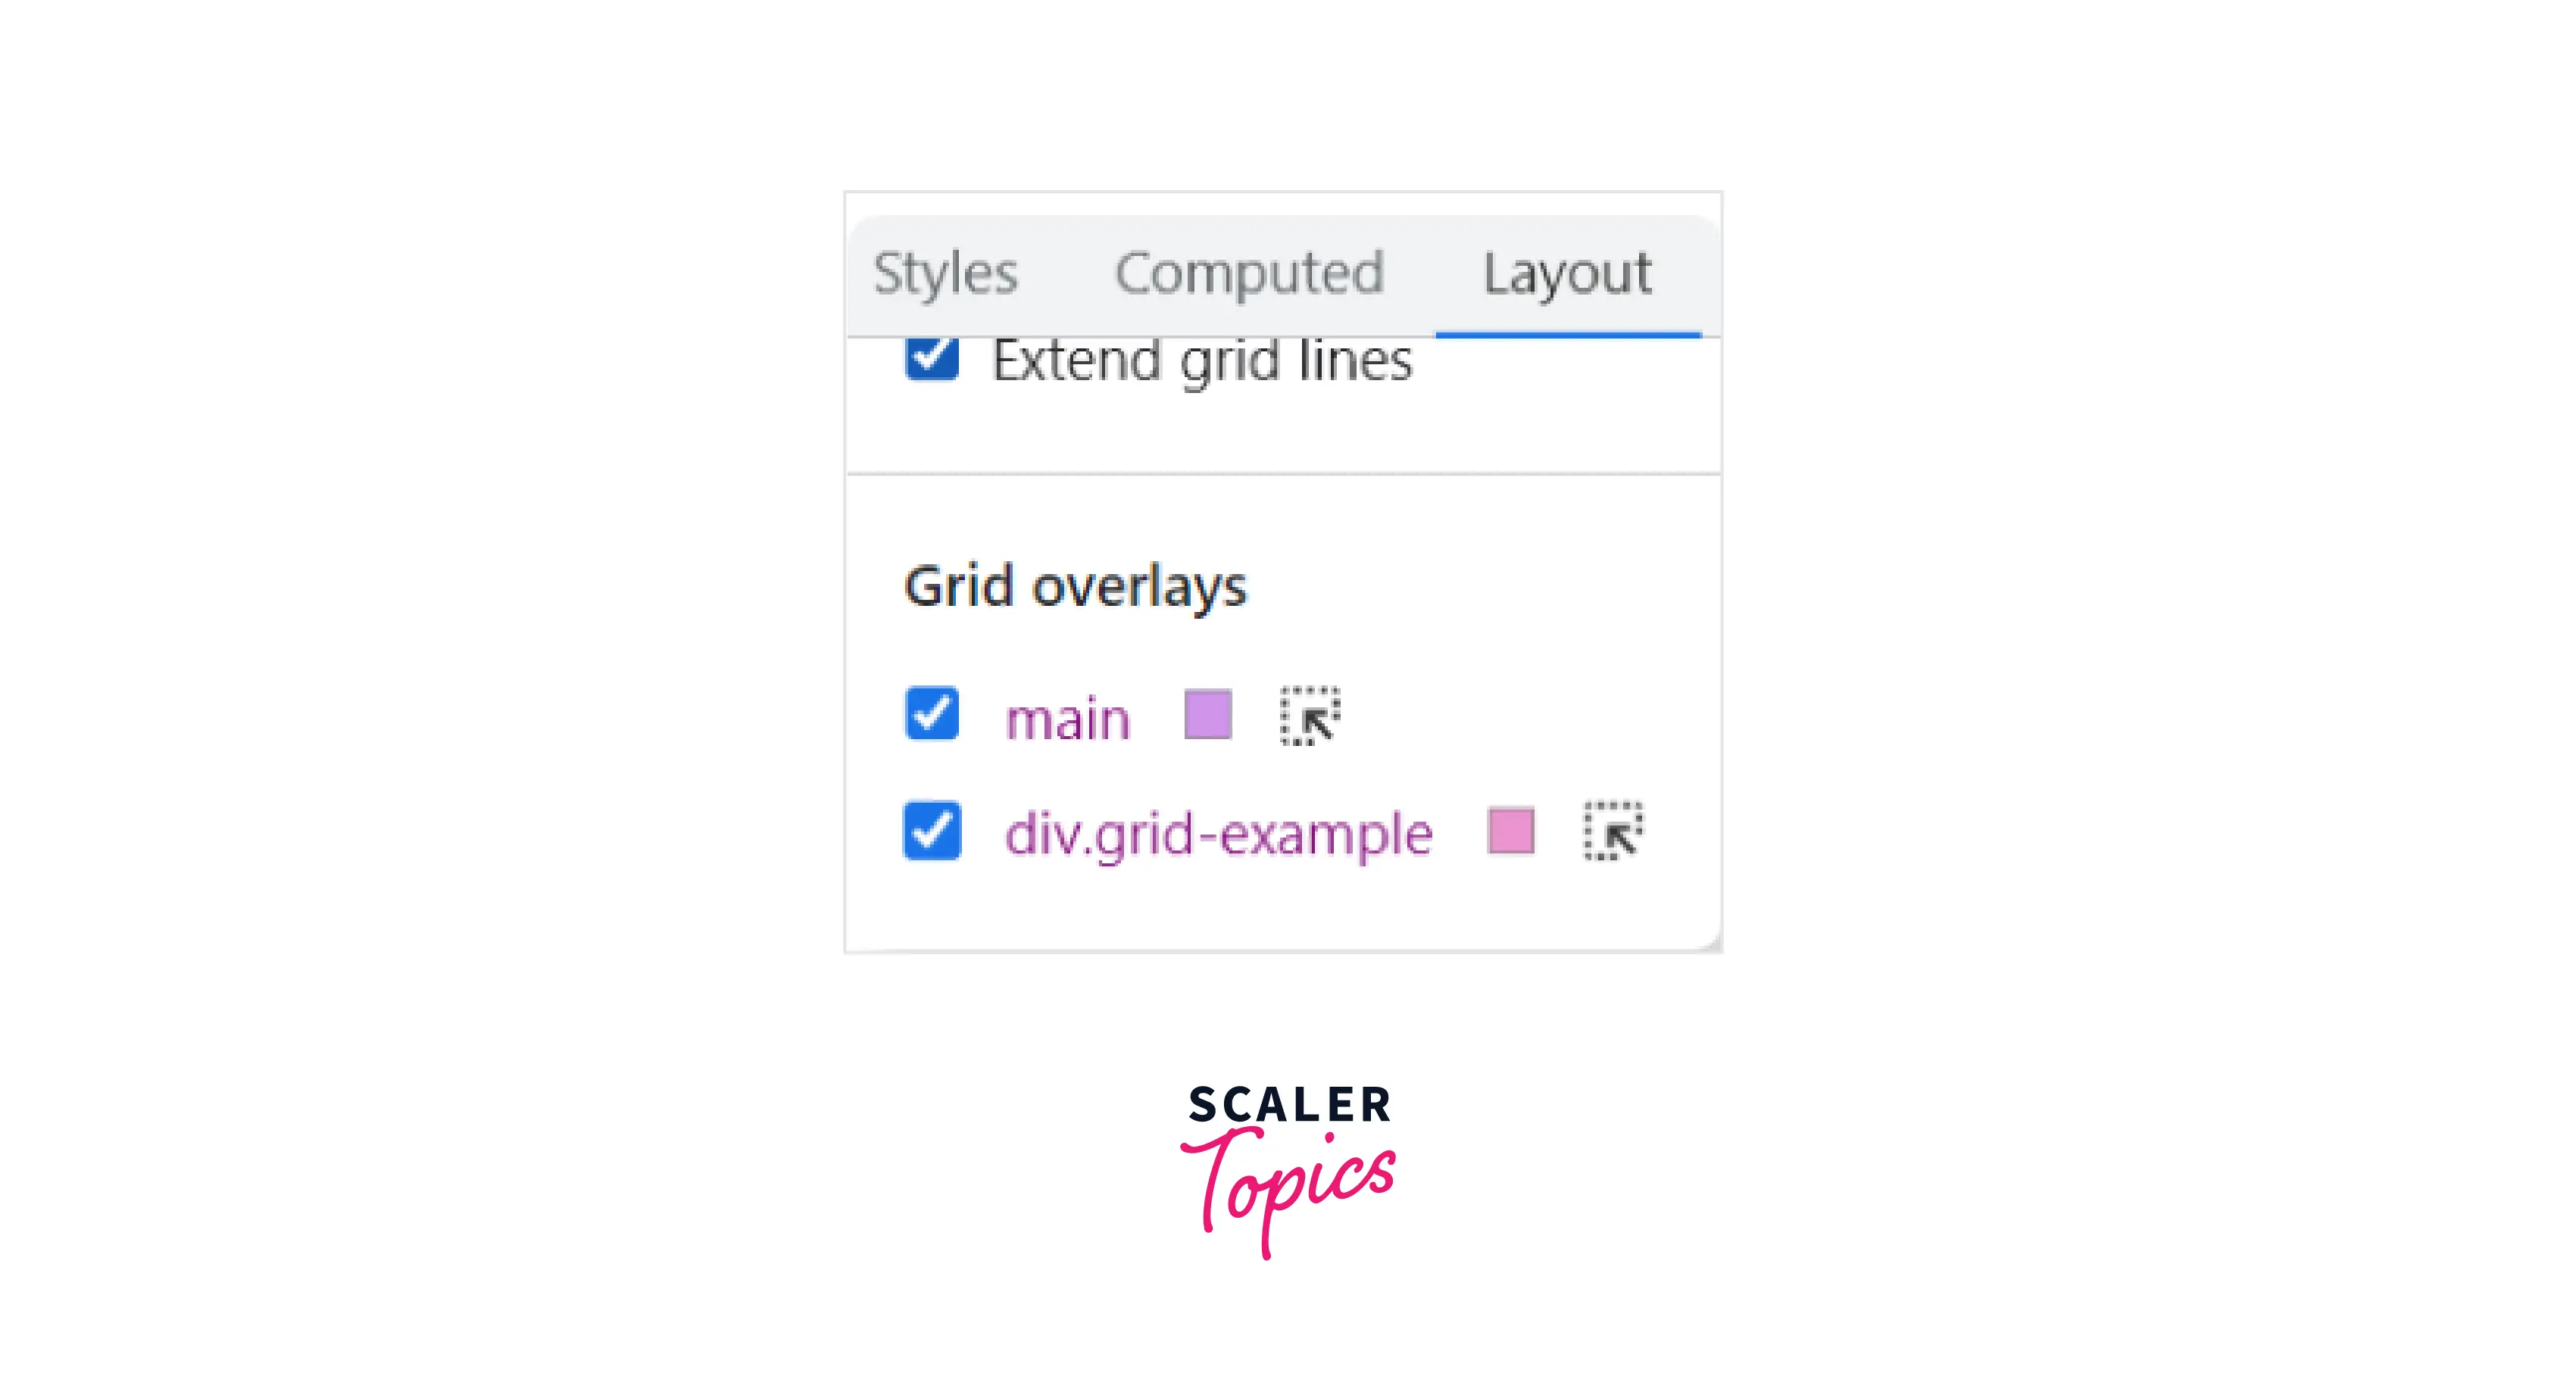
Customize the Grid Overlay Colour:
If you don't like the current overlay colour, you can click on the colour picker tool on the right of the grids present in the Grid overlays.
Highlight the Grid:
Highlighting any HTML element can be done by selecting the element in the Elements panel.
Alternatively, for grids, the option is also available in the Grid overlays.
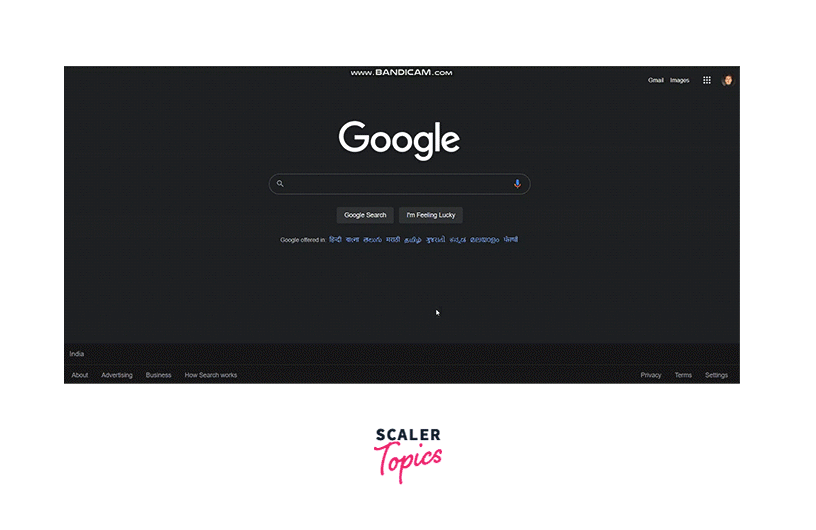
Force Print Preview Mode
If you want to see how the page layout will appear upon printing, the print preview mode can help you out.
Moreover, the website's appearance on different devices varies according to the viewport width. With the help of media queries, we can apply certain CSS styles to give it the desired look.
To get into the print preview mode, follow these steps:
-
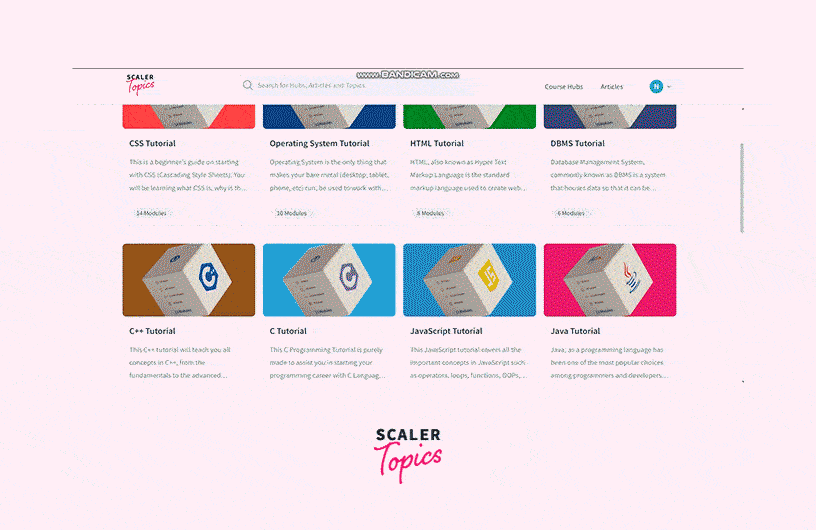
You can open any web page of your choice and look for a particular element.
-
To begin with, right-click and inspect the element. We need to open the Command Menu by pressing Ctrl + Shift + P on Windows, Linux and Command+Shift+P on macOS.
-
This takes us to the Command Menu where we need to type Show Rendering in the search box and then press Enter.
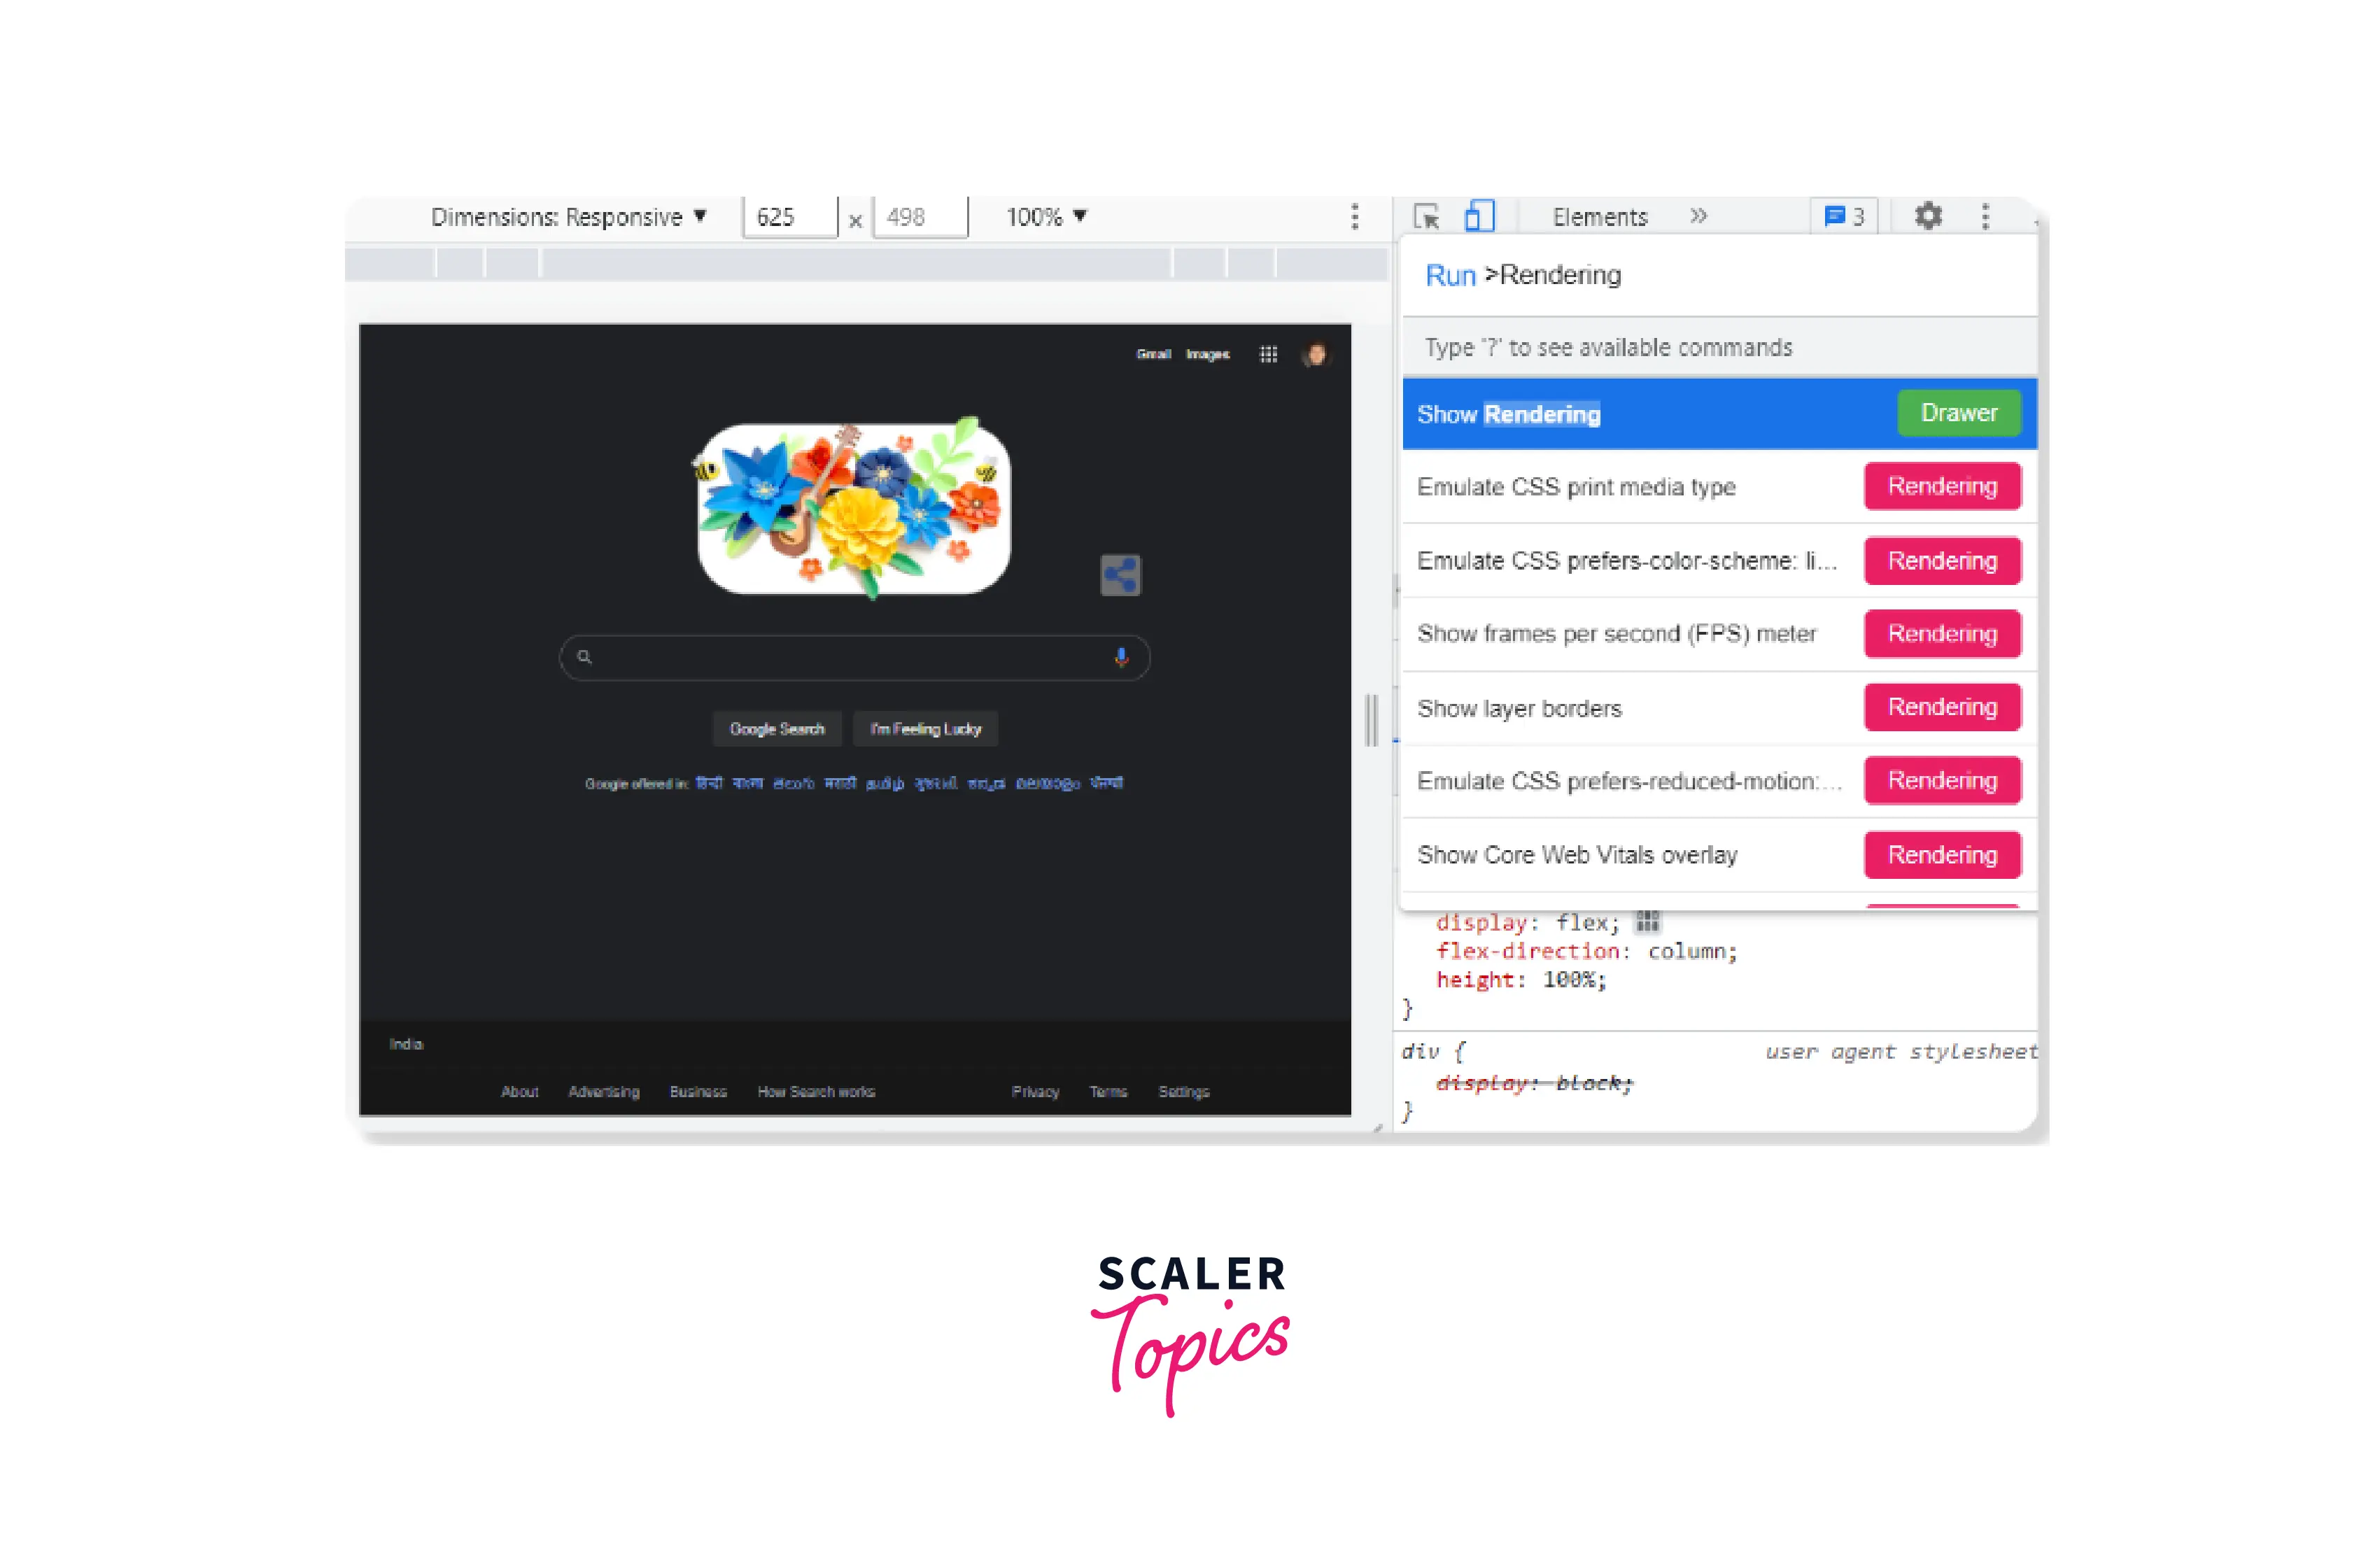
-
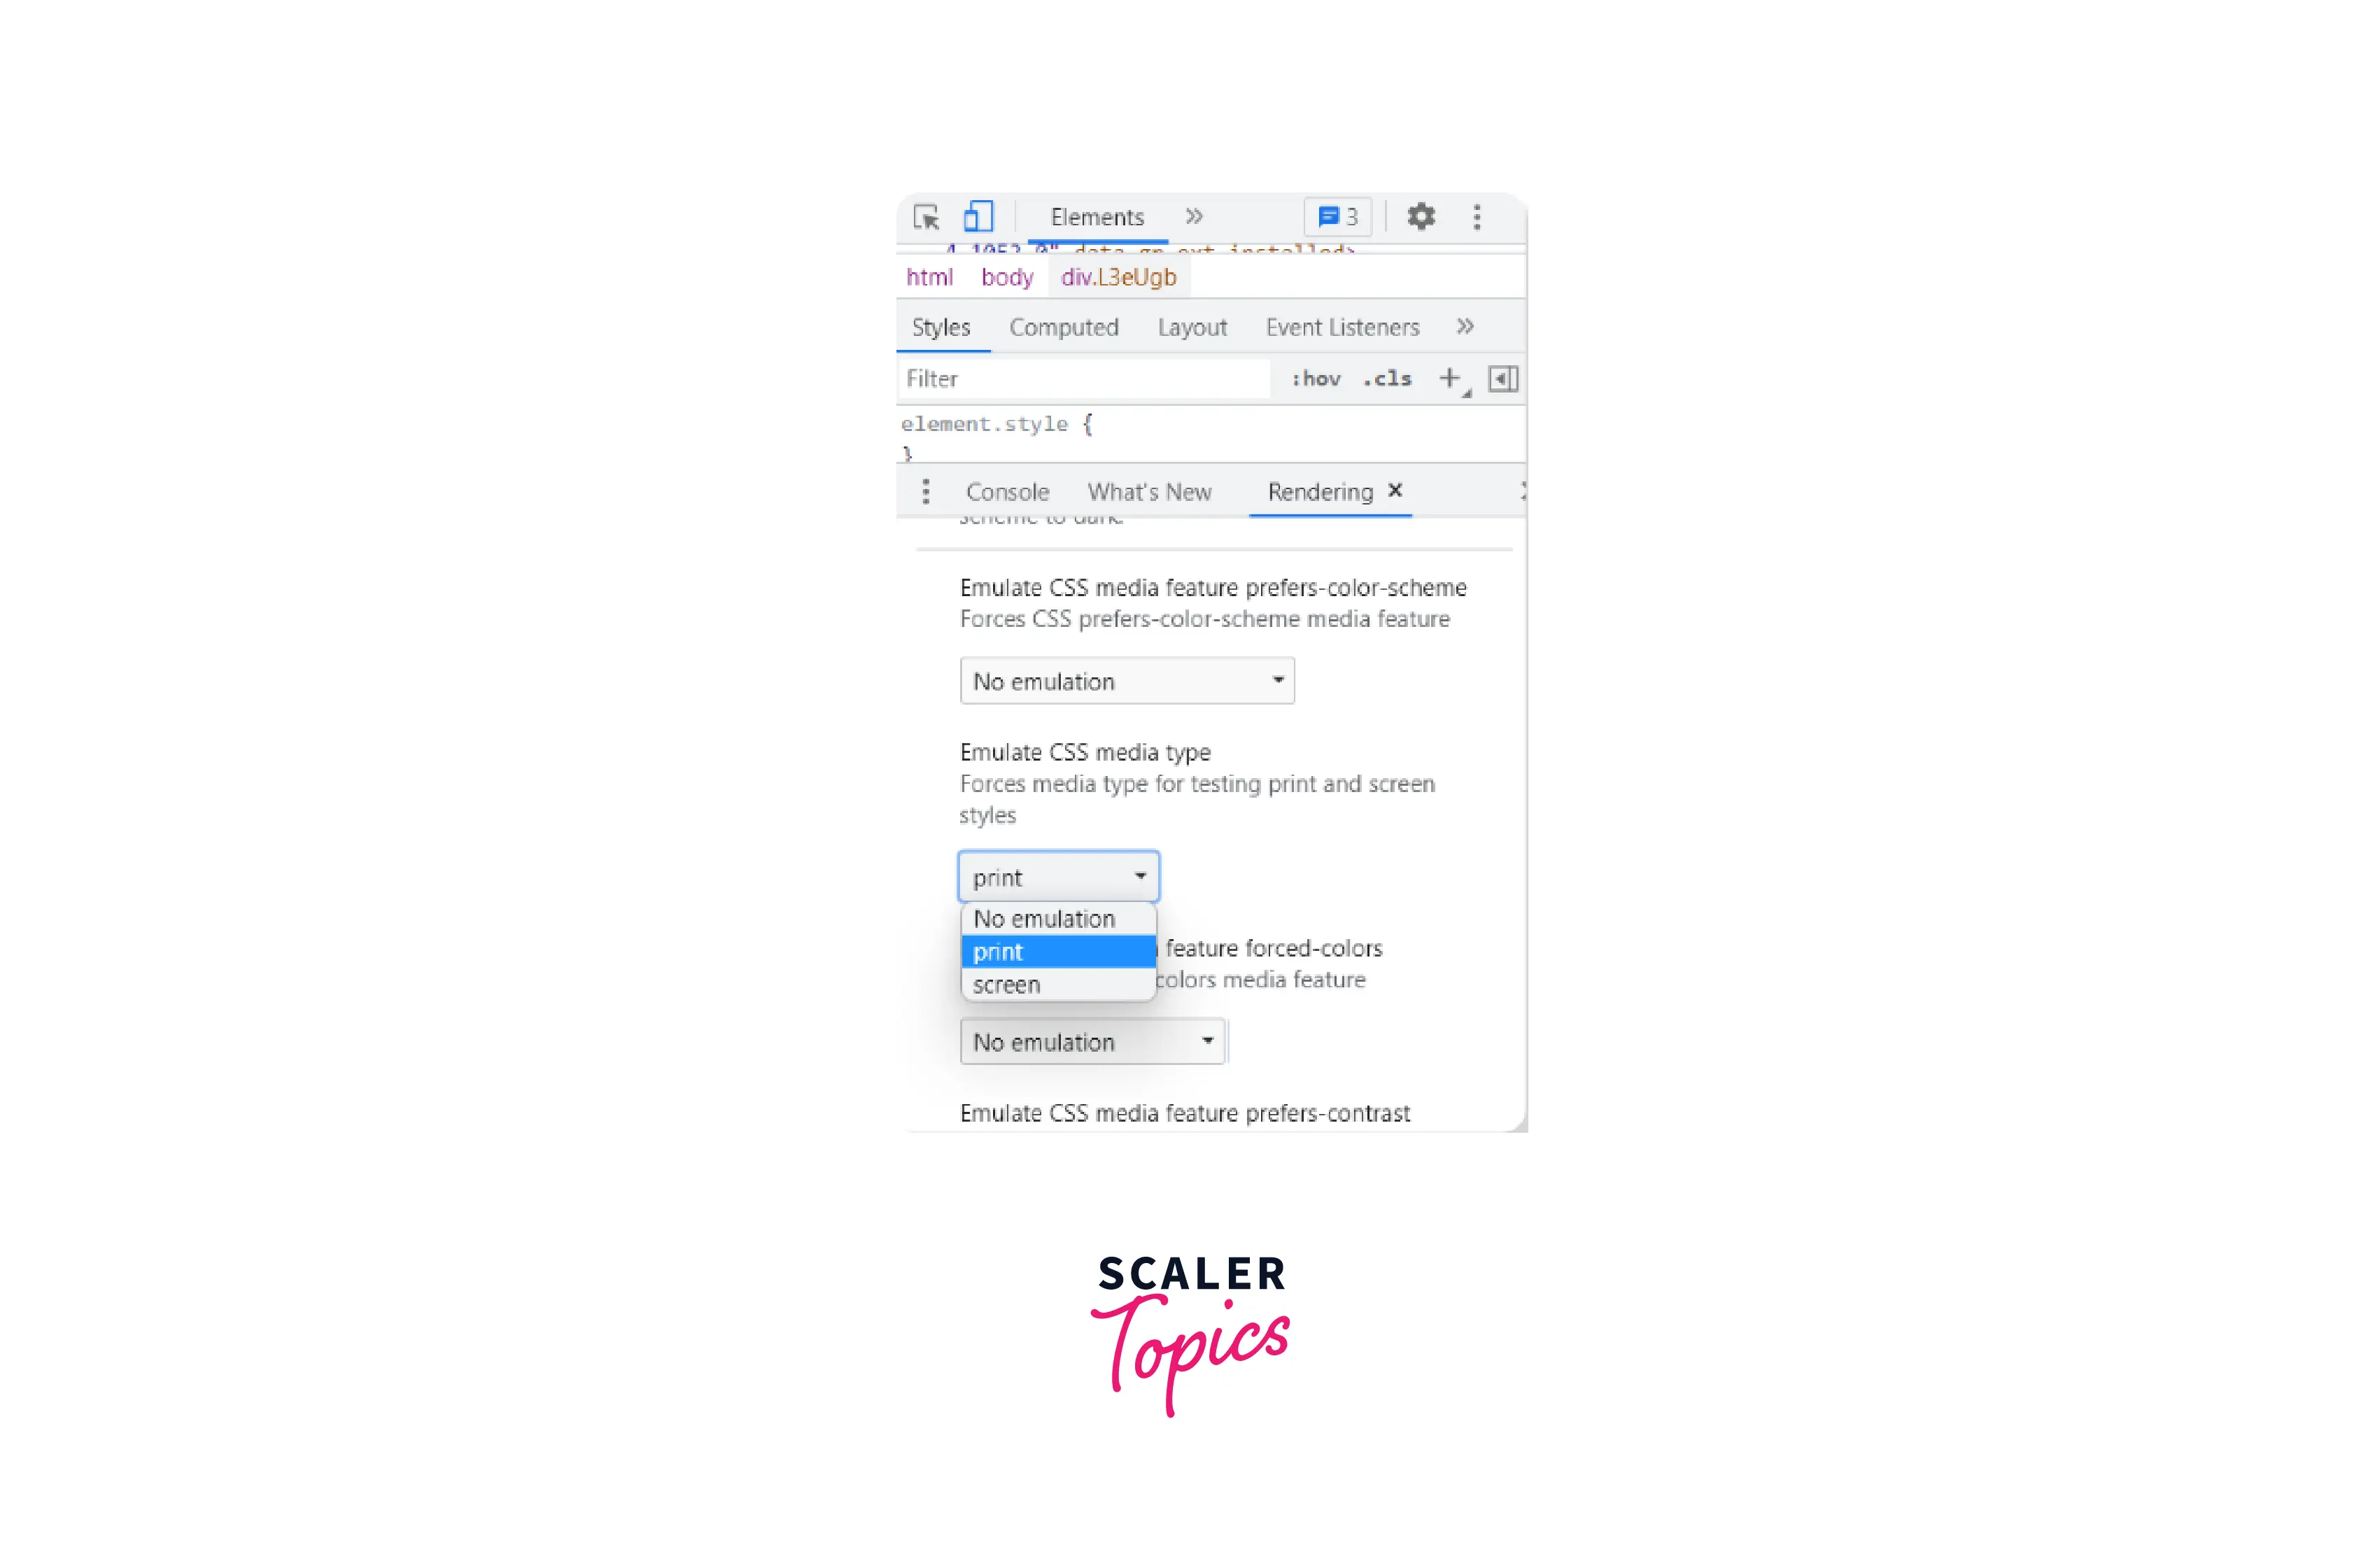
This will lead you to the Rendering panel where you need to look for Emulate CSS media type. Click on the dropdown menu and select print.
How to Edit CSS Using Google Chrome Developer Tools?
While we inspect elements in Chrome, it is better to first edit CSS in Google Chrome before modifying the original code and observing how it changes the appearance of the webpage.
Editing HTML elements and CSS in a browser reduces the hassle of navigating several times to the code editor. And above all, the change in the Chrome Developer Tools will be temporary, so it is more convenient to modify the styles and see what it looks like without even changing the original code in the code editor. Once you finalize what should be added, the same can be added to the code editor as well.
You don't need to refresh the page as well to view the changes.
-
Right-click and open the Inspect panel. Select any element and this will open the Styles panel where you can find all the attributes for the selected element.
-
You can edit any attribute and change its value by simply clicking on them.

-
Or you can add a new attribute by clicking at the end of any attribute which will edit a new line.

Conclusion
- Element's state can be triggered by clicking:
- Ctrl + Shift + i on Windows
- Command + shift + i on Mac
- Right-click -> inspect element
- We can inspect CSS grids to enable different viewing options for grids.
- Line numbers, line labels, and track sizes can be made visible on the page with the help of Overlay display settings.
- The overlay view of multiple grids is available in the Grid overlays section.
- Print preview mode can be enabled by right-clicking and inspecting the element and pressing Ctrl + Shift + P.
- CSS attributes of any element can be updated as well as added in the Styles panel.