Jenkins Dashboard
Overview
The Jenkins Dashboard serves as the nerve center of your CI/CD environment, providing a unified interface for various tasks, from configuring build jobs to monitoring real-time pipeline executions. It's the first window into your automated development world and a platform for quick decision-making, ensuring that your team can react swiftly to any changes or issues. In this blog, we will learn more about Jenkins Dashboard, how to access it, Build Jobs and pipelines, monitoring and secure Jenkins Dashboard.
Accessing the Jenkins Dashboard
Accessing the Jenkins Dashboard is the first step toward managing your CI/CD pipelines and automation processes. Here's a step-by-step guide to help you access the Jenkins Dashboard. Before accessing Jenkins, ensure it's installed, set up, and running on your server. To access it on your web- browser, you could go to http://localhost:8080/ (if Jenkins is running locally) or http://your-server-address:port (if Jenkins is running on a cloud server) to access your Jenkins login page.
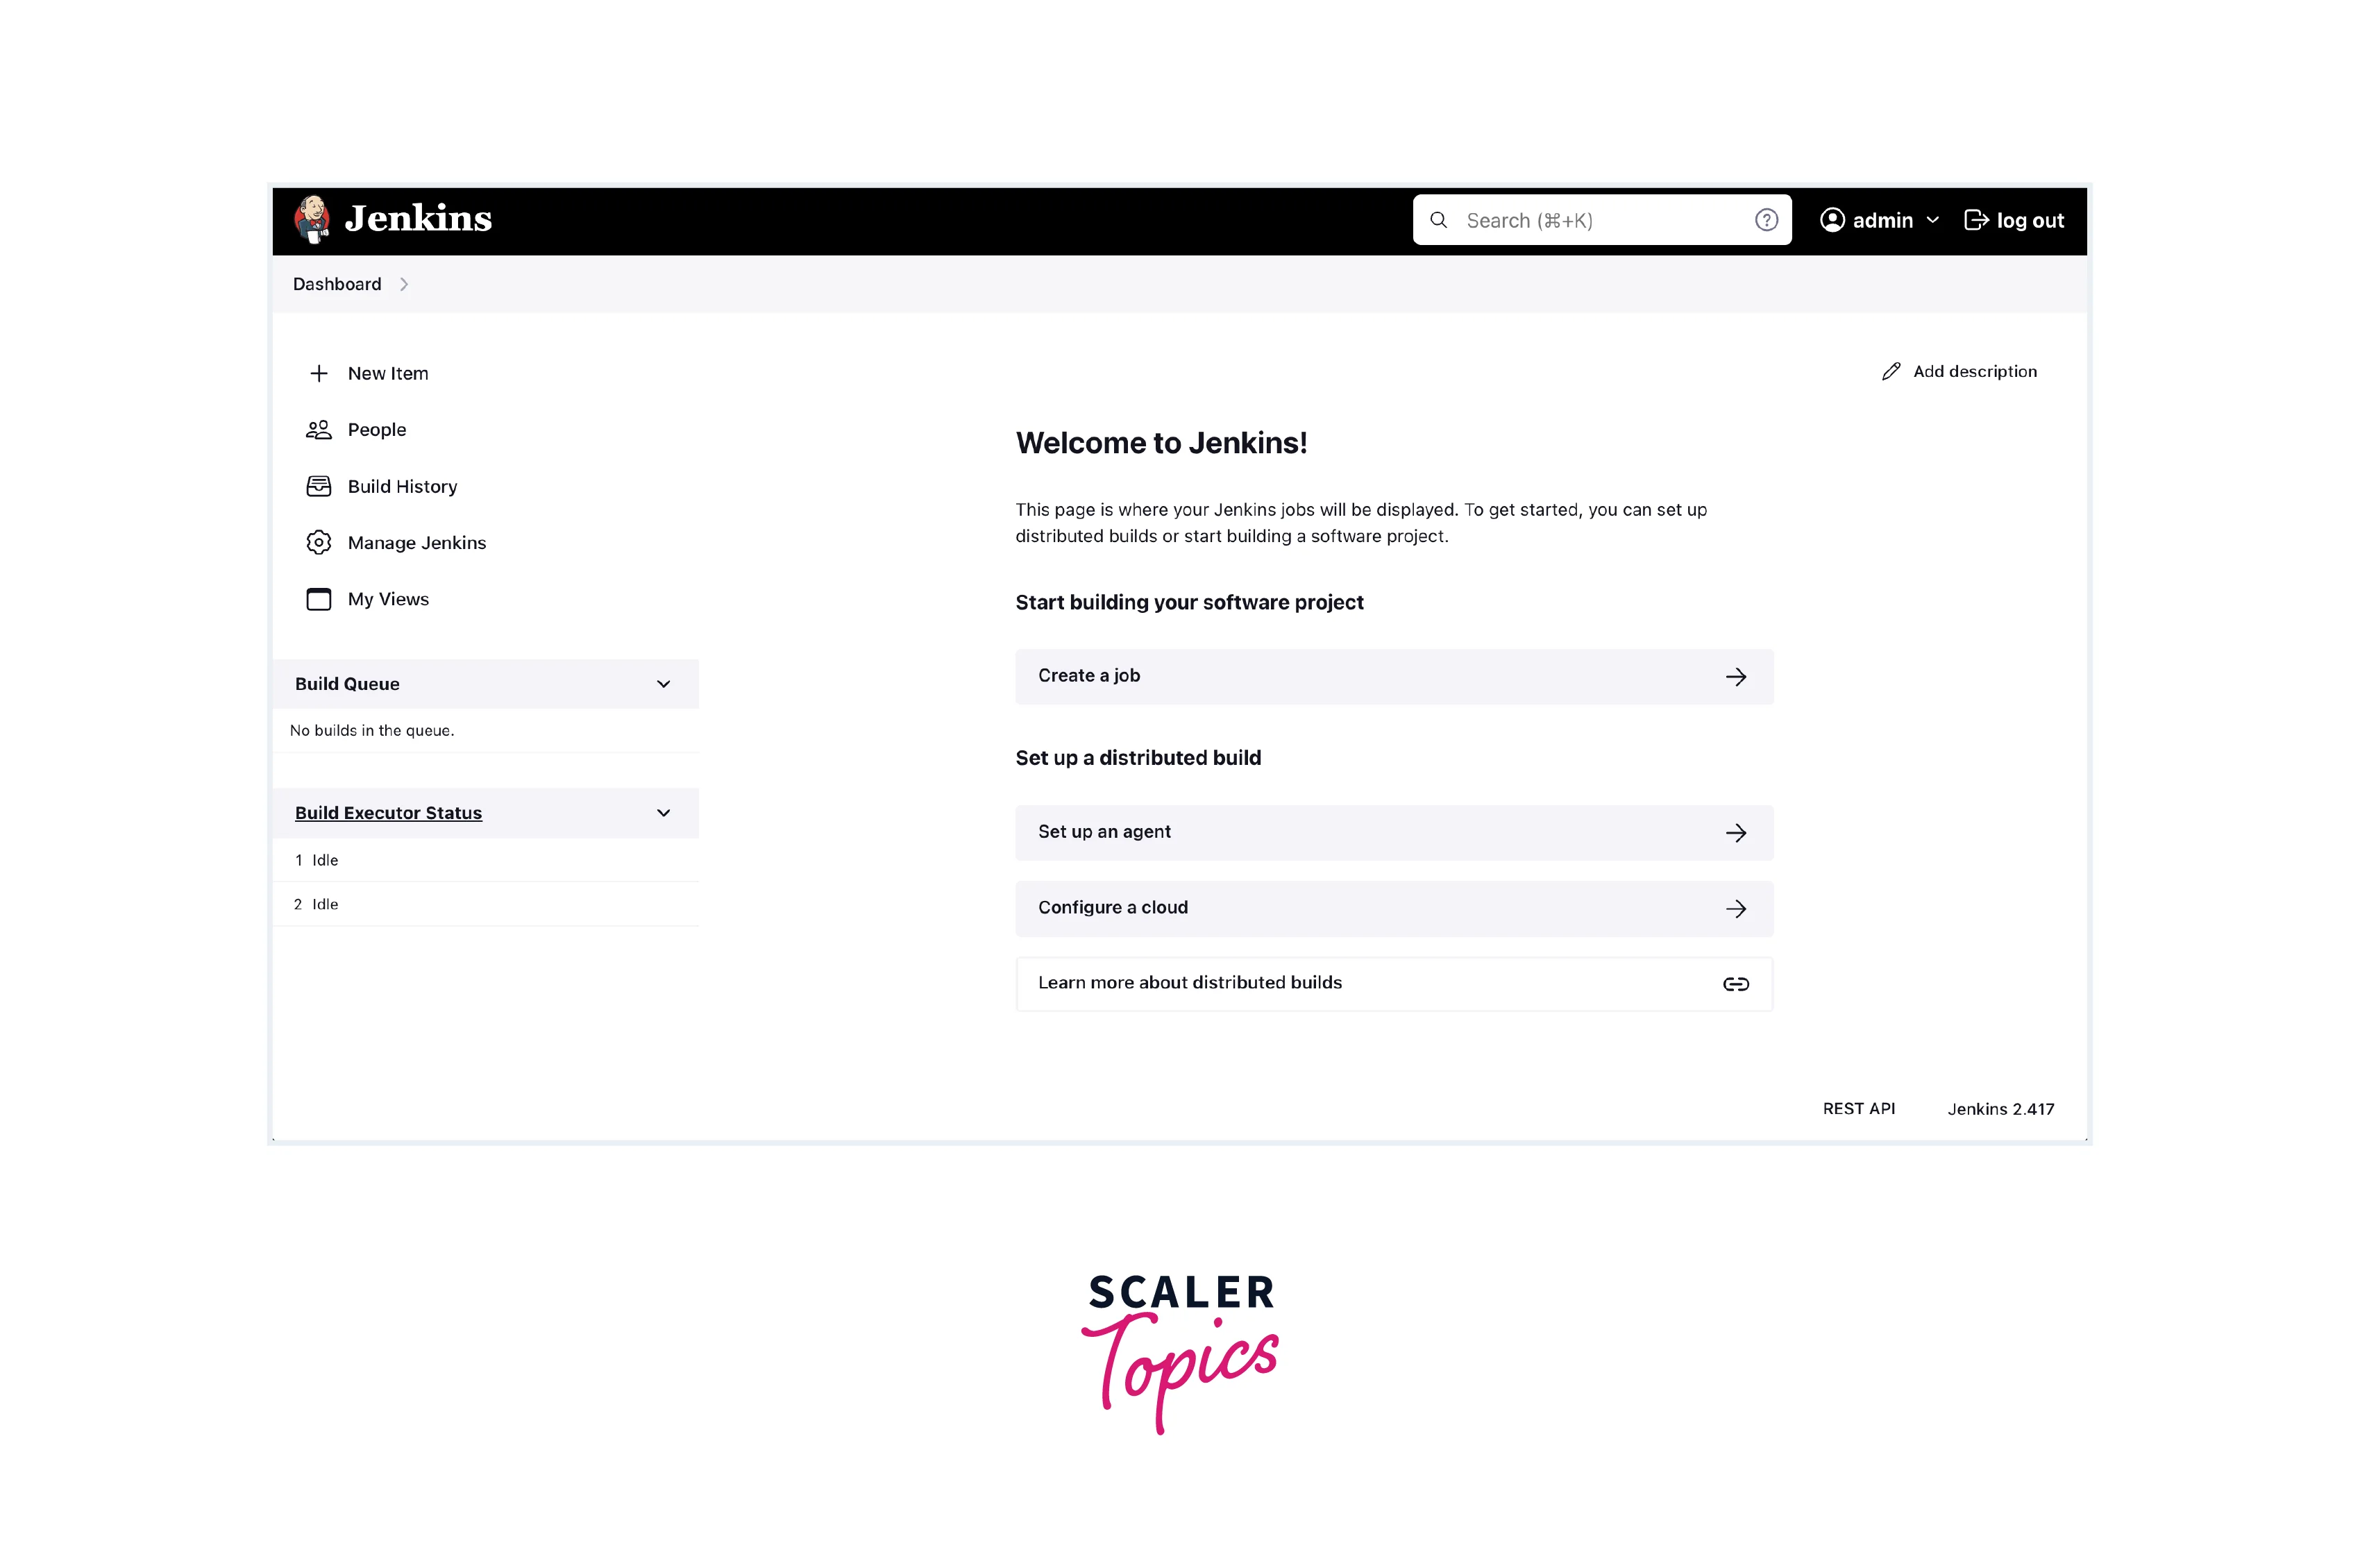
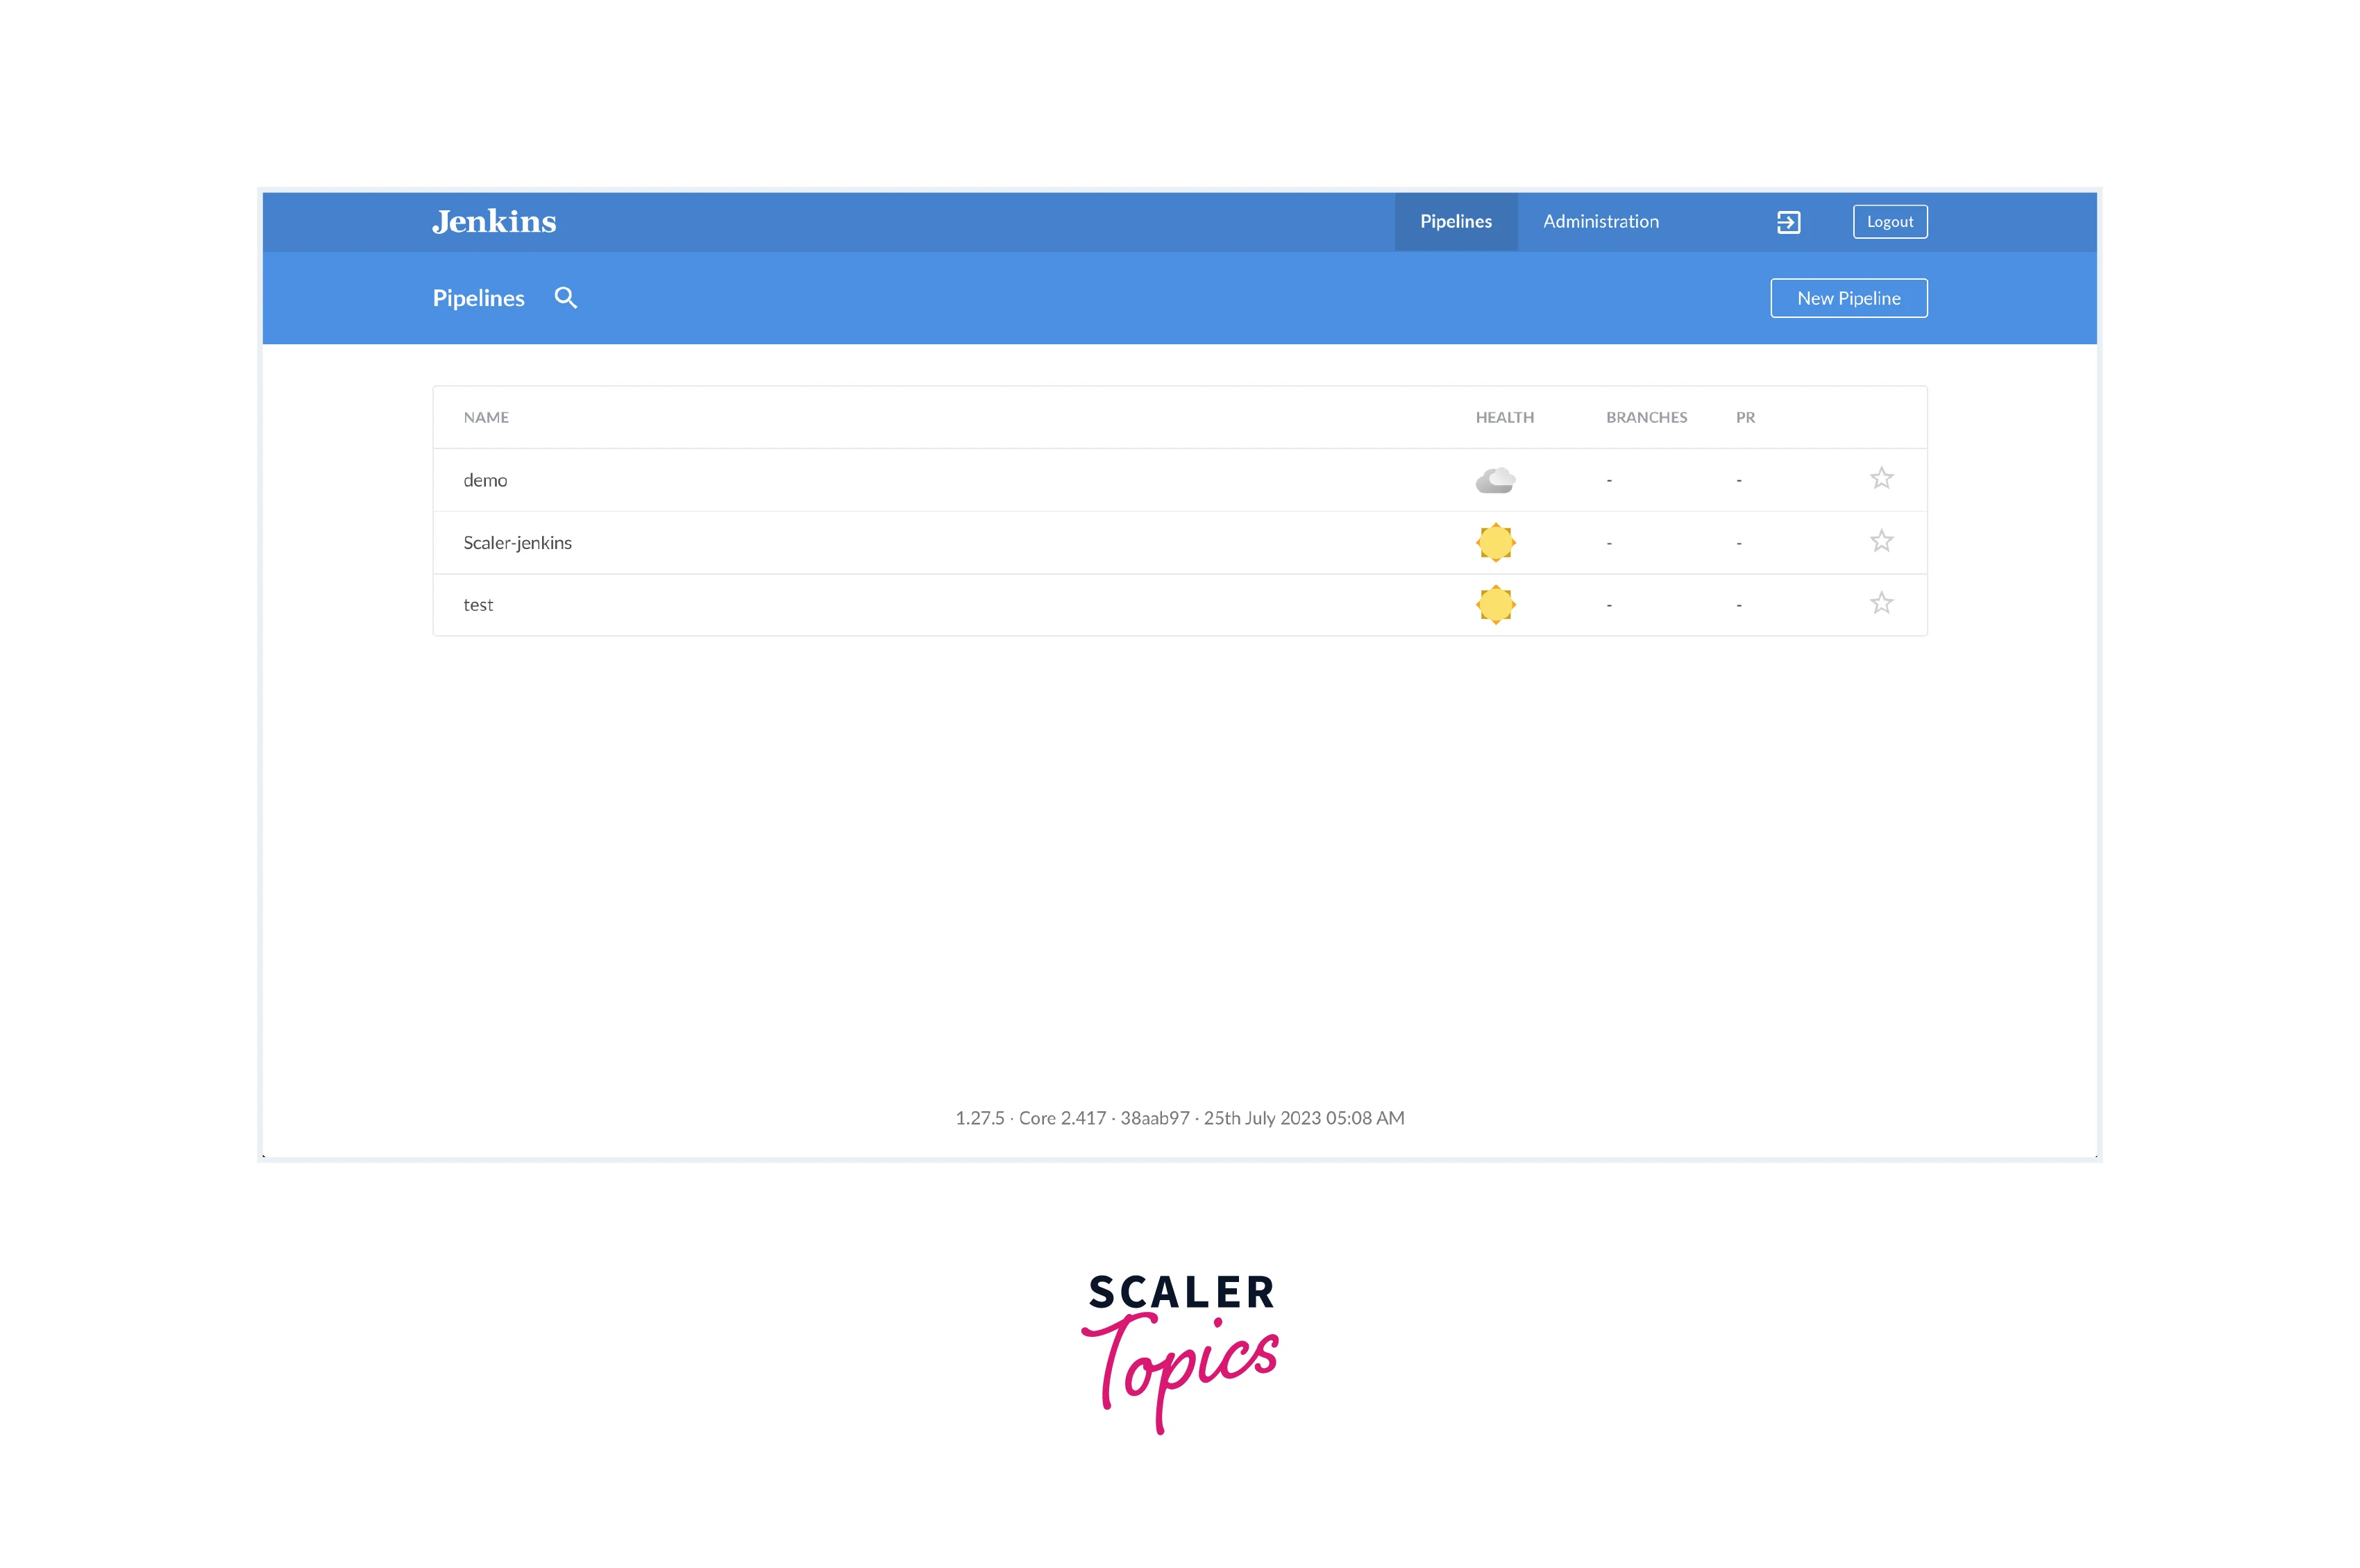
It looks like this when you have successfully logged in. This is your default Jenkins Dashboard.
Dashboard Overview
Upon logging into your Jenkins instance, you'll be shown the Dashboard, a centralized interface designed to provide you with essential information about your CI/CD pipelines and build jobs. Here's a breakdown of what you might see:
- Header Navigation: At the top of the Dashboard, you'll find navigation links that allow you to access different sections of Jenkins. This might include links like "New Item" to create new build jobs, "Build History" to see recent builds, "People" for user management, and "Manage Jenkins" for global configuration.
-
Main Overview Area: The main area of the Dashboard Overview typically displays a summarized view of your recent build jobs, pipelines, and their status. Here's what you might find:
- Build Jobs List: A list of your recent build jobs, each represented by a card or a row. You'll see the job name, build status (success, failure, building), and build number.
- Job Health Indicators: Visual indicators, such as colored icons or circles, representing the health of each job. For example, a green checkmark for success, a red cross for failure, and a blue circle for ongoing builds.
- Pending Builds: If any build jobs are queued or waiting to be executed, they might be displayed here.
- Quick Actions: Buttons or links that allow you to trigger a build for a specific job, view job configuration, and access build details.
-
Build History: Often, a section of the Dashboard Overview is dedicated to showing your recent build history. This could include a list of the latest builds across different jobs. Clicking on a build number or job name typically takes you to a detailed view of that build.
-
Pipeline Visualizations: Depending on your Jenkins setup and plugins installed, you might have a section that visually represents your pipelines. This could include a graphical representation of pipeline stages and their status.
-
Custom Widgets: Some Jenkins setups allow for customizable widgets that display additional insights. These could show information like code coverage, test results, or deployment status.
-
Personalization Options: Many Jenkins instances offer personalization options. You might be able to customize the layout of your Dashboard, add or remove widgets, and reorder sections based on your preferences.
-
Footer and Notifications: The bottom of the Dashboard might have notifications or messages, including any recent system updates, warnings, or alerts related to your Jenkins instance.
-
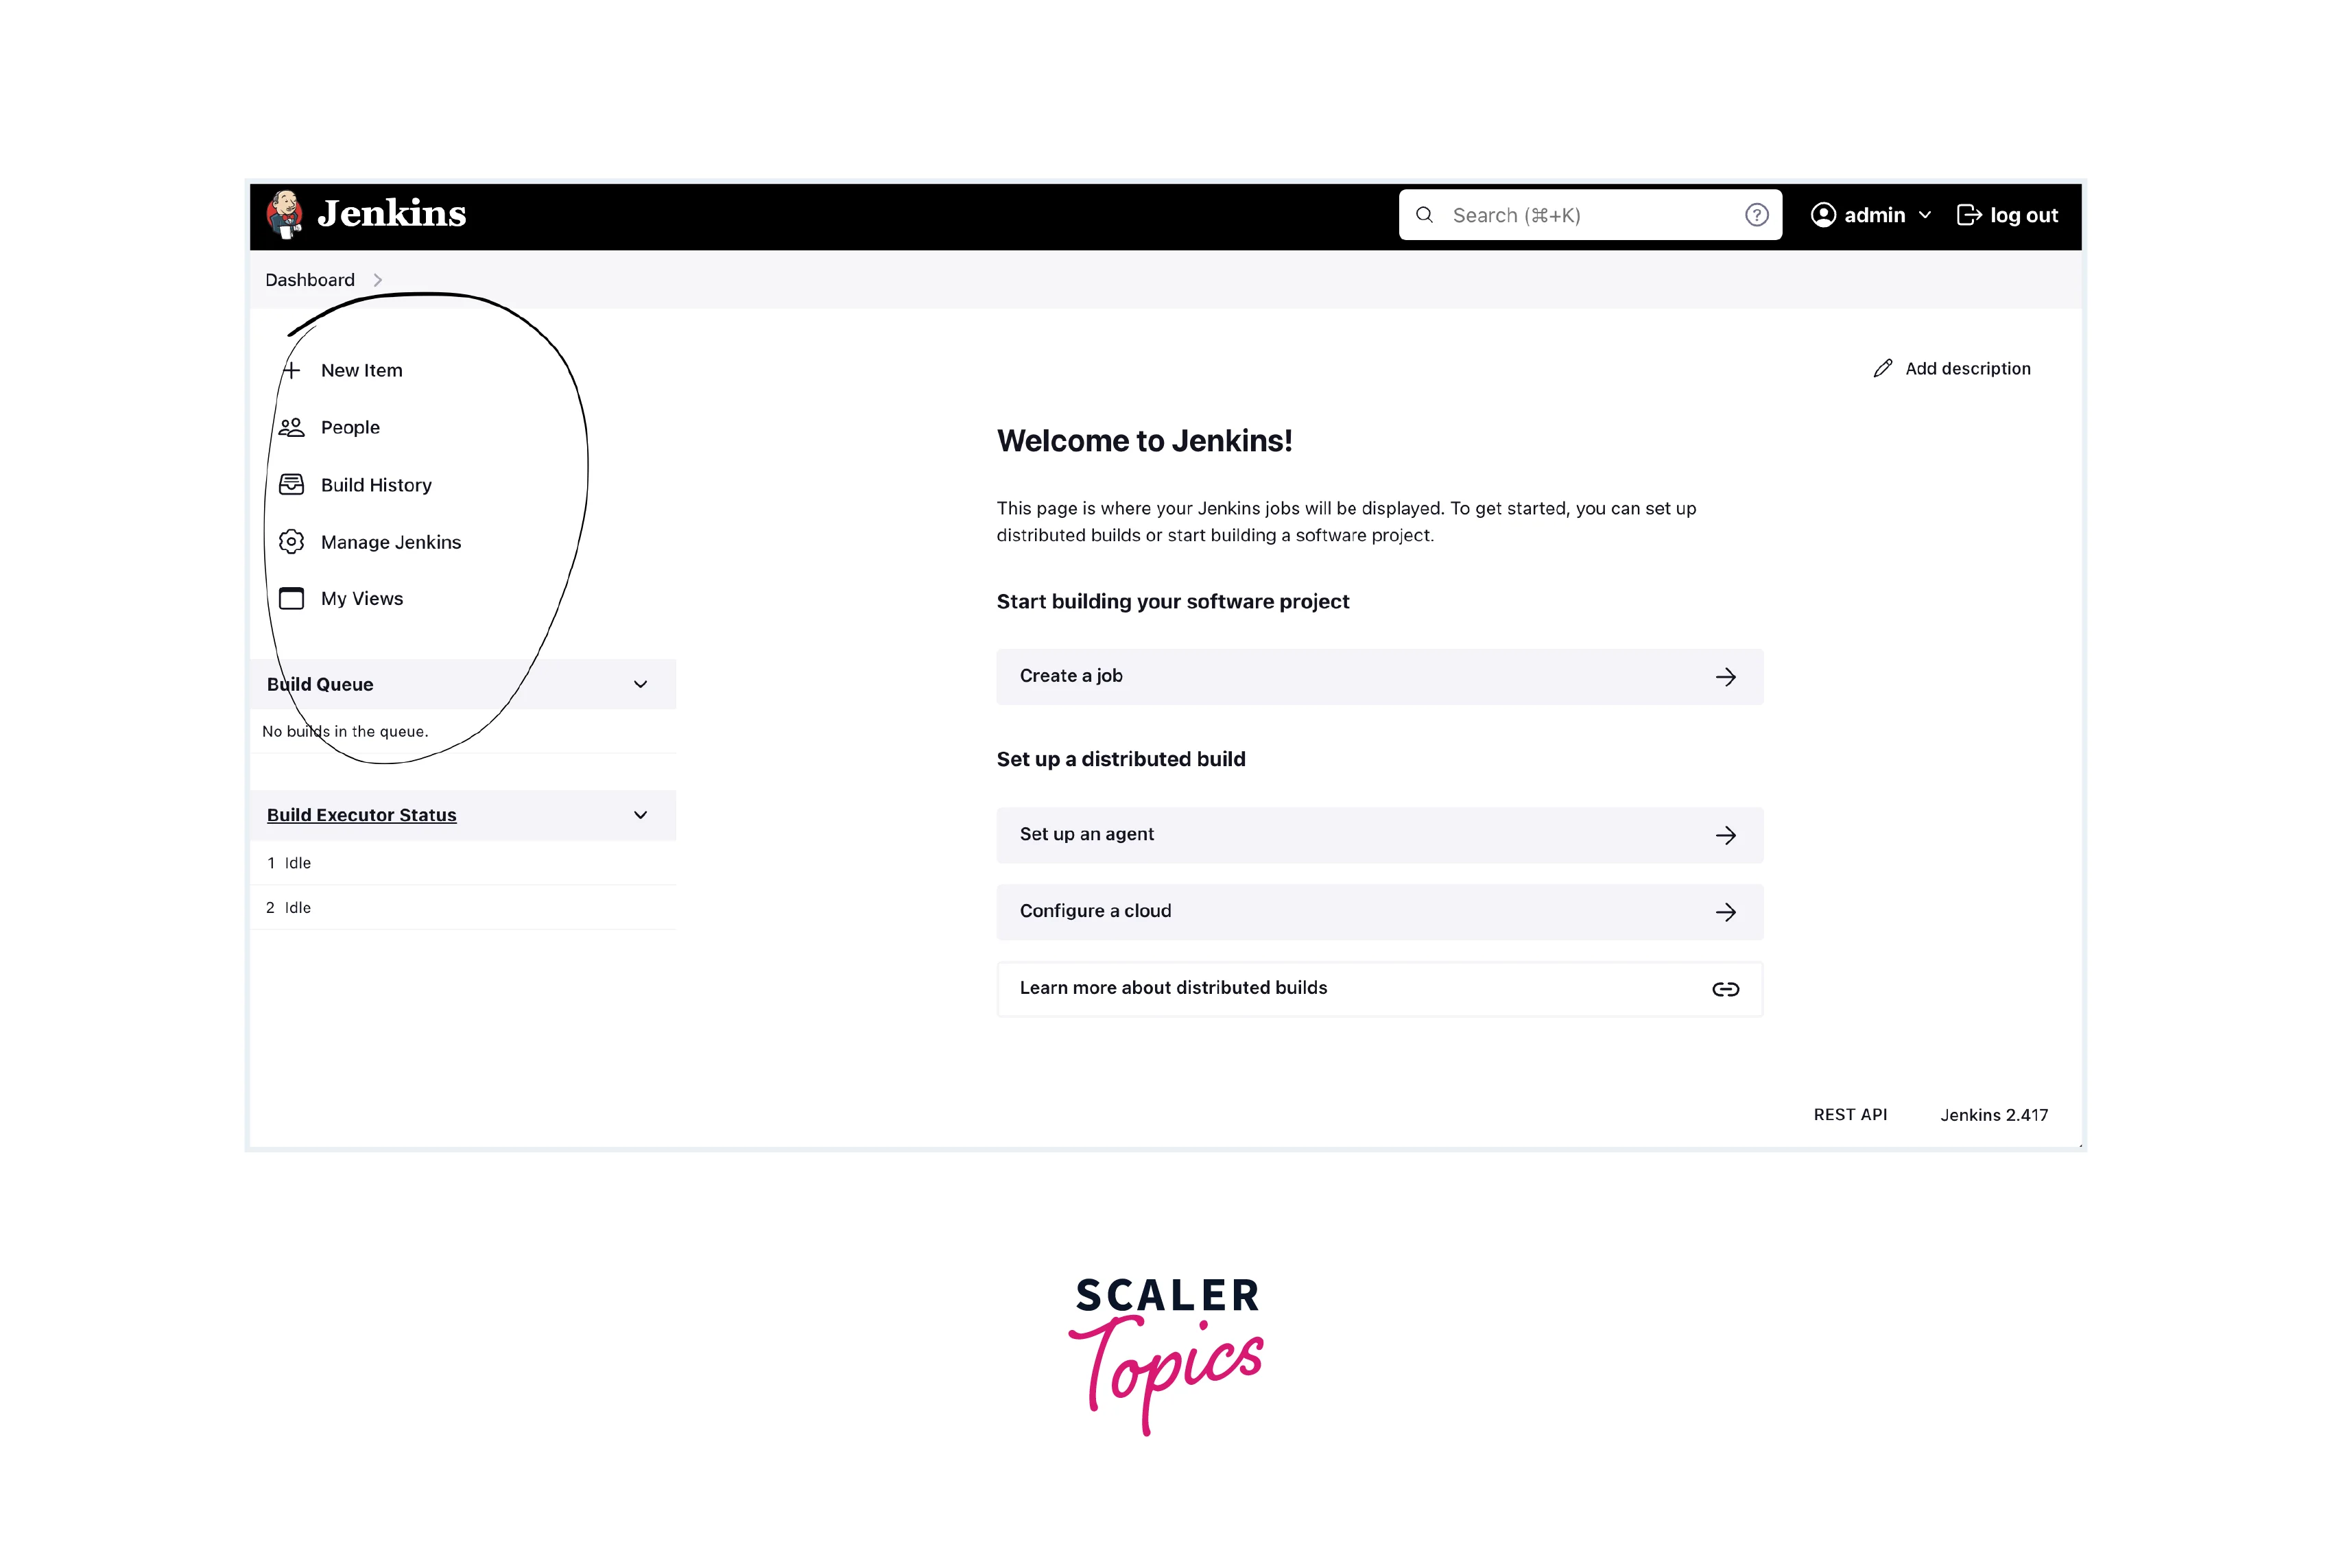
Navigation Panel: On the left side of the Dashboard, you'll often find a navigation panel that provides links to various sections of Jenkins. This could include links to specific job categories, build history, plugin management, and more.
Remember that the appearance and layout of the Jenkins Dashboard can be customized based on your preferences and the plugins you have installed. The goal of the Dashboard Overview is to give you a quick snapshot of your CI/CD processes, so you can make informed decisions and address any issues promptly.
Viewing Build Jobs and Pipelines
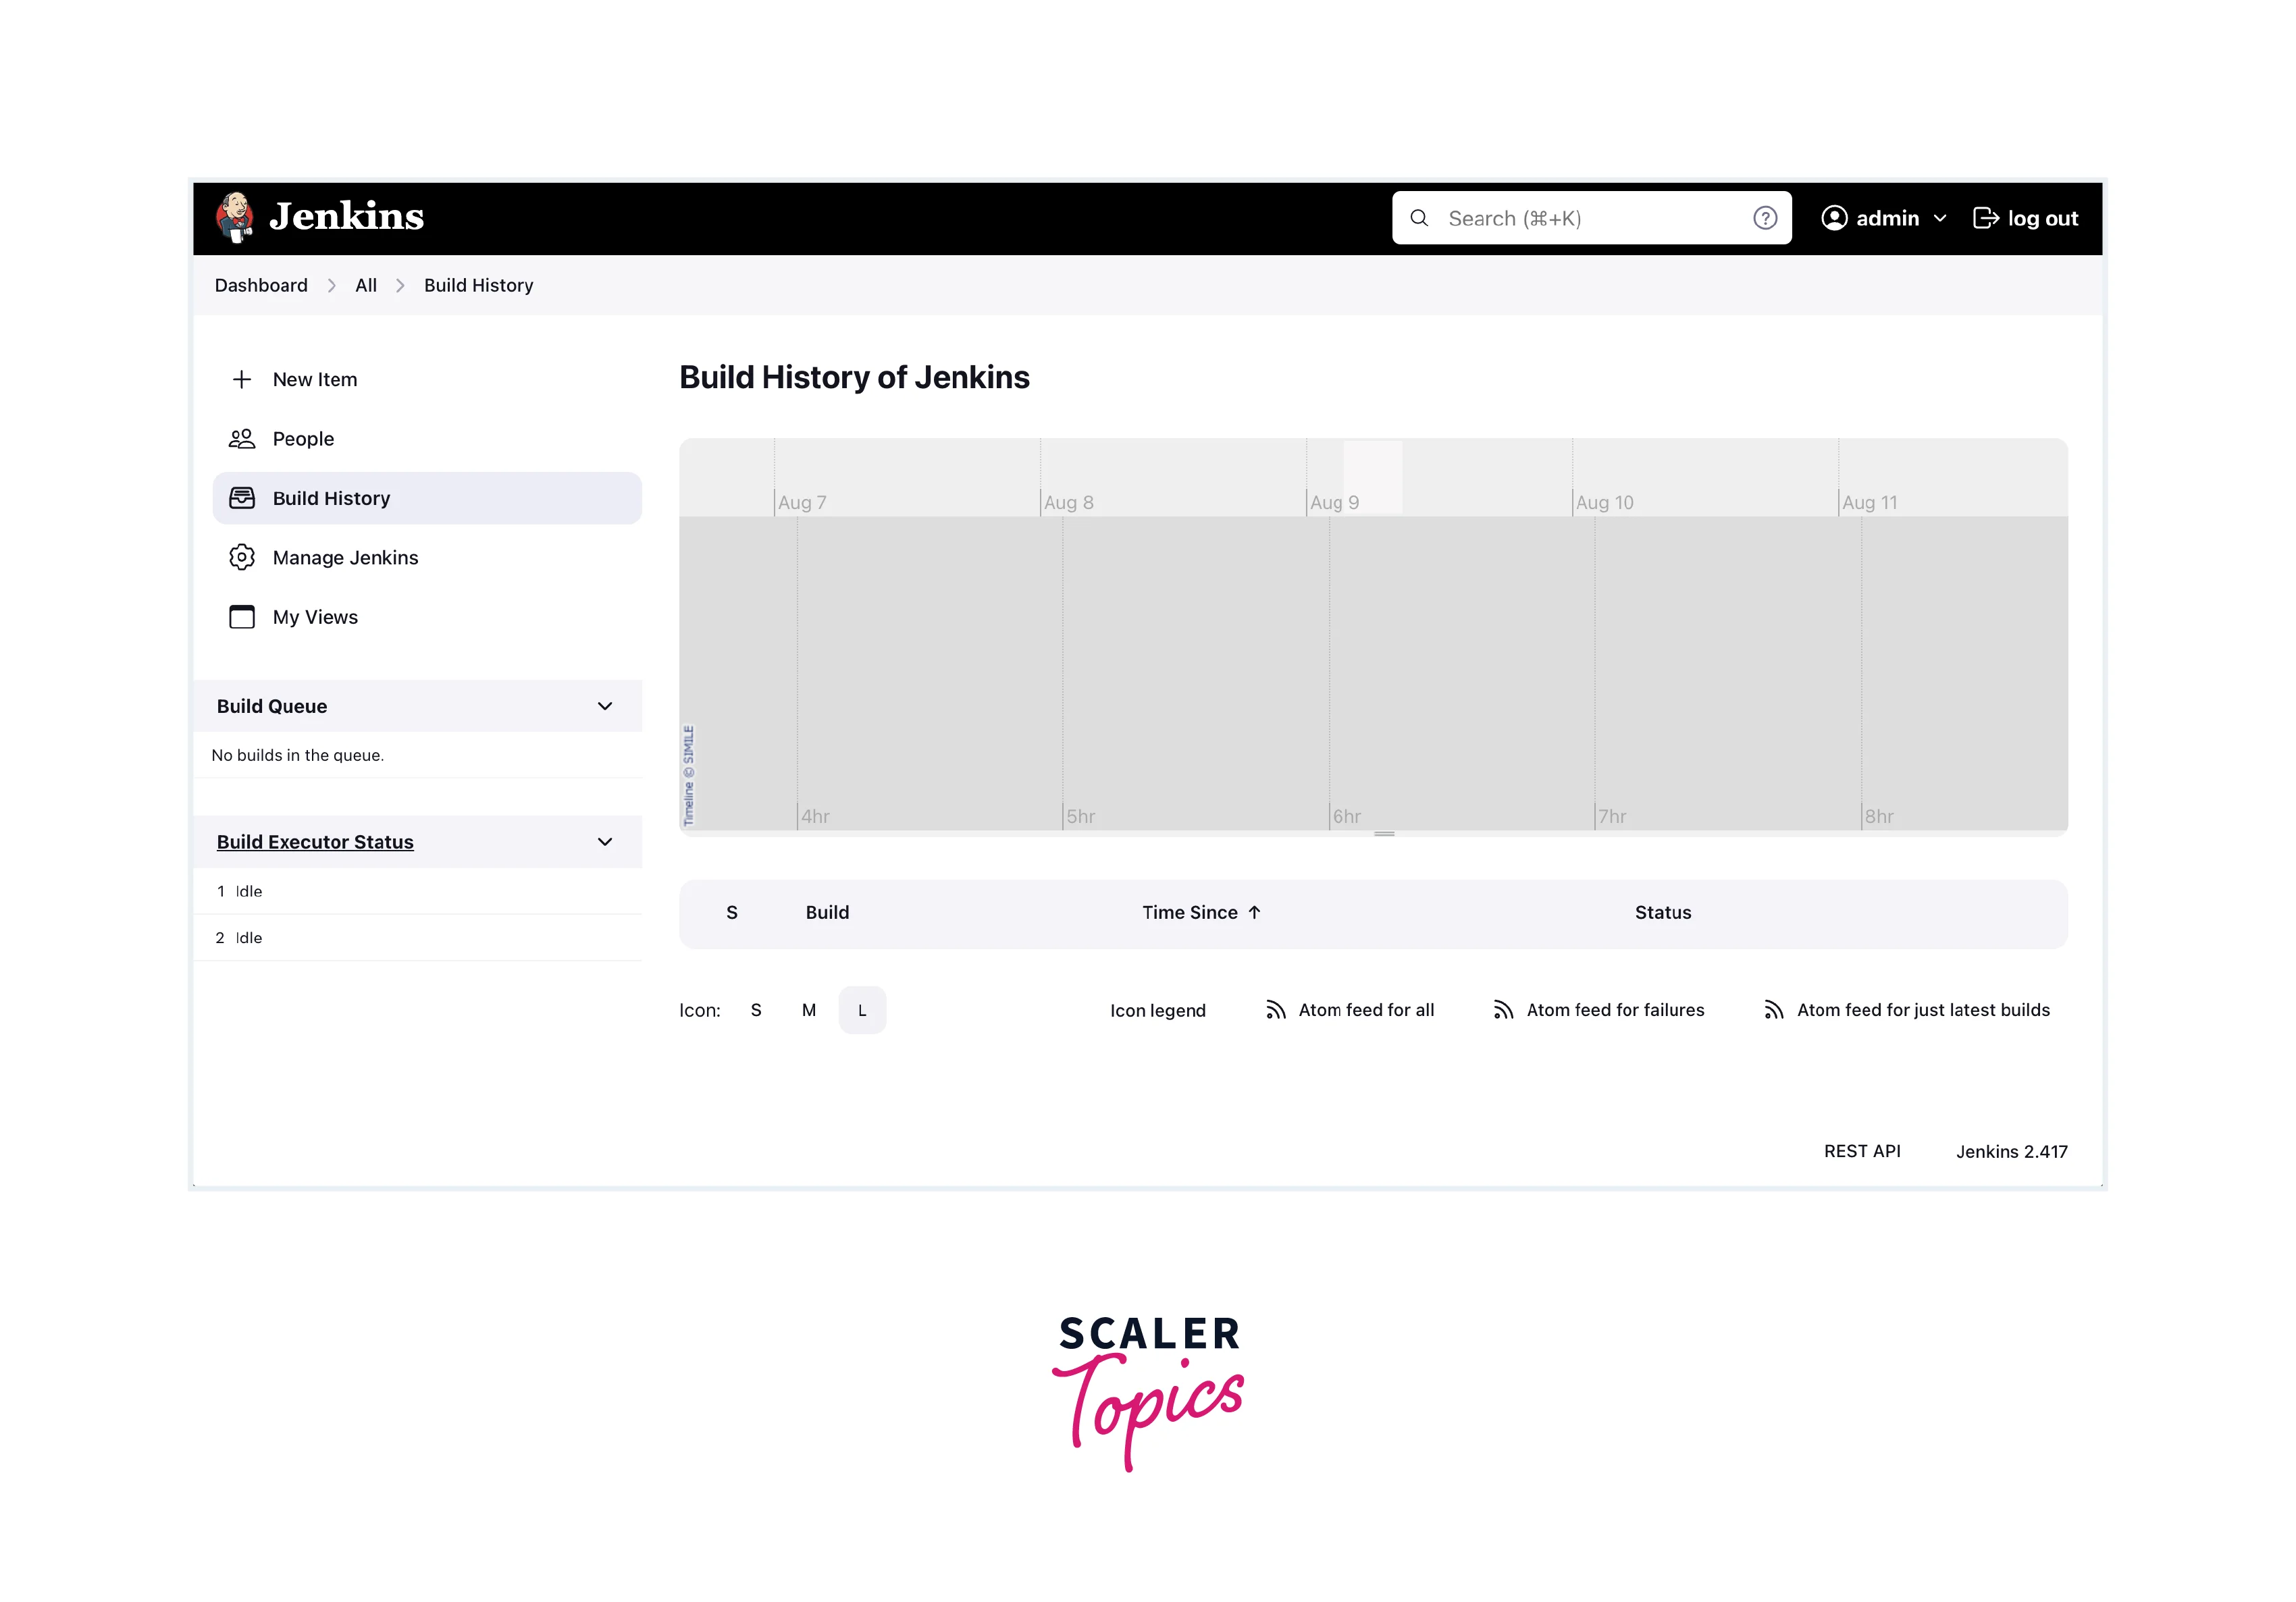
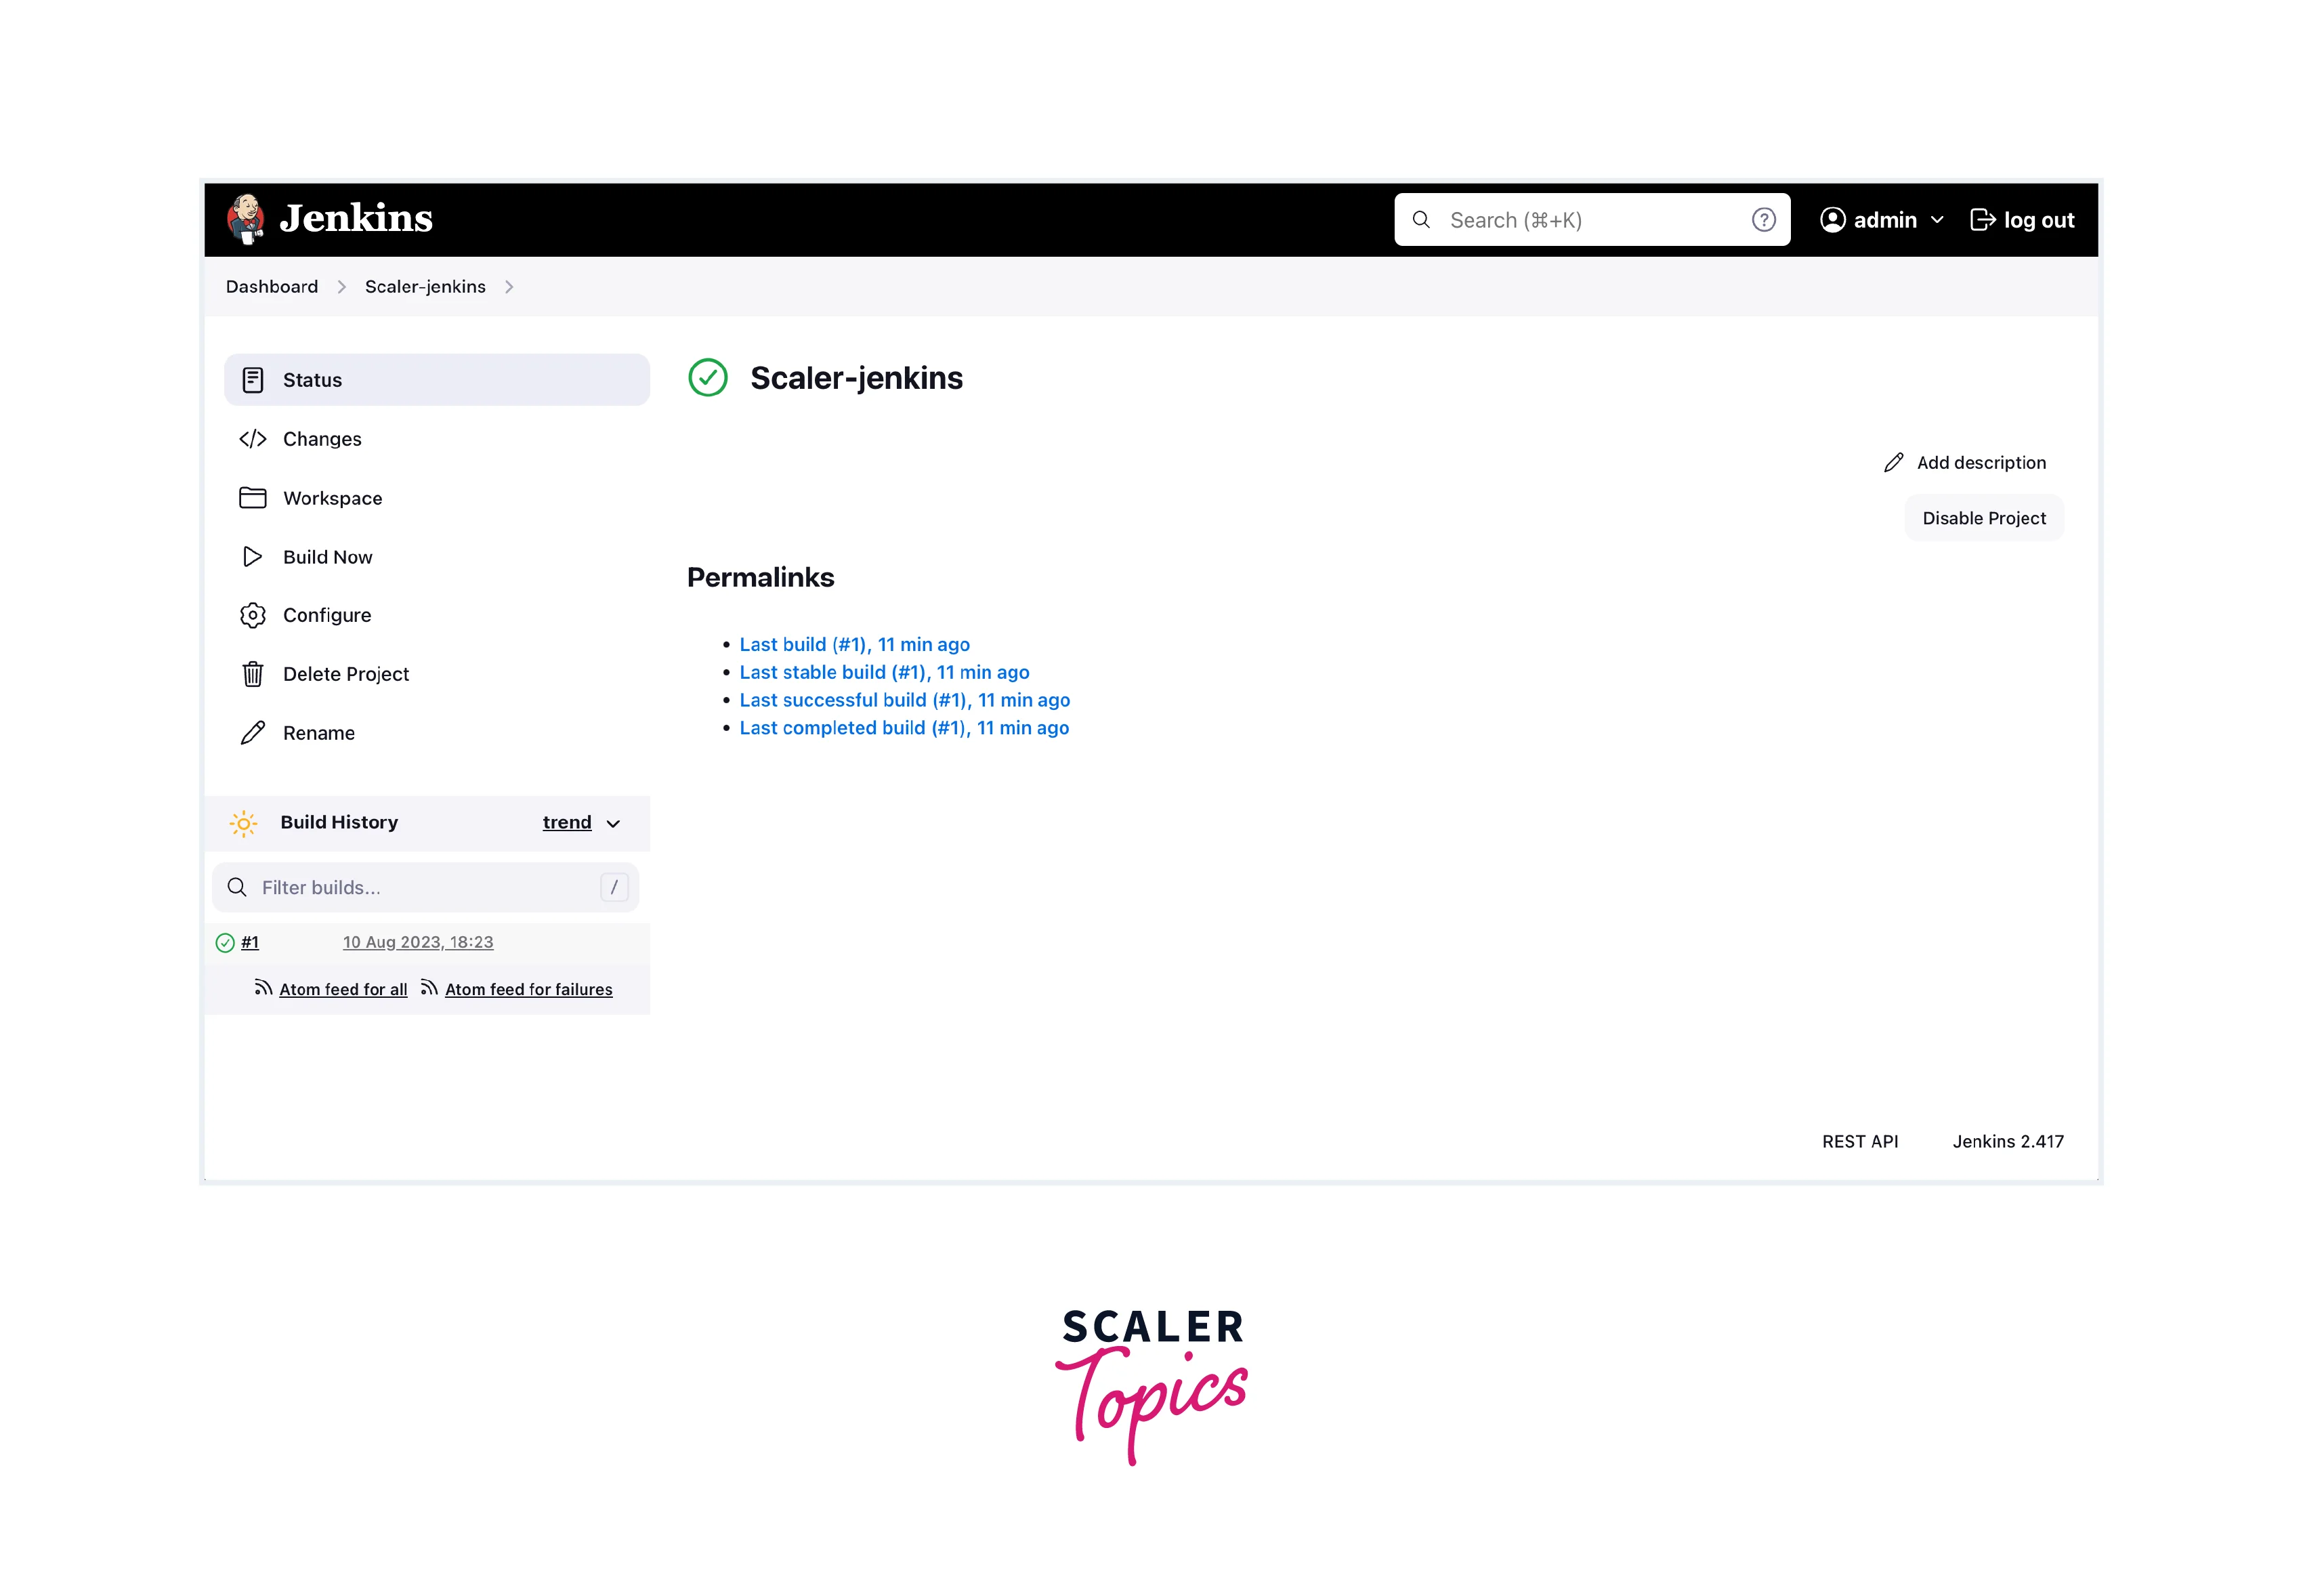
Typically, there's a section on the Dashboard where you can access your build jobs. This might be labelled as "Build History," "Projects," or something similar. Click on this link to view a list of your existing build jobs.
If you haven't built anything it would be blank. I have a demo build ready as you can see in the picture.
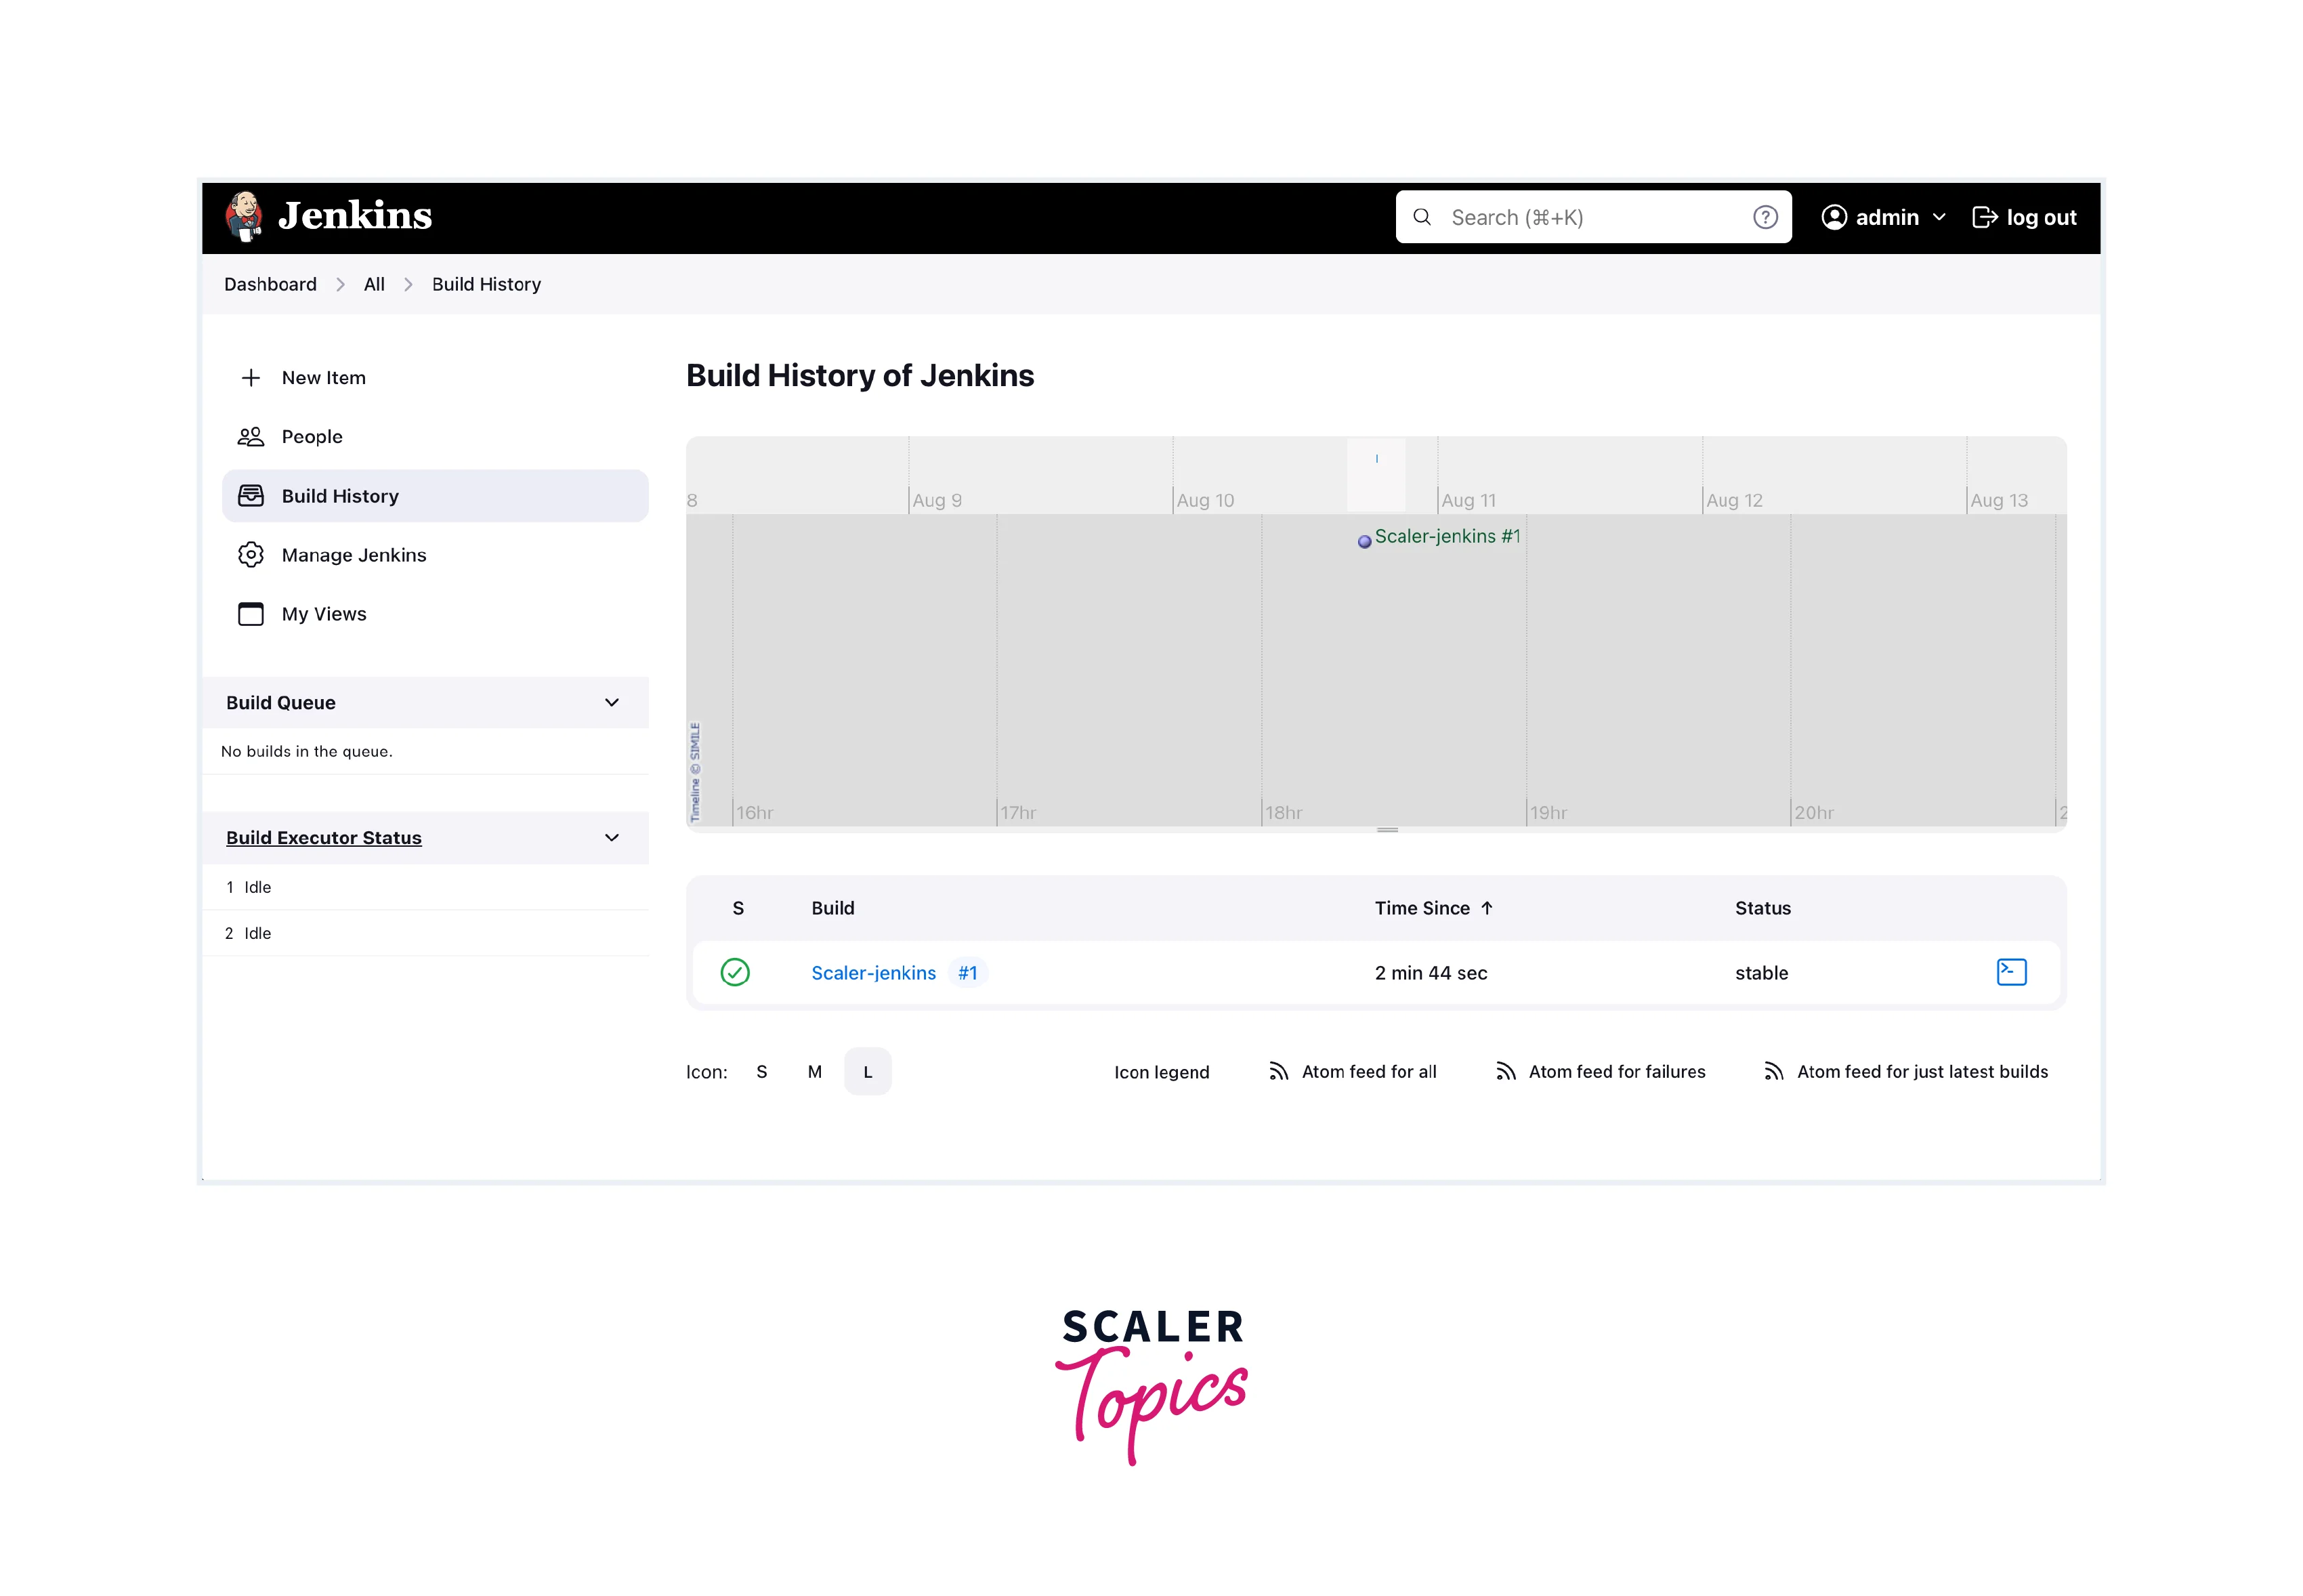
- Job Status Indicators: Pay attention to the status indicators associated with each build job. These icons or colored circles give you an immediate sense of the job's health. Common indicators include a green checkmark for success, a red cross for failure, and a blue circle for ongoing builds.
| Icon | Status |
|---|---|
 | In Progress |
 | Passed |
 | Unstable |
 | Failed |
 | Aborted |
-
Accessing Build Job Details: Click on the name of a specific build job or its associated link. This action will take you to a detailed view of that build job. Here, you'll find comprehensive information such as build history, build parameters, console output, and configuration settings.
-
Access Pipeline Details: Click on a specific pipeline to access its details. Here, you can often find information about the pipeline's structure, stages, and any ongoing or completed runs.
-
Plugins and Visual Enhancements: Depending on your Jenkins setup, you might have plugins or tools that enhance the visualization and management of build jobs and pipelines. Explore your plugin options to see if any features can improve your experience.
Build Job Management
Managing build jobs is a crucial aspect of maintaining your CI/CD pipelines efficiently. You could choose between what type of project you would like to build. eg. Freestyle project, Pipeline, Multi-configuration project, Folder, Multibranch pipeline, and organizational folder.
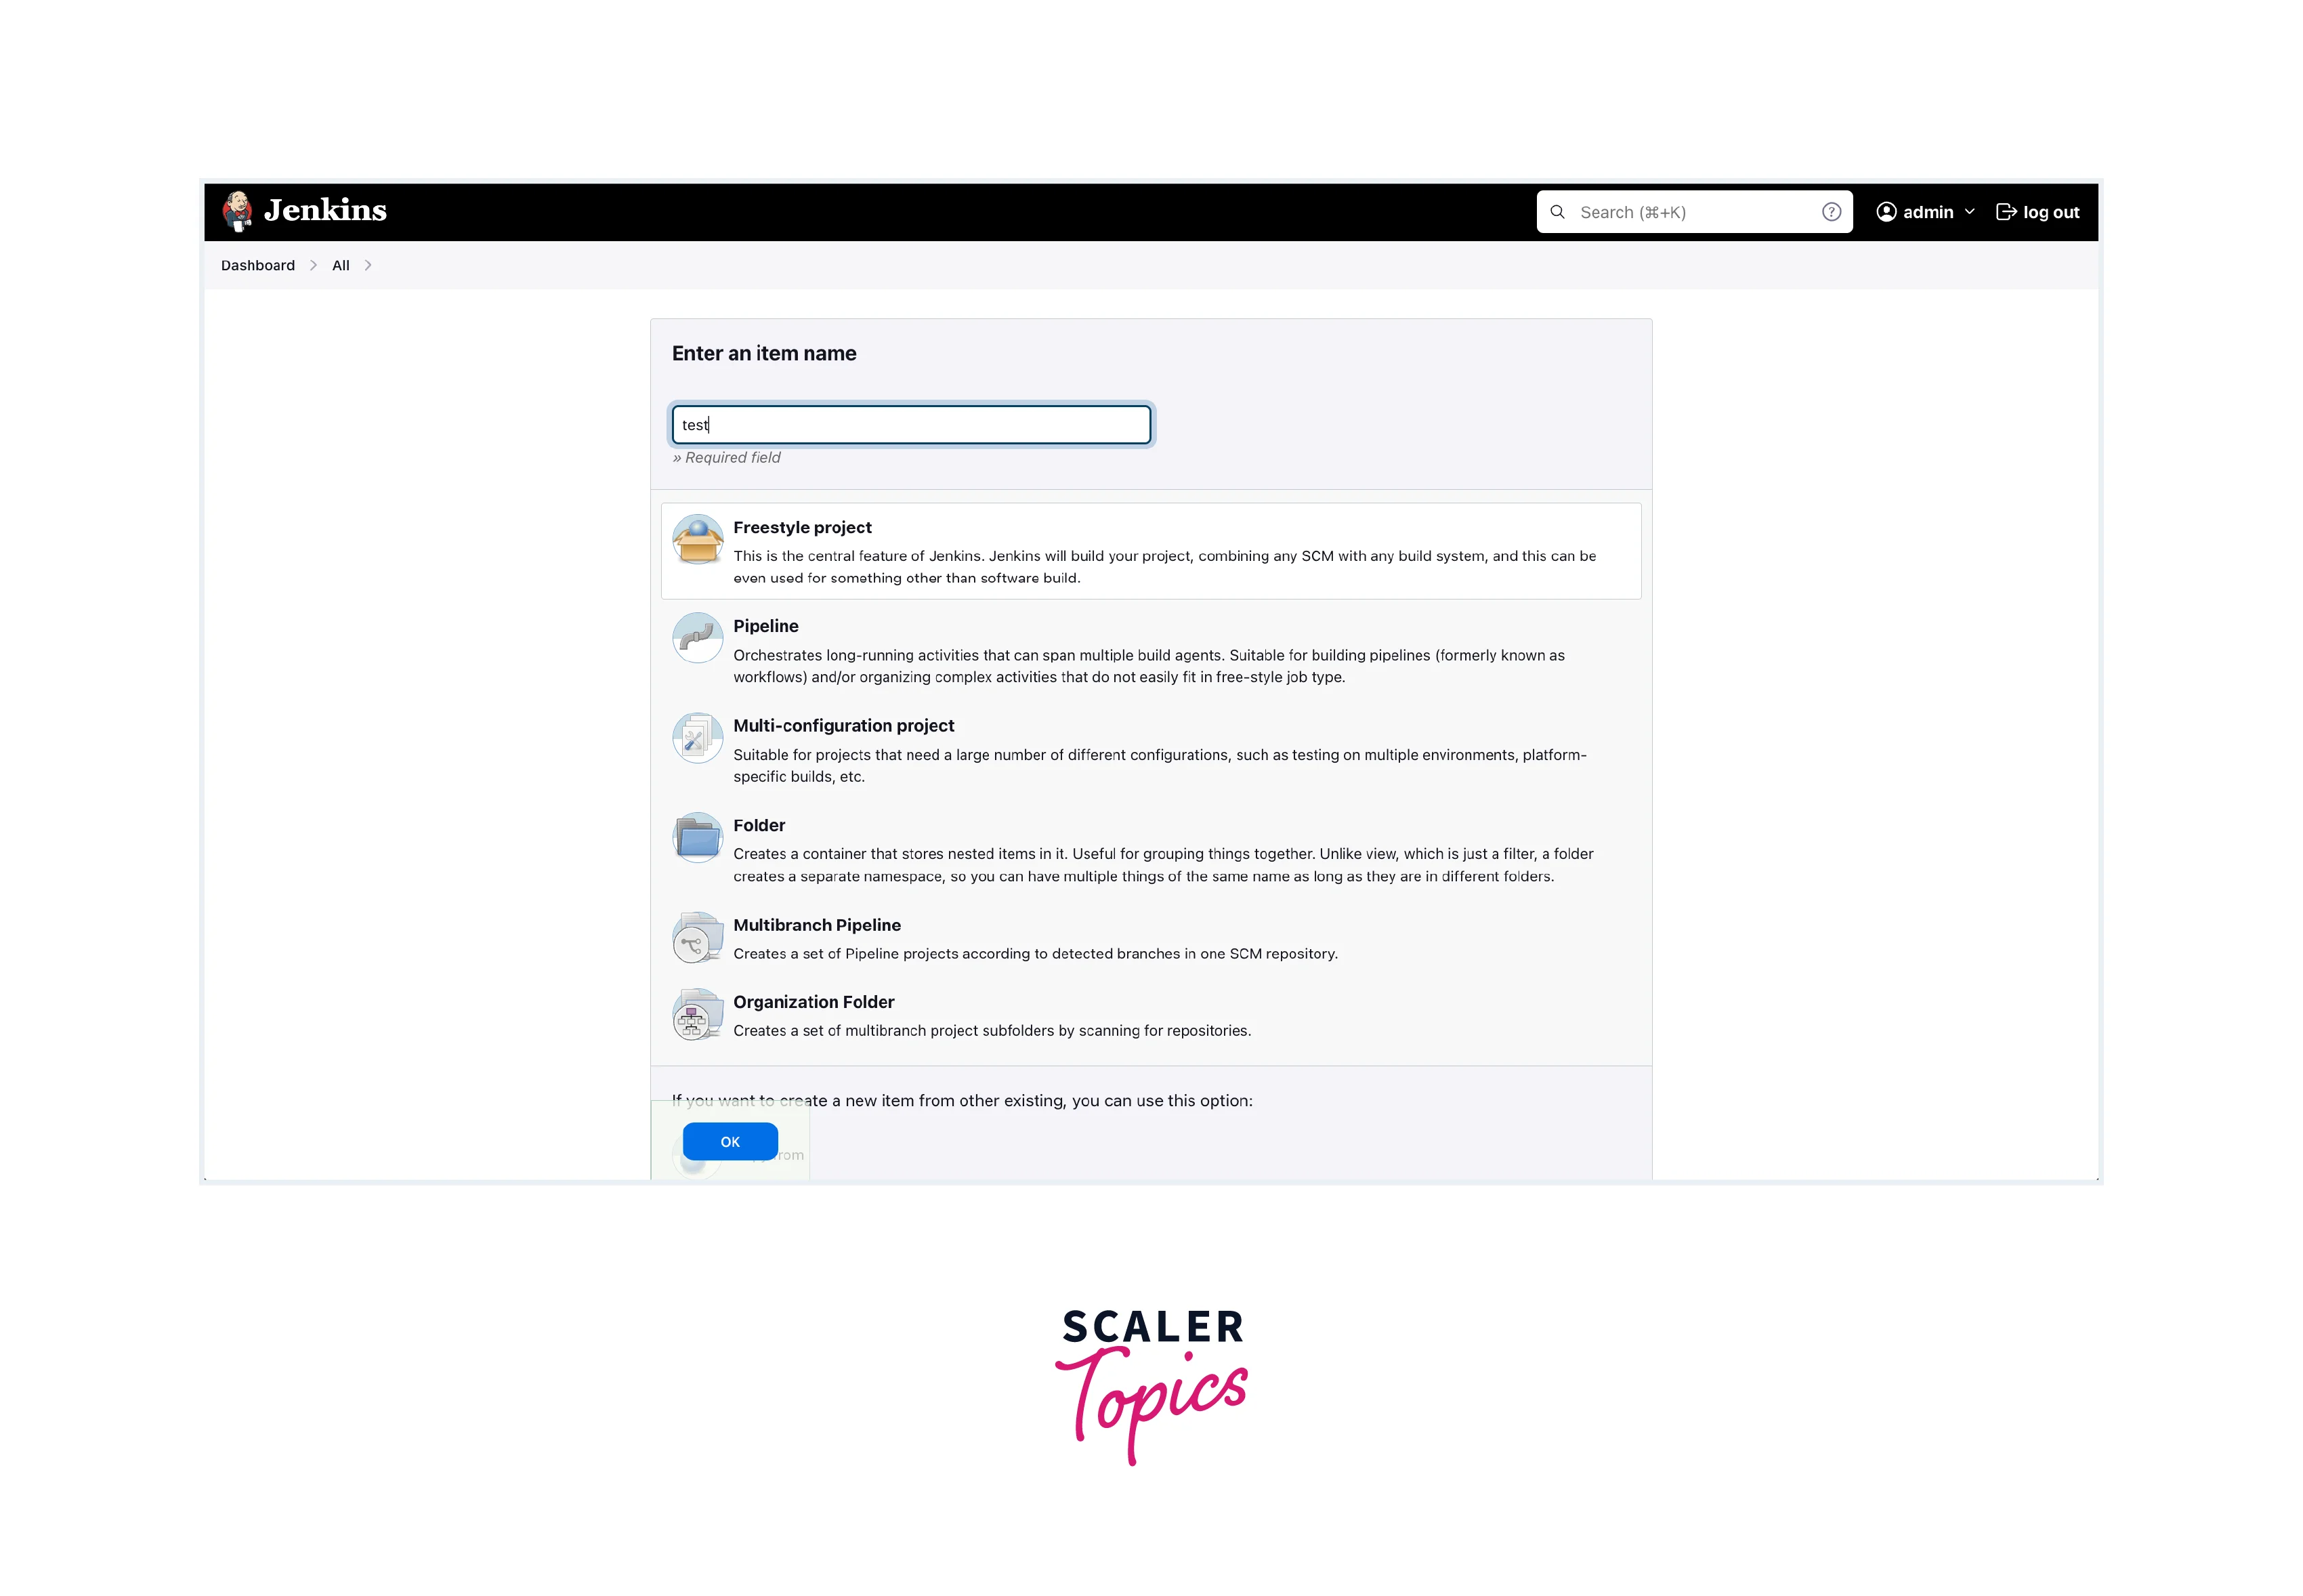
- Select Build Job Type: Jenkins offers various types of build jobs. Choose the appropriate type based on your needs. Common types include "Freestyle project" and "Pipeline."
- Configure Build Job: You'll be directed to a configuration page for the new build job. Here are some key configurations you might encounter:
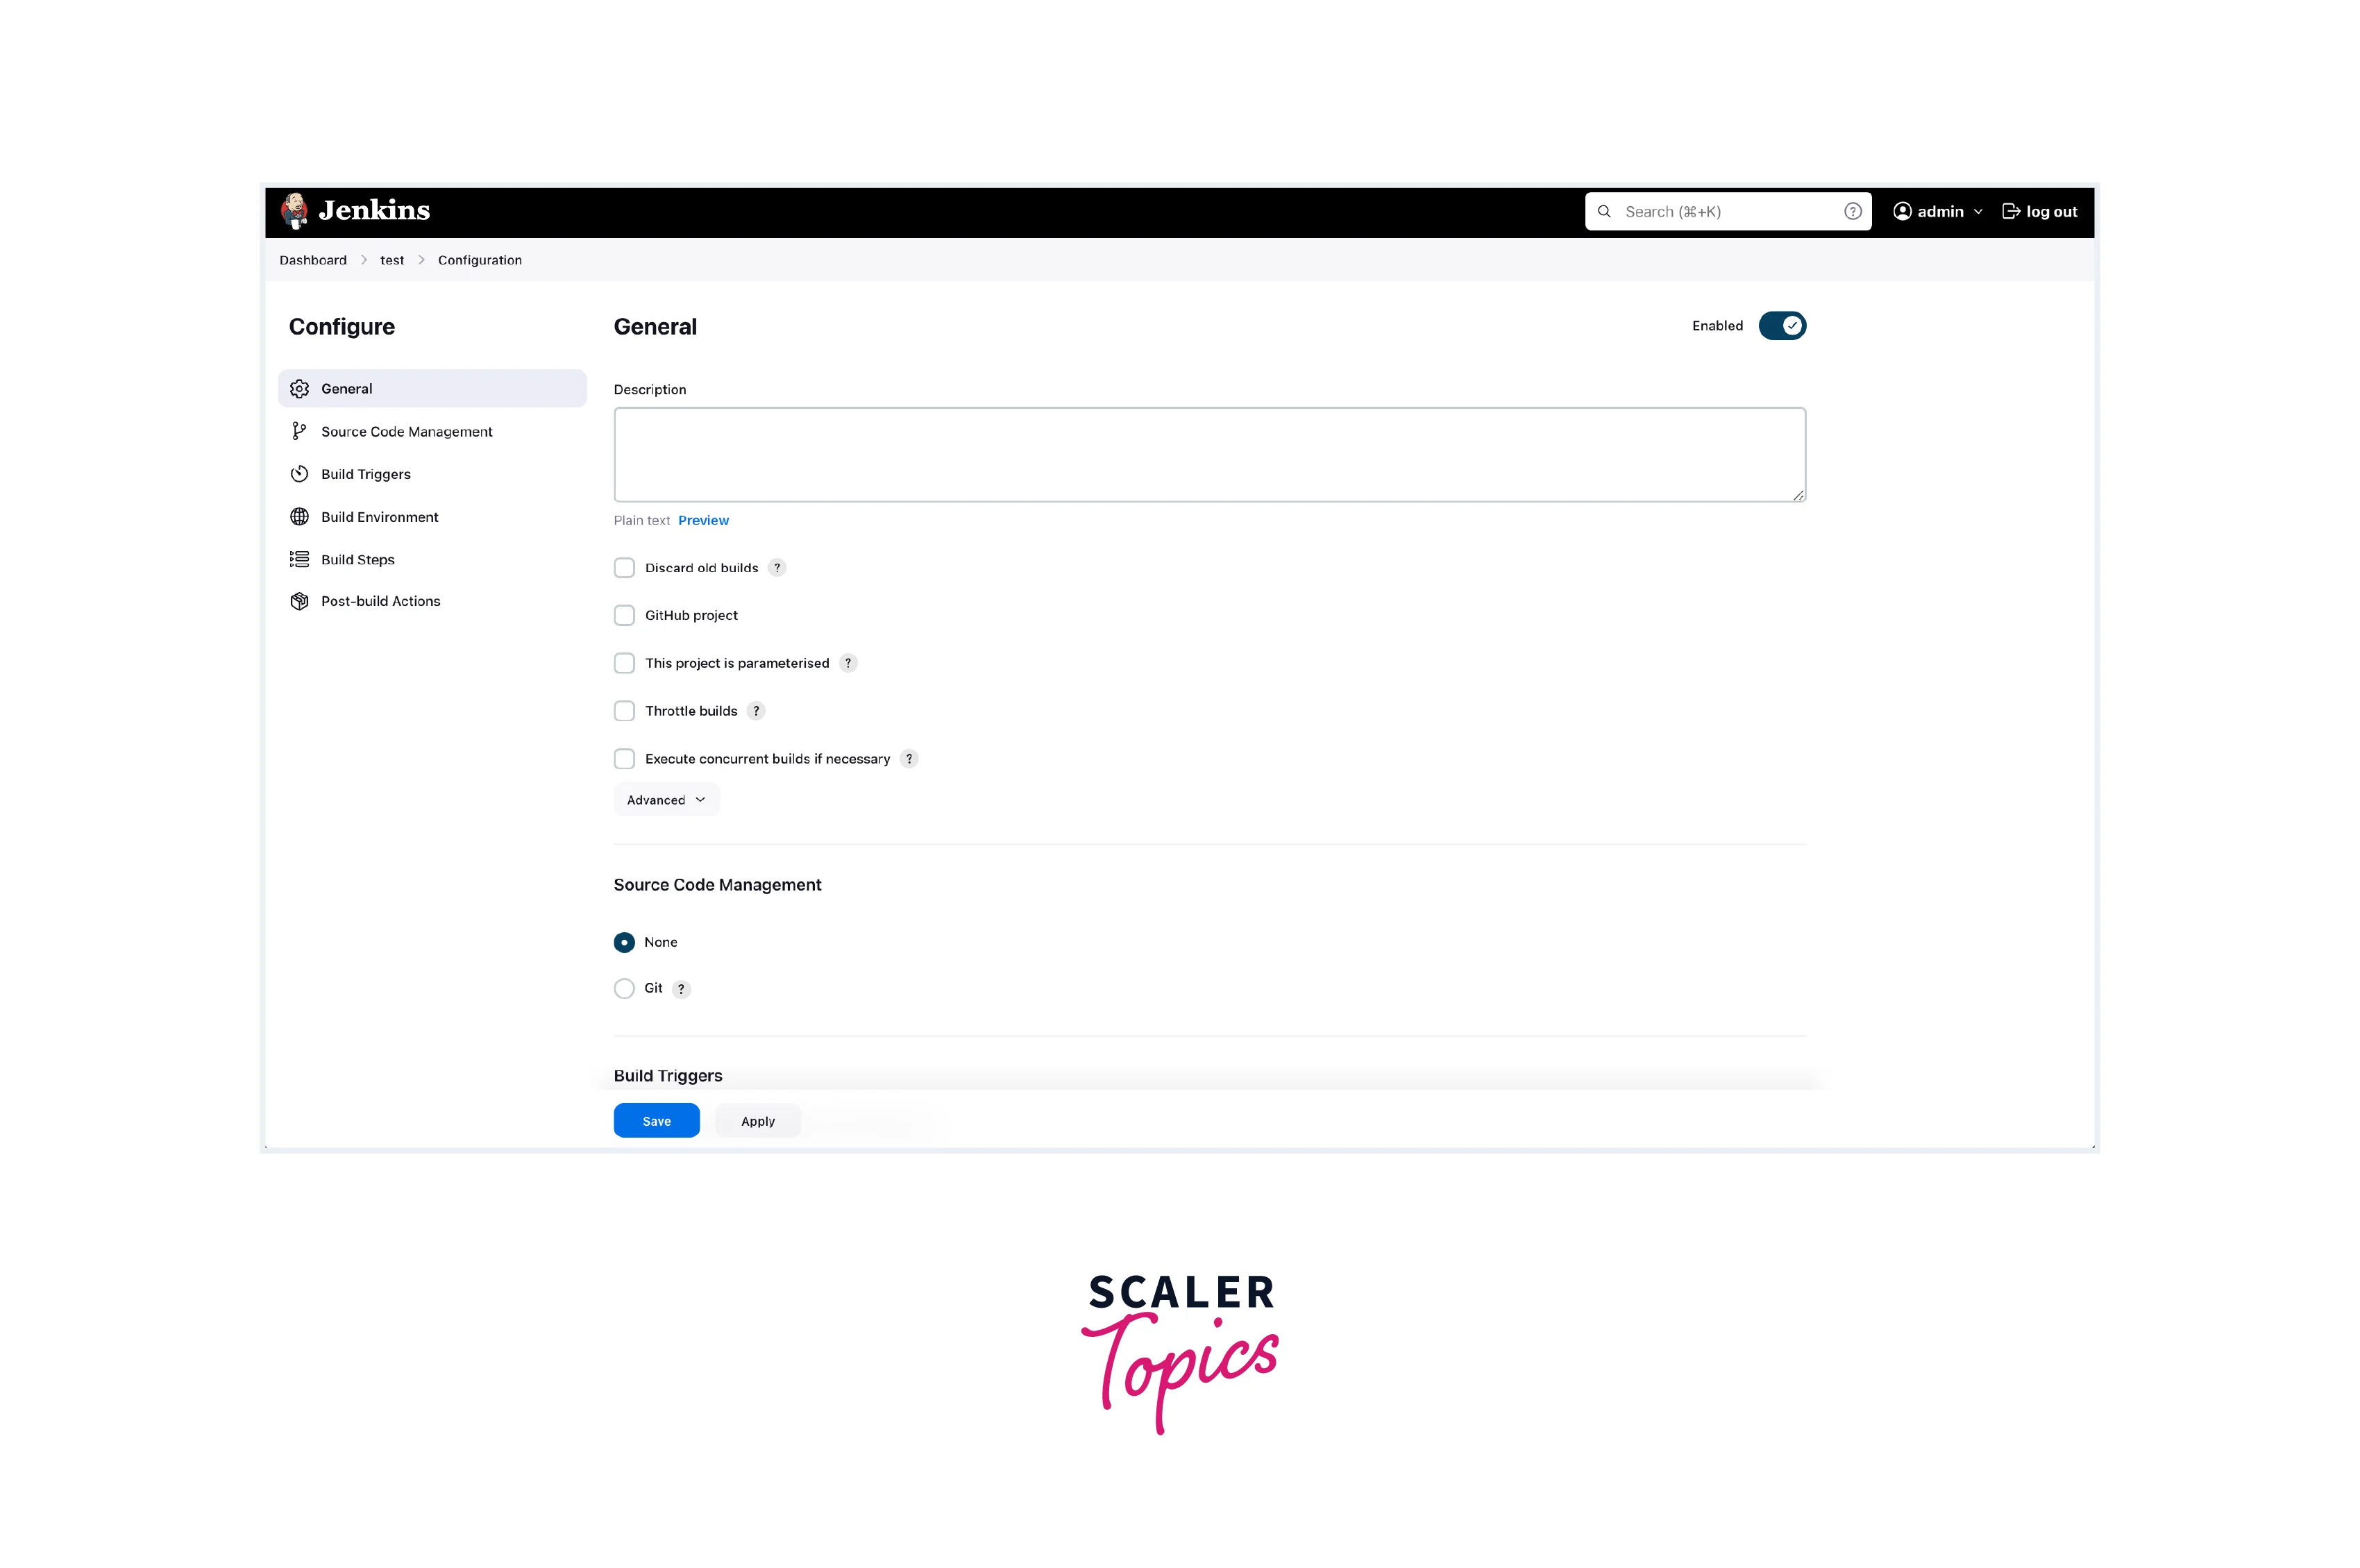
- Source Code Management: Configure the version control system (e.g., Git, SVN) and repository URL.
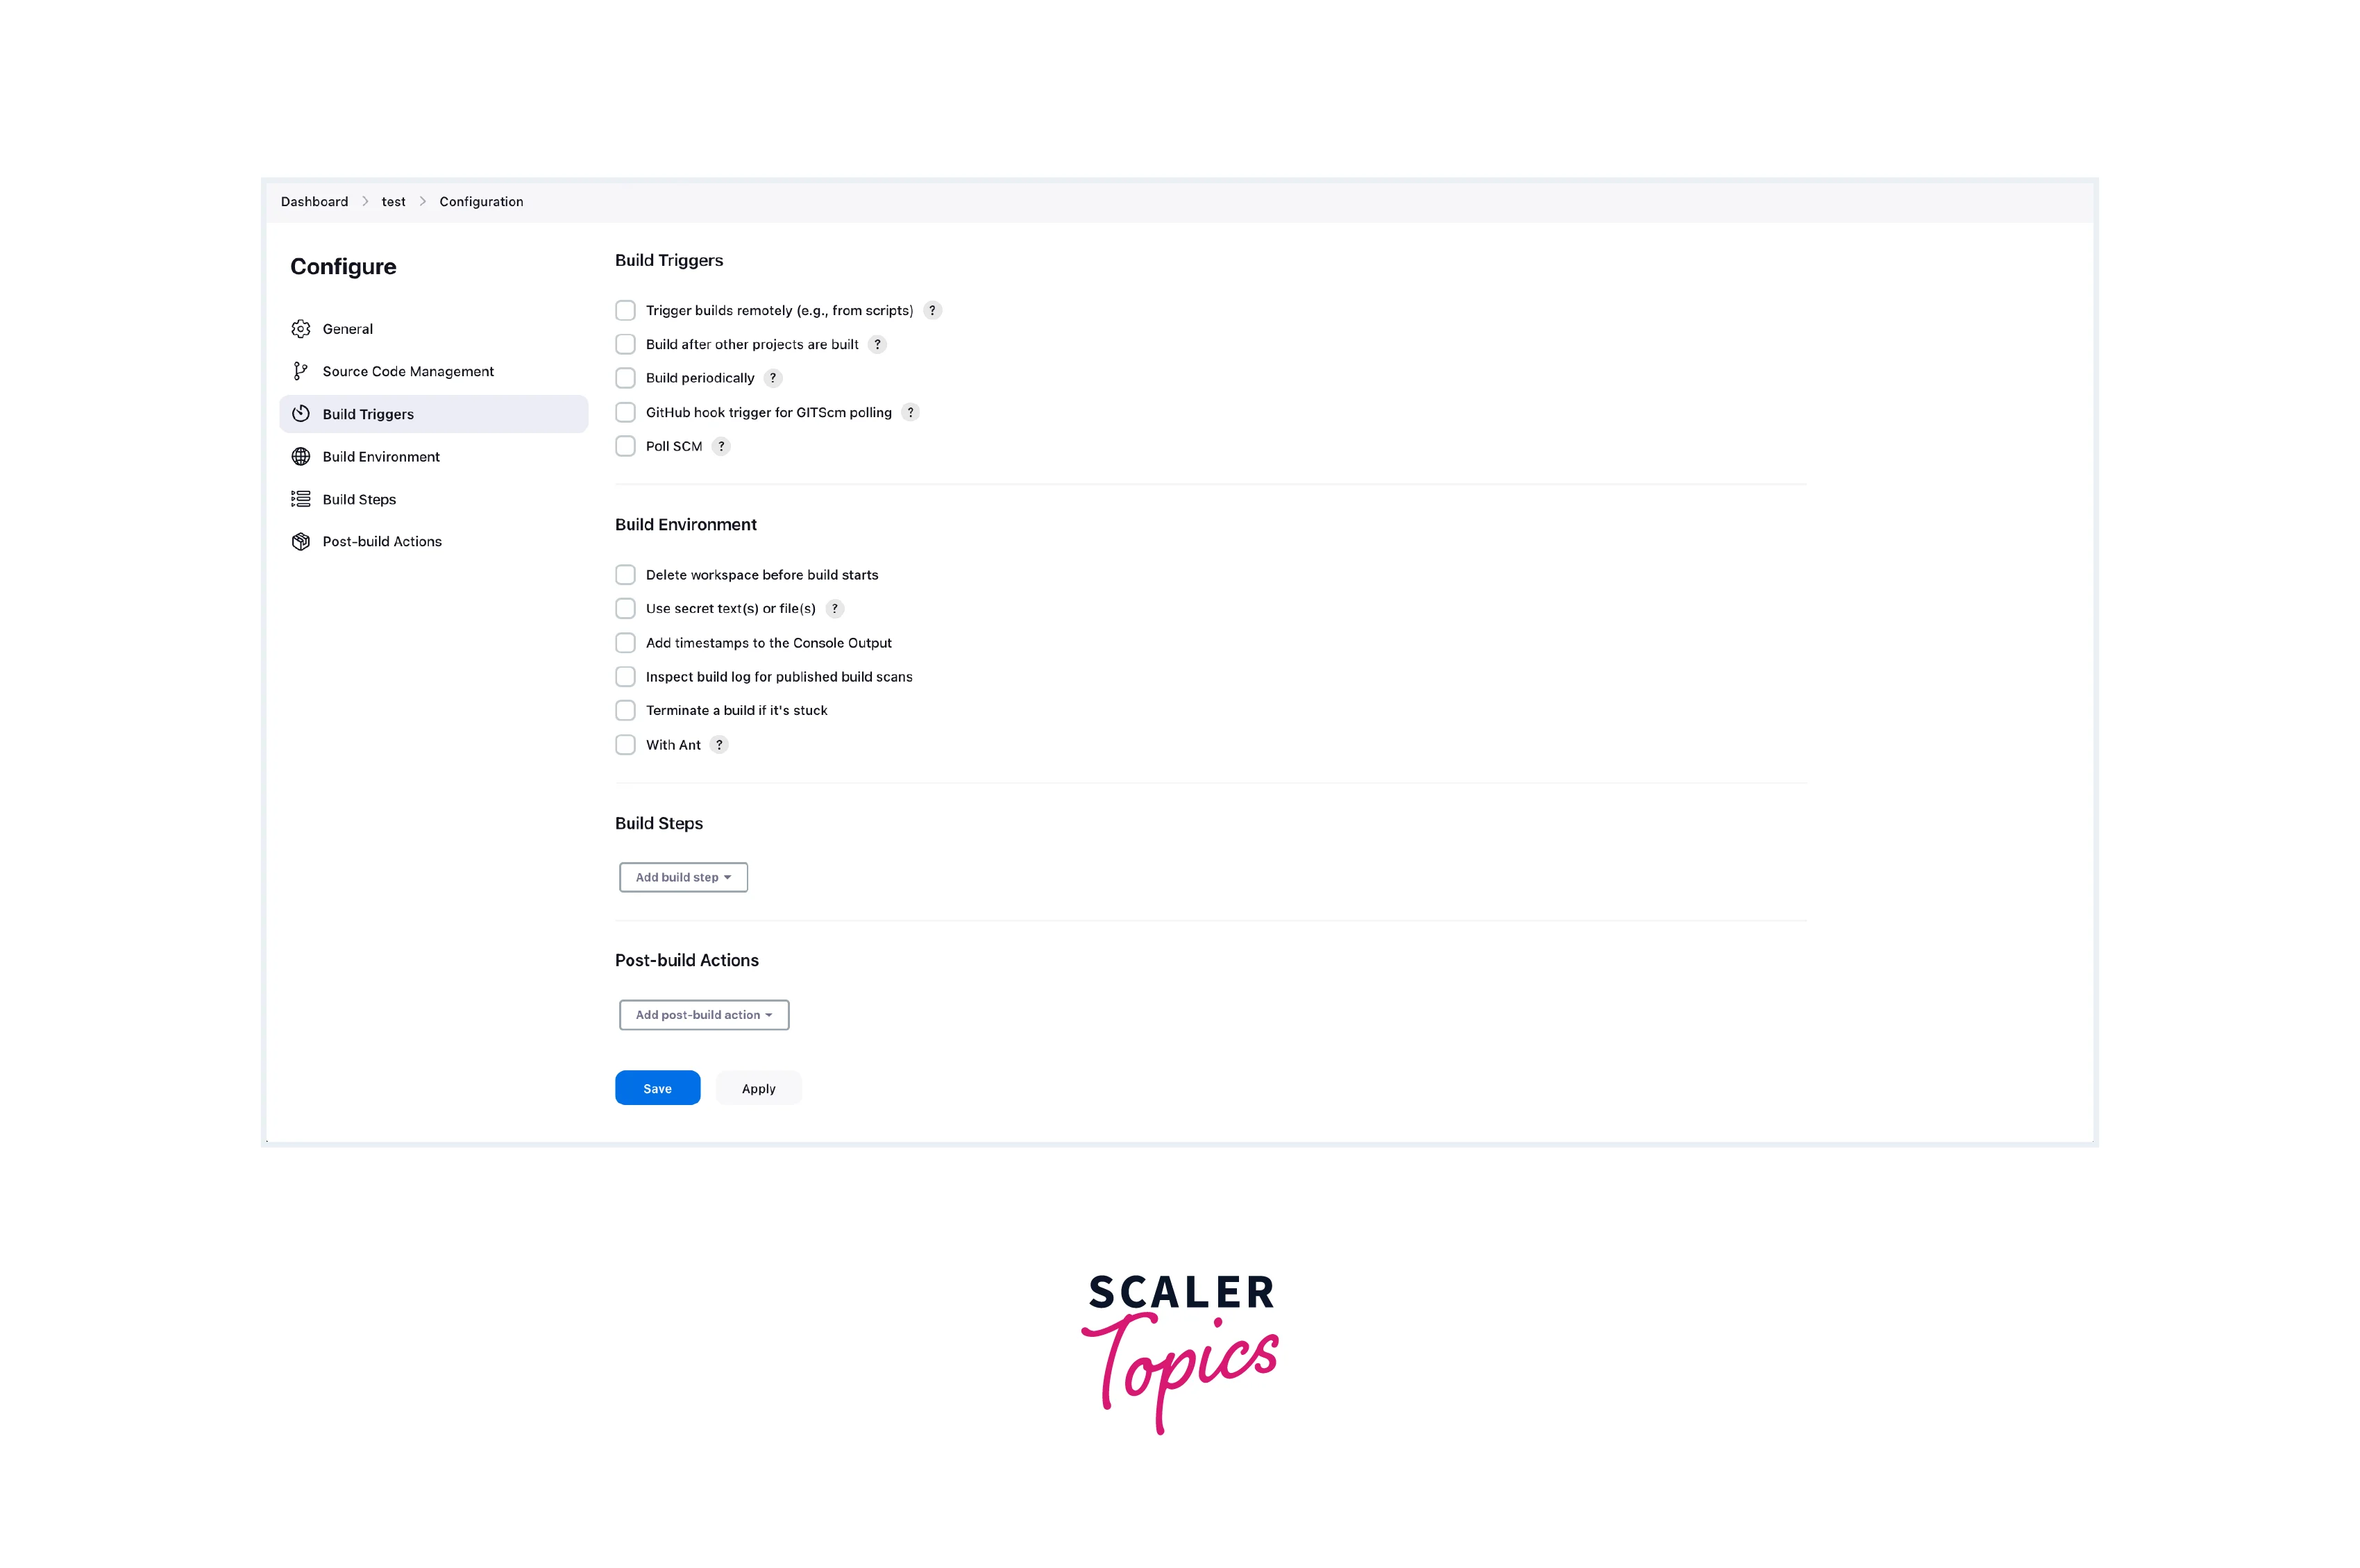
- Build Triggers: Define conditions that trigger the build, such as code commits or schedules.
- Build Environment: Set up environment variables, tools, and options for the build process.
- Build Steps/Script: Specify the actions to be executed during the build, such as compiling, testing, and packaging.
- Post-Build Actions: Define actions to take after the build, such as archiving artefacts, sending notifications, or triggering downstream jobs.
- Save Configuration Changes: After making modifications, click the "Save" or "Apply" button to save your changes.
- Triggering Builds: Some jobs might be triggered automatically based on events, while others might require manual initiation. Explore the various triggering options based on your requirements.
Understanding Pipelines
In Jenkins, a pipeline is a series of steps that define how your code is built, tested, and deployed. Pipelines can be as simple as a linear sequence of steps or as complex as involving multiple stages and branches.
Pipeline Types: Jenkins supports two main types of pipelines: Declarative and Scripted. Declarative pipelines use a predefined structure with concise syntax, while scripted pipelines offer more flexibility through Groovy scripting.
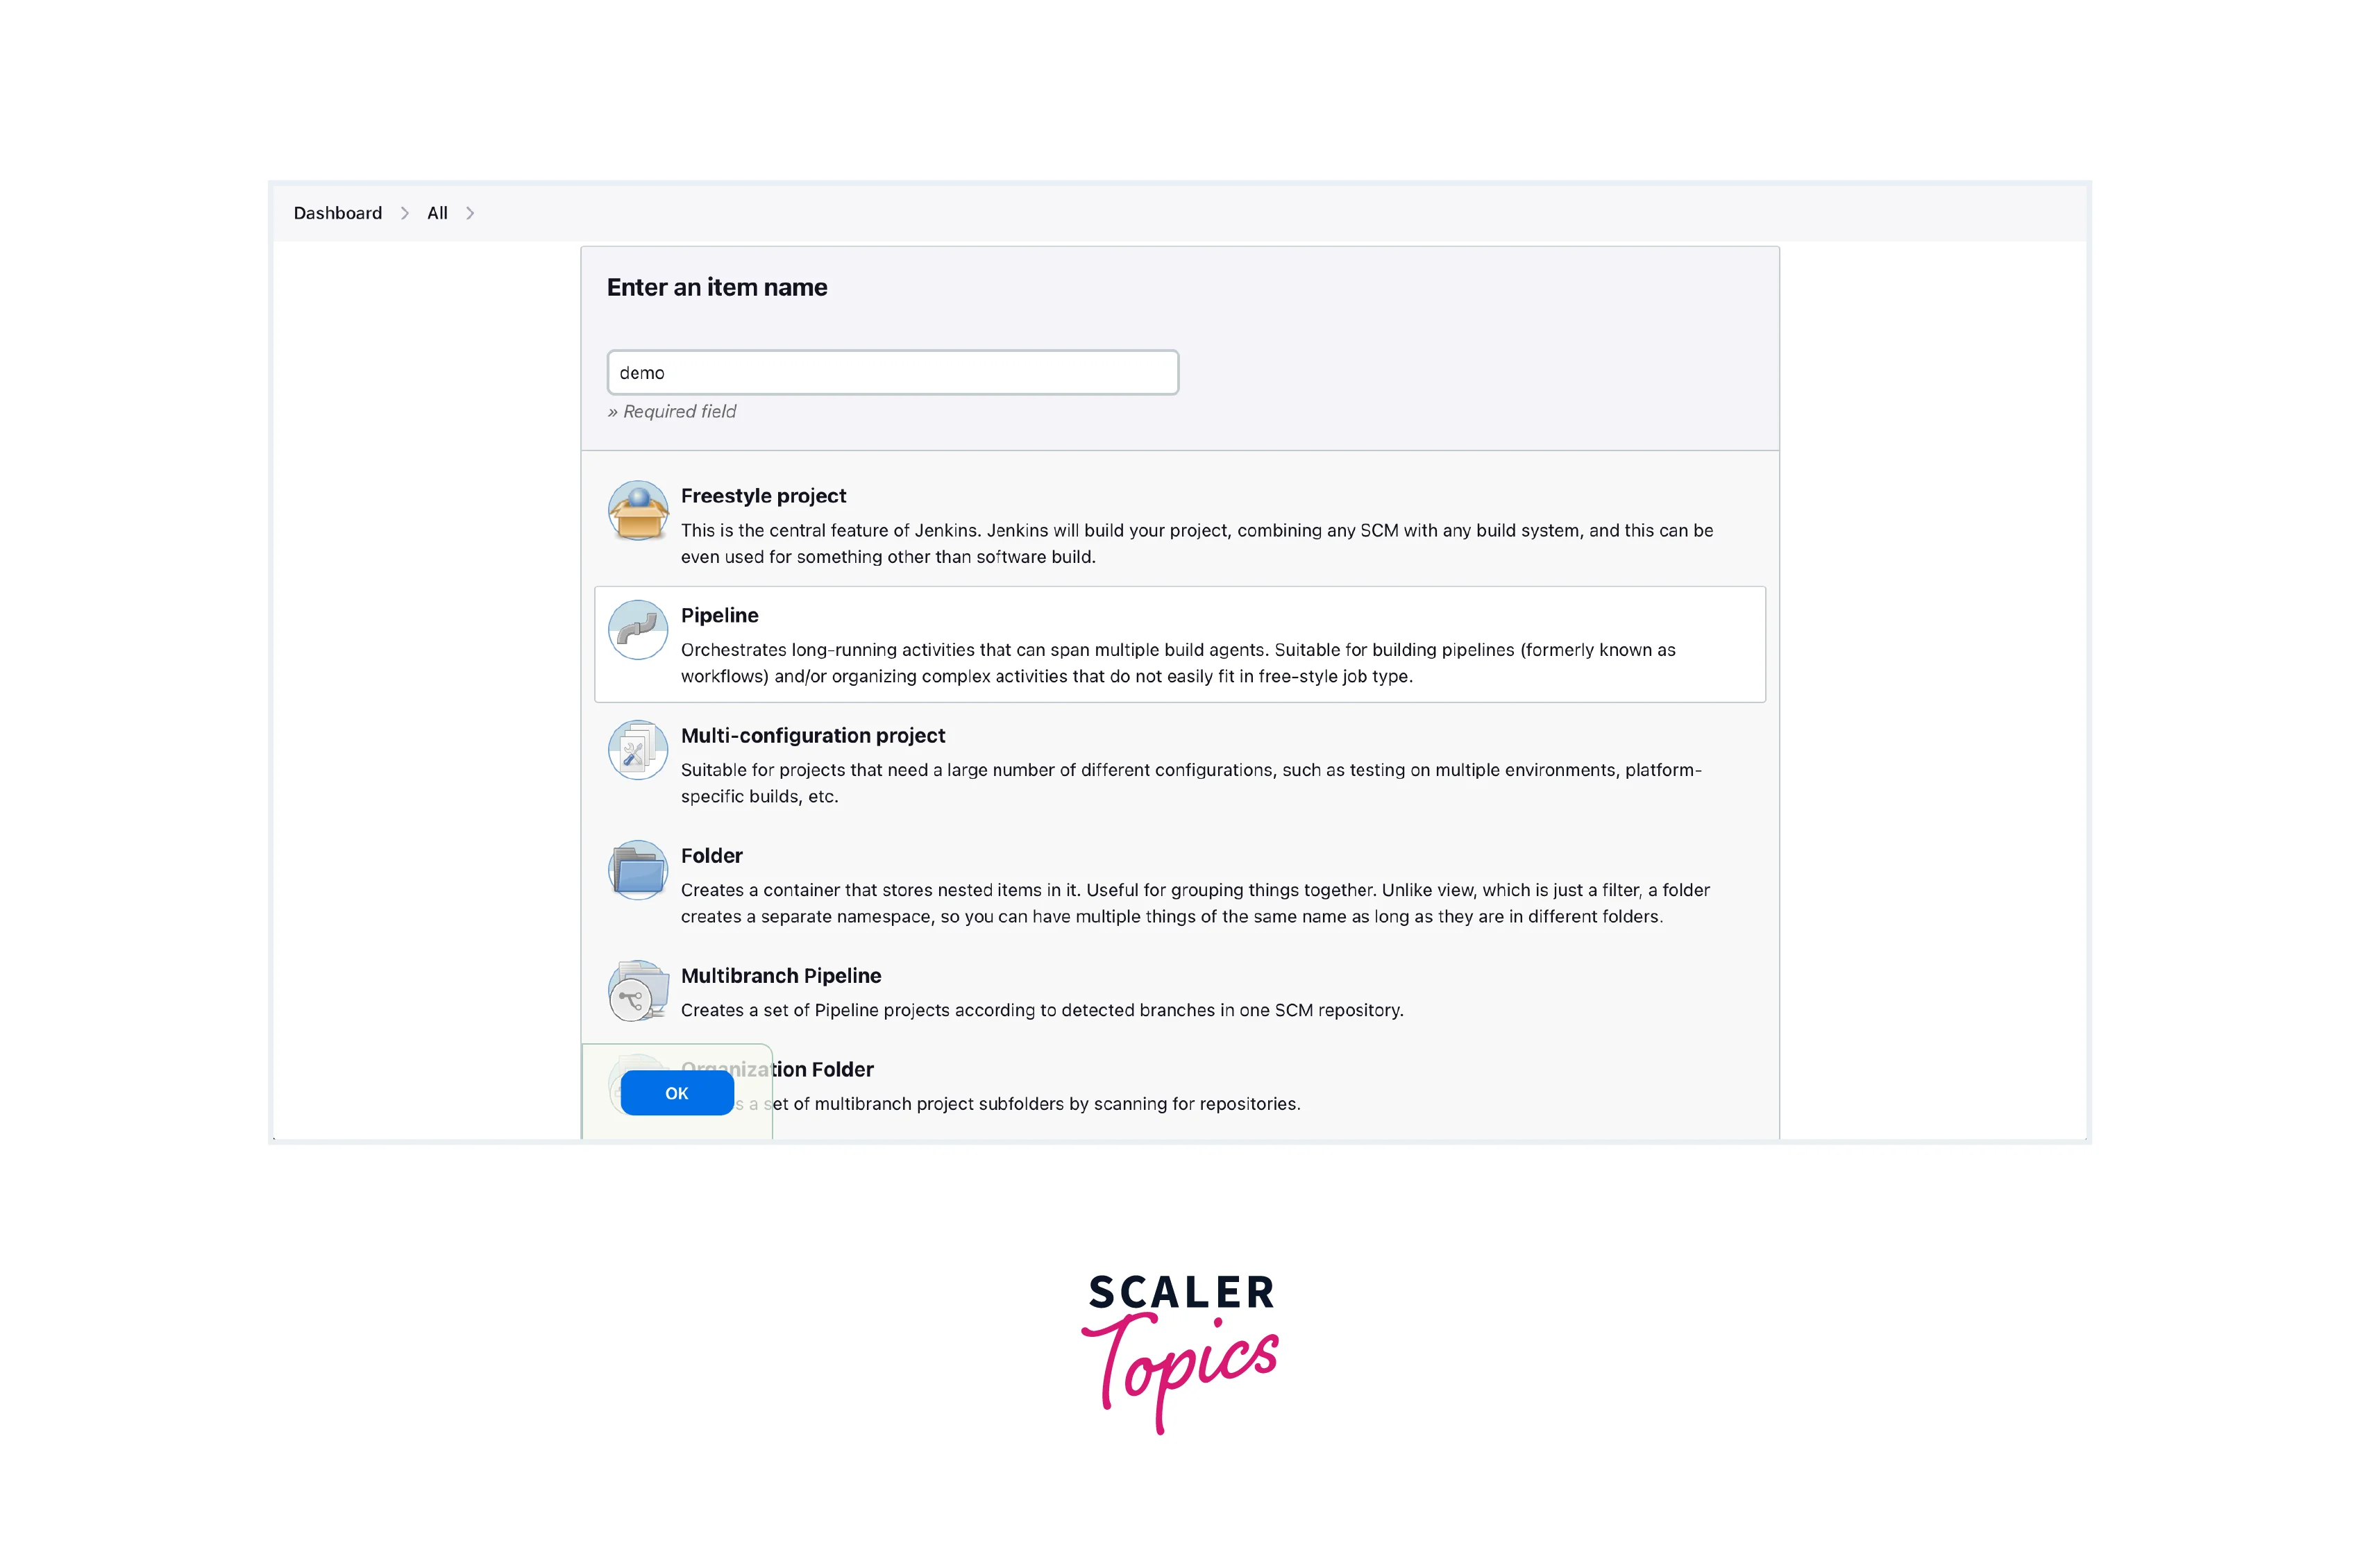
- Creating a Pipeline:
- Navigate to the "New Item" or "Create Job" section on the Dashboard.
- Choose "Pipeline" as the job type. Enter a name for your pipeline and click "OK."
- Pipeline Configuration:
- For Declarative Pipelines, you'll use a Jenkinsfile with a predefined structure.
- For Scripted Pipelines, you can use Groovy scripting to define each step.
- Pipeline Stages:
- Pipelines are composed of stages. Each stage represents a phase in your CI/CD process, such as building, testing, and deploying.
- Within each stage, you can define multiple steps to be executed.
- Pipeline Steps:
- Steps are the actual tasks performed within a stage. They can include shell commands, file operations, environment setups, and more.
- Here's a demo for different pipeline Stages and Pipeline Steps.
- Stages: This section defines the different stages of the pipeline.
- stage('Build'), stage('Test'), stage('Deploy'): These define individual stages with corresponding steps.
- steps: In each stage, you can add the necessary commands and actions for building, testing, and deploying your application.
- echo: This is used to print messages to the console, simulating the execution of commands.
- post: This section defines actions to be taken after the pipeline stages are complete.
- success: This block executes when all stages succeed.
- failure: This block executes when any of the stages fail.
- Parallel Execution:
- Pipelines can execute stages or steps in parallel to expedite the process. Use the parallel block in Declarative Pipelines or Groovy's parallel constructs in Scripted Pipelines.
- Post-build Actions:
- After all stages are executed, you can define post-build actions. These actions could include archiving artefacts, sending notifications, or triggering downstream jobs.
- Pipeline Triggers:
- You can trigger pipeline runs manually, based on code commits, on a schedule, or through other events.
- Define triggers in your pipeline configuration.
- Pipeline Scripted Syntax:
- If using Scripted Pipelines, you can utilize Groovy scripting to add advanced logic, loops, and conditionals.
- However, remember that this comes with increased complexity.
- Pipeline Best Practices:
- Follow best practices for pipeline design, including keeping stages and steps modular, writing clear and maintainable code, and implementing error handling and logging. As you become more comfortable with pipelines, you'll be able to model even the most intricate development processes efficiently.
Real-time Monitoring and Notifications
In a dynamic development environment, staying informed about the status of your CI/CD pipelines is crucial. Real-time monitoring provides instant insights into the progress of your builds and deployments, allowing you to catch issues early and ensure smooth operations. Additionally, timely notifications keep you and your team updated on important events, enabling quick responses to failures and improvements in your development process.
Jenkins offers several mechanisms for real-time monitoring:
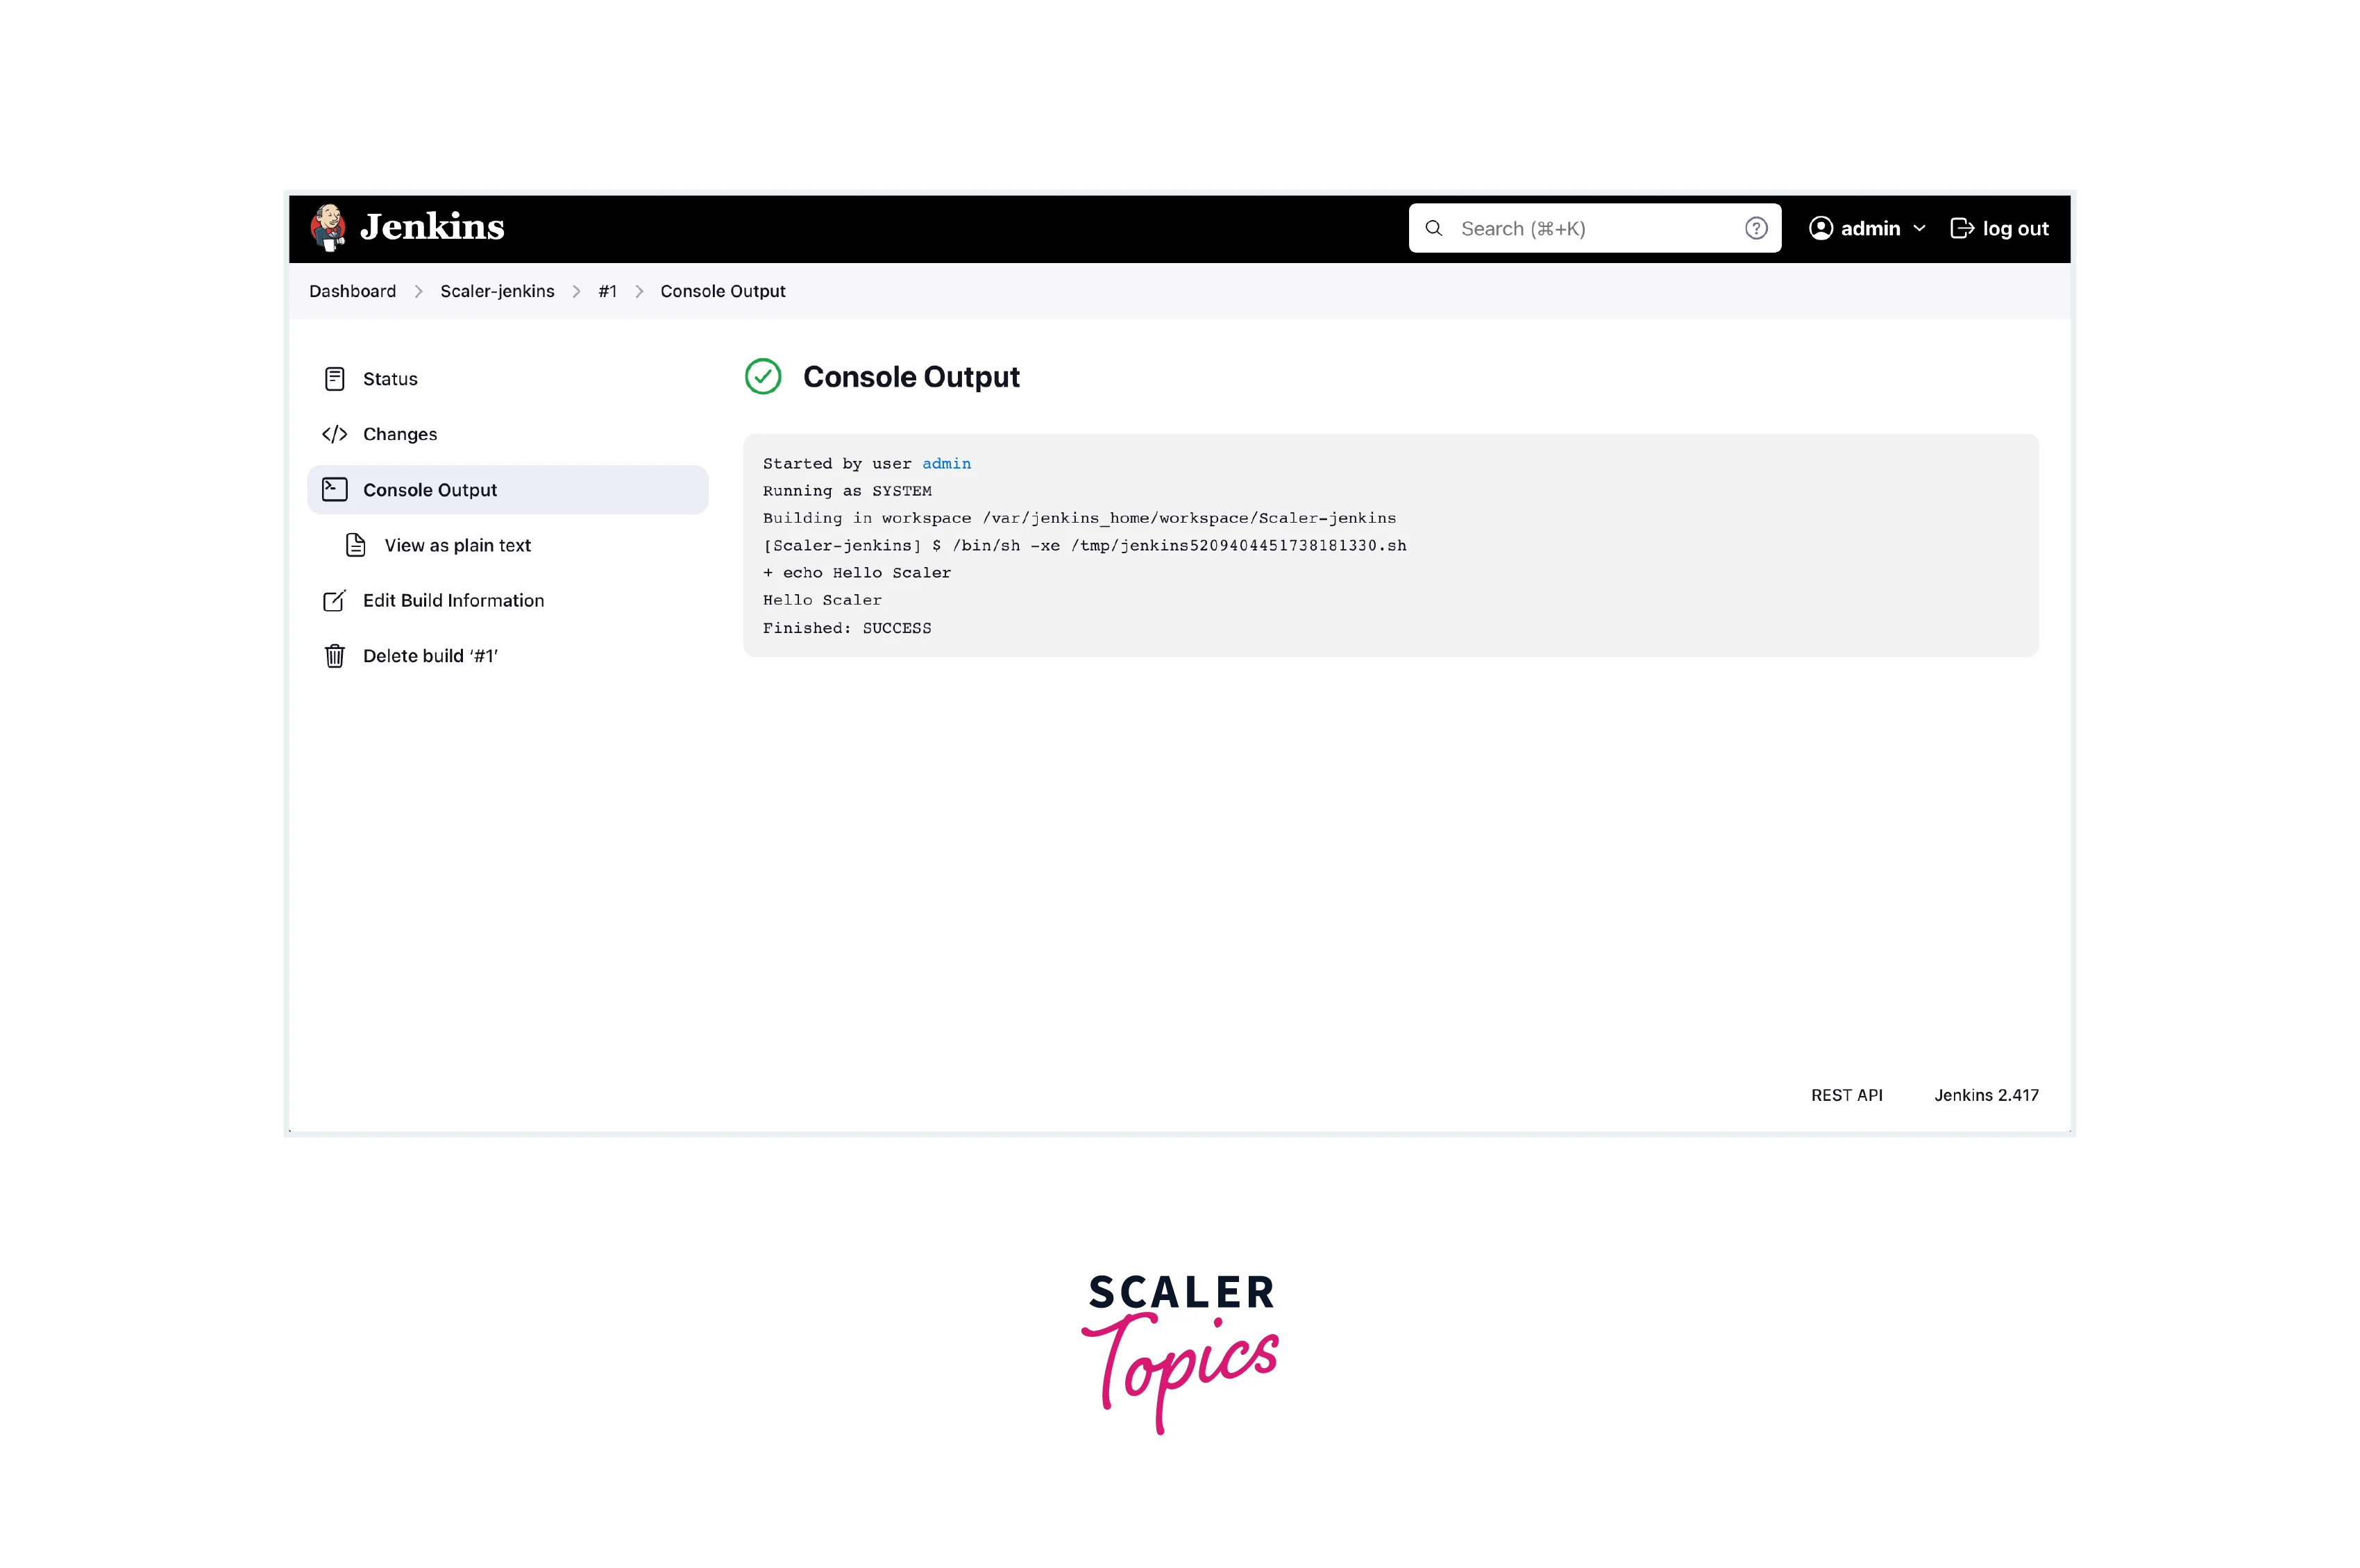
- Console Output: When a build is running, you can view its console output in real-time. This live log displays the commands being executed, helping you understand the progress and spot any errors.
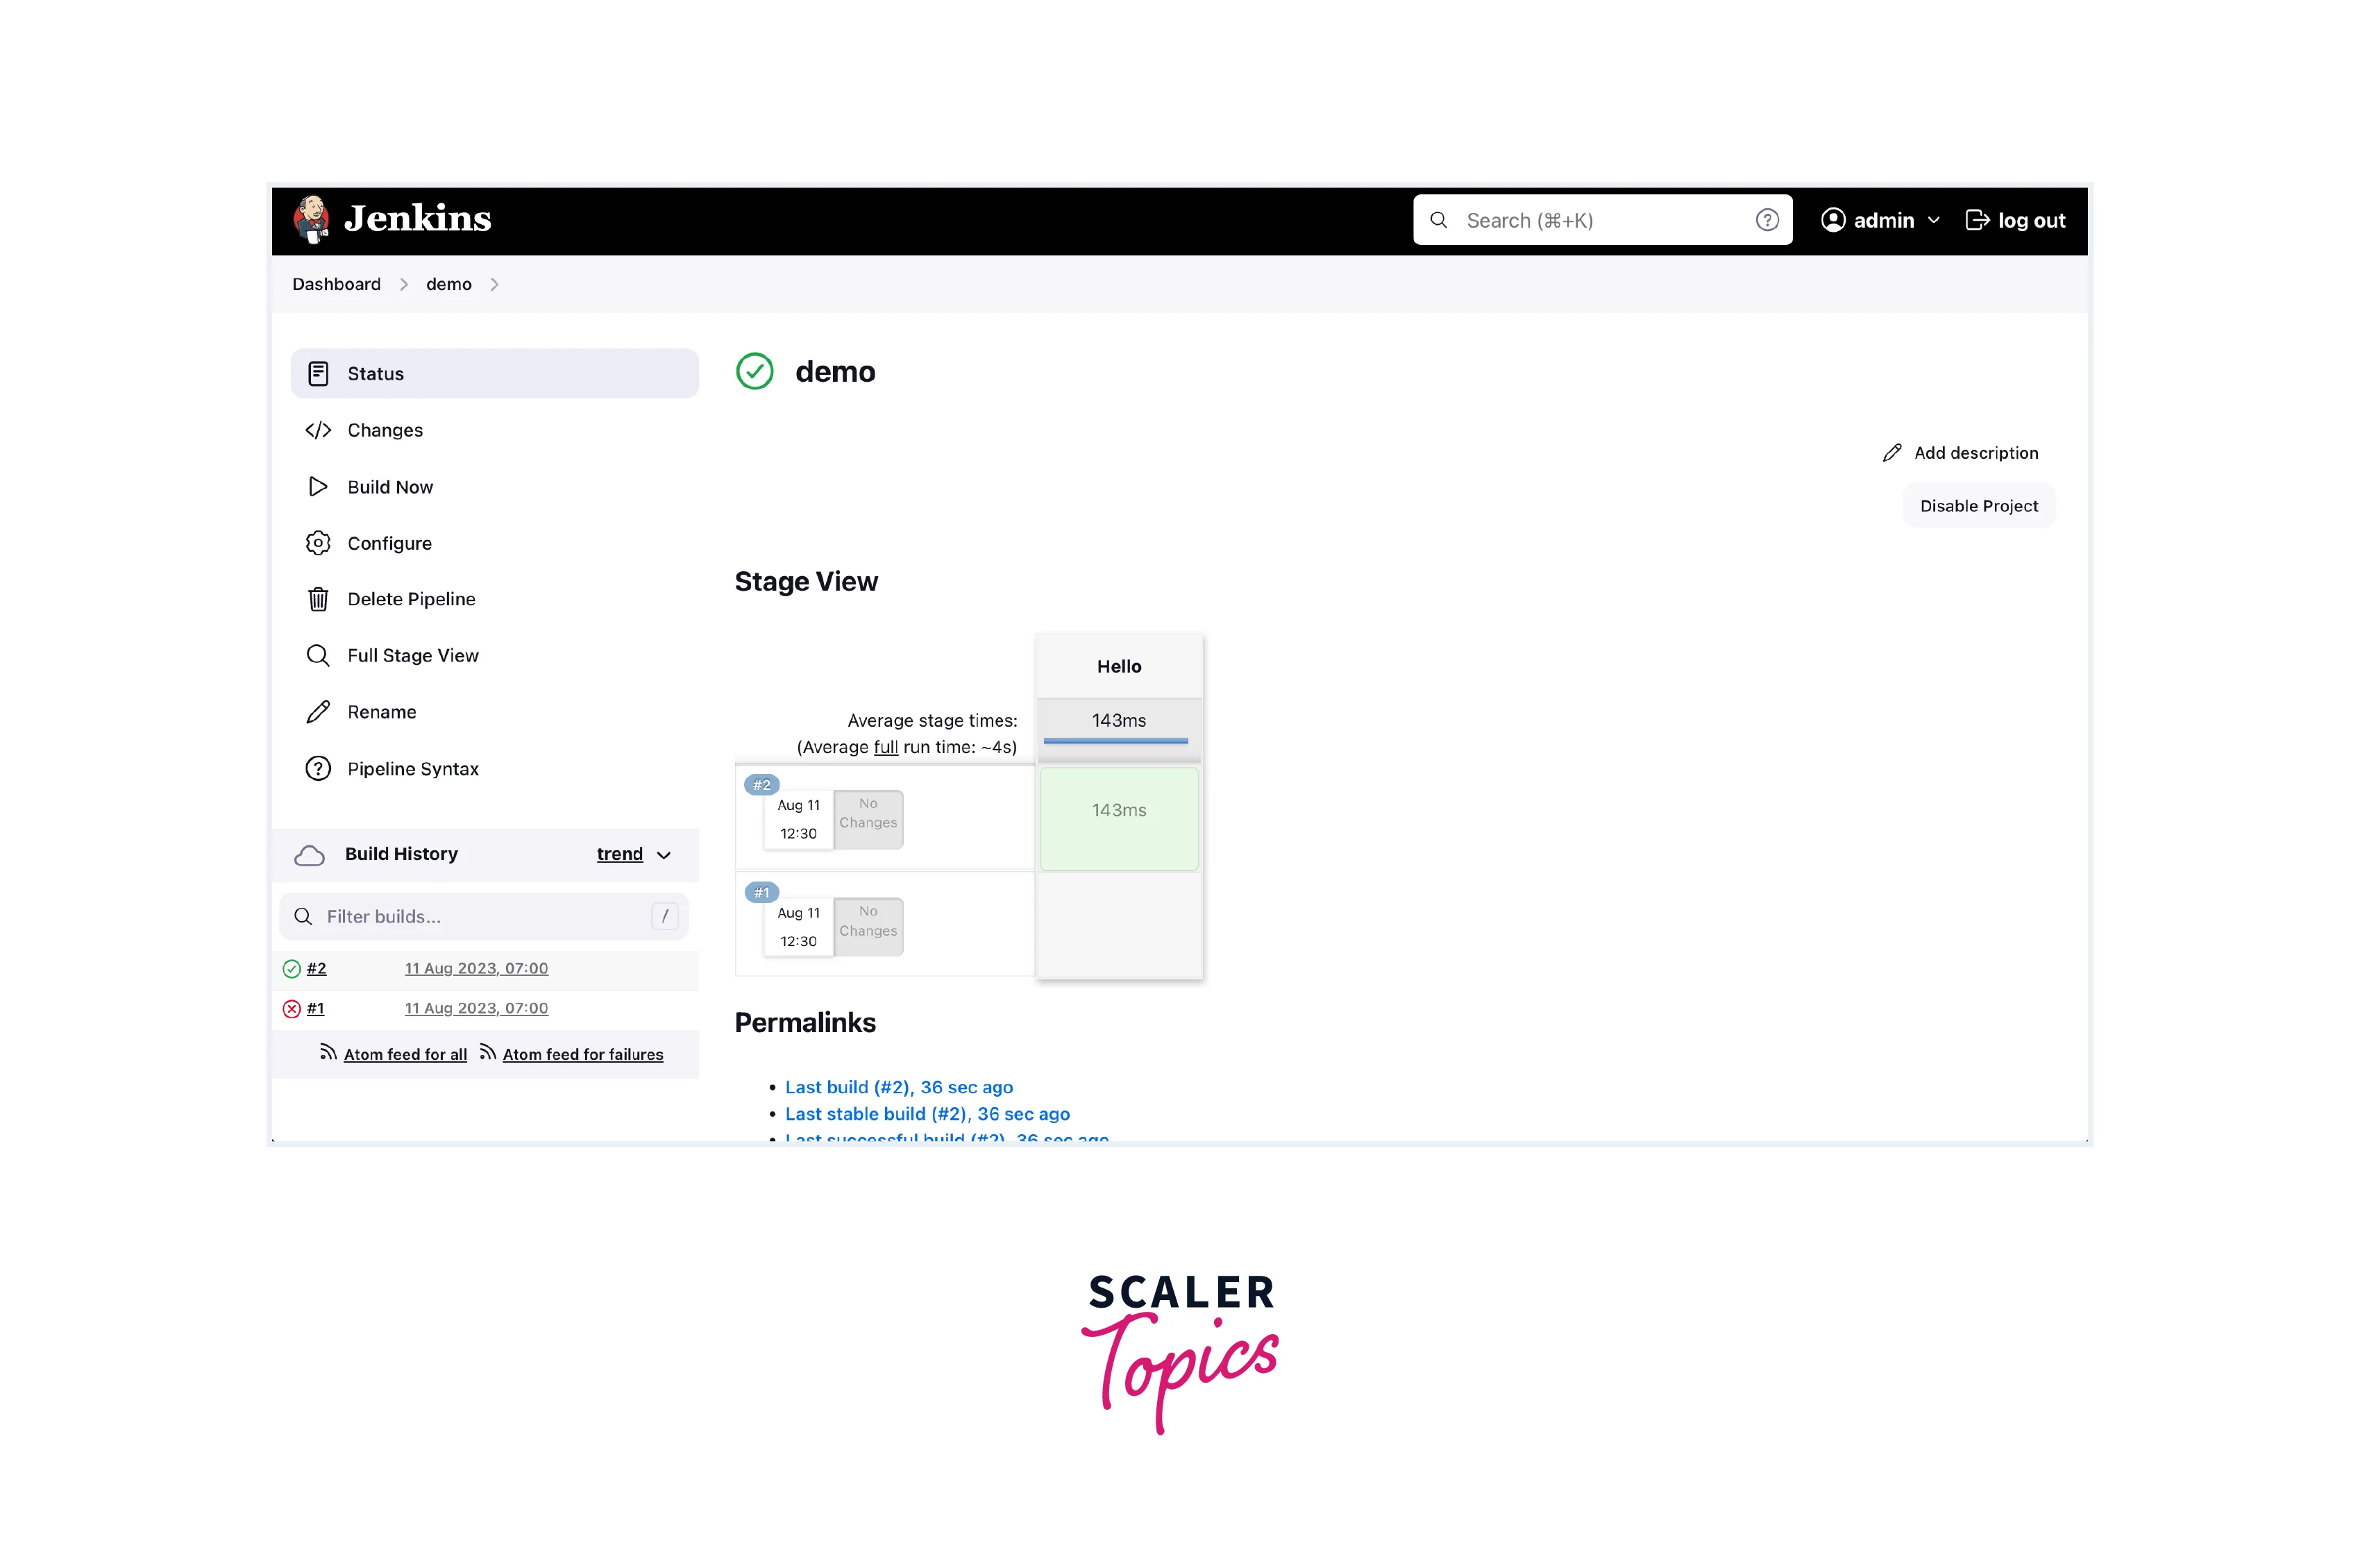
 2. Build Stage View: For pipelines, Jenkins provides a visual representation of the stages and their execution status. This visual flow allows you to track the progress of each stage at a glance.
Setting Up Notifications
Jenkins allows you to configure various notification mechanisms to keep you informed about build outcomes and important events:
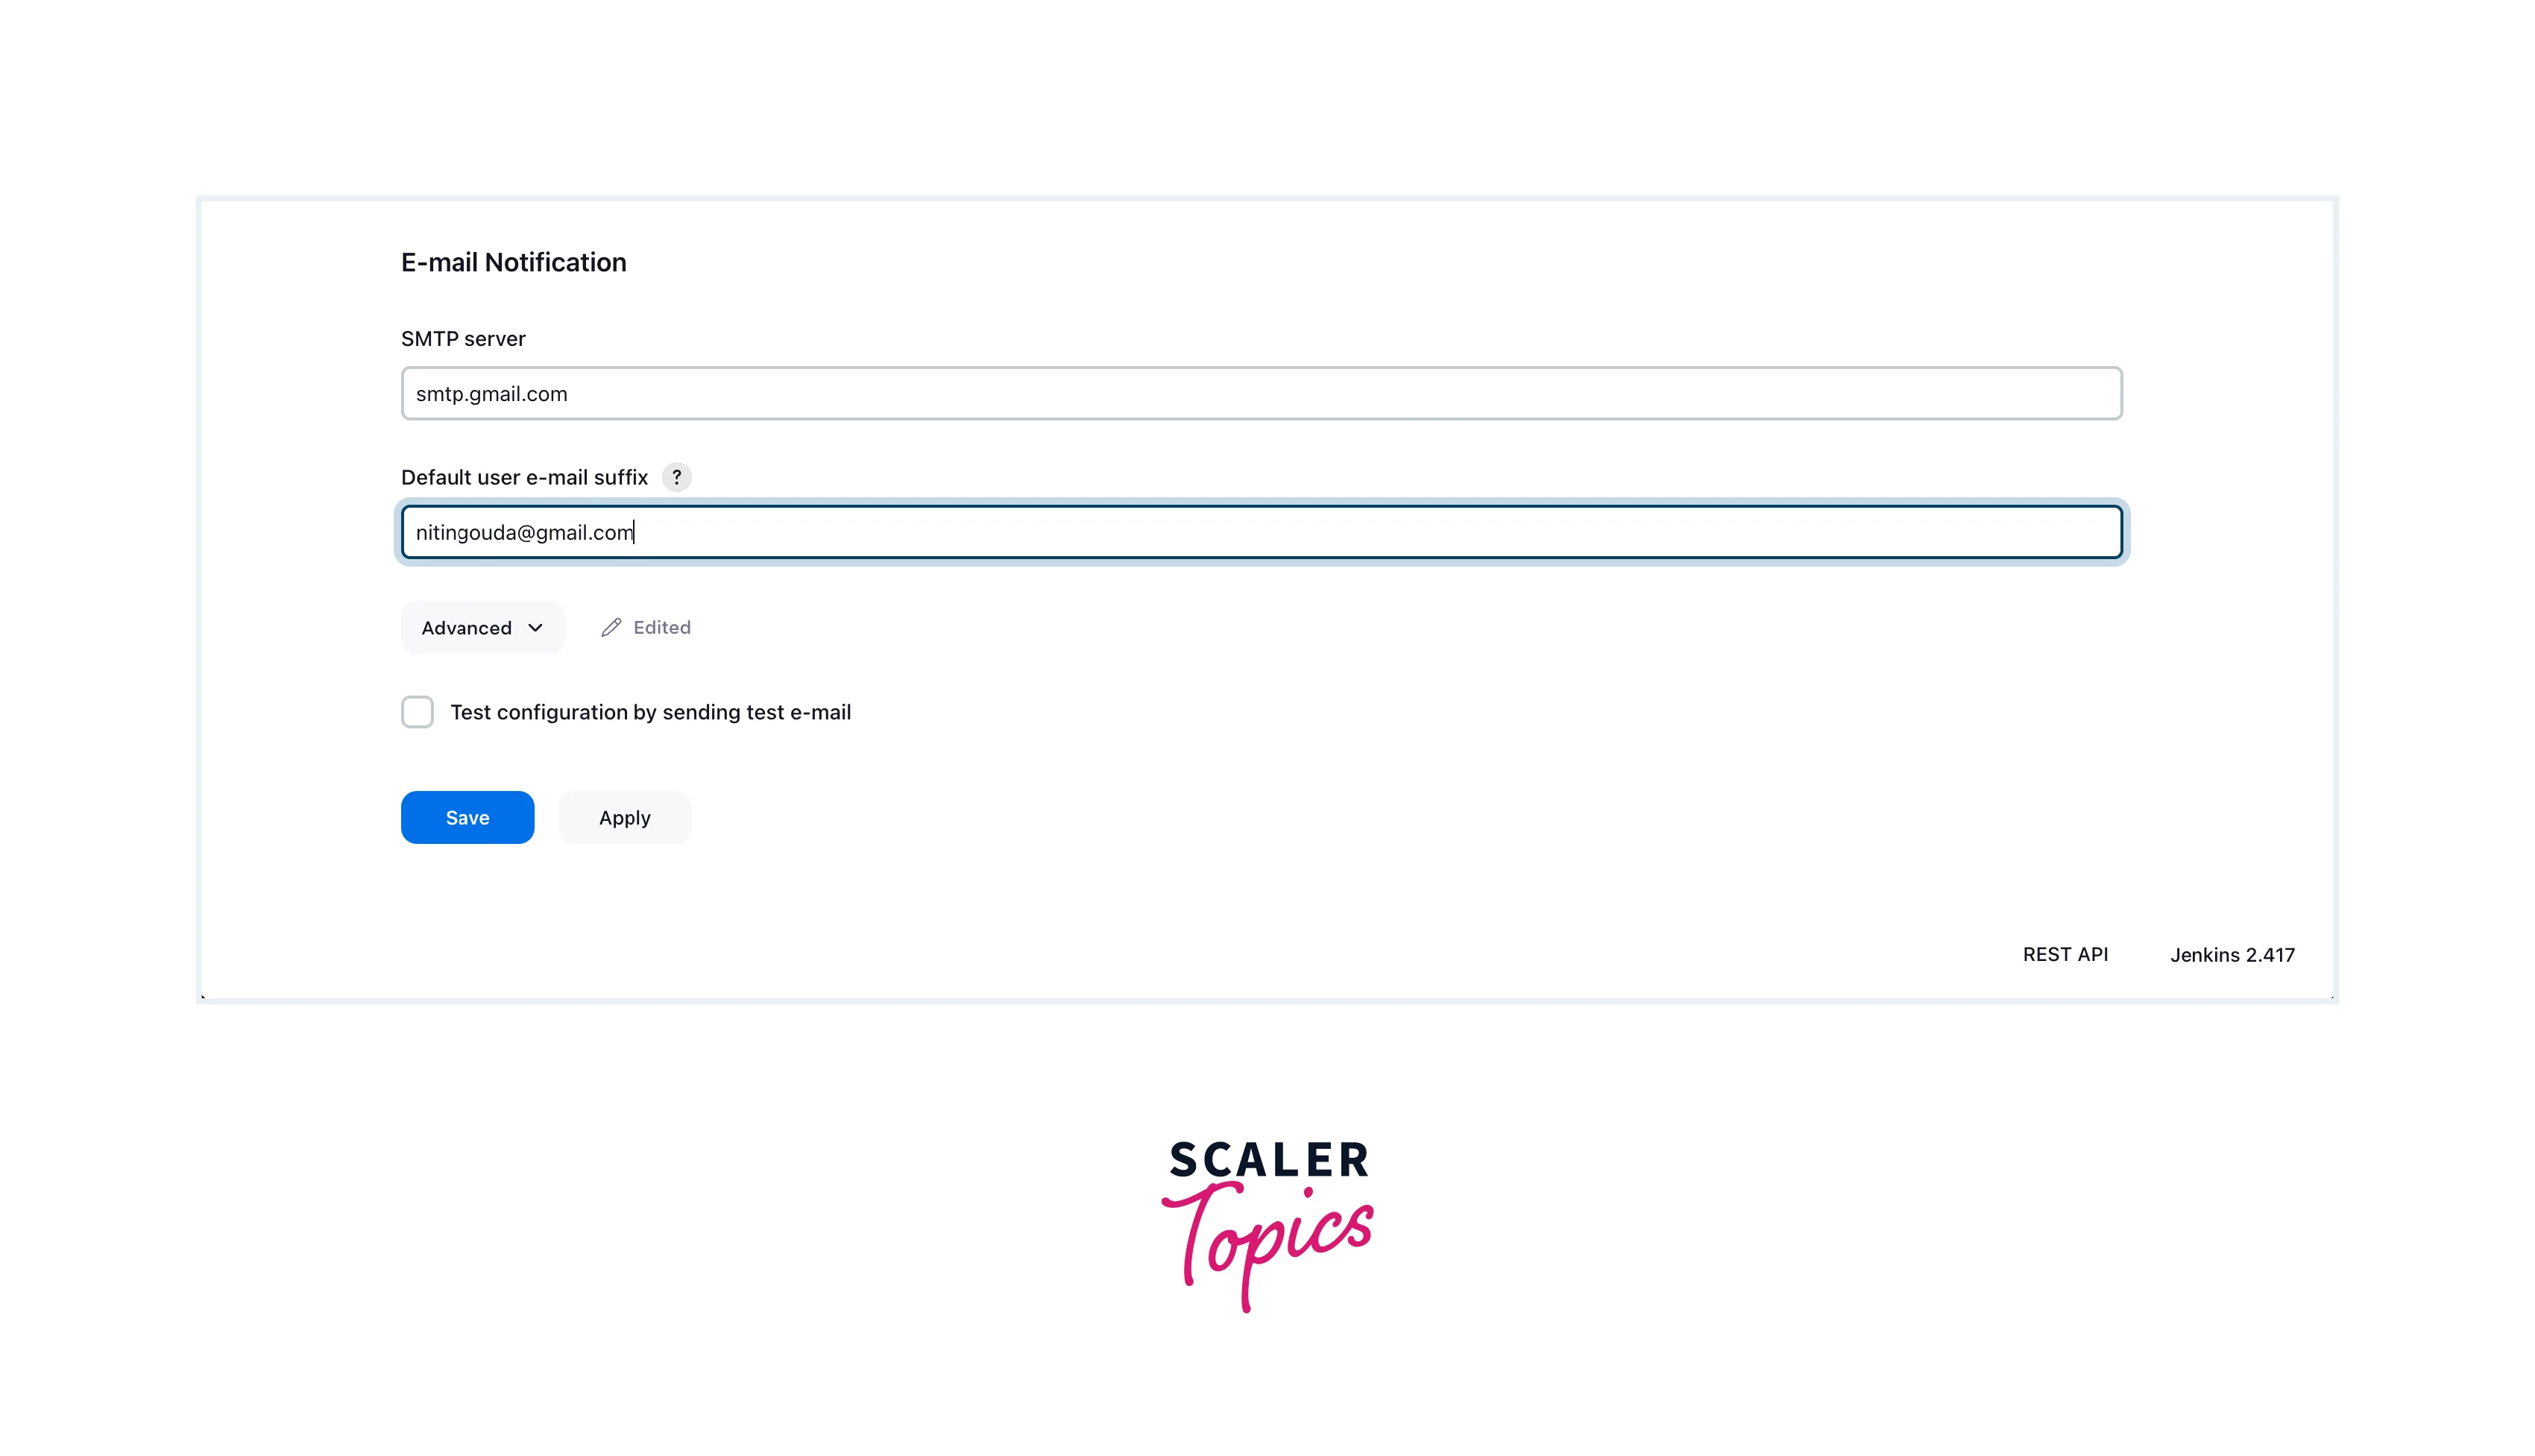
- Email Notifications: Configure Jenkins to send email notifications for build results. Set up your email server settings and specify recipients for success, failure, or other conditions.
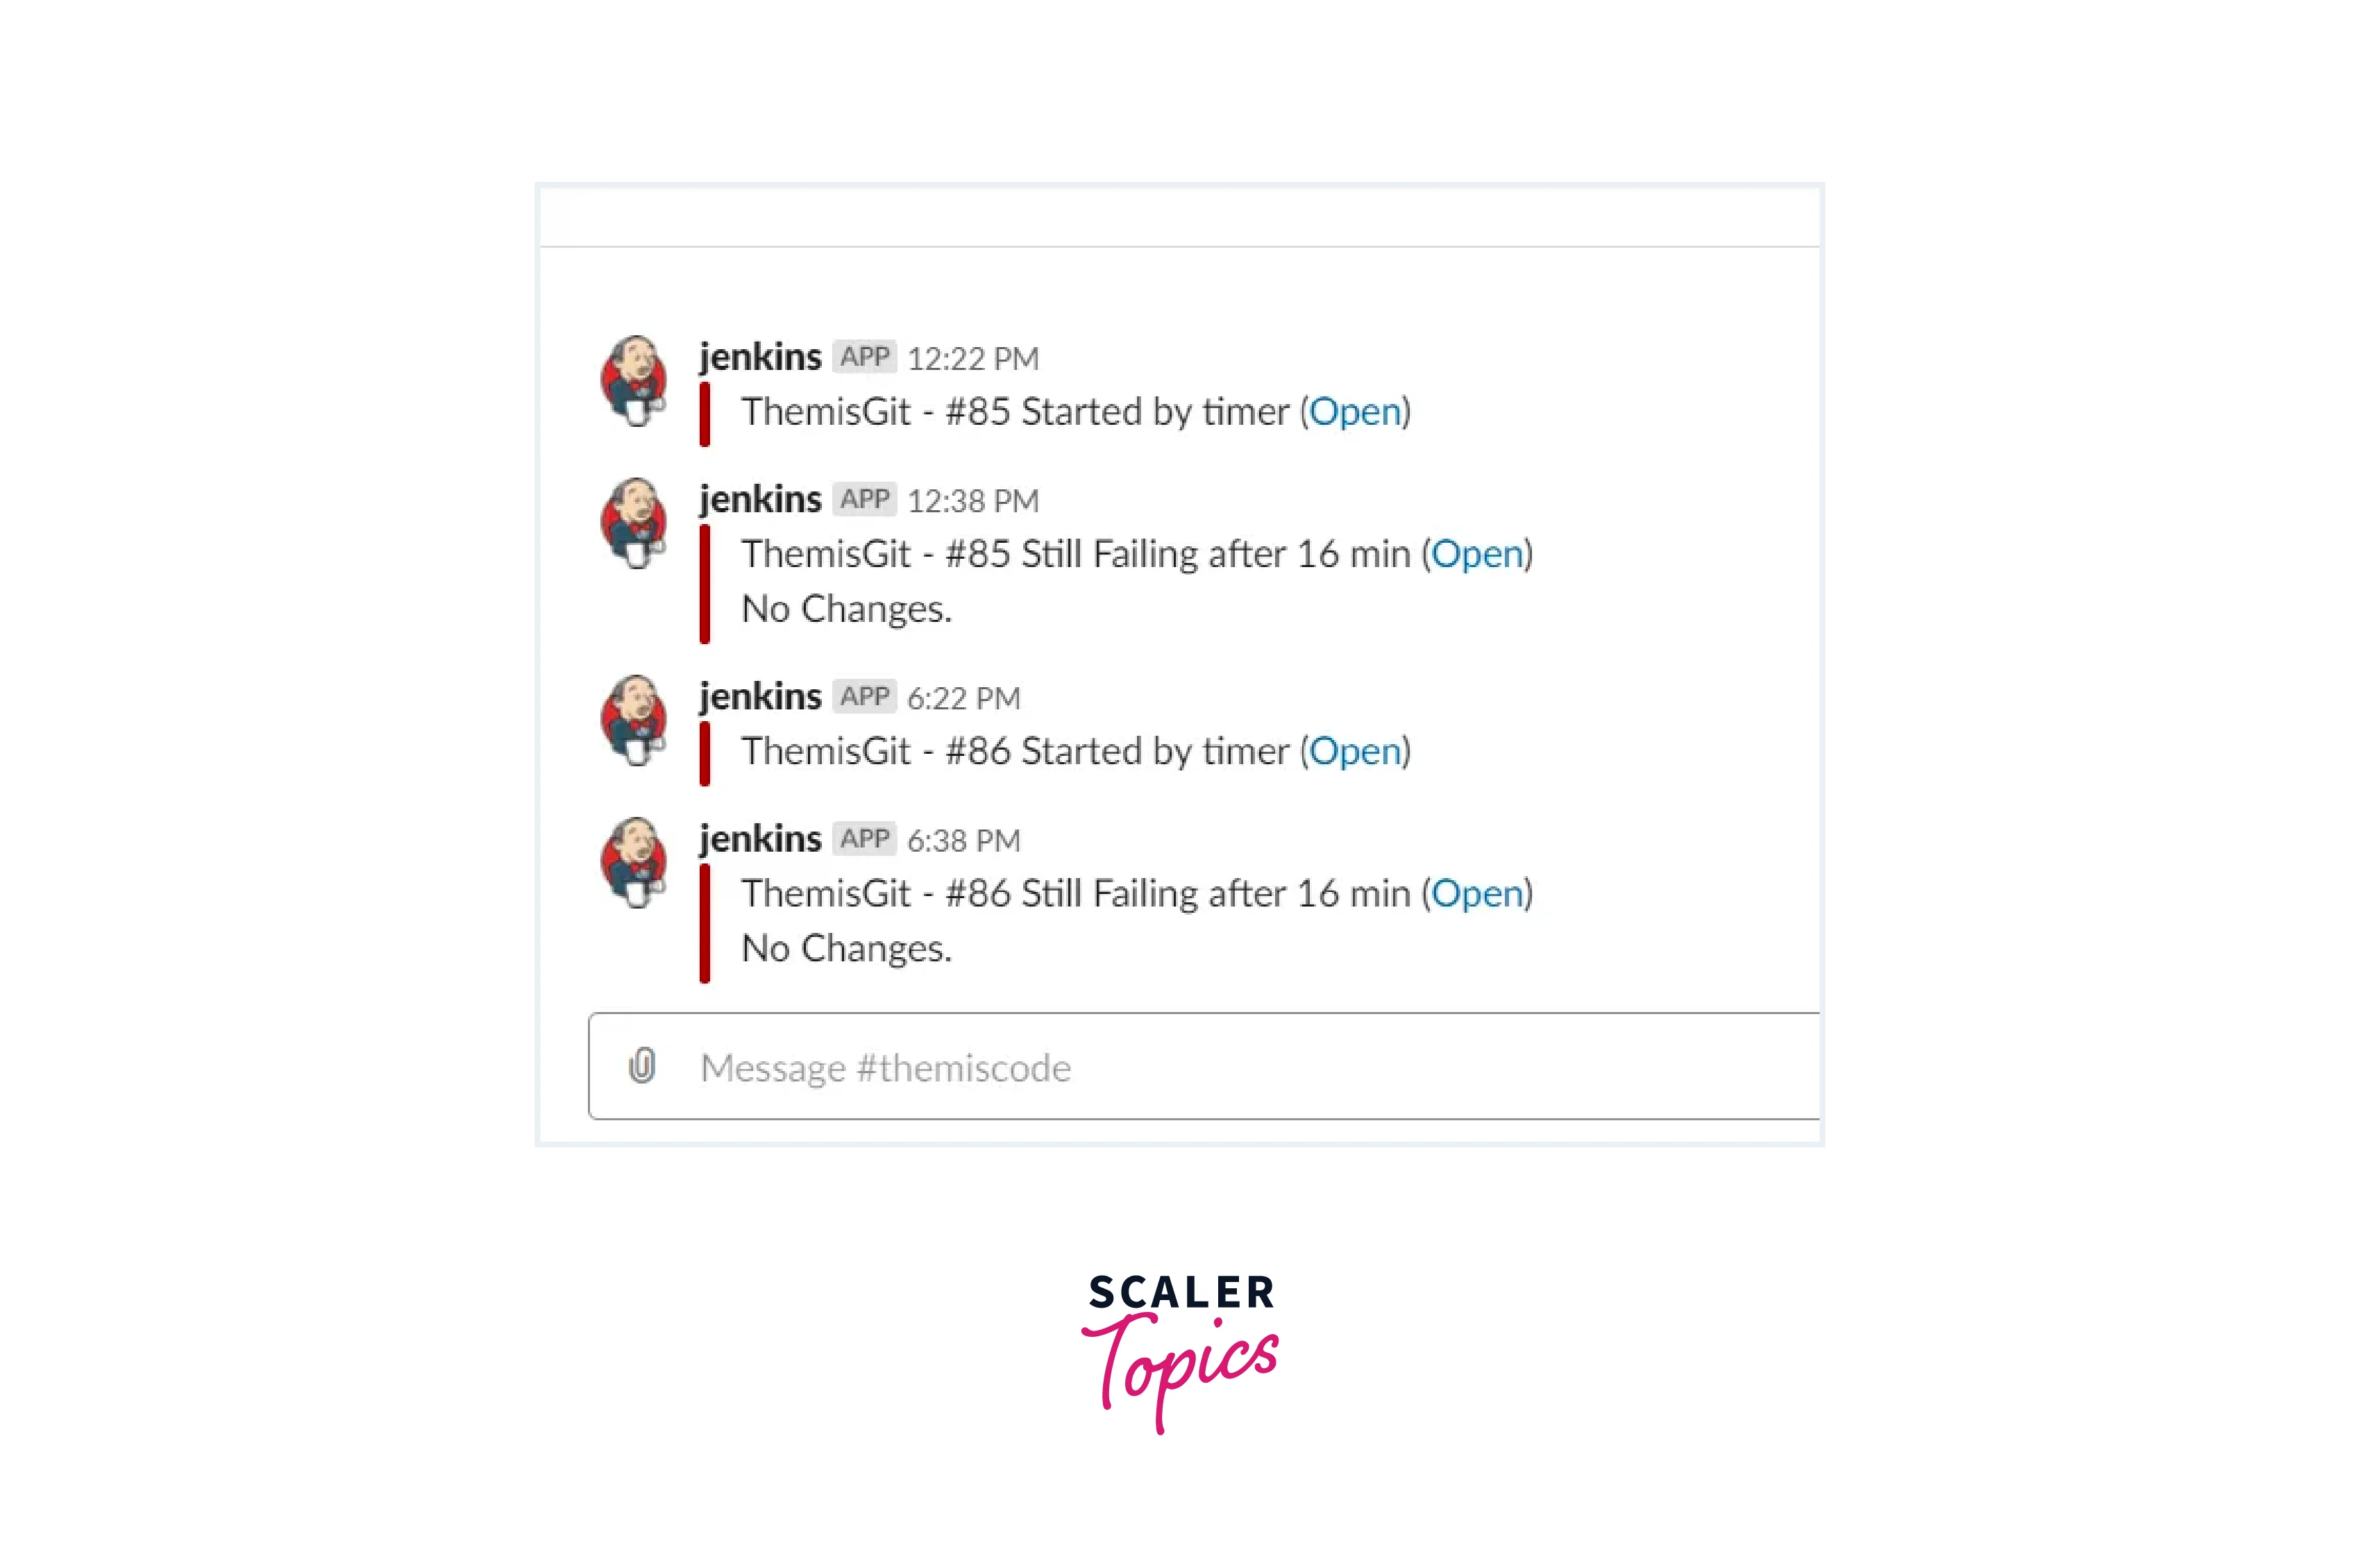
- Instant Messaging Integration: Integrate Jenkins with popular instant messaging platforms like Slack or Microsoft Teams. Install relevant plugins and configure them to receive build notifications directly in your messaging application.
- Webhooks: Set up webhooks for your version control system (e.g., GitHub, GitLab). Jenkins can receive notifications when code changes are pushed, triggering relevant pipelines.
To establish an effective real-time monitoring and notification strategy:
- Identify Key Events: Determine which build events are critical for you to receive notifications, such as build successes, failures, and unstable builds.
- Customize Notifications: Tailor your notifications to provide relevant information. Configure emails, messages, or alerts to include essential details for quick decision-making.
- Integrate with Your Workflow: Ensure that your real-time monitoring and notification strategy aligns with your development workflow. Notifications should reach the right people at the right time.
- Regularly Review Notifications: Make it a practice to regularly review notifications. Promptly address issues, analyze trends, and take corrective actions as needed.
Real-time monitoring and notifications empower you to take proactive actions, optimize your pipelines, and maintain a smooth CI/CD workflow. By staying informed and promptly addressing issues, you can minimize downtime, increase efficiency, and deliver high-quality software faster.
Dashboard Plugins and Customization
Jenkins' extensibility is one of its standout features, thanks to a vast library of plugins that enhance its functionality. When it comes to Dashboard customization, plugins play a pivotal role.
Let's explore some plugin categories that can elevate your Jenkins Dashboard Experience:
- Visualizations and Reporting:
- Build Monitor Plugin: This plugin adds a customizable dashboard view to display the status of your jobs using a grid or list layout.
- Test Result Trend: Visualize test trends overbuilds with detailed historical information on test pass rates.
- Data and Insights:
- Dashboard View: You can create customizable dashboards using this
- Plot Plugin: Plot data collected during builds, enabling you to visualize trends and correlations.
- Integration and Notifications:
- Blue Ocean: A modern interface for Jenkins that offers a visual pipeline editor, making it easier to create and manage pipelines.
- Slack Notification: Integrate Jenkins with Slack for real-time build notifications and status updates.
- User Experience and Themes:
- Simple Theme Plugin: Customize the look and feel of your Jenkins Dashboard with custom CSS styles.
Customizing your Jenkins Dashboard
Customizing your Jenkins Dashboard involves more than just adding plugins. It's about creating an environment that aligns with your team's needs and streamlines your workflow.
Here's how to make the most of your Dashboard customization:
- Evaluate Your Needs: Identify pain points and areas where customization could enhance your experience. Consider the information you frequently access and the actions you perform daily.
- Plugin Selection: Carefully choose plugins that align with your requirements. Avoid plugin overload by focusing on quality over quantity.
- Widget Placement: Arrange widgets and elements logically. Prioritise the information that needs immediate attention and group related widgets together.
- Personalization: Encourage team members to personalize their own Dashboards. Jenkins allows users to customize their views, providing autonomy while maintaining a consistent workflow.
Jenkins Dashboard customization is an ongoing journey. As your projects evolve, new requirements emerge, and technologies advance, your Dashboard should adapt accordingly. Regularly revisit your Dashboard's layout, widgets, and plugins to ensure they continue to serve your team effectively.
Jenkins Blue Ocean
Jenkins Blue Ocean reimagines the way you interact with Jenkins, making it easier and more intuitive to build, test, and deploy your applications. Blue Ocean provides a sleek, user-friendly interface that enhances the Jenkins experience and streamlines pipeline management.
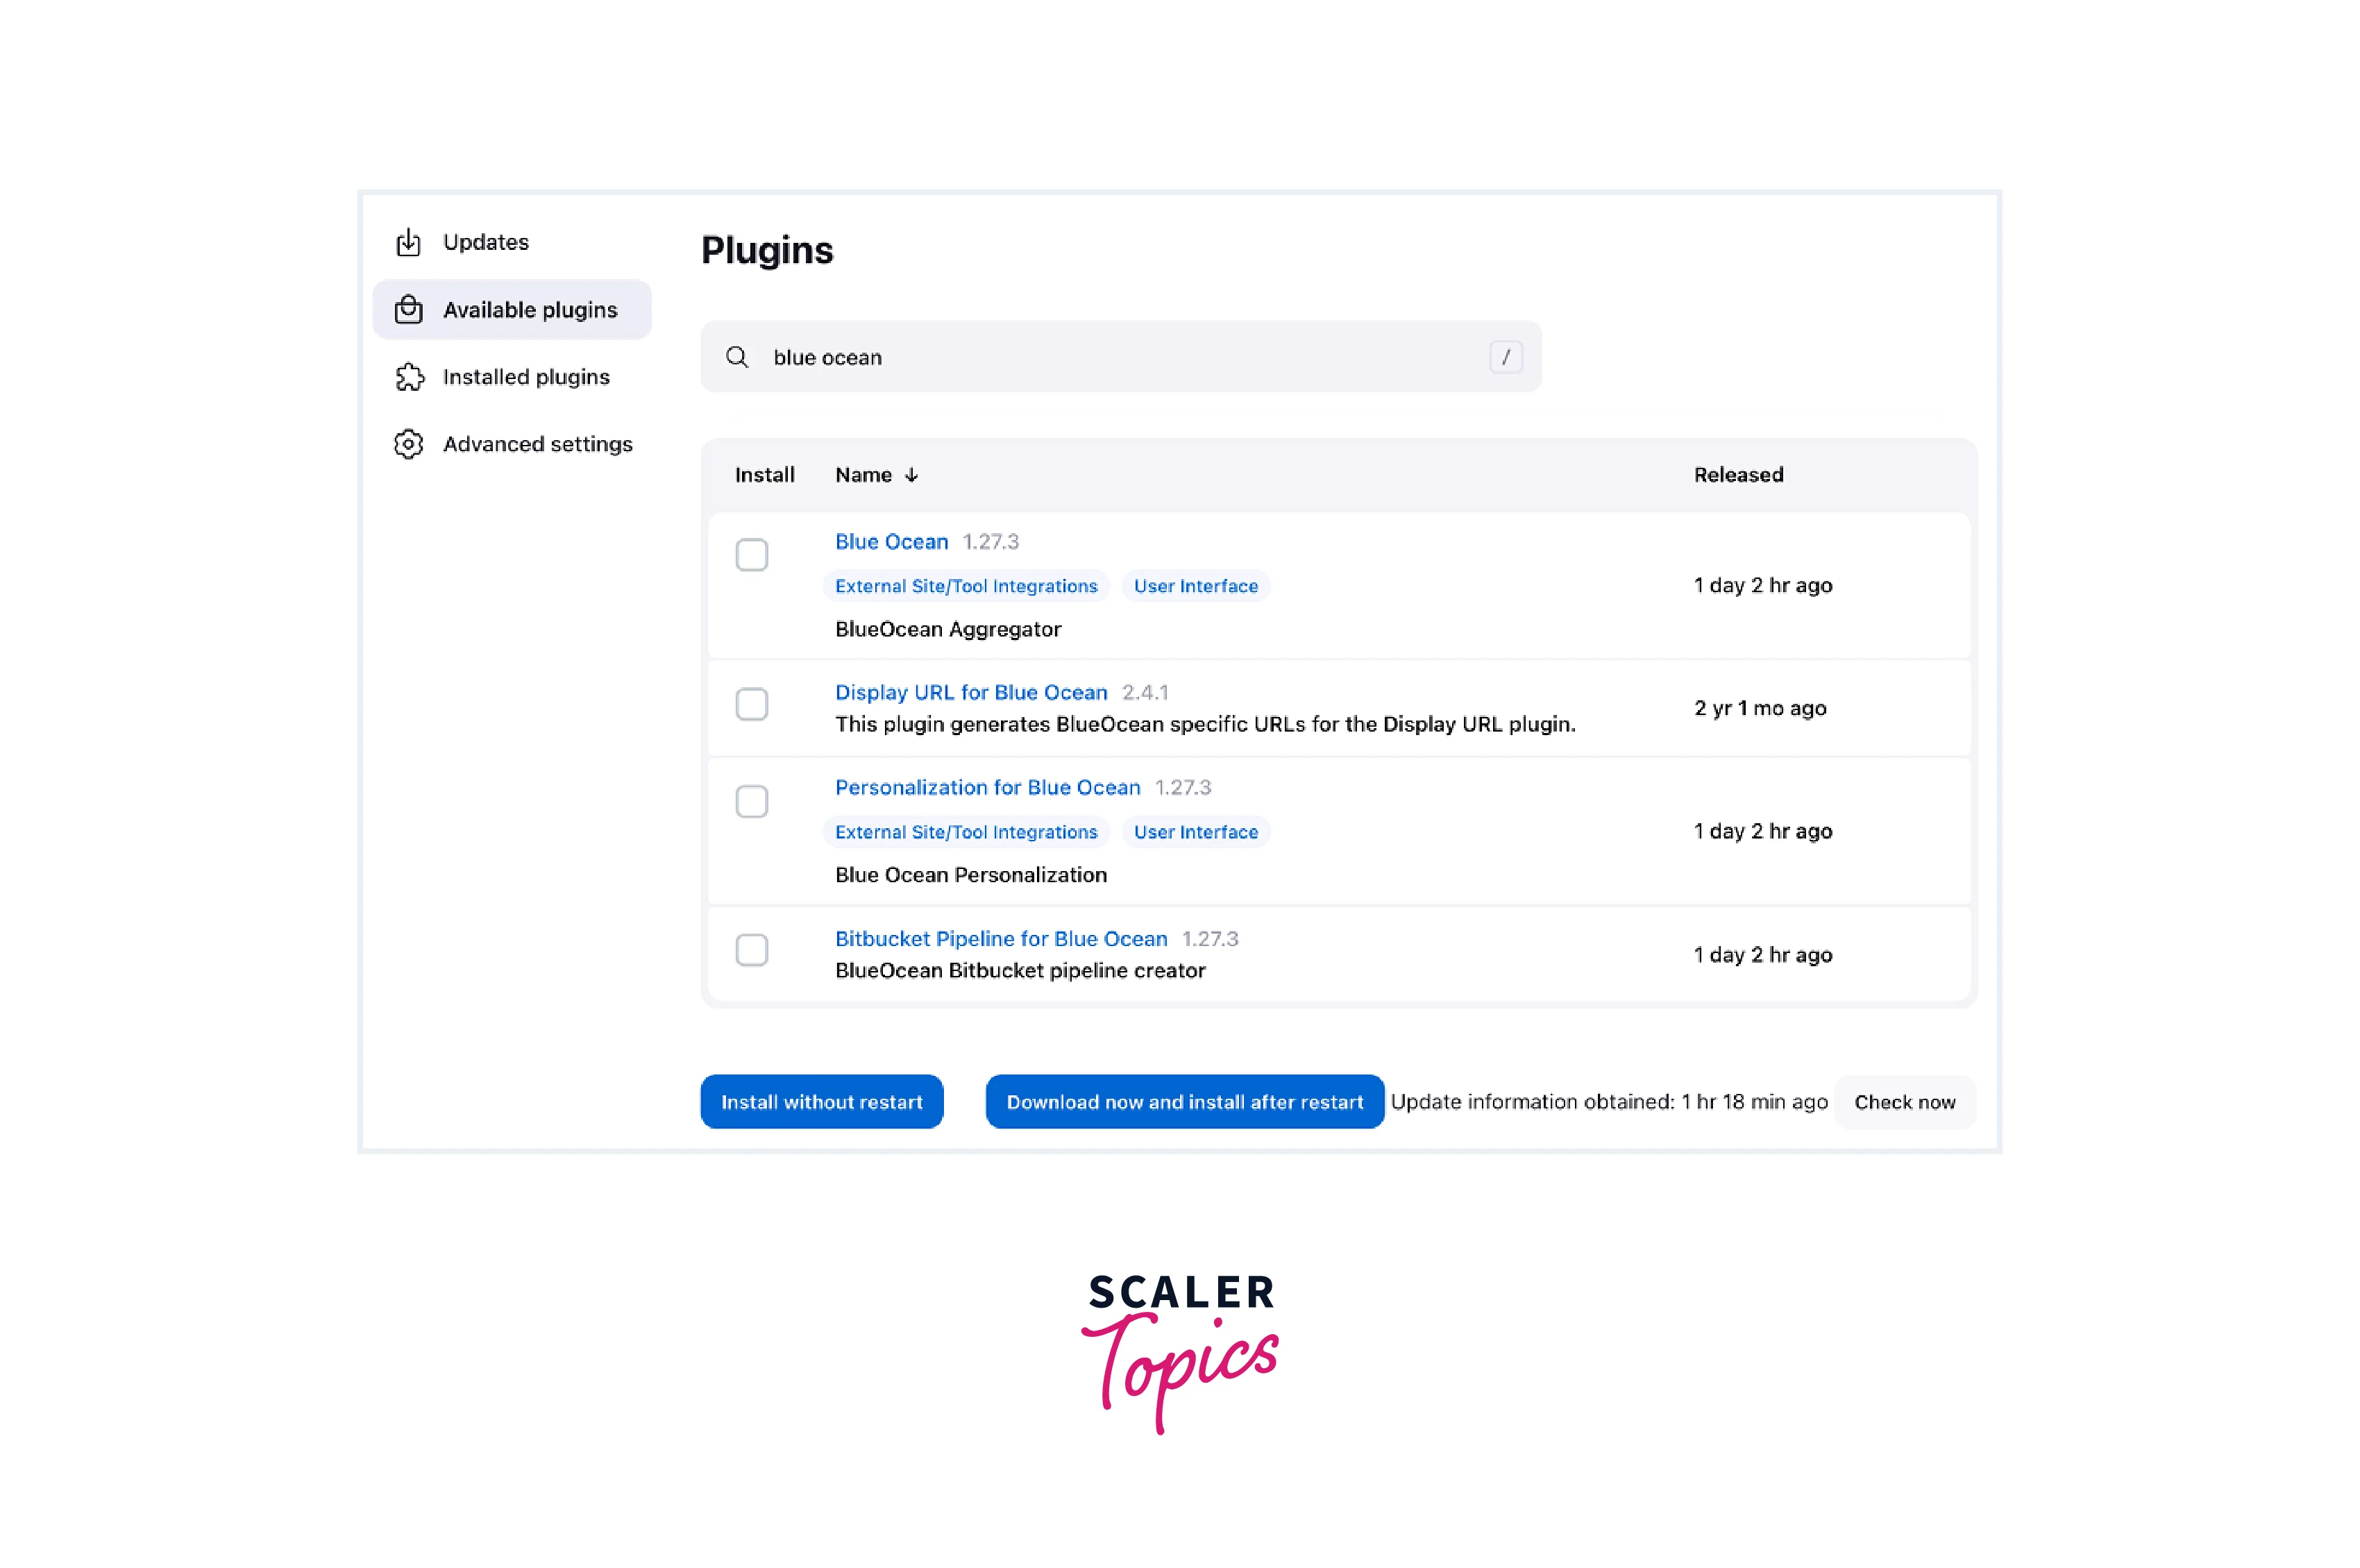
To install it go to Plugins search for Blue Ocean and click Download and Install after restart.
Once Installed you can access it from the Jenkins Homepage sidebar.
Jenkins Blue look like this:
Key Features and Benefits:
- Visual Pipeline Editor: Blue Ocean introduces a visual pipeline editor that enables you to design, visualize, and manage complex CI/CD pipelines effortlessly. You can create pipelines using a drag-and-drop interface, making it easier to define stages, steps, and dependencies.
- Pipeline Analytics: Blue Ocean offers analytics and insights into your pipelines. You can track build durations, success rates, and other metrics, helping you identify areas for optimization and improvement.
- Personalization and Favorites: With Blue Ocean, you can personalize your dashboard by marking your favourite pipelines. This feature makes it easy to focus on the projects that matter most to you.
- Integrated Log Viewer: Debugging becomes easier with the integrated log viewer. You can access the logs for each step directly from the pipeline visualisation, simplifying the troubleshooting process.
Embracing Modern CI/CD Workflows: Jenkins Blue Ocean brings a breath of fresh air to CI/CD pipelines by combining aesthetics, functionality, and user-centric design. Whether you're a seasoned Jenkins user or new to the platform, Blue Ocean simplifies pipeline creation, management, and monitoring.
Securing the Jenkins Dashboard
Securing the Jenkins Dashboard is not a one-time task; it's an ongoing commitment to maintaining the integrity of your CI/CD environment. Security is a shared responsibility, and everyone on your team plays a role in maintaining a secure Jenkins Dashboard. Various measures can be taken into account to secure the Jenkins Dashboard.
1. Authentication and Access Control
- Implement User Authentication: Require users to authenticate using strong credentials before accessing the Jenkins Dashboard. Utilize built-in Jenkins authentication mechanisms or integrate with external authentication providers.
- Role-Based Access Control (RBAC): Assign users specific roles and permissions based on their responsibilities. Limit access to sensitive features and configuration settings to authorized personnel.
2. Use HTTPS
- Secure Communication: Configure Jenkins to use HTTPS (SSL/TLS) to encrypt data transmitted between clients and the server. This prevents eavesdropping and data manipulation during transmission.
3. Regular Updates and Patch Management
- Keep Jenkins Up to Date: Regularly update Jenkins to the latest stable version. This ensures you benefit from security patches and fixes for known vulnerabilities.
4. Plugin Management
- Minimal Plugins: Install only the necessary plugins. Unused or outdated plugins can introduce security vulnerabilities.
- Regular Updates: Keep plugins up to date. Vulnerabilities in plugins can be exploited to compromise your Jenkins environment.
5. Job Configuration and Secrets
- Use Credentials Plugin: Store sensitive information such as passwords, API keys, and tokens using the Jenkins Credentials Plugin. Avoid hardcoding secrets in job configurations.
- Avoid Exposing Secrets: Be cautious while printing or logging secrets in console outputs. Always use mask passwords plugins or other secure methods.
6. Backup and Disaster Recovery
- Regular Backups: Perform regular backups of your Jenkins configuration, job definitions, and plugins. This ensures you can recover from potential security incidents.
Dashboard Administration and Troubleshooting
The command center for your continuous integration and continuous delivery (CI/CD) pipelines is the Jenkins Dashboard. You can manage, monitor, and make sure everything is running properly. However, when projects grow and pipelines get more complicated, proper management and efficient troubleshooting becomes essential.
1. User Management and Access Control
- Centralized Authentication: Set up user authentication using strong credentials. Centralized authentication mechanisms enhance security and simplify access control.
- Role-Based Access Control (RBAC): Implement RBAC to assign different roles and permissions to users based on their responsibilities. This ensures the right people have the right access.
2. Maintaining Plugins and Dependencies
- Regular Updates: Keep your plugins and Jenkins instance up to date. Plugin updates often include bug fixes, enhancements, and security patches.
- Unused Plugins: Regularly review and remove unused or deprecated plugins. This reduces clutter and potential security vulnerabilities.
3. Diagnostic Tools
- System Logs: Regularly review Jenkins logs for errors, warnings, and unusual activities. Logs provide valuable insights for troubleshooting.
- Thread Dump Analysis: In case of performance issues, capture and analyze thread dumps to identify any threads causing slowdowns.
4. Community Support and Documentation
- Online Communities: Engage with the Jenkins community through forums, mailing lists, and online discussions. Seek help and share insights from fellow users.
- Official Documentation: Rely on the official Jenkins documentation for guidance on administration, troubleshooting, and best practices.
5. Regular Maintenance
- Server Resource Management: Monitor server resource usage, such as CPU, memory, and disk space. Ensure your Jenkins server has adequate resources to handle build loads.
- Regular Health Checks: Conduct regular health checks of your Jenkins instance, identifying and addressing performance bottlenecks or configuration issues.
Integrating Jenkins with External Tools
Jenkins, as a powerful automation server, shines brightest when integrated with external tools. These integrations streamline processes, foster collaboration, and deliver faster higher-quality software.
1. Version Control Integration: Integrate Jenkins with your Git repository to trigger builds automatically upon code changes. Utilize webhooks or polling mechanisms to achieve real-time synchronization. Code Review Tools: Integrate Jenkins with code review tools like Gerrit or Bitbucket to ensure that only high-quality code reaches the pipeline.
2. Testing and Quality Assurance: Integrate testing frameworks (e.g., JUnit, NUnit) to execute automated tests as part of your Jenkins pipeline. This ensures consistent quality checks with every build. Code Analysis Tools utilize static code analysis tools (e.g., SonarQube) to identify code smells, vulnerabilities, and maintainability issues.
3. Continuous Monitoring: Integrate Jenkins with monitoring tools (e.g., Prometheus, Grafana) to capture and visualize key metrics from your applications. Configure alerting mechanisms that trigger based on predefined thresholds, ensuring proactive responses to issues.
Best Practices for Integration:.
- Plan Ahead: Define your integration goals and objectives. Understand how the integration will enhance your pipeline.
- Choose Wisely: Select tools that align with your project's needs and have a strong reputation for reliability and support.
- API Documentation: Thoroughly review the documentation of both Jenkins and the external tool to understand how they can communicate.
- Testing: Test the integration in a controlled environment before deploying it in your production pipeline.
Conclusion
- We learned how to access the Jenkins Dashboard through web browsers and familiarized ourselves with the default dashboard view upon login.
- The Jenkins Dashboard Overview section highlighted the essential components of the Jenkins Dashboard, including header navigation, main overview area, build history, pipeline visualizations, and customisation options.
- We explored the process of creating and configuring build jobs, emphasizing the importance of choosing the right build job type and configuring essential settings.
- We learnt more about Pipelines, from their types (Declarative and Scripted) to their creation, stages, steps, parallel execution, and best practices.
- The significance of real-time monitoring and notification strategies was explained, and various methods to set up notifications were covered, including email, instant messaging, and webhooks.
- We delved into the world of plugins that enhance the Jenkins Dashboard's functionality, providing insights into different plugin categories and personalization options.