Effective Kafka Monitoring with JMX and Monitoring APIs
Overview
Monitoring Kafka with JMX (Java Management Extensions) provides administrators and developers with a comprehensive overview of the Kafka cluster's health, performance, and operational metrics. JMX is a Java technology that allows monitoring and managing applications remotely by exposing various management attributes and operations. Kafka leverages JMX to expose a rich set of metrics, configuration parameters, and control operations, making it an essential tool for monitoring and managing Kafka deployments. By enabling JMX monitoring in Kafka, administrators can gain valuable insights into the cluster's vital statistics, such as message throughput, partition lag, consumer lag, broker-level metrics, and more. These metrics help detect bottlenecks, identify performance issues, and optimize resource allocation within the Kafka ecosystem.
Introduction
Brief overview of Apache Kafka
Apache Kafka, developed by the Apache Software Foundation, is a distributed streaming platform that operates as open-source software. Its primary purpose is to effectively manage and process large amounts of data streams in real time. Due to its ability to scale seamlessly and maintain resilience in the face of failures, Kafka has gained significant popularity as a preferred solution for constructing fault-tolerant data pipelines and event-driven applications.
At its core, Kafka consists of three main components: producers, topics, and consumers. Producers are responsible for publishing records to Kafka topics, which are log-like data structures that store the stream of records in a fault-tolerant manner. Consumers subscribe to topics and consume records in the order they are published.
Importance of Monitoring in Apache Kafka
Monitoring is of utmost importance in Apache Kafka for several reasons:
- Performance Optimization:
Monitoring Kafka allows administrators to gain insights into the performance of the cluster, including metrics such as throughput, latency, and resource utilization. By monitoring these metrics, administrators can identify bottlenecks, optimize configurations, and fine-tune the cluster to achieve optimal performance. - Issue Detection and Troubleshooting:
Monitoring helps in early detection and identification of issues or anomalies within the Kafka cluster. It enables administrators to track important metrics, such as disk usage, network errors, or replication lag, which can indicate potential problems. By proactively monitoring and alerting on such issues, administrators can troubleshoot and resolve them before they escalate into major disruptions. - Fault Tolerance and High Availability:
Kafka monitoring plays a crucial role in ensuring the fault tolerance and high availability of the system. By monitoring replication metrics and the health of individual brokers, administrators can identify any synchronization issues, replication delays, or broker failures. This allows for prompt action to ensure data replication integrity and maintain high availability of the Kafka cluster.
Understanding Kafka and the Need for Monitoring
What is Apache Kafka?
Apache Kafka is an open-source distributed streaming platform that provides a scalable, fault-tolerant, and high-throughput system for handling real-time data feeds. It was originally developed at LinkedIn and later became an Apache Software Foundation project.
At its core, Kafka is designed to handle the publish-subscribe model, where producers publish messages to specific topics, and consumers subscribe to those topics to receive the messages. It acts as a highly durable and fault-tolerant storage system, storing and replicating the published messages across a cluster of servers called brokers.
Why Is Monitoring Critical in Kafka Operations?
Monitoring is critical in Kafka operations for several reasons:
- Proactive Issue Detection:
Monitoring allows for the early detection of issues or anomalies within the Kafka cluster. By continuously monitoring key metrics such as throughput, latency, disk utilization, and replication lag, administrators can identify any deviations from normal behavior. Proactive issue detection helps in addressing problems before they escalate and impact the overall performance and reliability of the system. - Performance Optimization:
Monitoring provides insights into the performance of the Kafka cluster, enabling administrators to optimize its configuration and resource allocation. By monitoring metrics like message throughput, consumer lag, and broker resource utilization, administrators can identify bottlenecks, tune parameters, and make informed decisions to enhance the overall performance of the system. - Fault Tolerance and High Availability:
Kafka is designed to be a highly fault-tolerant and resilient system. Monitoring plays a critical role in ensuring the fault tolerance and high availability of the cluster. By monitoring replication metrics, broker health, and cluster connectivity, administrators can detect and address issues related to data replication, broker failures, or network disruptions. Timely intervention based on monitoring data helps maintain data integrity and availability. - Capacity Planning and Scaling:
Monitoring provides valuable insights into resource usage patterns and helps in capacity planning and scaling the Kafka cluster. By monitoring metrics related to CPU, memory, disk space, and network utilization, administrators can analyze historical trends, forecast future requirements, and scale the cluster accordingly. Monitoring assists in optimizing resource allocation, preventing performance degradation due to resource constraints, and accommodating growing data volumes. - Security and Compliance:
Monitoring Kafka is crucial for maintaining security and compliance. By monitoring access logs, authentication, and authorization metrics, administrators can identify any unauthorized access attempts or security breaches. Monitoring also helps in tracking compliance-related metrics, such as data retention policies and encryption requirements, ensuring adherence to regulatory standards and data protection guidelines. - Operational Efficiency:
Monitoring contributes to operational efficiency by providing real-time visibility into the health and performance of the Kafka cluster. Administrators can set up alerts and notifications based on predefined thresholds or anomalies, enabling them to proactively respond to issues and minimize downtime. Monitoring data facilitates rapid troubleshooting, root cause analysis, and efficient allocation of resources, thereby streamlining Kafka operations.
Key Components and Metrics to Monitor in Kafka
Monitoring Apache Kafka involves tracking several key components and metrics to ensure the health, performance, and stability of the Kafka cluster. Some essential components and metrics to monitor in Kafka include:
- Brokers:
Brokers are the Kafka server instances responsible for handling message storage, replication, and serving consumer requests. Monitor metrics such as CPU usage, memory utilization, disk I/O, network throughput, and partition leadership changes on each broker. - Topics:
Topics represent streams of records in Kafka. Monitor metrics related to topics, such as message throughput (incoming and outgoing), partition distribution, replication factor, and log compaction status. - Partitions:
Partitions are the units of parallelism within a topic. Monitor metrics such as partition lag (the time lag between producing and consuming messages), partition size, and partition reassignment progress. - Producers:
Producers are responsible for publishing records to Kafka topics. Monitor metrics such as message send rate, message size, request latency, and producer errors (e.g., failed sends or retries). - Consumers:
Consumers read and process records from Kafka topics. Monitor consumer group lag (the lag between the latest offset and the consumer's offset) to ensure timely data consumption. Monitor consumer offsets, rebalancing activity, and consumer group lag across different consumer groups. - Network:
Kafka relies on efficient network communication between brokers and clients. Monitor network throughput, latency, and error rates to identify potential bottlenecks or connectivity issues. - Storage:
Kafka stores data on disk. Monitor disk usage, disk I/O rates, and log segment retention to ensure sufficient storage capacity and efficient data retrieval. - ZooKeeper:
Kafka relies on ZooKeeper for cluster coordination and metadata management. Monitor ZooKeeper ensemble health, connection latency, znode counts, and watch counts to ensure proper Kafka cluster coordination. - JVM:
Kafka runs on the Java Virtual Machine (JVM). Monitor JVM-related metrics such as heap memory usage, garbage collection times, and JVM process CPU usage to optimize JVM performance and identify memory-related issues. - Replication:
Kafka provides data replication for fault tolerance. Monitor replication lag, in-sync replicas (ISR) count, leader changes, and replication throttling to ensure replication integrity and performance.
Overview of Kafka Monitoring Tools
Introduction to JMX (Java Management Extensions)
JMX (Java Management Extensions) is a Java technology that provides a standard way to monitor, manage, and instrument Java applications, devices, and services. It offers a platform-agnostic, extensible, and dynamic management framework for Java-based systems. JMX allows developers and administrators to expose and access various management attributes, perform operations, and receive notifications from Java applications.
The primary goal of JMX is to facilitate the monitoring and management of Java applications in a distributed and heterogeneous environment. It provides a set of APIs, protocols, and tools to enable the management of resources, such as memory, threads, performance, and configuration parameters, in a consistent and standardized manner.
JMX operates based on a model where managed resources are represented as Managed Beans (MBeans). An MBean is a Java object that exposes a set of attributes, operations, and notifications that can be accessed and manipulated using the JMX APIs. MBeans can be created by developers to expose management interfaces for their applications or can be provided by the Java platform or third-party libraries.
JMX offers several key features that make it a powerful management technology:
- Instrumentation:
JMX provides a mechanism to instrument Java applications by exposing metrics, statistics, and other management data. This allows administrators to monitor the health, performance, and behavior of applications in real-time. - Remote Management:
JMX supports remote management, allowing administrators to monitor and manage Java applications running on remote machines. It uses various protocols, such as RMI (Remote Method Invocation) and JMXMP (JMX Messaging Protocol), to enable communication between the management console and the managed resources. - Dynamic Adaptability:
JMX allows for dynamic adaptation of managed resources. It provides the ability to change configuration parameters, modify runtime behavior, and perform operations on managed resources without requiring application restarts or downtime. - Standardization:
JMX defines a standard set of APIs, protocols, and data formats for managing Java applications. This standardization enables interoperability and integration between different management tools, frameworks, and applications.
JMX has widespread usage in various domains, including application servers, middleware, enterprise systems, and monitoring tools. It is widely supported by Java-based frameworks and technologies, making it an integral part of the Java ecosystem.
Introduction to Kafka's Built-in Monitoring APIs
Kafka provides built-in Monitoring APIs that allow administrators and developers to retrieve essential metrics and information about the Kafka cluster's health, performance, and operational aspects. These APIs offer a programmatic way to access real-time data about Kafka's internal state, topics, partitions, brokers, and consumer groups, enabling effective monitoring and management of Kafka deployments.
Some of the key monitoring APIs provided by Kafka include:
- AdminClient API:
The AdminClient API allows administrators to retrieve metadata about topics, partitions, brokers, and consumer groups. It provides methods to query and fetch information such as topic configurations, partition assignments, consumer group offsets, and more. This API is particularly useful for gathering metadata for monitoring purposes and performing administrative tasks programmatically. - Consumer API:
The Consumer API includes several methods that enable monitoring and management of consumer groups. It provides access to consumer group metadata, such as active members, assigned partitions, lag, and offsets. This API allows developers to programmatically track consumer group progress, identify lagging consumers, and monitor the overall health of consumer consumption. - Producer API:
The Producer API offers mechanisms to monitor the status of produced messages. It provides acknowledgment callbacks, error handling, and metrics for tracking the success or failure of message sends. With this API, developers can capture metrics such as message send rates, request latency, and error rates to monitor the behaviour and performance of Kafka producers. - Kafka Connect API:
Kafka Connect is a framework for building and running connectors that facilitate the integration of Kafka with external systems. The Connect API provides metrics related to the connectors' status, performance, and throughput. It allows administrators to monitor the execution of connectors, track errors, and assess the overall health and efficiency of data pipelines.
In addition to these specific APIs, Kafka also exposes several built-in metrics via the JMX (Java Management Extensions) interface, as mentioned earlier. These metrics cover various aspects of Kafka's internal workings, including broker-level metrics, topic-level metrics, consumer group metrics, and more. Administrators can leverage JMX and compatible monitoring tools to collect and analyze these metrics for real-time monitoring, alerting, and performance optimization.
Kafka JMX Monitoring
JMX (Java Management Extensions) monitoring in Kafka allows administrators to collect and analyze metrics related to brokers, topics, and consumers. These metrics provide valuable insights into the health, performance, and operational aspects of the Kafka cluster. Here's an overview of JMX monitoring in Kafka:
Understanding JMX
JMX is a Java technology that provides a standard way to monitor and manage Java applications. It exposes various management attributes, operations, and notifications, allowing administrators to monitor and control the application's behavior. Kafka leverages JMX to expose a rich set of metrics and configuration parameters, making it an essential tool for monitoring Kafka deployments.
How to enable JMX in Kafka:
To enable JMX monitoring in Kafka, you need to modify the Kafka broker's configuration. The following steps outline the process:
- Open the Kafka broker's configuration file (e.g., server.properties).
- Locate the KAFKA_OPTS or KAFKA_JMX_OPTS parameter.
- Set the JMX options, specifying the JMX port, hostname, and other relevant settings. For example:
Adjust the port and hostname values as per your requirements.
- Save the configuration file and restart the Kafka broker.
JMX Metrics for Brokers, Topics, and Consumers:
Once JMX is enabled, you can use tools like JConsole or command-line utilities to connect to the Kafka broker's JMX interface and collect metrics. Here are some commonly monitored JMX metrics for brokers, topics, and consumers:
-
Broker Metrics:
- MessagesInPerSec:
This metric indicates the rate at which messages are received by the broker. - BytesInPerSec:
Represents the rate at which bytes are received by the broker. - MessagesOutPerSec:
Denotes the rate at which messages are sent by the broker to consumers or other brokers. - BytesOutPerSec:
Indicates the rate at which bytes are sent by the broker to consumers or other brokers. - TotalProduceRequestsPerSec:
Shows the rate of produce requests made to the broker by producers. - TotalFetchRequestsPerSec:
Represents the rate of fetch requests made to the broker by consumers.
- MessagesInPerSec:
-
Topic Metrics:
- MessagesInPerSec:
Similar to the broker metric, this measures the rate at which messages are produced to the topic. - BytesInPerSec:
Indicates the rate at which bytes are produced to the topic. - BytesOutPerSec:
Represents the rate at which bytes are consumed from the topic. - TotalProduceRequestsPerSec:
Shows the rate of produce requests made to the topic. - TotalFetchRequestsPerSec:
Represents the rate of fetch requests made to the topic.
- MessagesInPerSec:
-
Consumer Metrics:
- FetchConsumerTotalTimeAvg:
Measures the average time taken by the consumer to fetch messages from a Kafka broker. - FetchConsumerTotalTimeMax:
Represents the maximum time taken by the consumer to fetch messages. - RecordsConsumedRate:
Indicates the rate at which records are consumed by the consumer. - RecordsLagMax:
Represents the maximum lag in the number of records between the producer and the consumer. Higher lag values indicate slower consumer processing or potential backlogs. - FetchManagerMetrics:
Provides various metrics related to the fetch requests made by consumers, such as fetch latency, fetch request rate, and fetch response rate. - GroupCoordinatorMetrics:
Includes metrics related to consumer group coordination, such as the time taken for consumer rebalancing and the rate of successful and failed consumer joins/leaves.
- FetchConsumerTotalTimeAvg:
Using JConsole for JMX Monitoring
Console is a Java Monitoring and Management Console provided with the JDK. It allows you to connect to a Java application's JMX interface and monitor its metrics. Here's how you can use JConsole for Kafka JMX monitoring:
- Launch JConsole by running the jconsole command.
- Select the Kafka broker process from the list of Java processes.
- Choose the JMX connection type (e.g., Remote Process).
- Enter the JMX connection details, such as hostname and port.
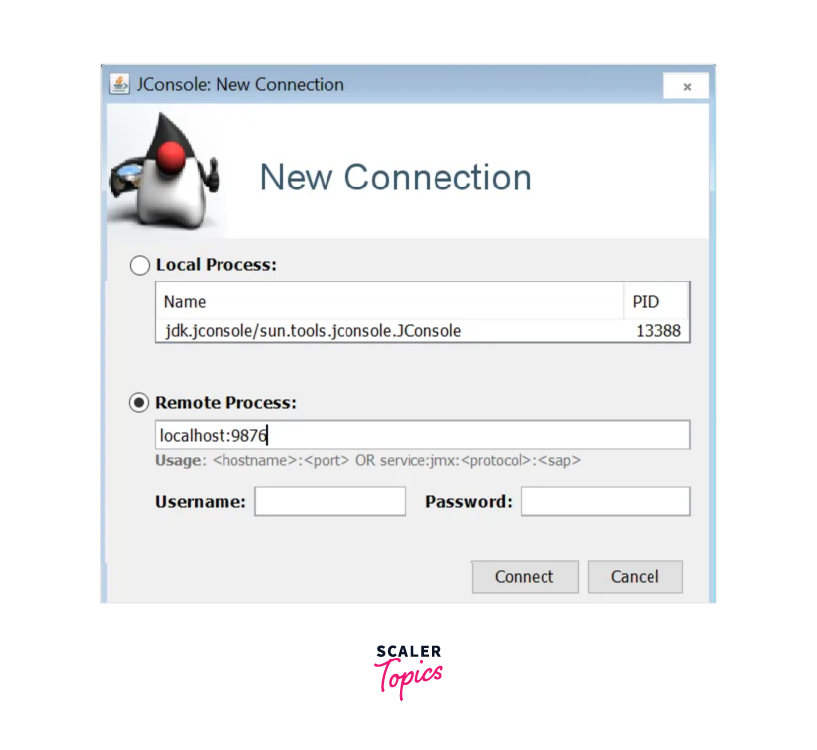
- Click Connect to establish the JMX connection.
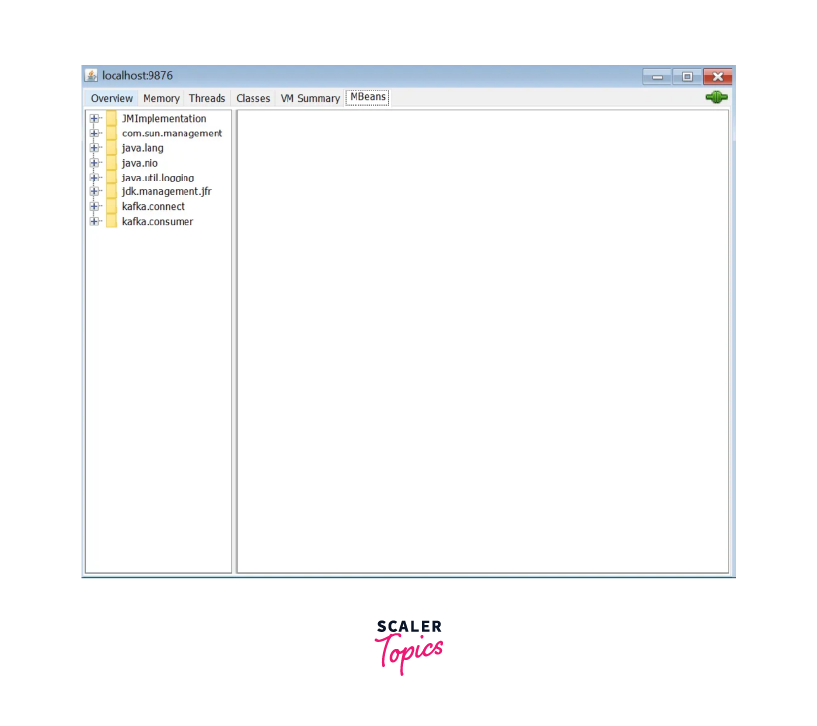
- Once connected, you can explore the available JMX MBeans and view their attributes and metrics.
- Navigate through the MBean tree to find Kafka-related metrics for brokers, topics, and consumers.
- Monitor the desired metrics, set up notifications, and analyze the performance of your Kafka cluster.
- After successfully connecting to the Java application, JConsole will display several tabs with different types of monitoring data. Some common tabs include:
- Overview:
Provides a general overview of the Java application's performance, including heap memory usage, thread count, and CPU usage.
- Memory:
Shows detailed memory usage statistics, including heap and non-heap memory.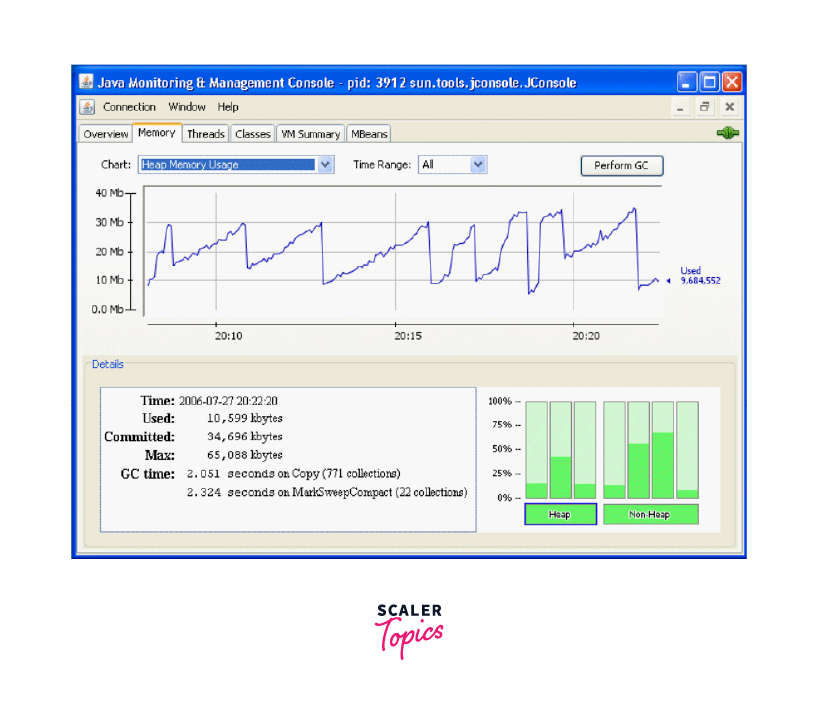
- Threads:
Displays information about active threads and thread states.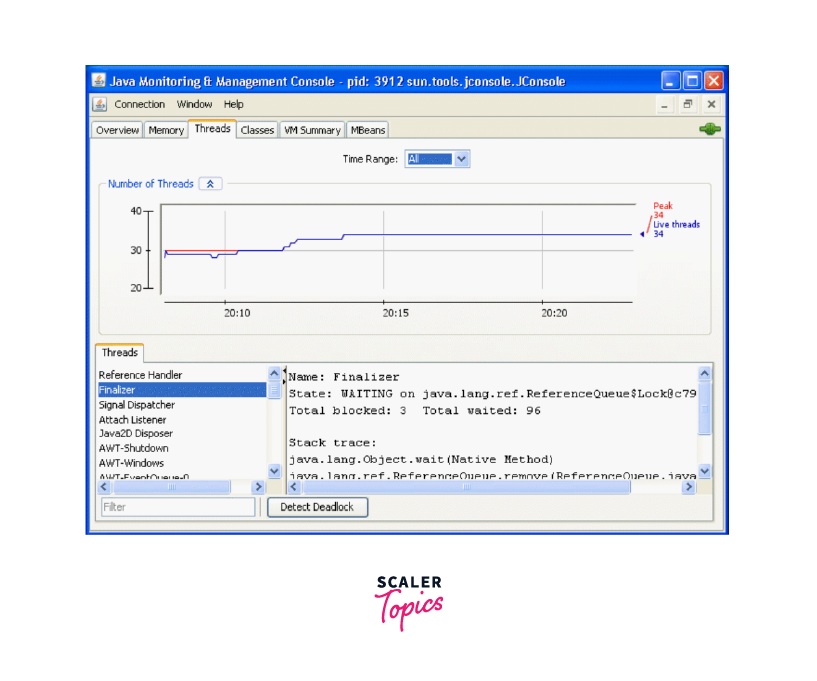
- Overview:
Kafka Monitoring APIs
Kafka provides several monitoring APIs that allow administrators and developers to programmatically retrieve and analyze metrics and information about the Kafka cluster. These APIs enable efficient monitoring, management, and troubleshooting of Kafka deployments. Here are some key Kafka monitoring APIs:
- AdminClient API:
The AdminClient API provides methods to interact with Kafka metadata and administrative operations. Administrators can use this API to retrieve information about topics, partitions, consumer groups, and brokers. It allows for the creation, deletion, and modification of topics, as well as the addition and removal of partitions. - Consumer API:
The Consumer API includes methods for consuming messages from Kafka topics. It allows developers to track consumer group offsets, manage consumer group membership, and handle message consumption. This API provides mechanisms for monitoring consumer lag, which represents the time lag between produced and consumed messages. - Producer API:
The Producer API offers methods for publishing messages to Kafka topics. It provides functionalities for message serialization, batching, acknowledgements, and error handling. Developers can use this API to monitor message send rates, track successful and failed sends, and handle producer-related metrics and errors. - Connect API:
Kafka Connect is a framework for building and running connectors that facilitate the integration of Kafka with external systems. The Connect API provides methods to manage and monitor connectors and tasks. Administrators can use this API to monitor connector status, retrieve connector configurations, and manage connector lifecycles. - Metrics API:
Kafka exposes a comprehensive set of metrics through its Metrics API. These metrics cover various aspects of Kafka's performance, such as broker-level metrics, topic-level metrics, producer and consumer metrics, network metrics, and more. Administrators can programmatically retrieve and analyze these metrics to monitor the health and performance of the Kafka cluster. - Streams API:
Kafka Streams is a library for building stream processing applications on top of Kafka. It provides an API for processing and analyzing data streams. The Streams API includes built-in monitoring capabilities, allowing developers to collect and analyze metrics related to stream processing, such as processing rates, latency, and state store metrics.
Conclusion
- Kafka monitoring is crucial for maintaining the health, performance, and stability of Kafka clusters.
- JMX (Java Management Extensions) provides a standardized way to monitor and manage Kafka deployments.
- Enabling JMX in Kafka allows administrators to access a rich set of metrics, configuration parameters, and control operations.
- JMX metrics for brokers, topics, and consumers include CPU usage, memory utilization, message throughput, partition lag, consumer group lag, and more.
- JMX monitoring enables trend analysis, capacity planning, and proactive issue detection in Kafka clusters.
- Kafka's built-in monitoring APIs, such as AdminClient, Consumer, Producer, Connect, Metrics, and Streams APIs, offer programmatic access to monitor and manage Kafka clusters.
- These monitoring APIs allow administrators and developers to retrieve metadata, track offsets, manage topics and consumer groups, handle message production and consumption, and access comprehensive metrics.
- Monitoring tools like JConsole, along with JMX, provide visual interfaces to monitor Kafka clusters, navigate MBeans, and analyze metrics in real-time.
- Effective Kafka monitoring with JMX and monitoring APIs helps identify bottlenecks, optimize resource allocation, ensure data consistency, and troubleshoot issues promptly.
- By leveraging these monitoring capabilities, administrators can proactively address performance problems, maintain system reliability, and make informed decisions for optimizing Kafka deployments.