Kafka Monitoring Best Practices
Overview
Kafka monitoring is a crucial aspect of managing and ensuring the reliable operation of Apache Kafka, a distributed streaming platform. Kafka monitoring involves the continuous tracking, analysis, and visualization of various metrics and events within a Kafka cluster to gain insights into its performance, health, and overall behavior. One of the primary objectives of Kafka monitoring is to monitor the cluster's throughput, latency, and availability. Monitoring these metrics helps detect any anomalies or deviations from normal behavior, enabling prompt identification and resolution of potential issues.
Introduction
Brief overview of Apache Kafka
Apache Kafka, developed by the Apache Software Foundation, is a distributed streaming platform that operates as open-source software. Its primary purpose is to effectively manage and process large amounts of data streams in real time. Due to its ability to scale seamlessly and maintain resilience in the face of failures, Kafka has gained significant popularity as a preferred solution for constructing fault-tolerant data pipelines and event-driven applications.
At its core, Kafka consists of three main components: producers, topics, and consumers. Producers are responsible for publishing records to Kafka topics, which are log-like data structures that store the stream of records in a fault-tolerant manner. Consumers subscribe to topics and consume records in the order they were published.
Kafka Streams, on the other hand, is a powerful library built on top of Apache Kafka. It provides a high-level API for building real-time stream processing applications. Kafka Streams allows developers to process and analyze data streams in real-time, enabling them to derive valuable insights and perform various computations on the data.
Importance of monitoring in Apache Kafka
Monitoring is of utmost importance in Apache Kafka for several reasons:
- Performance Optimization: Monitoring Kafka allows administrators to gain insights into the performance of the cluster, including metrics such as throughput, latency, and resource utilization. By monitoring these metrics, administrators can identify bottlenecks, optimize configurations, and fine-tune the cluster to achieve optimal performance.
- Issue Detection and Troubleshooting: Monitoring helps in early detection and identification of issues or anomalies within the Kafka cluster. It enables administrators to track important metrics, such as connectivity issues, data discrepancies, or misconfigurations, which can indicate potential problems. By proactively monitoring and alerting on such issues, administrators can troubleshoot and resolve them before they escalate into major disruptions. Here is a steps wise guide to help you address these challenges effectively:
- Monitoring and Alerting
- Logging and Auditing
- Documentation and Configuration Management
- Testing and Validation
- Fault Tolerance and High Availability: Kafka monitoring plays a crucial role in ensuring the fault tolerance and high availability of the system. By monitoring replication metrics and the health of individual brokers, administrators can identify any synchronization issues, replication delays, or broker failures.
- Capacity Planning and Scaling: Monitoring helps administrators understand the resource utilization patterns of the Kafka cluster over time. By tracking metrics related to CPU, memory, disk space, and network utilization, administrators can make informed decisions regarding capacity planning and scaling.
- Security and Compliance: Monitoring Kafka helps ensure the security and compliance of the system. By monitoring access logs, authentication, and authorization metrics, administrators can identify any suspicious activities or breaches.
- Performance Benchmarking and Evaluation: Monitoring allows administrators to benchmark Kafka's performance against predefined metrics or service-level agreements (SLAs). By comparing actual performance with expected benchmarks, administrators can evaluate the effectiveness of optimizations, configuration changes, or hardware upgrades.
Understanding Kafka and the Need for Monitoring
What is Apache Kafka?
Apache Kafka is an open-source distributed streaming platform that provides a scalable, fault-tolerant, and high-throughput system for handling real-time data feeds. It was originally developed at LinkedIn and later became an Apache Software Foundation project.
Kafka's architecture follows a distributed model, allowing it to scale horizontally by adding more brokers to the cluster as the data volume or processing requirements increase. This scalability makes Kafka suitable for handling streaming data from various sources such as log files, application metrics, social media feeds, IoT devices, and more.
Why is monitoring critical in Kafka operations?
Monitoring is critical in Kafka operations for several reasons:
- Proactive Issue Detection: Monitoring allows for the early detection of issues or anomalies within the Kafka cluster. By continuously monitoring key metrics such as throughput, latency, disk utilization, and replication lag, administrators can identify any deviations from normal behavior. Proactive issue detection helps in addressing problems before they escalate and impact the overall performance and reliability of the system.
- Performance Optimization: Monitoring provides insights into the performance of the Kafka cluster, enabling administrators to optimize its configuration and resource allocation. By monitoring metrics like message throughput, consumer lag, and broker resource utilization, administrators can identify bottlenecks, tune parameters, and make informed decisions to enhance the overall performance of the system.
- Fault Tolerance and High Availability: Kafka is designed to be a highly fault-tolerant and resilient system. Monitoring plays a critical role in ensuring the fault tolerance and high availability of the cluster. By monitoring replication metrics, broker health, and cluster connectivity, administrators can detect and address issues related to data replication, broker failures, or network disruptions. Timely intervention based on monitoring data helps maintain data integrity and availability.
- Capacity Planning and Scaling: Monitoring provides valuable insights into resource usage patterns and helps in capacity planning and scaling the Kafka cluster. By monitoring metrics related to CPU, memory, disk space, and network utilization, administrators can analyze historical trends, forecast future requirements, and scale the cluster accordingly. Monitoring assists in optimizing resource allocation, preventing performance degradation due to resource constraints, and accommodating growing data volumes.
- Security and Compliance: Monitoring Kafka is crucial for maintaining security and compliance. By monitoring access logs, authentication, and authorization metrics, administrators can identify any unauthorized access attempts or security breaches. Monitoring also helps in tracking compliance-related metrics, such as data retention policies and encryption requirements, ensuring adherence to regulatory standards and data protection guidelines.
- Operational Efficiency: Monitoring contributes to operational efficiency by providing real-time visibility into the health and performance of the Kafka cluster. Administrators can set up alerts and notifications based on predefined thresholds or anomalies, enabling them to proactively respond to issues and minimize downtime.
Kafka Monitoring Basics
Introduction to Kafka’s built-in Monitoring APIs
Kafka provides built-in Monitoring APIs that allow users to gather valuable insights and metrics about the Kafka cluster's performance and health. These APIs offer a programmatic way to access real-time monitoring data, enabling users to build custom monitoring solutions or integrate Kafka monitoring with existing monitoring systems.
- Kafka Metrics API: The Kafka Metrics API provides a comprehensive set of metrics related to the Kafka cluster's performance and resource utilization. It exposes metrics such as message throughput, request latency, broker and topic-level metrics, consumer lag, and more. These metrics can be accessed using the Java-based Metrics API or the REST-based Metrics API, allowing users to retrieve and analyze real-time data about the Kafka cluster's behavior.
- Kafka AdminClient API: The Kafka AdminClient API offers administrative functionalities for managing and monitoring Kafka clusters. It allows users to retrieve metadata about topics, partitions, brokers, and consumer groups. The AdminClient API can be utilized to monitor the Kafka cluster's metadata and obtain information about its structure and configuration.
- Kafka Consumer Lag API: The Consumer Lag API provides insights into the lag of Kafka consumers. It allows users to monitor the lag between the latest produced message and the last consumed message for each consumer group. Monitoring consumer lag is crucial for understanding the real-time progress of consumer applications and identifying potential bottlenecks or issues.
- Kafka Connect Metrics API: Kafka Connect is a framework for building and running data connectors that integrate Kafka with external systems. The Kafka Connect Metrics API provides metrics specific to Kafka Connect, including connector-level metrics, task-level metrics, and worker-level metrics. These metrics help monitor the performance, throughput, and status of Kafka Connect connectors and tasks.
Introduction to JMX
Java Management Extensions (JMX) is a Java technology that provides a standard way to manage and monitor Java applications and resources. It offers a set of APIs, protocols, and tools for instrumenting and managing Java applications at runtime. JMX enables administrators and developers to monitor the performance, health, and configuration of Java applications, as well as perform administrative tasks programmatically.
The core components of JMX include:
- MBeans (Managed Beans): MBeans are Java objects that expose attributes and operations to be managed and monitored. They encapsulate the management and monitoring functionality of a Java application or resource. MBeans can be either Standard MBeans, MXBeans, Dynamic MBeans, or Open MBeans, each providing different levels of flexibility and capabilities.
- MBean Server: The MBean Server is a runtime component that serves as the central repository for managing MBeans. It provides a registry where MBeans are registered and can be accessed by management clients. The MBean Server allows clients to query, invoke operations, and monitor the attributes of MBeans.
- JMX Agents: JMX Agents are Java applications or services that host the MBean Server and provide a management interface for remote or local management clients. They allow external tools and applications to connect to the MBean Server and access the managed resources. JMX Agents can be embedded within the Java application or run as separate processes.
- JMX Connectors: JMX Connectors provide the means for management clients to connect to the JMX Agent and interact with the MBean Server remotely. They define the communication protocols and transport mechanisms used for exchanging management data. Common JMX connectors include RMI (Remote Method Invocation), JMXMP (JMX Messaging Protocol), and Web-based connectors like HTTP or HTTPS.
- JMX Monitoring Tools: JMX provides a range of tools and utilities for monitoring and managing Java applications. These include command-line tools like jconsole and jvisualvm, which provide graphical interfaces for monitoring and managing MBeans. There are also third-party monitoring tools and frameworks that integrate with JMX and offer advanced features for monitoring, alerting, and visualization of management data.
Understanding important metrics: brokers, producers, consumers
Understanding the important metrics for brokers, producers, and consumers in Apache Kafka is crucial for monitoring and optimizing the performance of the Kafka cluster. Here are some key metrics to consider for each component:
Brokers:
- Incoming/Outgoing Bytes: This metric indicates the volume of data being ingested or sent out by the brokers. Monitoring the incoming and outgoing bytes helps track the overall data flow and identify any potential bottlenecks.
- Request Latency: It measures the time taken by brokers to process client requests. Monitoring request latency helps ensure that brokers are handling requests efficiently and enables identification of potential performance issues.
- Disk Usage: Monitoring the disk usage of brokers is essential to prevent storage-related problems. Tracking the disk space utilization ensures that brokers have sufficient storage capacity and helps avoid situations where brokers run out of disk space.
- CPU and Memory Utilization: Monitoring CPU and memory usage of brokers provides insights into resource utilization. High CPU or memory usage could indicate resource contention, which can impact the overall performance of the cluster.
Producers:
- Message Throughput: Monitoring the rate at which producers are publishing messages helps gauge the overall data ingestion rate into Kafka. Tracking message throughput allows administrators to assess the load on the cluster and optimize the performance of producers accordingly.
- Message Error Rate: This metric indicates the rate of failed or rejected messages. Monitoring the error rate helps identify potential issues such as serialization errors, network connectivity problems, or broker unavailability, and enables proactive troubleshooting.
- Producer Latency: It measures the time taken by producers to send messages to brokers. Monitoring producer latency helps identify any delays or performance issues in the message transmission process.
Consumers:
- Consumer Lag: Consumer lag measures the time difference between the latest produced message and the last consumed message for a consumer group. Monitoring consumer lag is essential for tracking the real-time progress of consumers and identifying potential bottlenecks or issues that might affect data processing.
- Message Throughput: Similar to producers, monitoring the message throughput of consumers helps assess the rate at which consumers are processing messages from Kafka. Tracking message throughput enables administrators to evaluate consumer performance and detect any anomalies or inefficiencies.
- Offset Commit Rate: This metric represents the rate at which consumers commit offsets to Kafka to track their progress in consuming messages. Monitoring offset commit rate helps ensure that consumers are committing offsets at an appropriate frequency and can help detect any issues related to offset management.
Setting Up Monitoring in Kafka
Setting up monitoring in Kafka involves several steps to ensure the effective monitoring and management of the Kafka cluster. Let's go through the steps of setting up monitoring in Kafka
- Determine Monitoring Requirements:
- Define the metrics and aspects to monitor, such as cluster health, performance, throughput, latency, etc.
- Choose Monitoring Tools:
- Prometheus and Grafana are popular monitoring tools for Kafka. Let us discuss about them in details: Prometheus: Prometheus is an open-source monitoring and alerting tool that plays a crucial role in the realm of modern observability. It is designed to collect, store, and query time-series data, making it highly suitable for monitoring and analyzing the performance of Kafka's extensive metric data over time, including applications, services, and infrastructure. One of Prometheus' key strengths is its pull-based model, where it periodically scrapes and retrieves metrics data from designated endpoints. This approach allows it to be used in dynamic and containerized environments. Grafana: Grafana provides significant benefits for monitoring Kafka, enhancing the observability and management of Kafka clusters. Firstly, Grafana is a powerful and versatile data visualization tool that seamlessly integrates with various data sources, including Prometheus, which is commonly used for collecting Kafka metrics. This integration enables Kafka operators to create visually appealing and interactive dashboards, presenting real-time data on Kafka's performance, throughput, and latency in a user-friendly manner.
- Enable JMX:
- Configure Kafka to enable JMX monitoring by setting the KAFKA_JMX_OPTS environment variable in the Kafka startup scripts.
- Example: Add the following line to the Kafka startup script (e.g., kafka-server-start.sh):
- Replace <KAFKA_HOST> with the hostname or IP address of the Kafka broker.
- Configure JMX Exporter (Optional):
- Set up a JMX exporter to collect JMX metrics from Kafka and expose them in a format compatible with the chosen monitoring tool.
- Example: To use the Prometheus JMX exporter, you can download the JAR file and configure it with a YAML configuration file. An example configuration might look like this:
- Run the JMX exporter using the following command:
- Define Monitoring Dashboards:
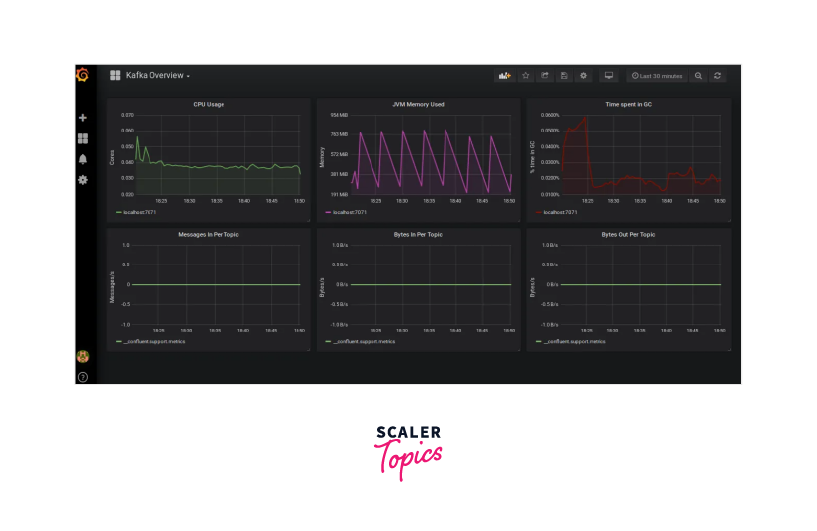
- Use the chosen monitoring tool (e.g., Grafana) to create custom dashboards or utilize pre-built dashboards.
- Example: In Grafana, you can create a dashboard and add panels to visualize Kafka metrics. Use Prometheus as the data source and build queries to fetch relevant metrics. Below you can see the final result of your dashboard:
- Set Up Alerting:
- Configure alerting rules to receive notifications when certain thresholds are breached or specific events occur.
- Example: In Prometheus, you can define alerting rules in a separate YAML file and configure alertmanager to send notifications via email or other channels.
- Monitor Kafka Producers and Consumers:
- Collect metrics related to producers and consumers using the monitoring tool or dedicated libraries.
- Example: Use the Kafka clients for producers and consumers along with a monitoring library like Micrometer to capture and expose custom metrics. For example, you can measure the message throughput for a producer:
- Continuous Evaluation and Optimization:
- Regularly review the monitoring data, analyze performance trends, and optimize configurations based on insights.
- Example: Monitor resource utilization using the monitoring tool and adjust Kafka broker settings like the number of partitions, replication factor, or batch sizes to improve performance and efficiency.
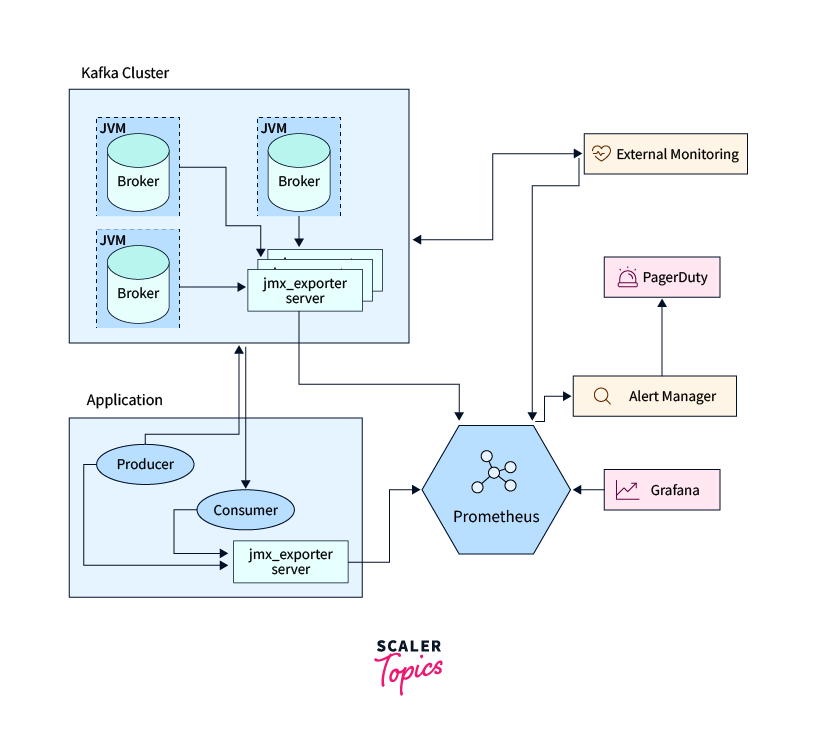
Given below the example of monitoring system architecture at a high level:
Best Practices for Kafka Monitoring
Best Practices for Kafka Monitoring:
- Understand which metrics to monitor: Gain a clear understanding of the key metrics that are important for your specific use case and Kafka deployment. This includes metrics related to cluster health, performance, resource utilization, throughput, latency, disk usage, consumer lag, and message error rates. Monitoring the right metrics will provide insights into the health and performance of the Kafka cluster.
- Implement proactive monitoring: Proactive monitoring is essential to identify issues before they escalate and impact the overall performance and reliability of the Kafka cluster. Set up regular monitoring checks to track metrics in real-time, detect anomalies or deviations, and receive alerts when thresholds are breached. Proactive monitoring enables quick response and reduces downtime.
- Set up alerts and thresholds: Define appropriate alerting rules and thresholds for critical metrics. Configure alerts to notify the relevant stakeholders via email, SMS, or integration with collaboration tools like Slack or PagerDuty. Establish clear escalation paths and response procedures to ensure timely action when alerts are triggered.
- Monitor performance and throughput: Keep a close eye on performance metrics like message throughput, request latency, and broker resource utilization. Monitoring performance metrics helps identify potential bottlenecks, tune configurations, and optimize the Kafka cluster for optimal throughput and latency.
- Monitor and manage failures: Monitor metrics related to failures, such as replication lag, message error rates, and broker availability. Proactively monitor these metrics to identify failures or disruptions in the Kafka cluster, and take appropriate actions to resolve issues promptly. Implement robust error handling and retry mechanisms in producers and consumers to handle failures gracefully.
- Monitor resource utilization: Monitor the resource utilization of Kafka brokers, including CPU, memory, and disk usage. Keep an eye on resource metrics to ensure that brokers have sufficient resources to handle the workload efficiently. Scaling up resources or adding additional brokers may be necessary to accommodate growing data volumes or increased traffic.
- Utilize monitoring tools and frameworks: Leverage robust monitoring tools and frameworks specifically designed for Kafka, such as Prometheus, Grafana, or specialized Kafka monitoring solutions. These tools provide built-in dashboards, visualization, and alerting capabilities, making it easier to monitor and manage Kafka clusters effectively.
- Regularly review and optimize: Continuously review monitoring data, analyze performance trends, and optimize Kafka configurations and infrastructure based on the insights gained. Regularly review Kafka logs and error messages to detect any anomalies or warnings that might indicate potential issues.
- Continuous Monitoring: Continuous monitoring involves collecting and analyzing data in real-time or near real-time. This approach is essential for metrics that require constant oversight and immediate response to changes or anomalies. Metrics related to critical system health, performance, and security are prime candidates for continuous monitoring. For example, metrics such as CPU usage, memory consumption, network traffic, and error rates may require continuous monitoring to ensure timely detection of issues and rapid incident response.
- Periodic Monitoring: Periodic monitoring, on the other hand, involves collecting data at specific intervals, such as every hour, day, or week. This approach is suitable for metrics that don't require constant attention or change relatively slowly over time. For instance, historical data related to long-term trends, capacity planning, or resource usage patterns can often be adequately captured through periodic monitoring.
Conclusion
In conclusion, here are the key points regarding Kafka monitoring best practices:
- Understand the metrics: Gain a clear understanding of the metrics relevant to your Kafka deployment, including cluster health, performance, resource utilization, throughput, latency, disk usage, consumer lag, and message error rates.
- Proactive monitoring: Implement proactive monitoring to detect issues before they escalate, using real-time monitoring checks and alerts to ensure timely response and reduce downtime.
- Set up alerts and thresholds: Define appropriate alerting rules and thresholds for critical metrics, and configure alerts to notify relevant stakeholders via email, SMS, or collaboration tools.
- Monitor performance and throughput: Keep track of performance metrics such as message throughput, request latency, and broker resource utilization to identify bottlenecks, tune configurations, and optimize Kafka cluster performance.
- Monitor and manage failures: Track metrics related to replication lag, message error rates, and broker availability to proactively detect failures and disruptions, and implement robust error handling and retry mechanisms.
- Monitor resource utilization: Monitor CPU, memory, and disk usage of Kafka brokers to ensure sufficient resources for efficient processing, considering scaling up resources or adding additional brokers when needed.
- Utilize monitoring tools: Leverage specialized Kafka monitoring tools and frameworks like Prometheus, Grafana, or dedicated Kafka monitoring solutions for built-in dashboards, visualization, and alerting capabilities.
- Regular review and optimization: Continuously review monitoring data, analyze performance trends, and optimize Kafka configurations and infrastructure based on insights gained from monitoring.