Monitoring Kubernetes Clusters
Overview
Kubernetes monitoring is crucial for effective cluster administration, enabling efficient resource utilization tracking. It aids in real-time performance insights, auto-scaling triggers, and cluster health assurance. Monitoring node activity, capacity, and app count helps in identifying faults. Kubernetes manages pods containing containers for scalable applications. Application Performance Monitoring (APM) aims to improve cluster behavior and Kubernetes dependability through metrics, log, tracing, and configuration monitoring.
Importance of Monitoring in Kubernetes
What is Kubernetes Monitoring?
Kubernetes monitoring is a crucial tool for managing clusters, enabling administrators to monitor the utilization of resources like memory, CPU, and storage. This helps in ensuring the number of pods are running, resource utilization is approaching critical limits, or faults or misconfiguration prevent pods or nodes from participating in the cluster.

Importance of Monitoring in Kubernetes
- Resource Utilization:
Monitoring monitors resource utilization within a cluster, enabling efficient allocation, scaling, and optimization to prevent bottlenecks and ensure smooth operations. - Performance Insights:
Monitoring offers real-time visibility into cluster applications and services, identifying slow response times, high latency, and other performance issues for quick diagnosis and resolution. - Fault Detection and Diagnosis:
Monitoring is crucial for detecting anomalies, failures, and errors early, diagnosing root causes, reducing downtime, and enhancing application reliability. - Auto-Scaling:
Monitoring data can trigger auto-scaling mechanisms, ensuring dynamic resource allocation to meet demand and maintain optimal performance. - Cluster Health:
Monitoring ensures the cluster's health, including nodes, pods, and other components, is running smoothly and all components are operational.
Cluster Health Monitoring in Kubernetes
Cluster monitoring is a process that monitors the overall health of a Kubernetes cluster, ensuring that all nodes are operational, their capacity is maintained, and the number of apps running on each node is monitored to determine resource utilization.
A few of the measurable metrics:
- Node resource utilization –
There are numerous measures in this field, all of which are related to resource utilisation. Examples include network bandwidth, disc utilisation, CPU and memory utilisation. These metrics can be used to determine whether or not to grow or decrease the number and size of nodes in the cluster. - Number of nodes –
The number of available nodes is a crucial indicator to monitor. This enables you to determine what you are paying for (if you are using cloud providers) and what the cluster is used for. - Running pods –
The number of pods running will indicate whether the number of nodes available is adequate and whether they will be able to handle the entire demand if a node fails.
Pod Status Monitoring in Kubernetes
Monitoring a pod may be divided into three categories:
- Kubernetes metrics,
- pod container metrics, and
- application metrics
Kubernetes Metrics
- Tracking the pod's current instance count and expected count, aids in identifying resource shortages in the cluster.
- Evaluating the status of ongoing deployments, including the migration of instances from older to newer versions.
- Monitoring network health and analyzing network data made available by network services.
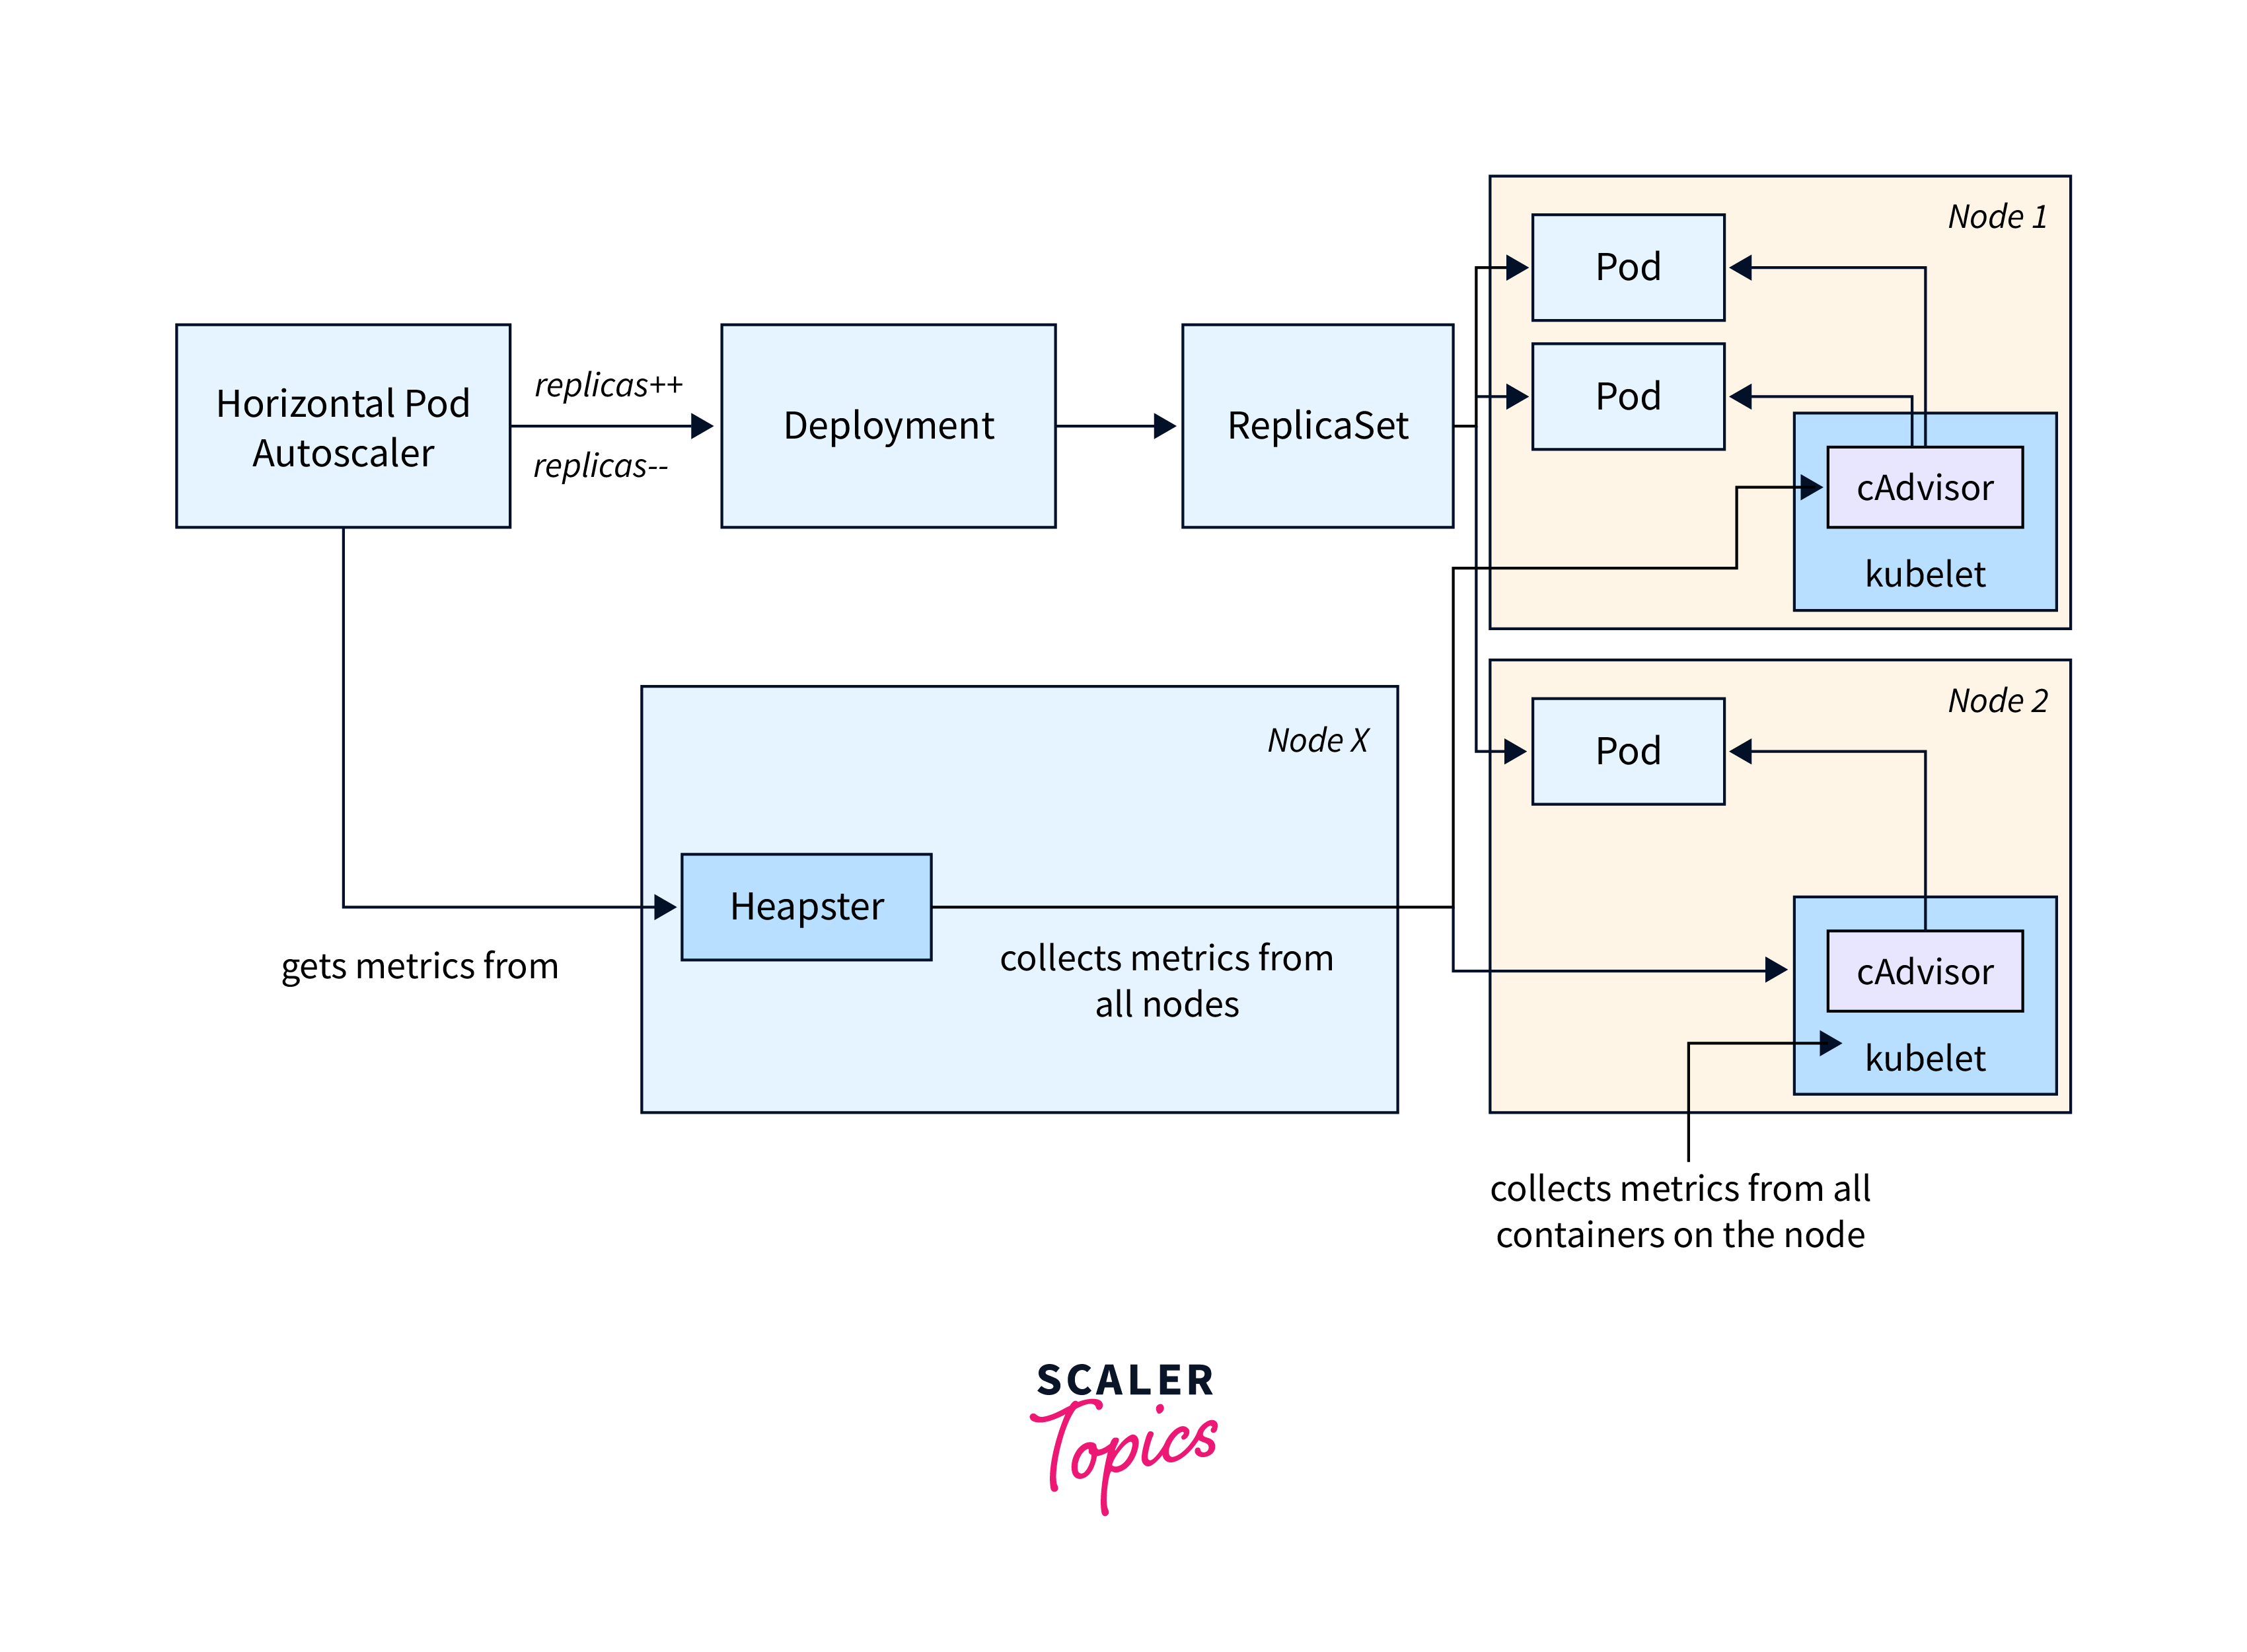
Container Metrics
- Container metrics are mostly acquired by cAdvisor and presented by Heapster.
- Heapster asks each node to get information about running containers.
- Highlighting data such as CPU utilisation, network activity, and memory use in relation to preset limitations.
Application Metrics:
- Gaining insight into the performance of the application within the pod.
- Monitoring parameters such as response times, throughput, error rates, and other application-specific data.
- Understanding how the application behaves and performs in its operational environment.
How to Monitor Resource Utilization in Kubernetes?
For owners of Kubernetes clusters, resource utilization is a crucial metric to track. You can keep an eye on things like CPU, RAM, and storage to monitor resource usage. You can get snapshots of how many resources are being consumed by each pod or node in your Kubernetes cluster with the Kubectl Top command.
What is kubectl?
Kubernetes is a powerful tool that allows users to interact with their Kubernetes cluster through the API. The kubectl command-line tool is a crucial tool for managing tasks, enabling actions like retrieving node information and communicating with the API server through POST commands.
What is a pod in Kubernetes?
Kubernetes is a container management system that uses pods as its foundational abstraction layer, encapsulating containers and sharing resources for replication and dynamic application scaling.
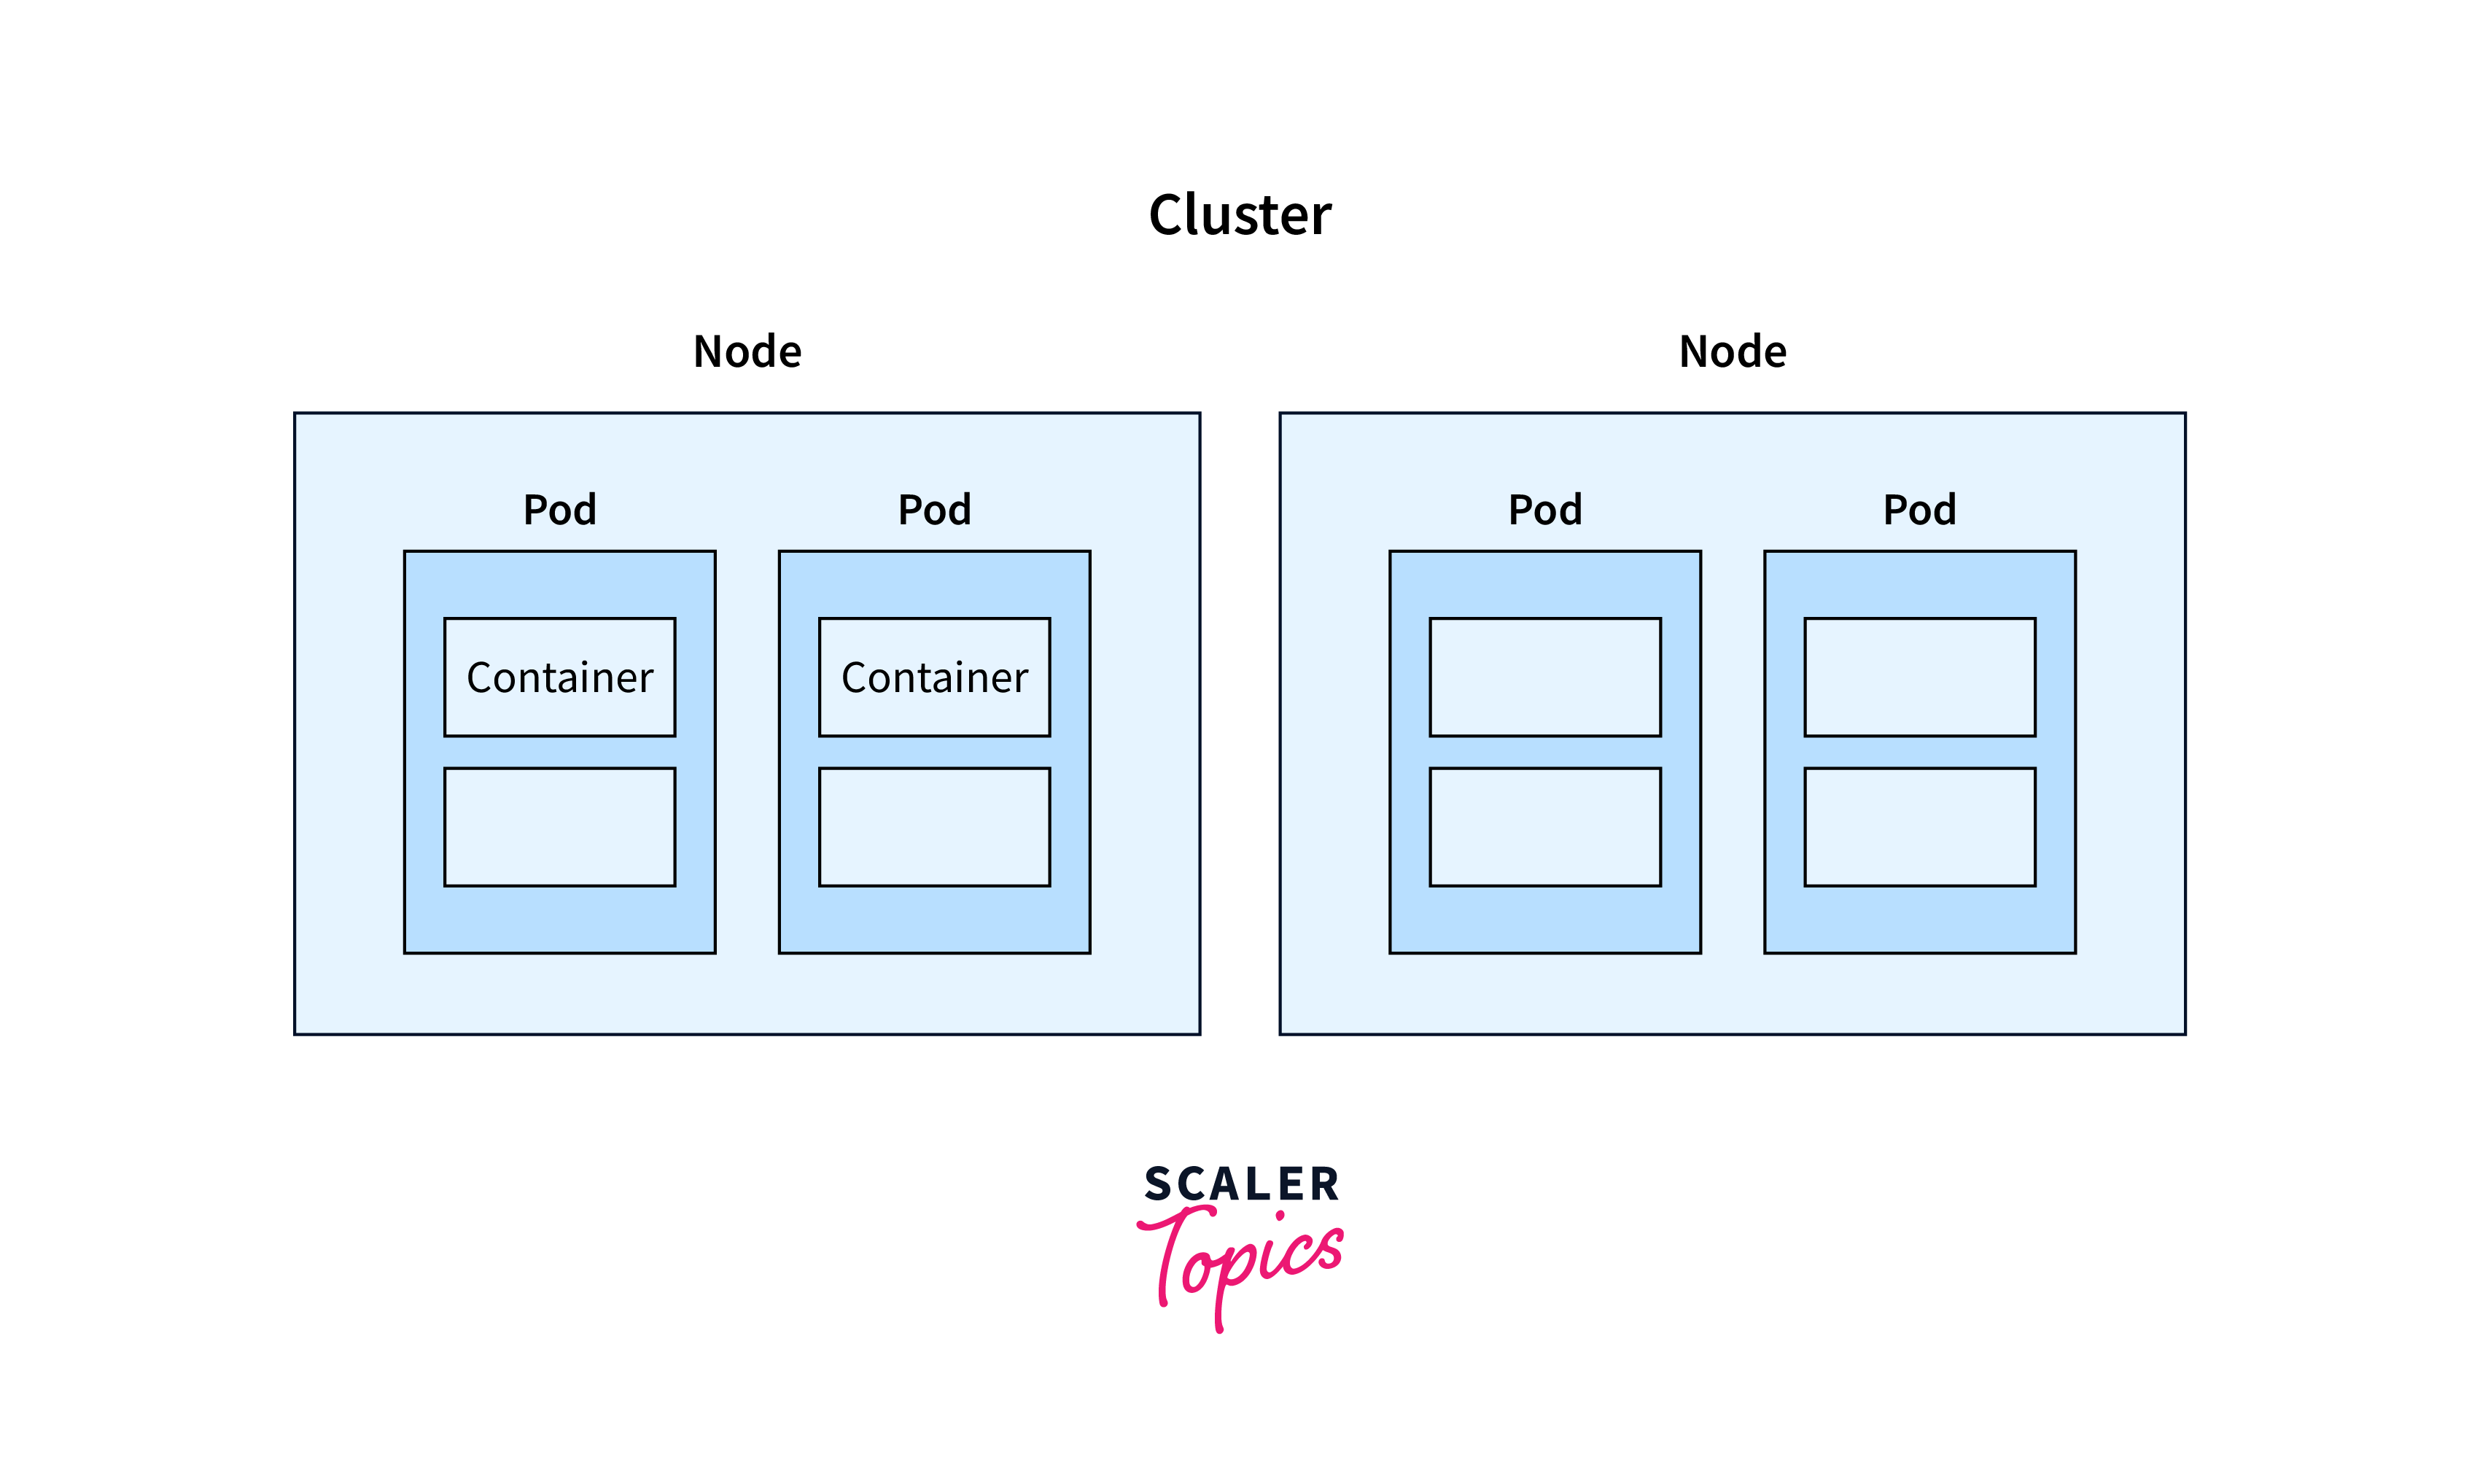
What is a node in Kubernetes?
Nodes serve as the execution environment for Kubernetes pods, encompassing virtual machines, bare metal servers, or cloud instances. These nodes enable dynamic resource scaling. Within a node, multiple pods can coexist across namespaces, offering a segregated environment for efficient management.
What is kubectl Top command?
- The command kubectl top is used to provide a list of all active nodes and pods along with their resource use. It gives you a snapshot of each operating node's CPU, memory, and storage utilization data.
- Each Kubernetes node has cAdvisor, an open-source agent that keeps track of resource utilization for containers. The kubectl command uses the metrics-server to access resource utilization data from cAdvisor.
- You must use the kubectl top command, which displays the CPU, memory, and network utilization for the containers, pods, or nodes, to get these metrics.
The metrics of the current node are displayed by the kubectl top node command and are as follows:

How to read above output?
- CPU(cores) :
It is 338 millicpu, not 338m. Since 1 CPU is equivalent to 1000m, 338m is 33.8% of a single CPU. - CPU%:
This symbol, which is exclusively displayed for nodes, represents the node's overall CPU usage percentage. - Memory:
Used by that node as memory - Memory%:
It is only shown for nodes and represents the node's overall memory utilization percentage.
Application Performance Monitoring in Kubernetes
Kubernetes Application Performance Monitoring (APM) is a tool used to monitor and enhance applications and services on a Kubernetes cluster. It provides developers with a comprehensive view of their cluster's behavior, offering suggestions for improvement. By adopting a shift-left strategy, developers can identify and fix issues before the software is published. However, Kubernetes lacks a standard method for gathering metrics for apps running on the cluster. We can explore three methods for this purpose:
.1.Building metrics logic into applications
- Senior developers are familiar with the first way since it was utilized long before Kubernetes and cloud computing.
- Essentially, instrumentation is implemented straight into the application code.
- This may be accomplished, for example, by employing a Prometheus client library that corresponds to the language in which your application is written.
- Prometheus may then transfer the information to an observability platform, such as Grafana Cloud, for visualization and analysis.
2.Using Kubernetes sidecar containers
- Kubernetes containers enable monitoring applications by deploying a sidecar container alongside the host container.
- This technique executes instrumentation code or logging agent, sending data to the observability platform.
- Kubernetes containers share resources, making logs and information easily accessible to the sidecar container.
- Installing sidecars in Kubernetes is simple, as demonstrated in the sample_sidecar_example.yml manifest.
- The code defines two containers: main-app writes the current date to /var/log/app.txt every 30 seconds, and sidecar-container outputs the contents to the console every 30 seconds.
- Both containers share the shared-logs volume, enabling the sidecar container to send information to a logging agent.
- However, this approach creates new obstacles due to resource usage, making it better suited for small to medium deployments where agents like Grafana Agent are not feasible.
3.Deploying Grafana Agent
- The Grafana Agent is a popular technique for obtaining monitoring data from containers, capturing and passing telemetry data to open-source Grafana OSS Stack, Grafana Cloud, or Grafana Enterprise installations.
- Installed on Kubernetes clusters, it extracts metrics from applications and dependencies, transmitting them to external monitoring platforms like Grafana.
- Setting up the agent is simple using a customizable ConfigMap, and the Grafana Agent Operator simplifies the process by automatically installing and configuring the agent.
Monitoring Methods in Kubernetes
Key monitoring methods are commonly used in Kubernetes, which are most effective when used in combination, and are not an exhaustive list of techniques, but rather some of the most commonly used and effective ones.
1.Metrics-Based Monitoring
- Metrics are the primary form of monitoring for all infrastructure types.
- They help determine the overall health of a cluster, including critical indicators like CPU, RAM, disk, and network usage.
- This data can be used to create sophisticated dashboards and alerts, which can be achieved in Kubernetes by combining Prometheus and Grafana.
- This technique ensures system functionality and provides valuable insights for system management.
2.Log-Based Monitoring
- Metrics collection is useful for notifying failures but not identifying the root cause.
- Log data collection, storage, and analysis are crucial for understanding the failure's cause. Logs are essential for understanding an application's behavior at any given time.
- Using the right tools, trends and mistakes can be quickly discovered. Fluentd, Elasticsearch, and Kibana are commonly used in Kubernetes to gather logs.
3.Tracing-Based Monitoring
- A comprehensive overview of a request path is an important aspect of obtaining a comprehensive viewpoint on failures.
- Tracing helps identify performance bottlenecks and latency concerns, providing a better understanding of service interactions.
- Popular tools like Jaeger and Zipkin offer a comprehensive viewpoint, aiding in optimizing services.
4.Configuration Monitoring
- Mistakes can occur due to configuration issues rather than poor code deployment, as demonstrated by a Twitter engineer.
- It's crucial to monitor your cluster's configuration, including deployments, ClusterRoles, and ConfigMaps, to identify and fix misconfigurations or unauthorized changes.
- Gatekeeper is the preferred tool for this monitoring.
FAQs
Q. What is Grafana Agent and How is it Used for Monitoring?
A. Grafana Agent is a tool used to collect monitoring data from containers and transmit telemetry data to Grafana. It extracts metrics from applications and dependencies, enhancing monitoring capabilities in Kubernetes clusters.
Q. What Can You Monitor Using Container Metrics?
A. Container metrics include CPU utilization, memory usage, and network activity. These metrics are tracked using tools like cAdvisor and Heapster, offering insights into container performance and resource consumption.
Q. What Metrics Can You Monitor in a Kubernetes Cluster?
A. In a Kubernetes cluster, you can monitor various metrics, including:
- Node Resource Utilization:
CPU, memory, disk, and network usage of nodes. - Number of Nodes:
The total number of available nodes in the cluster. - Running Pods:
The number of pods running on nodes, indicating resource utilization and potential demand.
Q. How Can You Monitor Resource Utilization in Nodes and Pods?
A. The kubectl top command provides resource utilization data for nodes, pods, and containers. It displays metrics such as CPU and memory utilization, aiding in monitoring resource consumption in the cluster.
Conclusion
- Finally, monitoring in Kubernetes is critical for simplifying cluster management and improving application dependability. The following are some key points:
- Resource Utilization:
Efficient allocation and scaling prevent bottlenecks, ensuring smooth operations. - Performance Insights:
Real-time visibility aids in prompt issue identification and resolution. - Fault Detection and Diagnosis:
Early anomaly detection minimizes downtime and enhances reliability. - Auto-Scaling:
Monitoring data drives dynamic resource allocation, optimizing performance.
- Resource Utilization:
- Cluster health monitoring keeps track of node functioning, application instances, and resource usage.
- Monitoring pod status organises insights into Kubernetes metrics, container metrics, and application-specific data, allowing for more efficient management.
- Tools such as kubectl top offer snapshots of resource utilisation at the pod and node levels.
- Application Performance Monitoring (APM) improves the behavior of applications and services, hence improving overall performance.
- Monitoring approaches include metrics-based, log-based, tracing-based, and configuration monitoring.