Kubernetes Troubleshooting
Overview
Kubernetes Troubleshooting involves identifying and resolving issues across the ecosystem, including application deployment, networking, storage, and cluster-level difficulties. Techniques include inspecting pod status, debugging, monitoring, observability, proper networking, storage complexities, adherence to best practices, audit logs, and a proactive approach. Continuous monitoring, documentation, and collaboration among teams are crucial for optimal performance and stability in Kubernetes clusters.
Common Kubernetes Issues
The process of finding, diagnosing, and resolving faults in Kubernetes clusters, nodes, pods, or containers is known as troubleshooting. Kubernetes troubleshooting, in a broader sense, comprises good continuous fault management and adopting preventative steps in Kubernetes components.
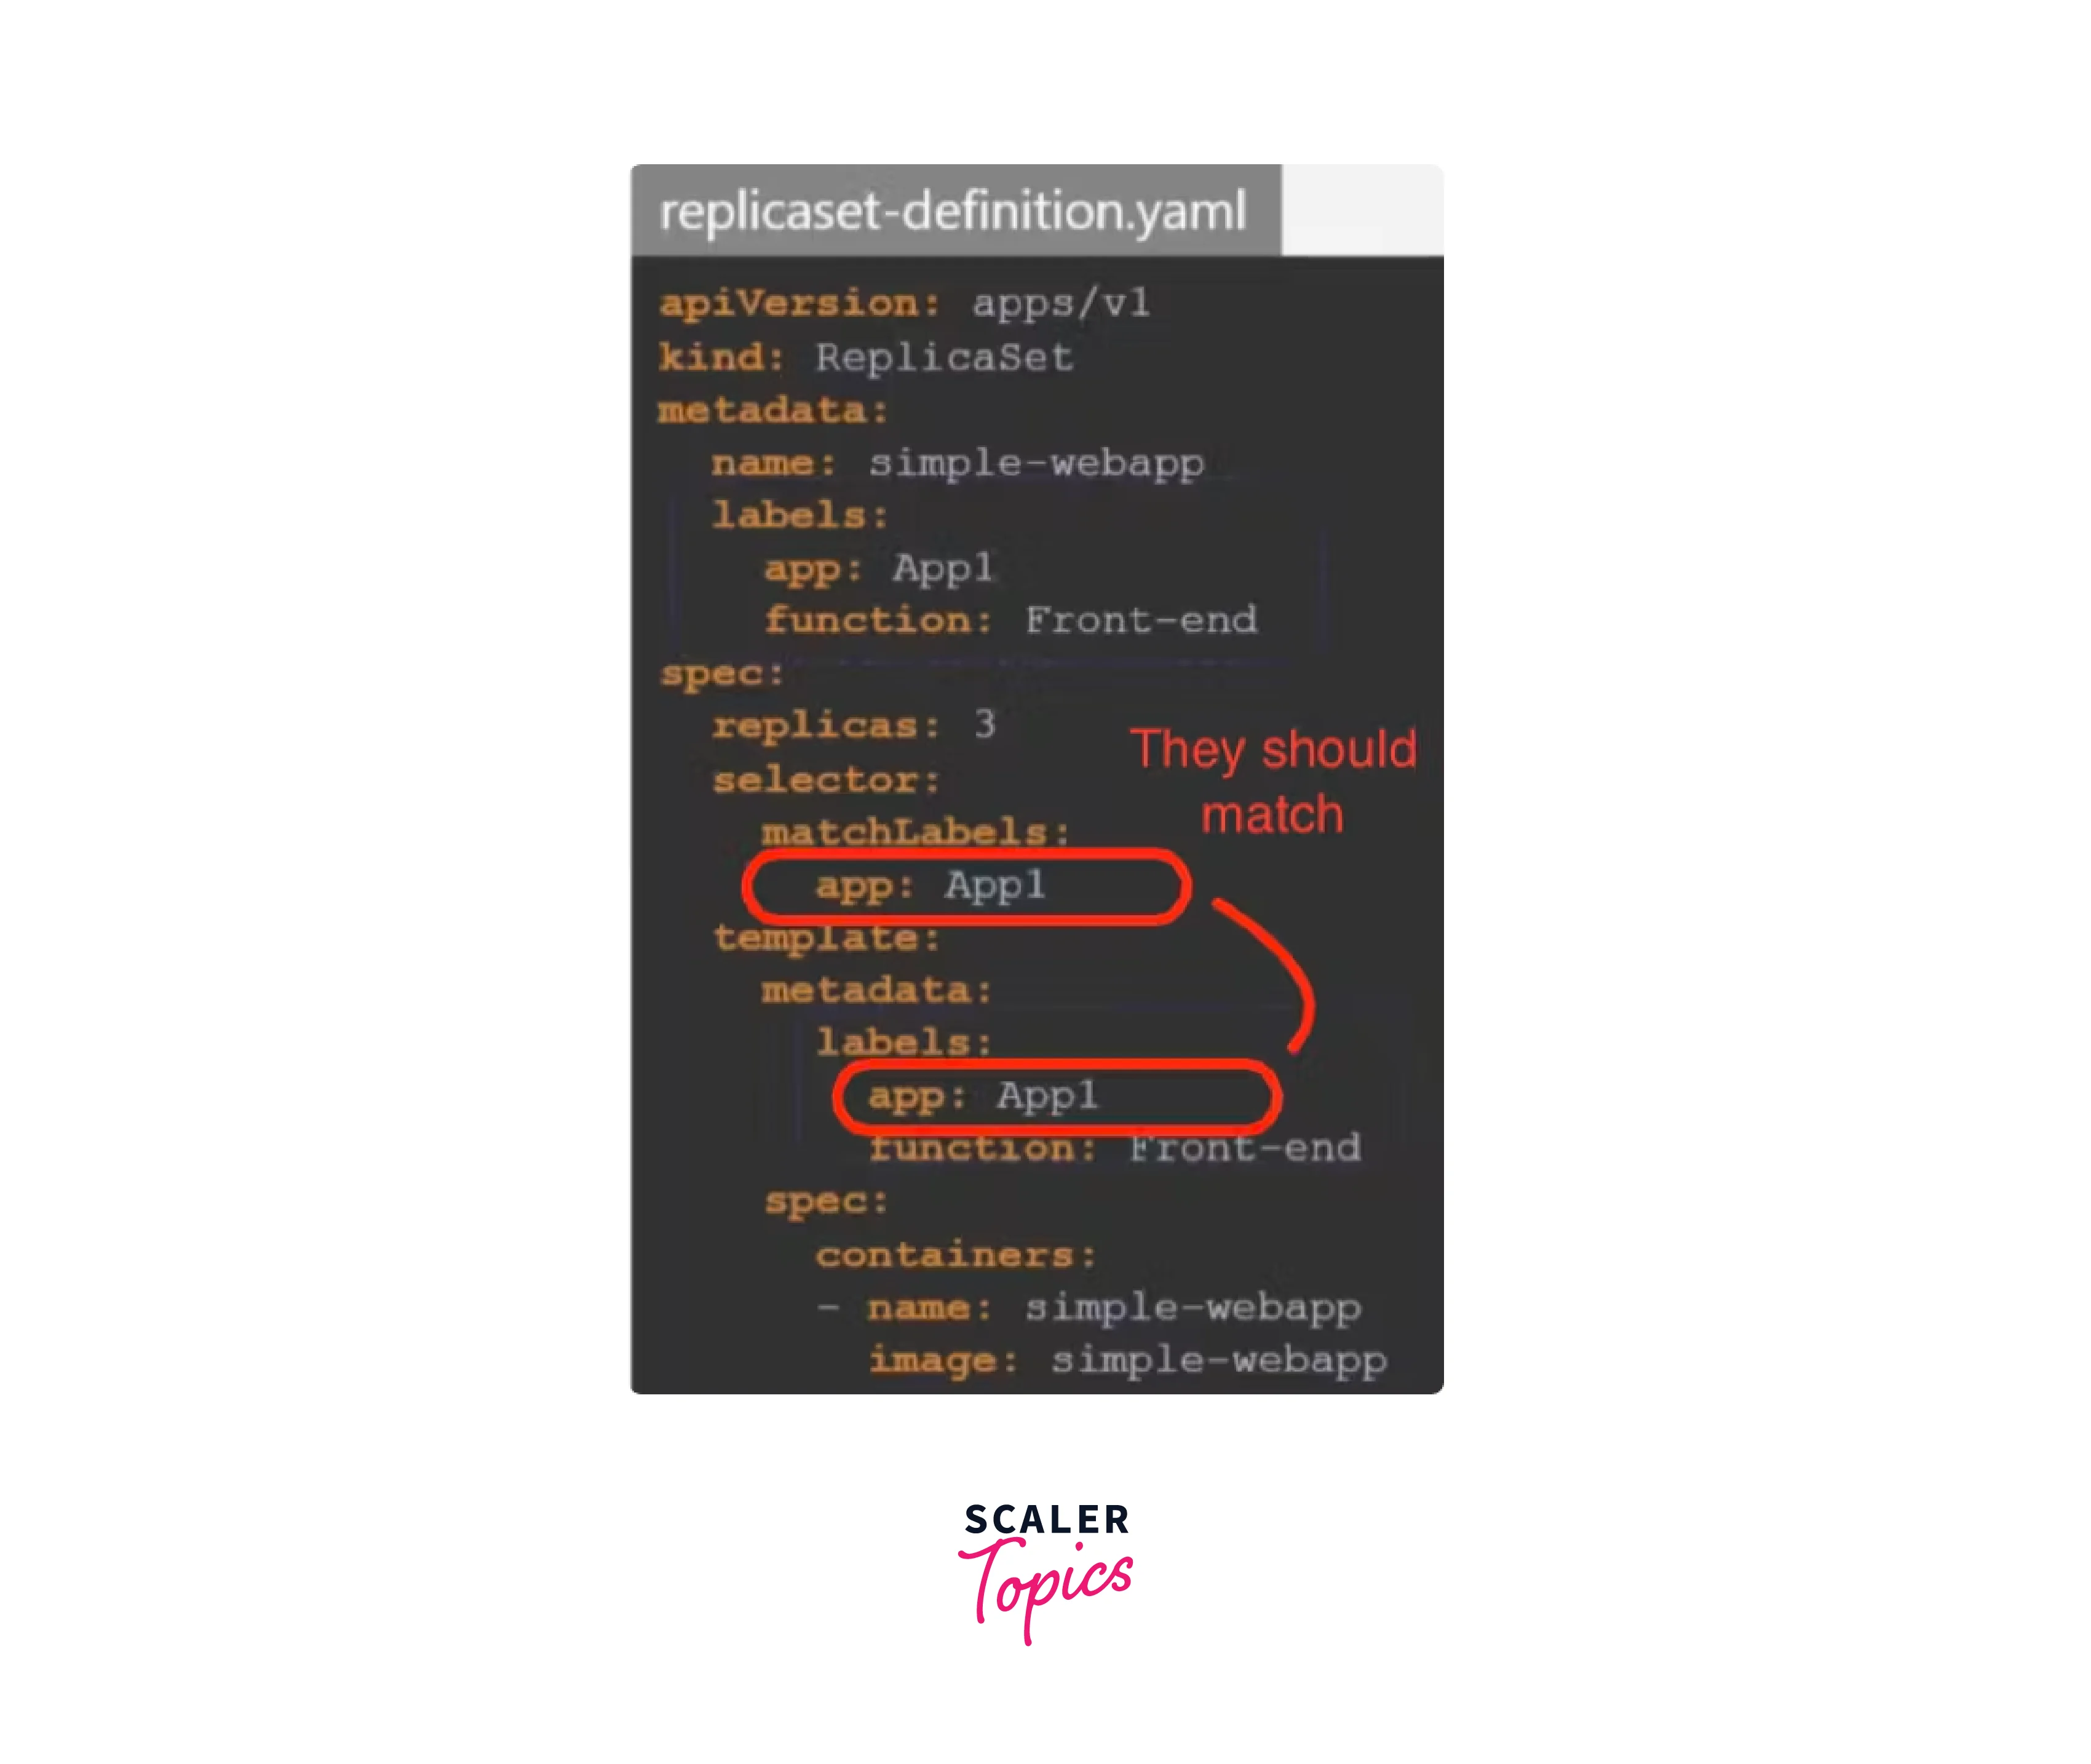
1.Incorrect Labels and Selectors:
- Incorrect use of labels and selectors in Kubernetes setup is a common mistake for beginners.
- Labels are key/value pairs associated with objects like pods and services, while selectors help identify objects based on their labels.
- Incorrect labels can lead to unsupported deployments and errors. Ensure accuracy in YAML files and carefully review for mistakes.
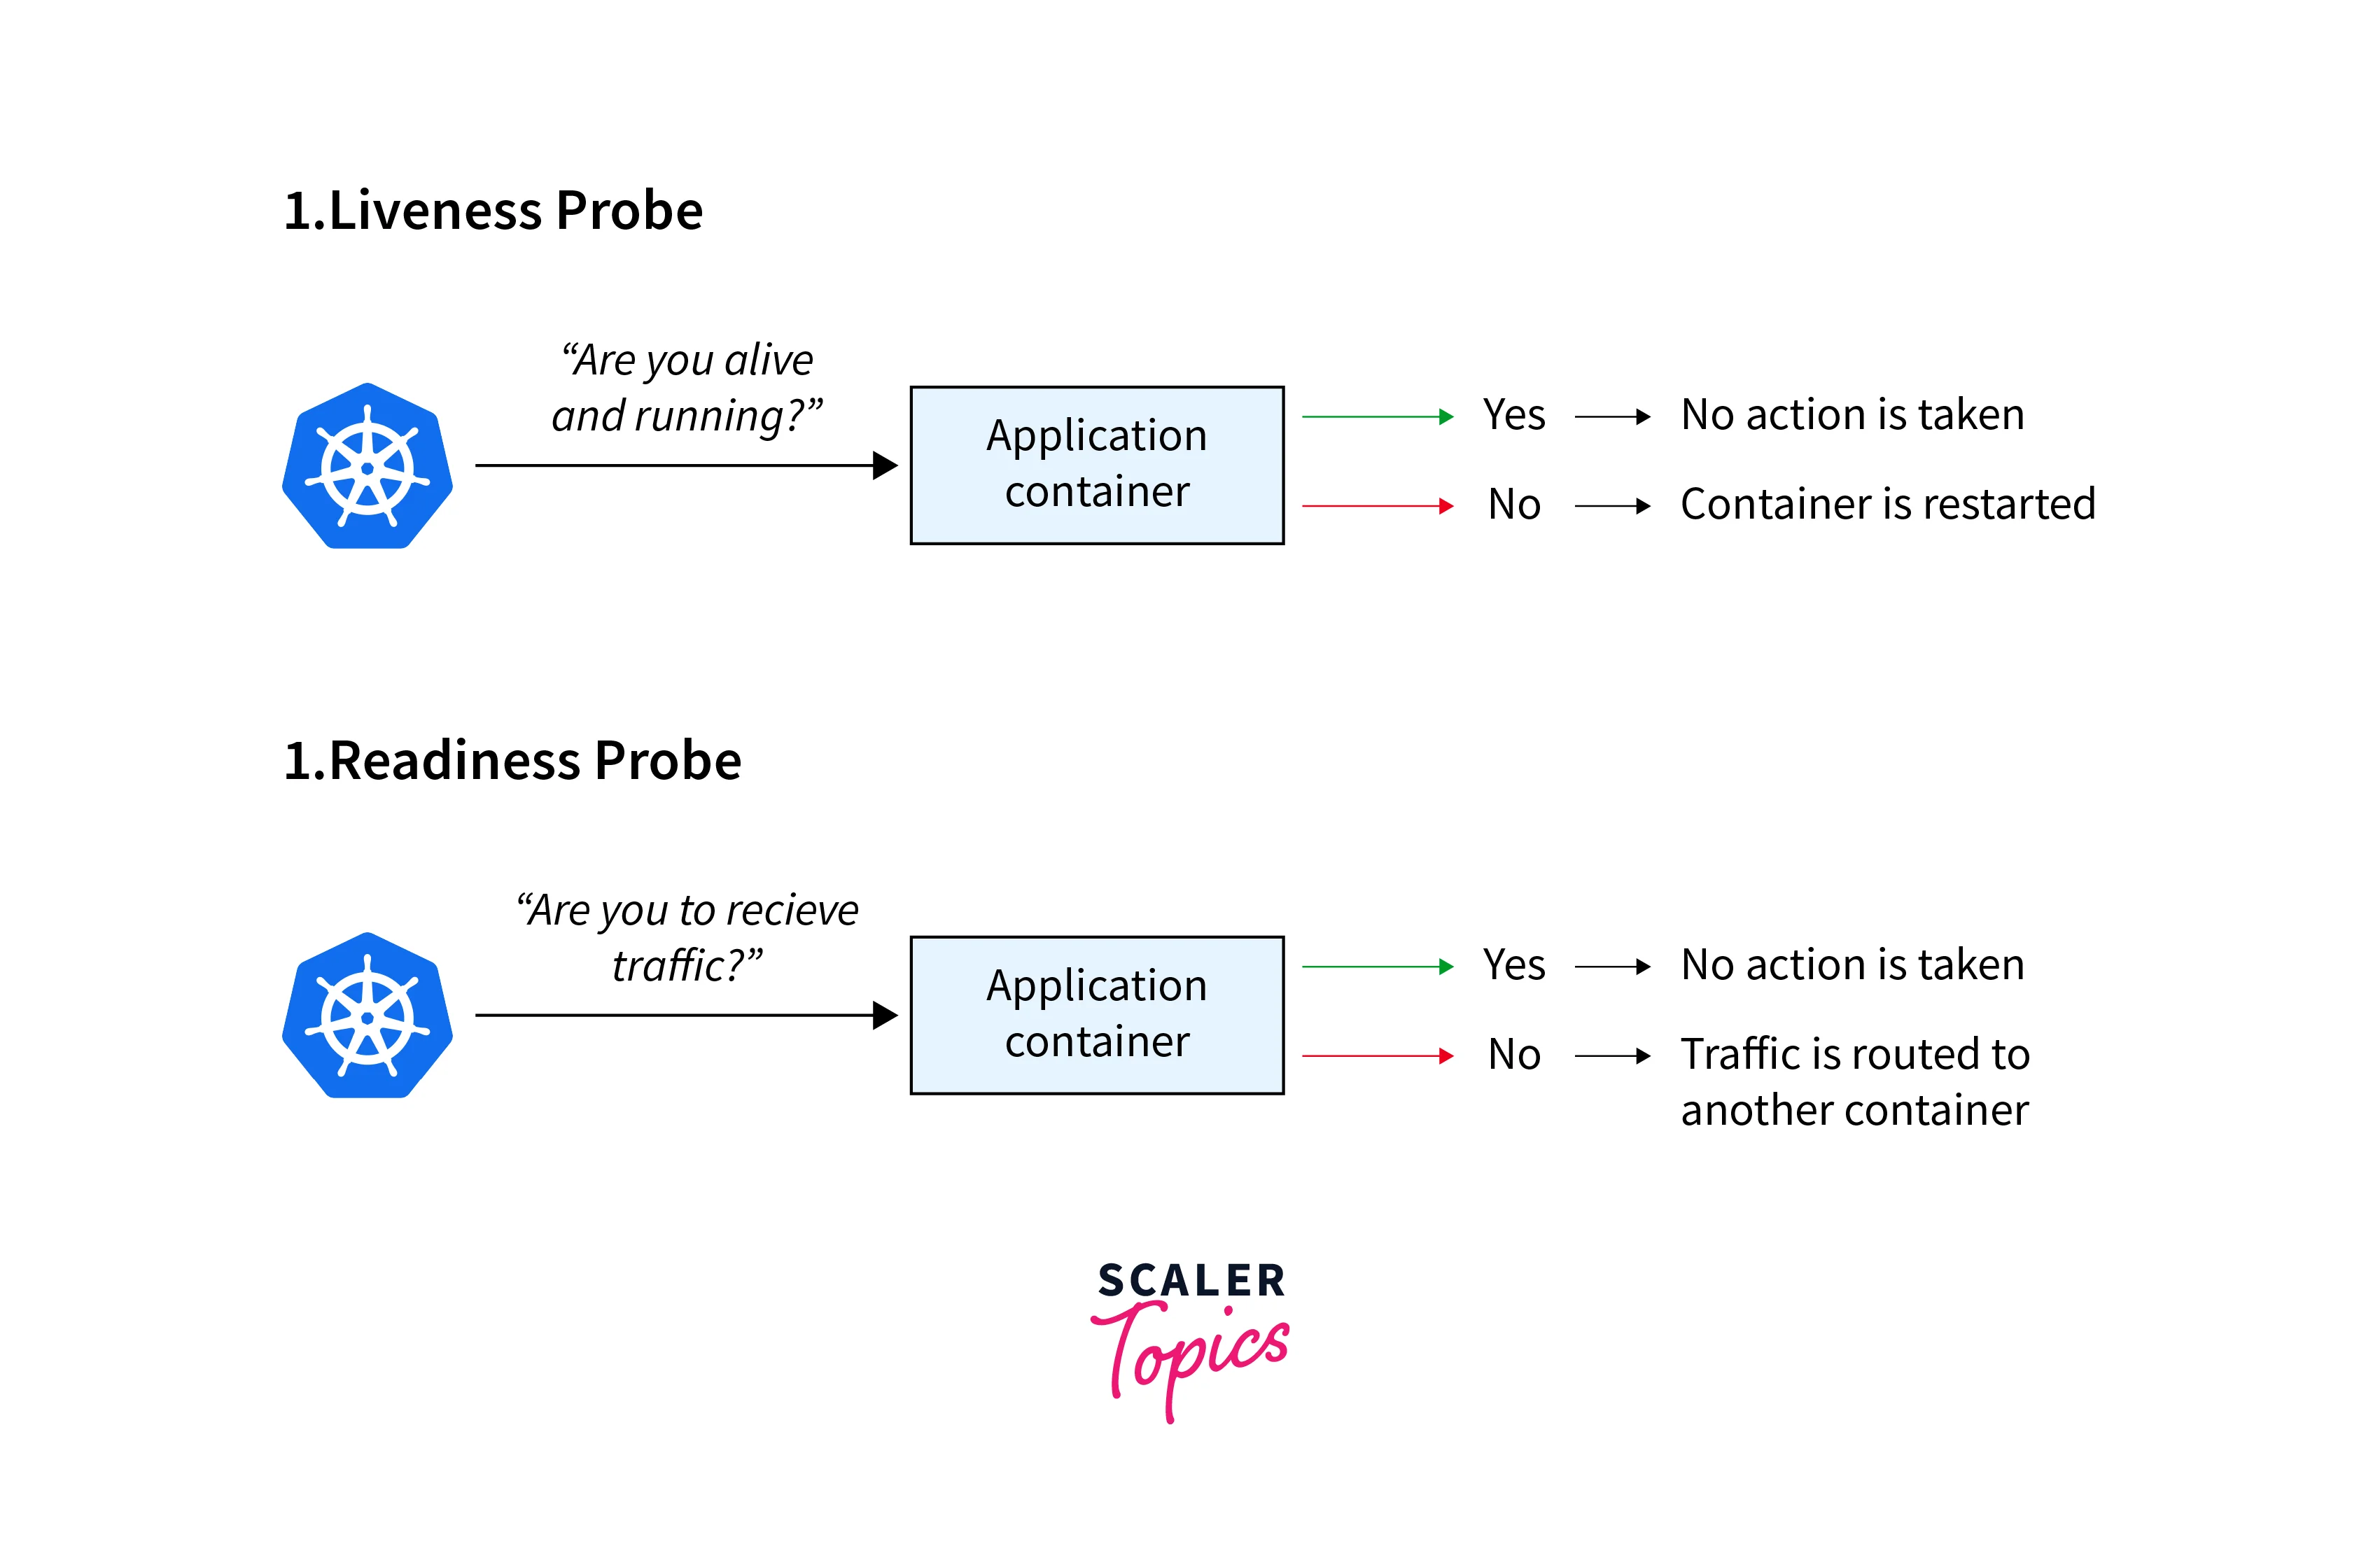
2.Neglecting safety checks
- Health checks are essential for Kubernetes post-deployment to maintain services and monitor pod and container conditions.
- Three key tools for health checks are Startup probe, Liveliness probe, and Readiness probe.
- Startup probe ensures pod creation, Liveliness probe checks application functionality, and Readiness probe confirms traffic handling.
3.Using the Default Namespace for all Objects
-
Namespaces group resources like deployments and services, essential in multi-team or microservices projects.
-
Default namespace is suitable for development but not ideal for production.
-
Not specifying namespace prevents unintended deployments.
Avoid:
Run:
4.Inadequate monitoring and logging:
- Insufficient monitoring and logging in Kubernetes deployment risks.
- Implementing log aggregation, identifying bottlenecks, optimizing cluster performance, and providing comprehensive monitoring with alerts and notifications is vital for troubleshooting and proactive maintenance.
5.Cluster Scaling Difficulties:
- In Kubernetes troubleshooting,kubernetes facilitates horizontal app scaling.
- Scaling the cluster requires careful planning.
- Control plane and worker node scaling demands resource management.
- High availability must be ensured during cluster scaling.
6.Persistent Storage Difficulties:
- Stateful app storage management is challenging.
- Data integrity, backups, and locality can be problematic.
- Diversity in storage providers/plugins complicates management.
7.Cluster Security and Access Control:
- Robust authentication and authorization are vital.
- Weak APIs, misconfigured RBAC, and unauthorized access pose risks.
- Security breaches can expose data and impact the entire cluster.
Monitoring and Logging
Monitoring Kubernetes clusters:
- In Kubernetes troubleshooting ,divide the monitoring into layers for each component of the Kubernetes ecosystem. Begin with the most advanced level: cluster monitoring.
- Cluster monitoring gives a health snapshot. At the cluster level, the following areas should be monitored:
- Use of clusters:
Utilisation of resources to avoid over/under provisioning. - Node consumption:
Monitor node load and balance workloads. - Failed pods:
Locate and analyse any inactive pods.
- Use of clusters:
- Multiple cluster federation may necessitate different monitoring in Kubernetes troubleshooting.
Monitoring Kubernetes Pods:
- Individual pod monitoring is essential for deeper insights in Kubernetes troubleshooting.
- Provides detailed health assessment beyond cluster level.
- Key focus areas for monitoring pods:
- Pod deployment patterns:
Distribution across nodes, resource allocation. - Total pod instances:
Balance between high availability and resource efficiency. - Expected vs. actual pod instances:
Identify misconfigurations or resource shortages.
- Pod deployment patterns:
- Monitoring helps maintain proper pod deployment and availability.
Monitoring Applications in Kubernetes:
- Application monitoring is crucial for hosted apps. Focus on key aspects:
- Application availability:
Ensure apps are up and responsive. - Application responsiveness:
Measure response times under various loads. - Transaction traces:
Troubleshoot performance or availability issues. - Errors:
Swiftly address application errors to prevent user impact.
- Application availability:
- Monitoring ensures optimal application performance and user experience.
Tools for Kubernetes Monitoring:
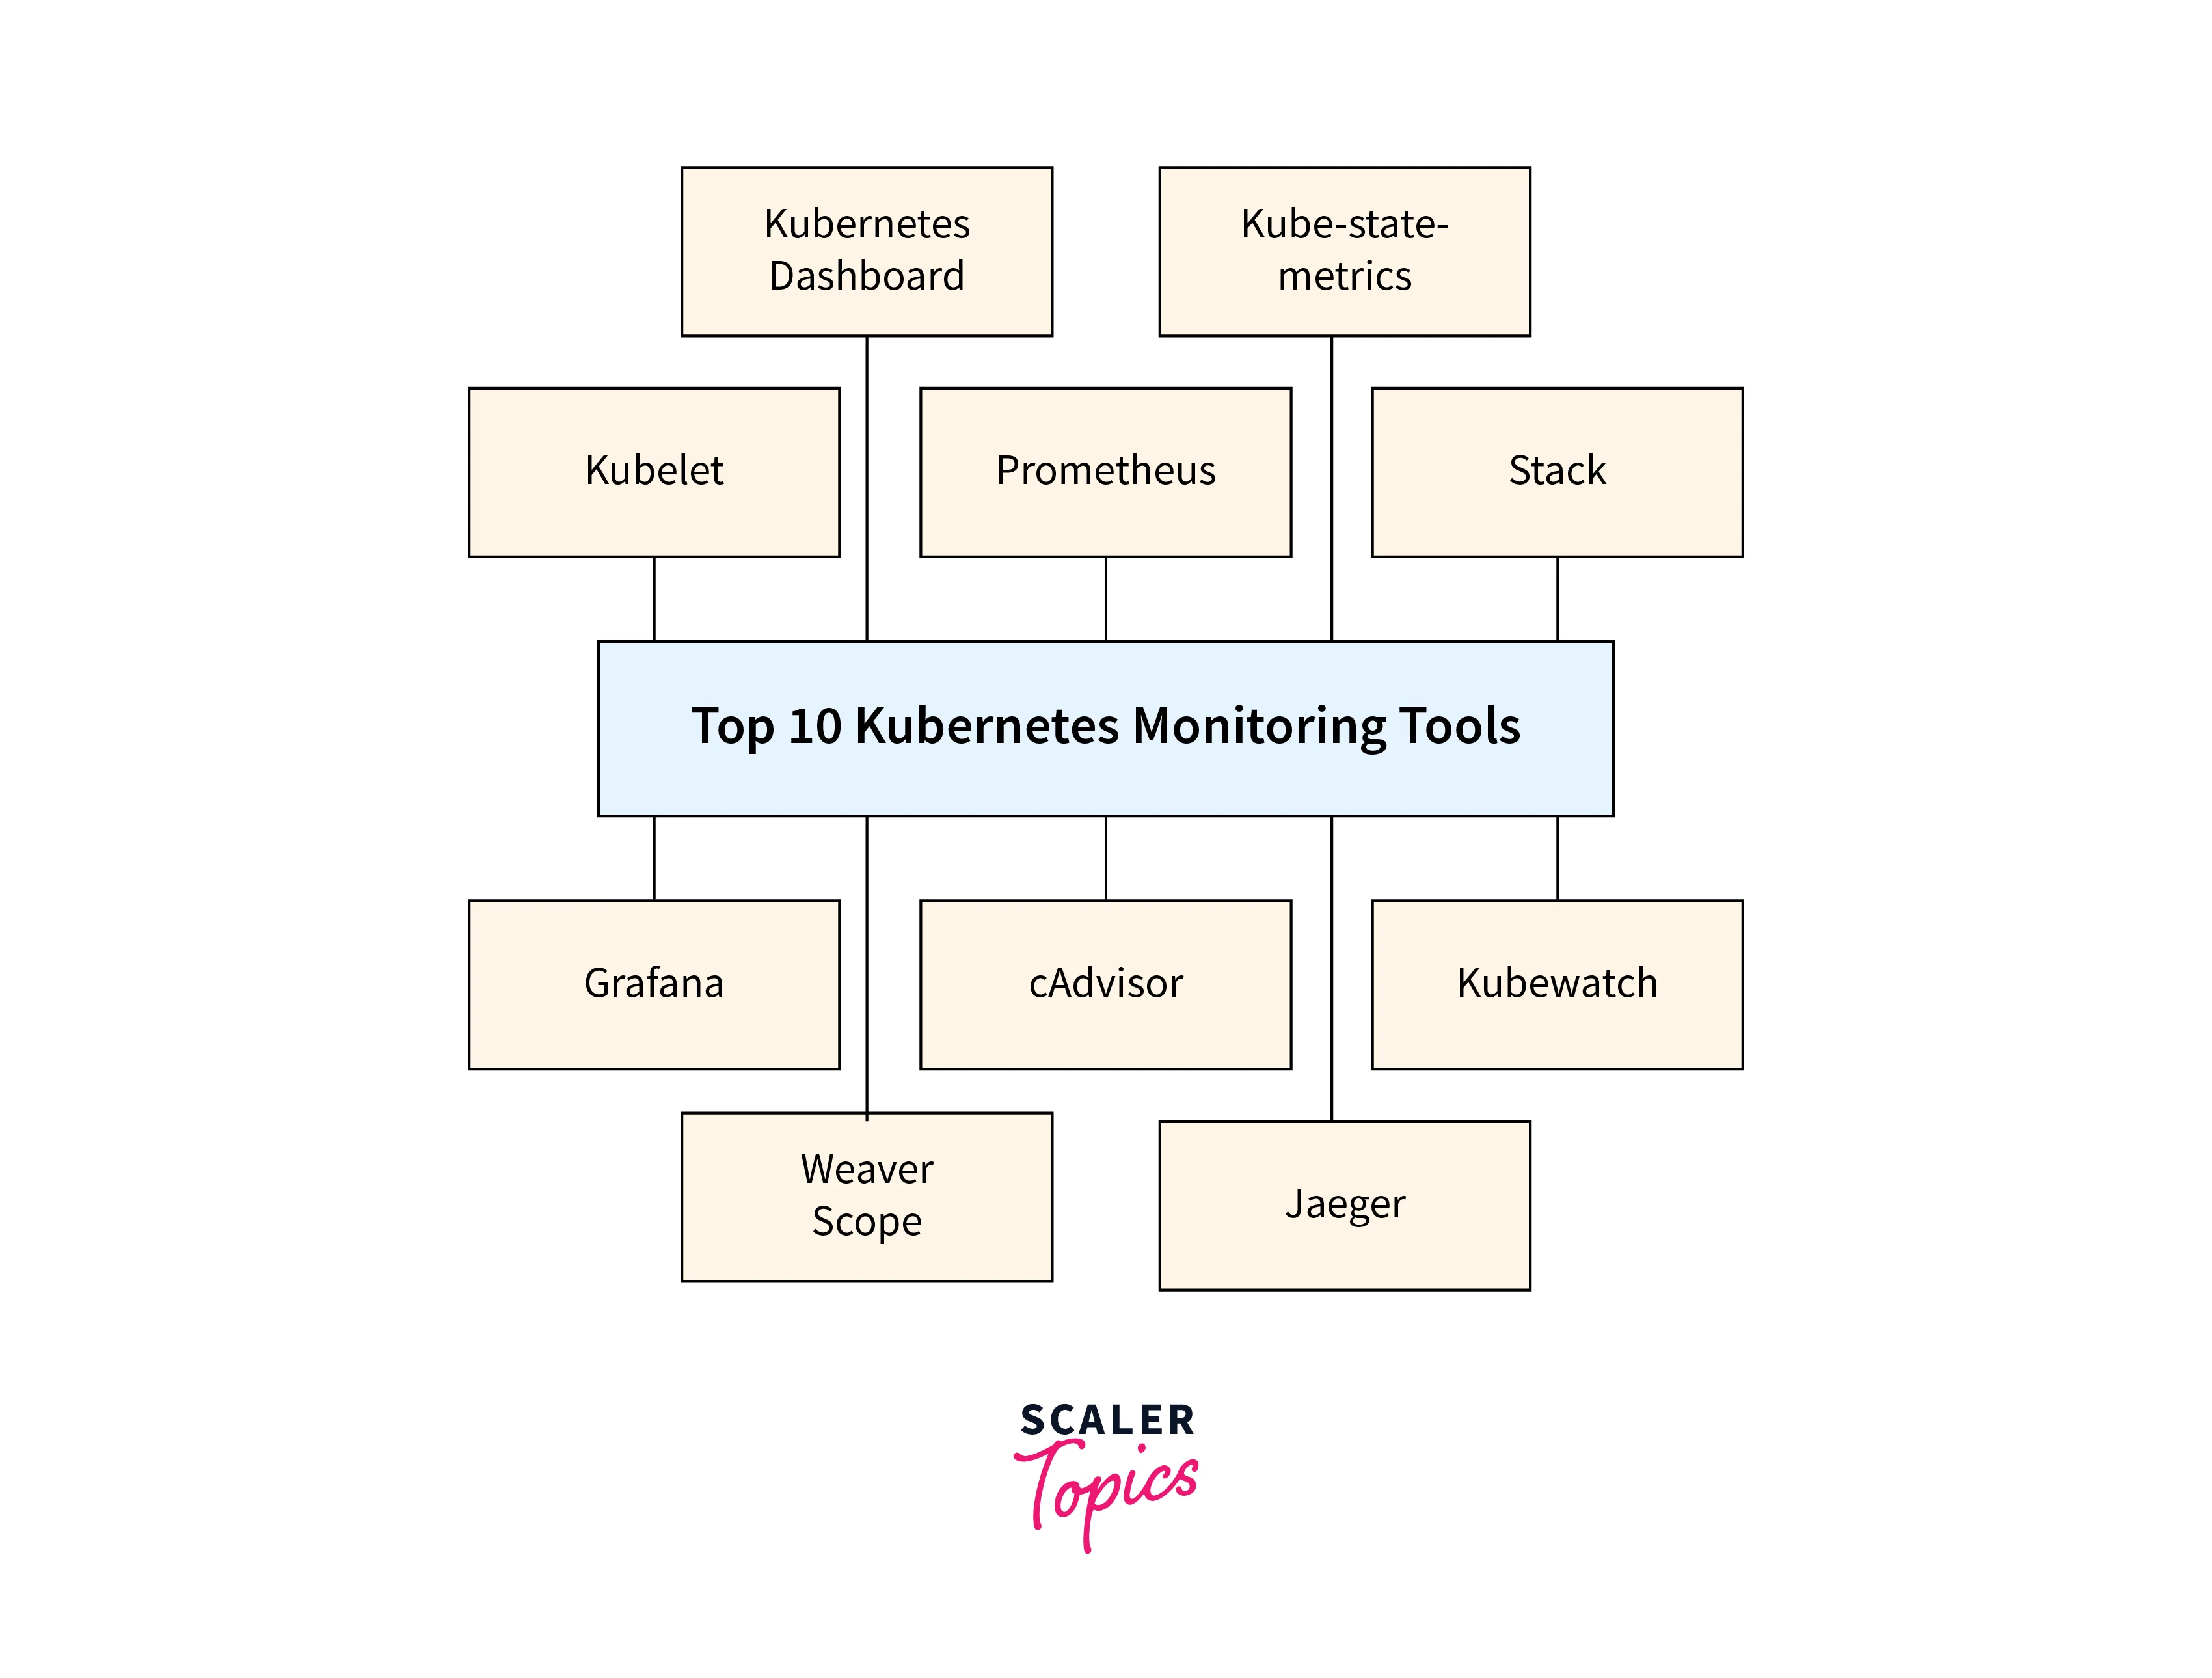
- Prometheus
- Kubelet
- Grafana
- Container Advisor (cAdvisor)
- Kube-state-metrics
- Kubewatch
- The ELK Stack
- Jaeger
- Kubernetes Dashboard
- Weave Scope
kubectl Troubleshooting Commands
To effectively use kubectl, it's crucial to understand the structure of commands in the CLI, which involves keeping each component in order.
- Command :
The command section outlines the operations to be performed, including create, describe, get, apply, and delete. These commands can be performed on one or multiple resources, as they can be designated within a single command. - Type :
The Type attribute identifies the resources kubectl is targeting, including pods, services, daemonsets, deployments, replicasets, statefulsets, Kubernetes jobs, and cron jobs, which significantly impact deployment behavior. - Name:
The Name field, case-sensitive, specifies the name of resource, limiting a command to that resource, while omitting it will retrieve information from all resources. - Flags:
Flags are modifiers that override default values or environmental variables, indicating special options or requests made to a resource.
Retrieve Details on Your Nodes
Nodes are virtual or physical worker machines in Kubernetes, governed by the control plane. Understanding their status, readiness, and age can reveal deployment age. Kubernetes supports up to 5,000 nodes per cluster, and using different combinations optimizes system performance.To obtain a node's overall status, use the command:
This retrieves the name, state (running, ready, inactive), roles (master, worker, controlplane, and so on), age, and Kubernetes version of each node.
Leverage your files to configure Kubernetes
Kubernetes allows some changes through commands, but others require external configuration files. While STDIN can be used, Kubernetes recommends using JSON or YAML files for these configurations. The command to modify resources in a config file is:
List all running pods in a namespace
Pods are Kubernetes' smallest computing units, containing one running process in a cluster. They are deleted when no longer needed or when a process is completed. Tracking running pods helps understand active processes and potentially uncover active services.Use this command:
Debugging Pods and Containers
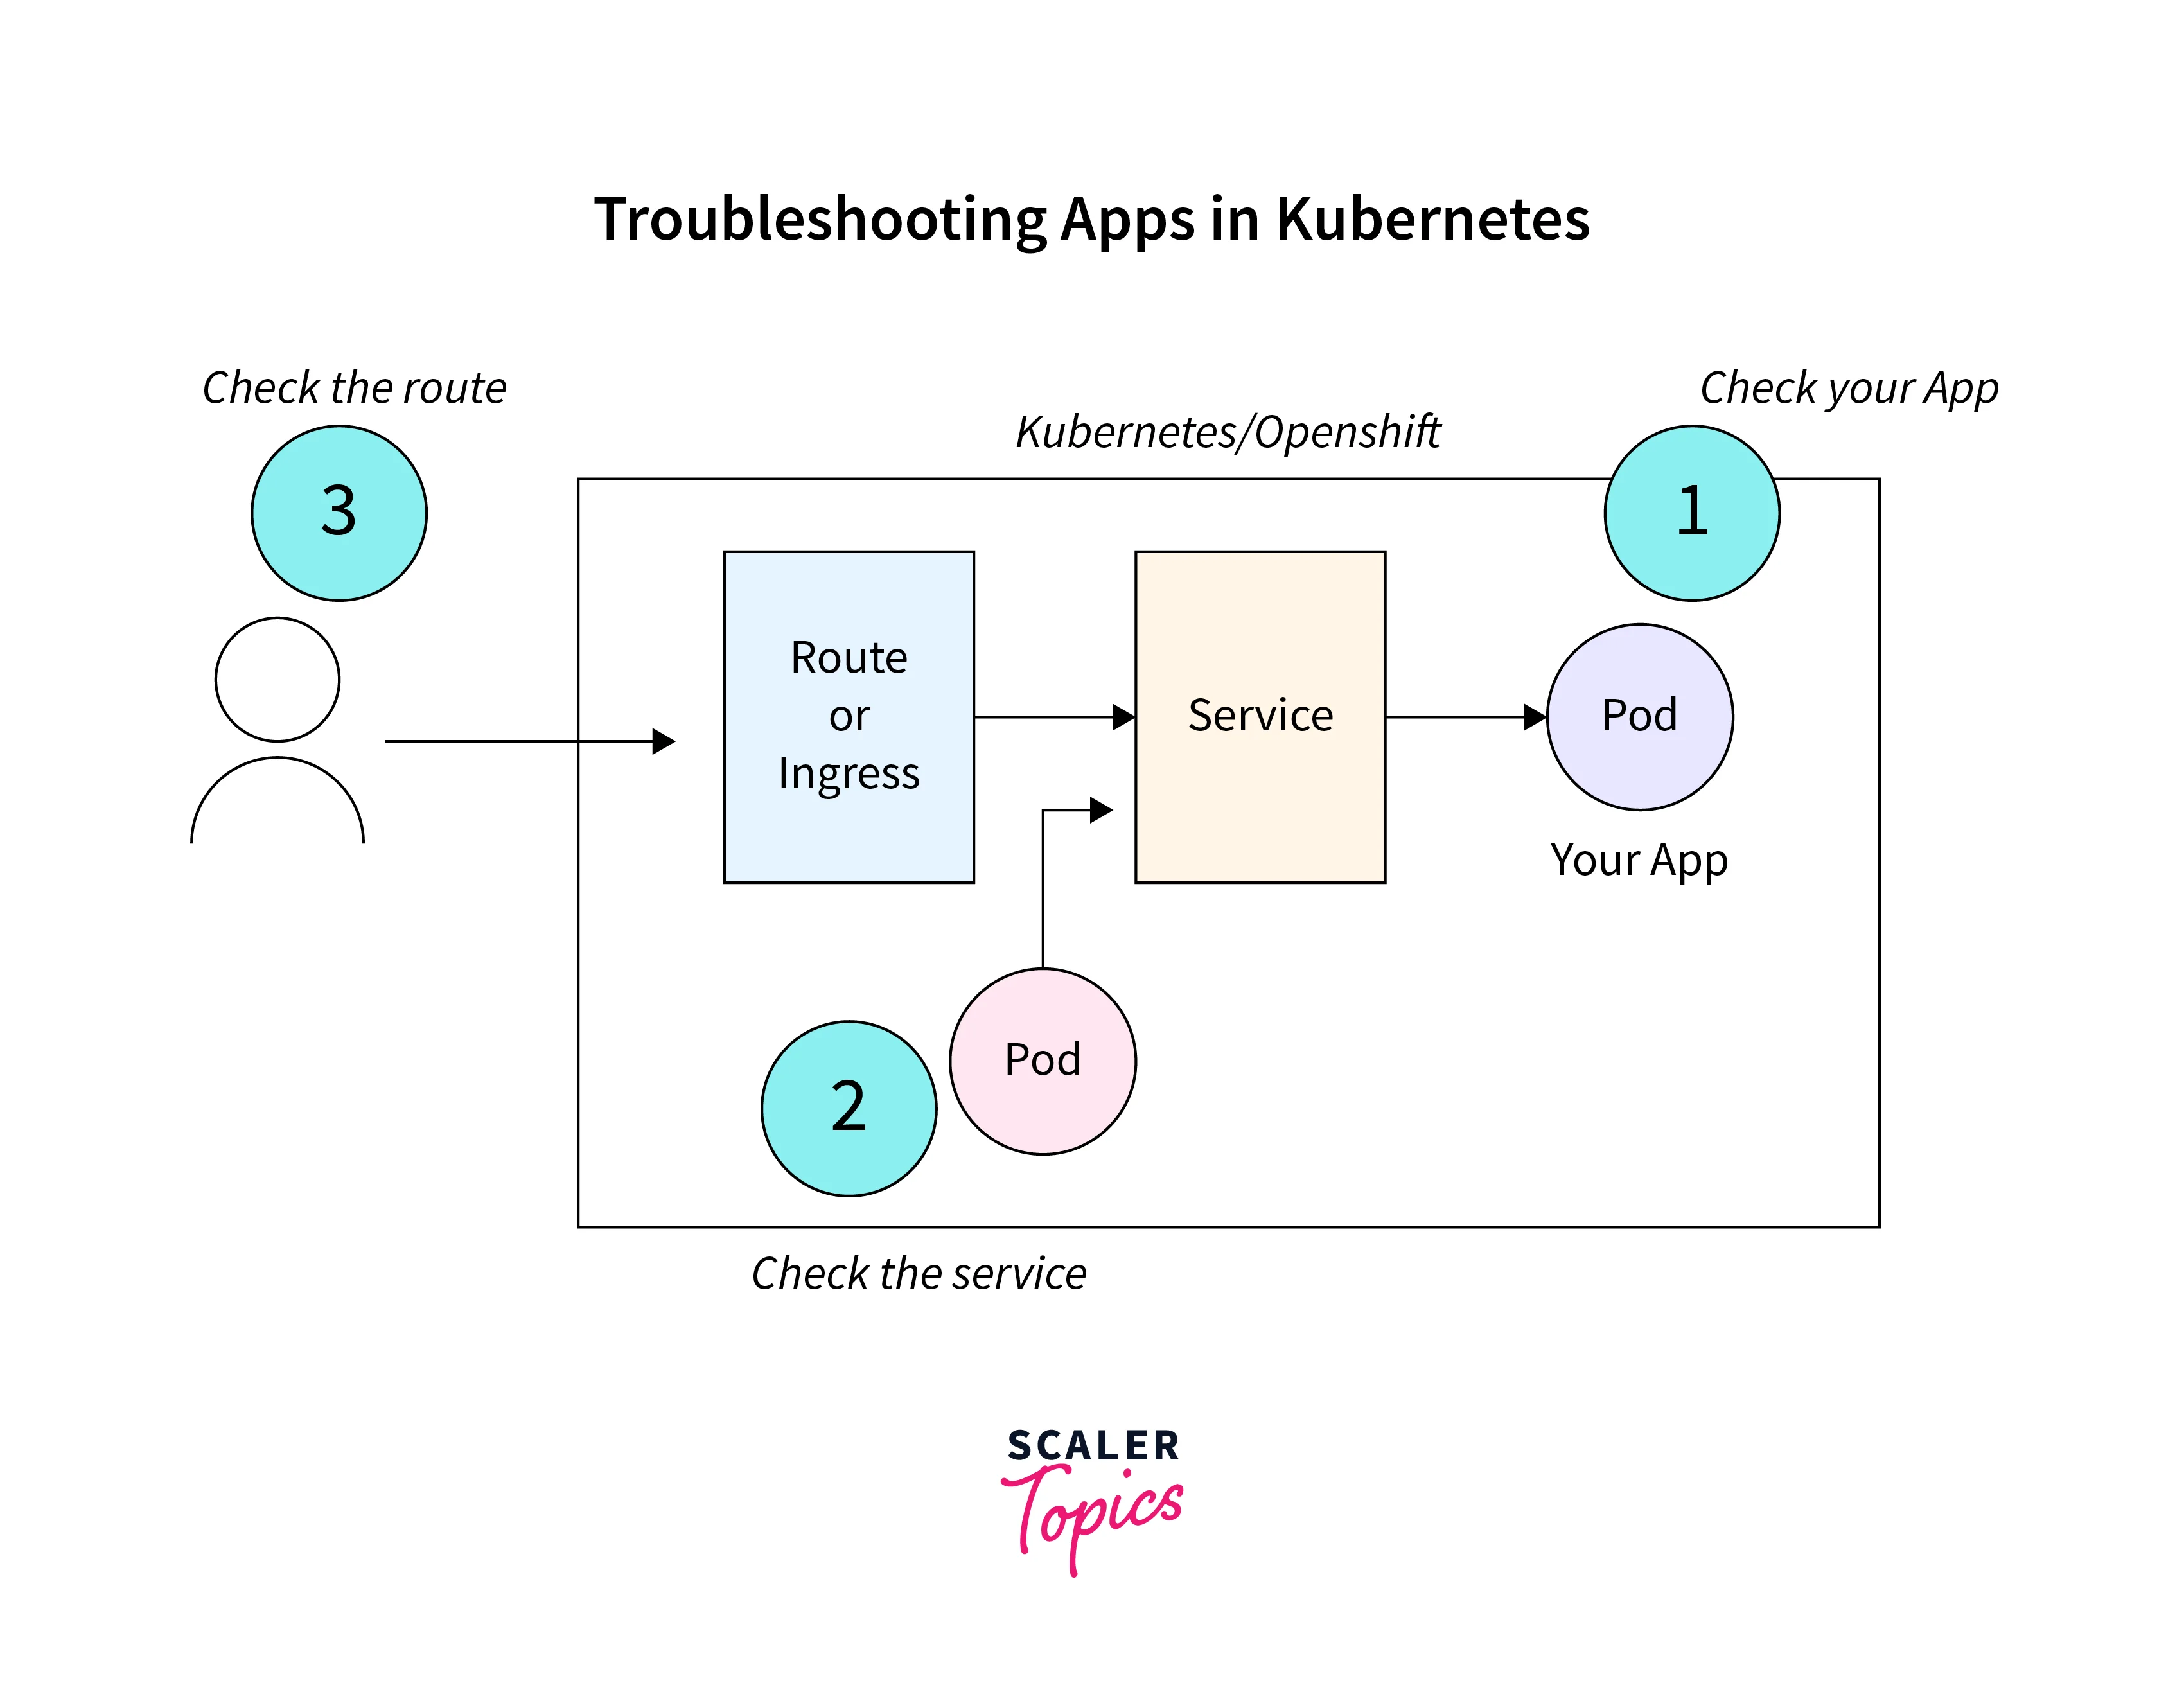
In Kubernetes troubleshooting ,Troubleshooting a failed Kubernetes deployment involves debugging each component in a sequence, starting from the bottom, to ensure a smooth and efficient operation.
You should first ensure that your Pods are operational, then focus on getting the Service to route traffic to the Pods, and last ensure that the Ingress is properly set.
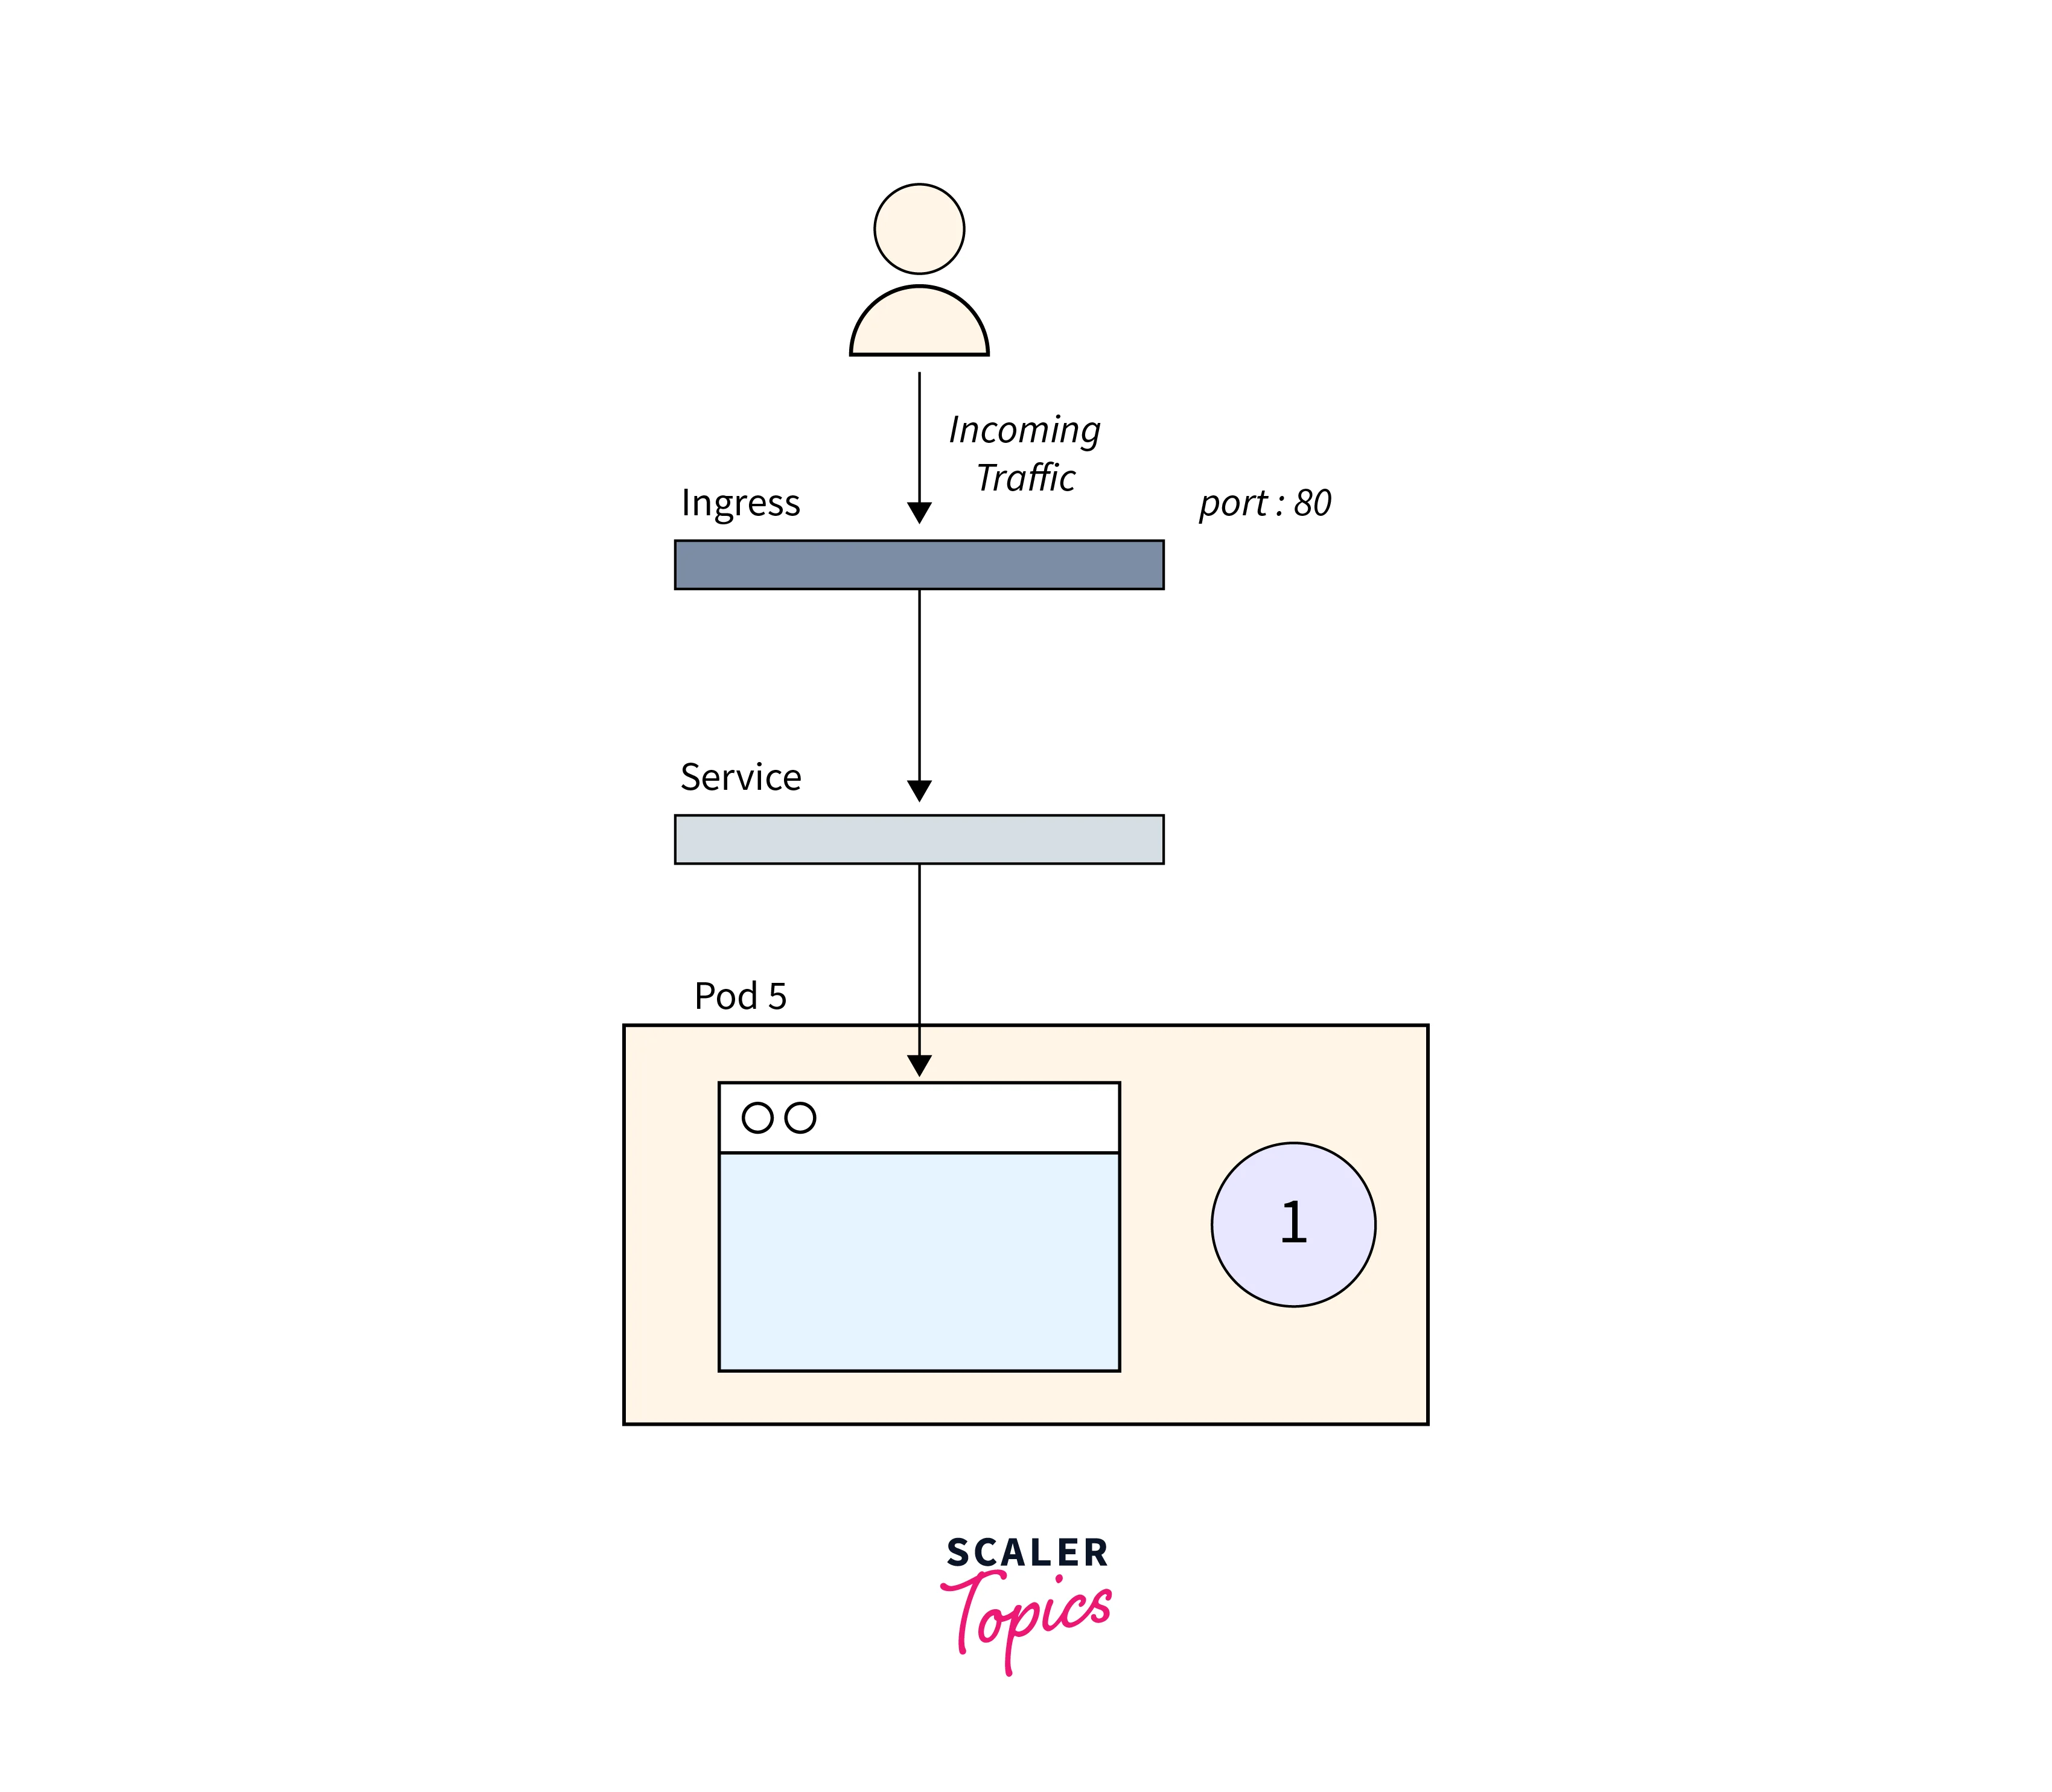
1.Troubleshooting Pods
The problem is usually within the Pod itself. You should ensure that your Pods are operational and ready. How do you verify that?
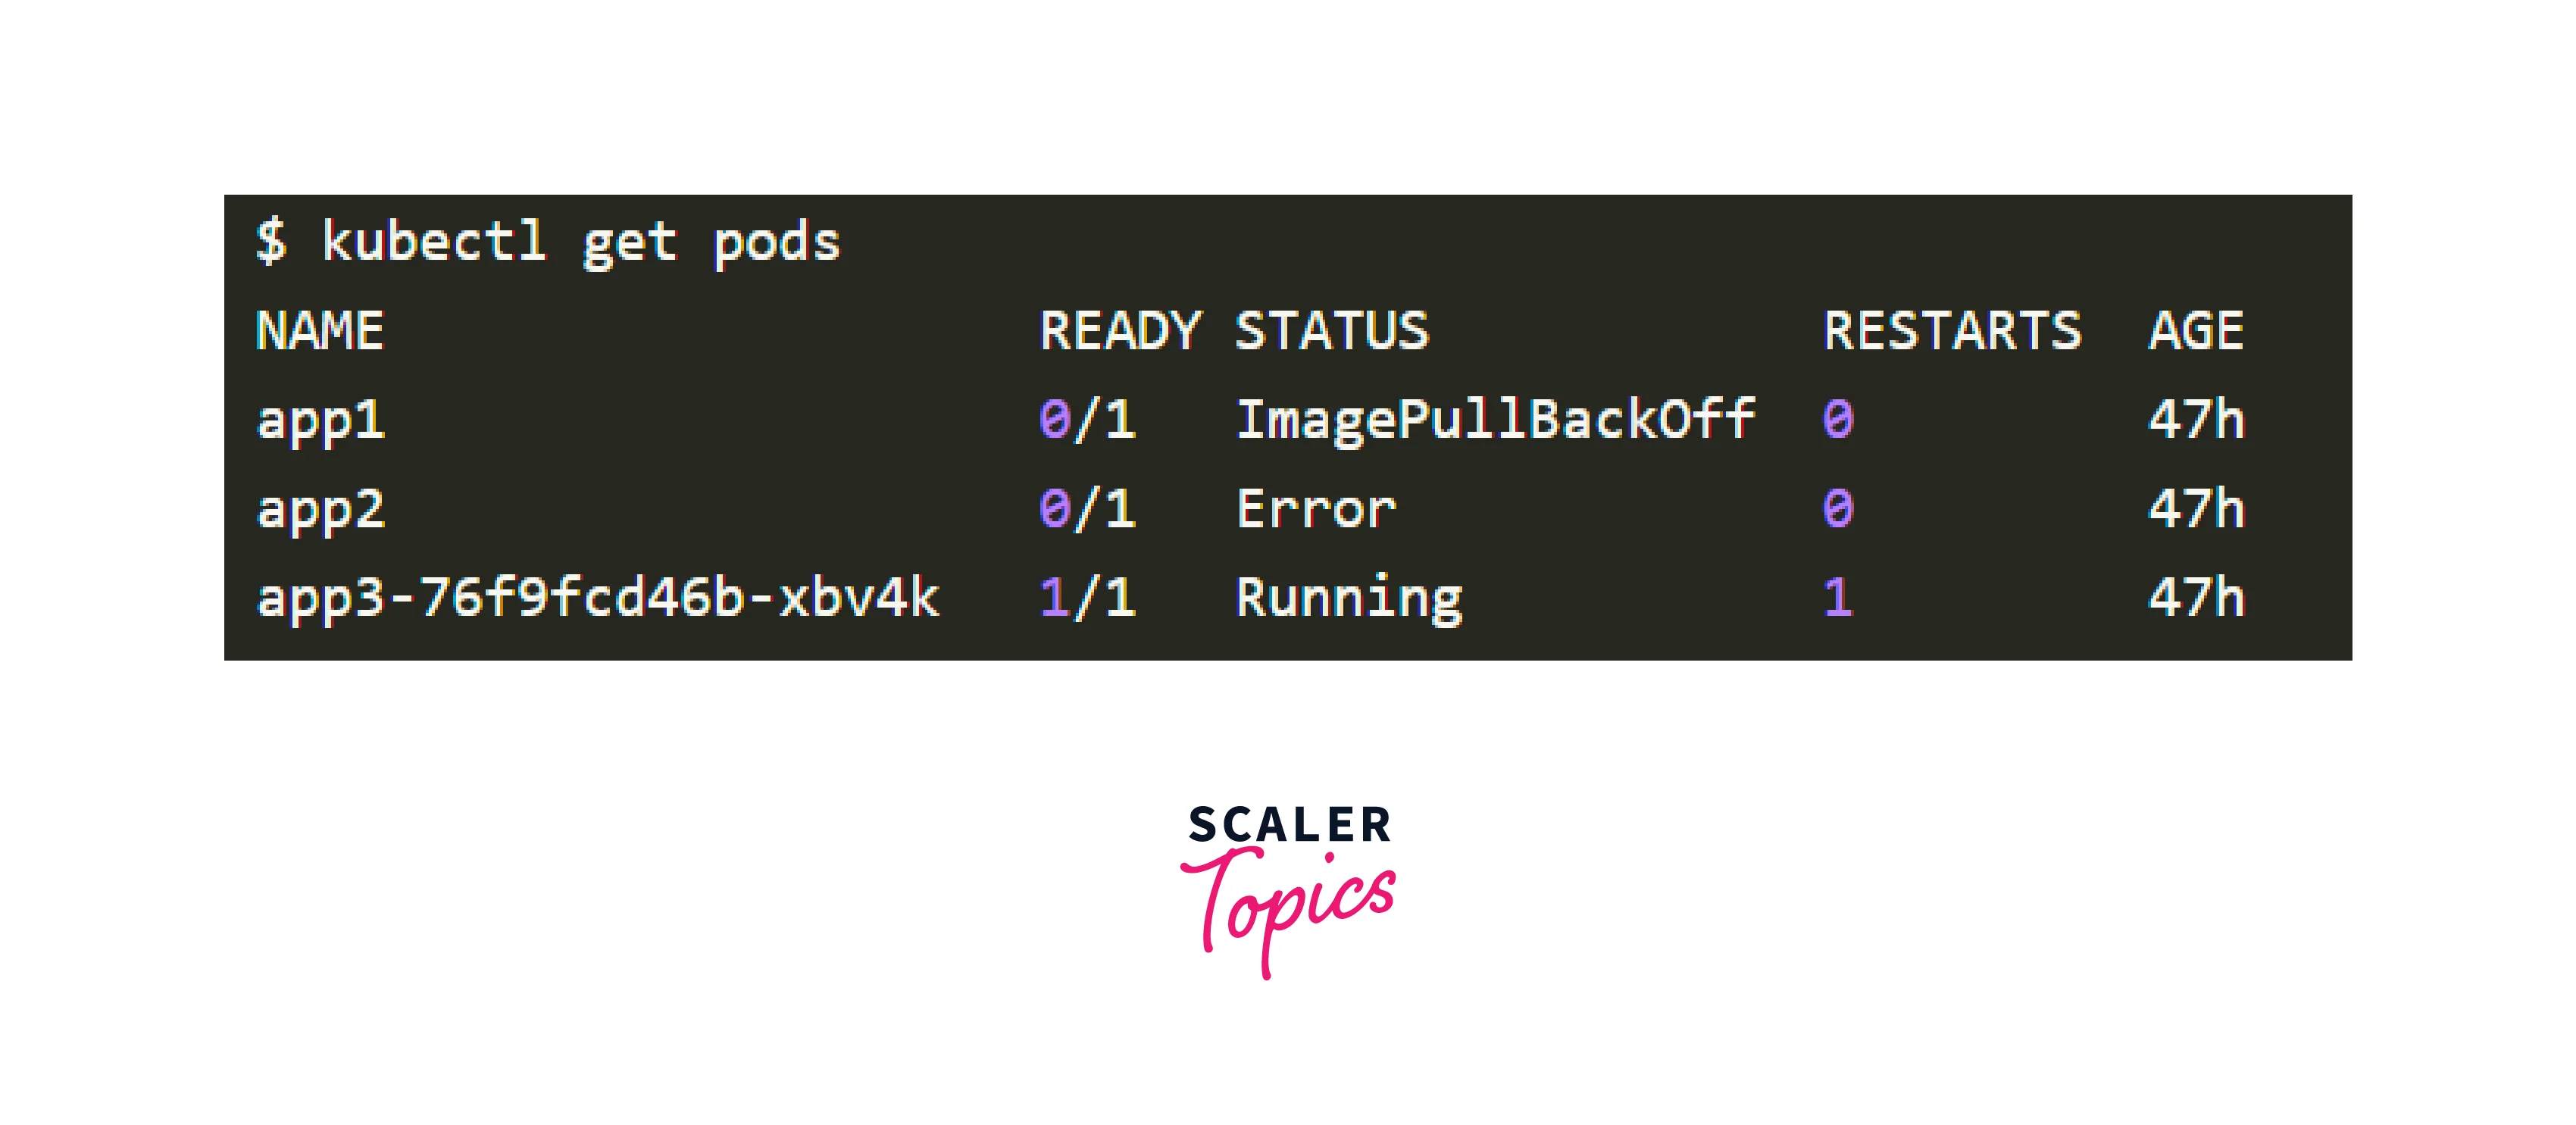
The final Pod in the output above is Running and Ready, but the first two Pods are neither Running nor Ready.
To troubleshoot Pods, use the following commands:
- kubectl logs used to access the logs of the Pod's containers.
- The kubectl describe pod command is used to receive a list of events related with the Pod.
- kubectl get pod is be used to retrieve the YAML definition of a Pod from Kubernetes.
- The kubectl exec -ti <pod name> -- bash it is handy to perform an interactive command within one of the Pod's containers.
2.Troubleshooting Services
If your Pods are running and ready but not receiving a response from your app, double-check the Service configuration to ensure it is targeting the correct number of Pods.
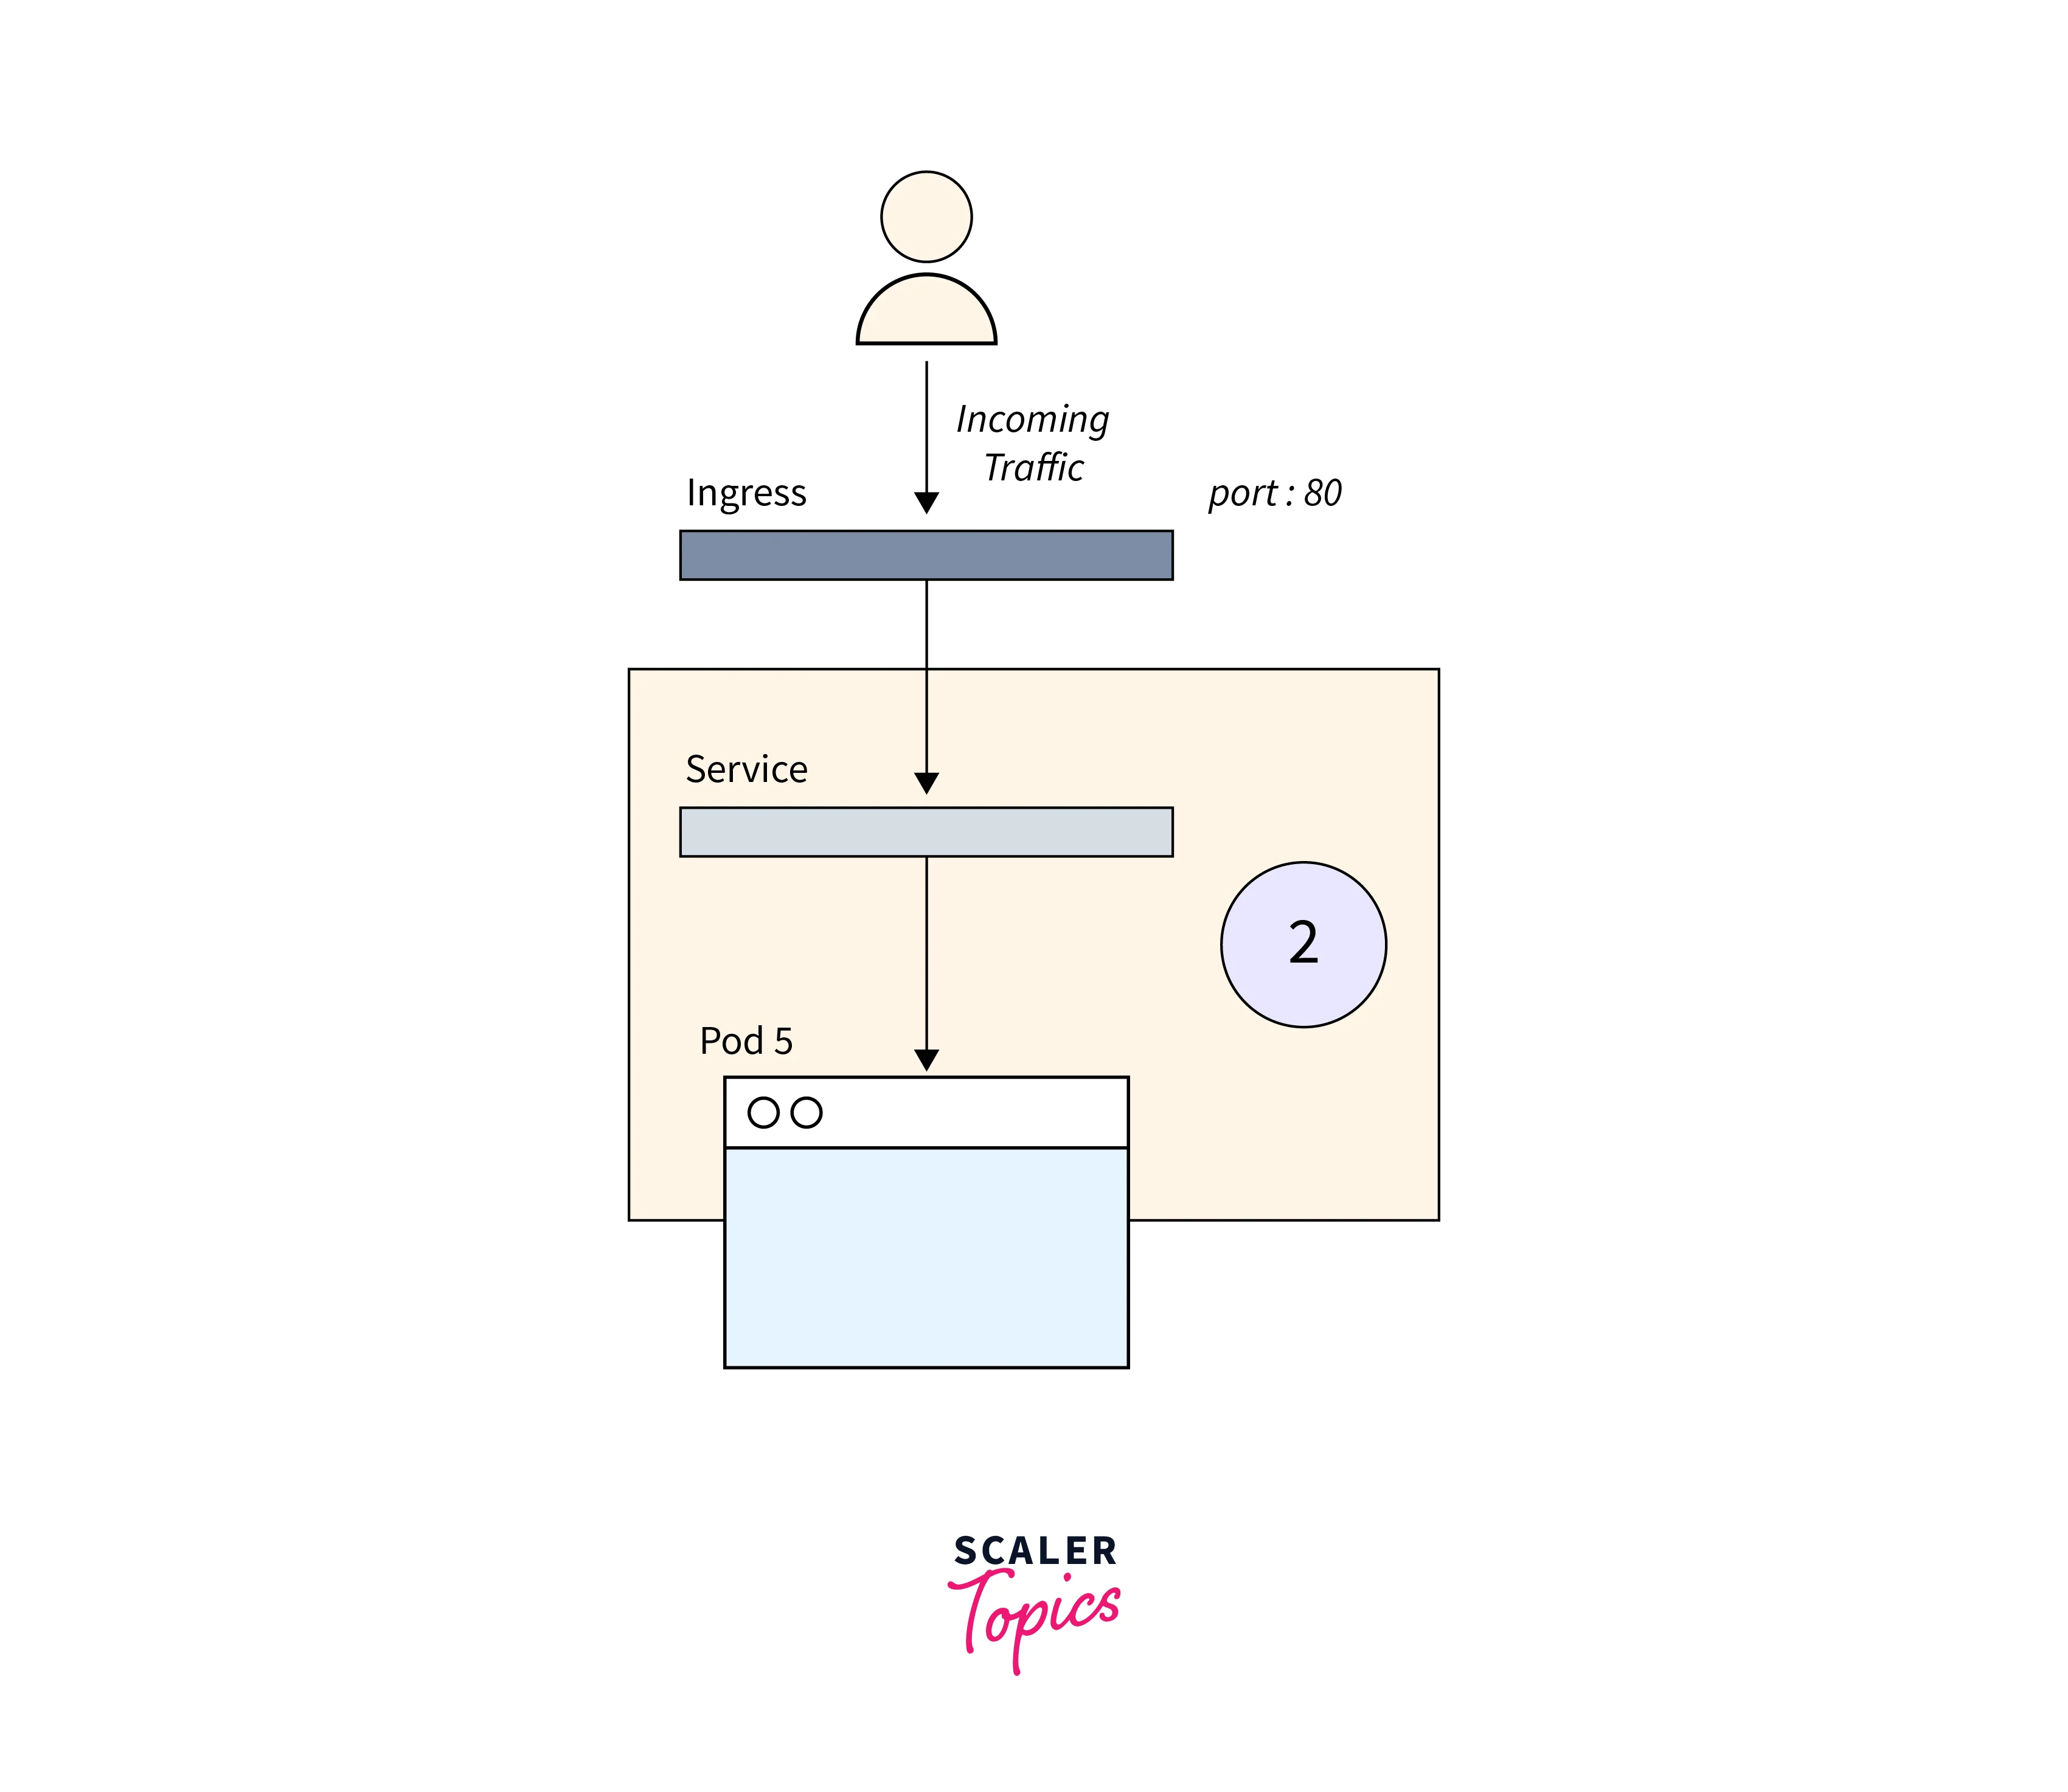
You may accomplish so by looking at the Endpoints in the Service:
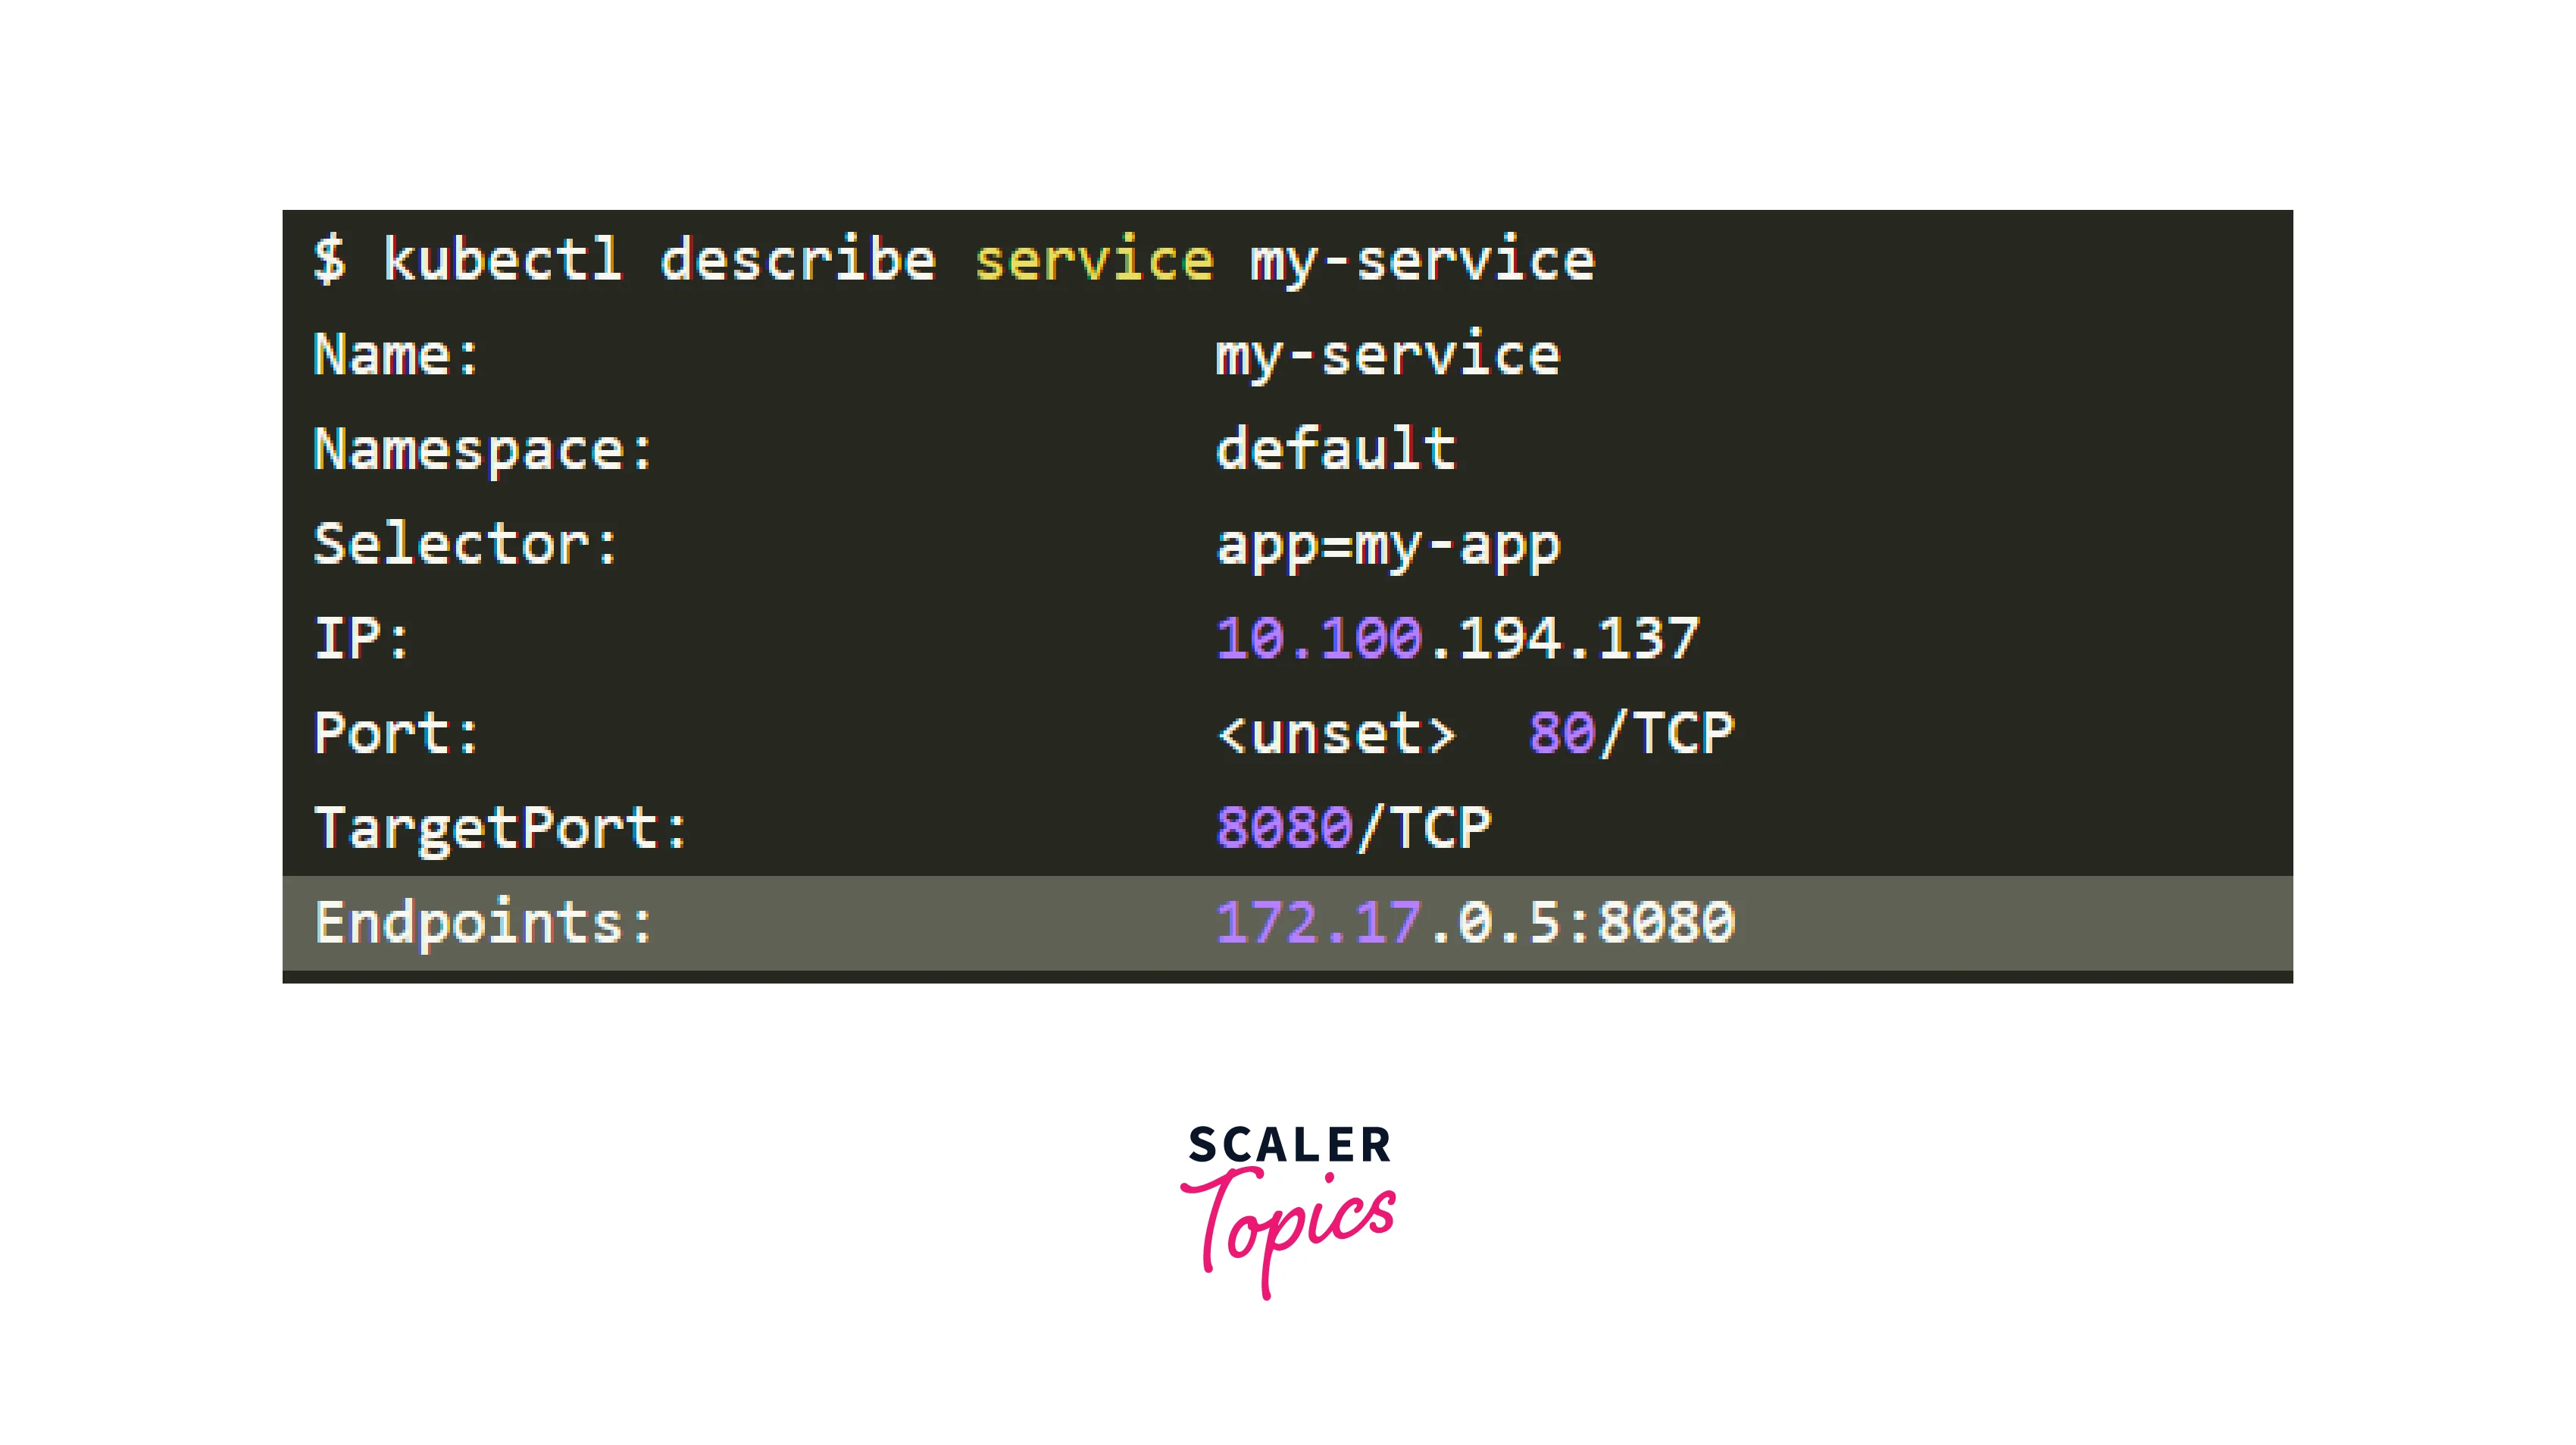
An endpoint is a pair of <ip address:port>, and there should be at least one when the Service targets (at least) a Pod.
If the "Endpoints" section is empty, there are two possibilities:
- You don't have any Pods running with the relevant label (hint: make sure you're in the right namespace).
- The Service's selector labels include a mistake.
If you see a list of endpoints but still can't access your application, the targetPort in your service is most likely to blame.
How do you put the Service to the test? To connect to any Service, use kubectl port-forward:
Where:
-
service-name :
name of the Service. -
3000 :
Port Number to be opened on the system. -
80 :
Port Number is exposed by the Service.
3.Troubleshooting Ingress.
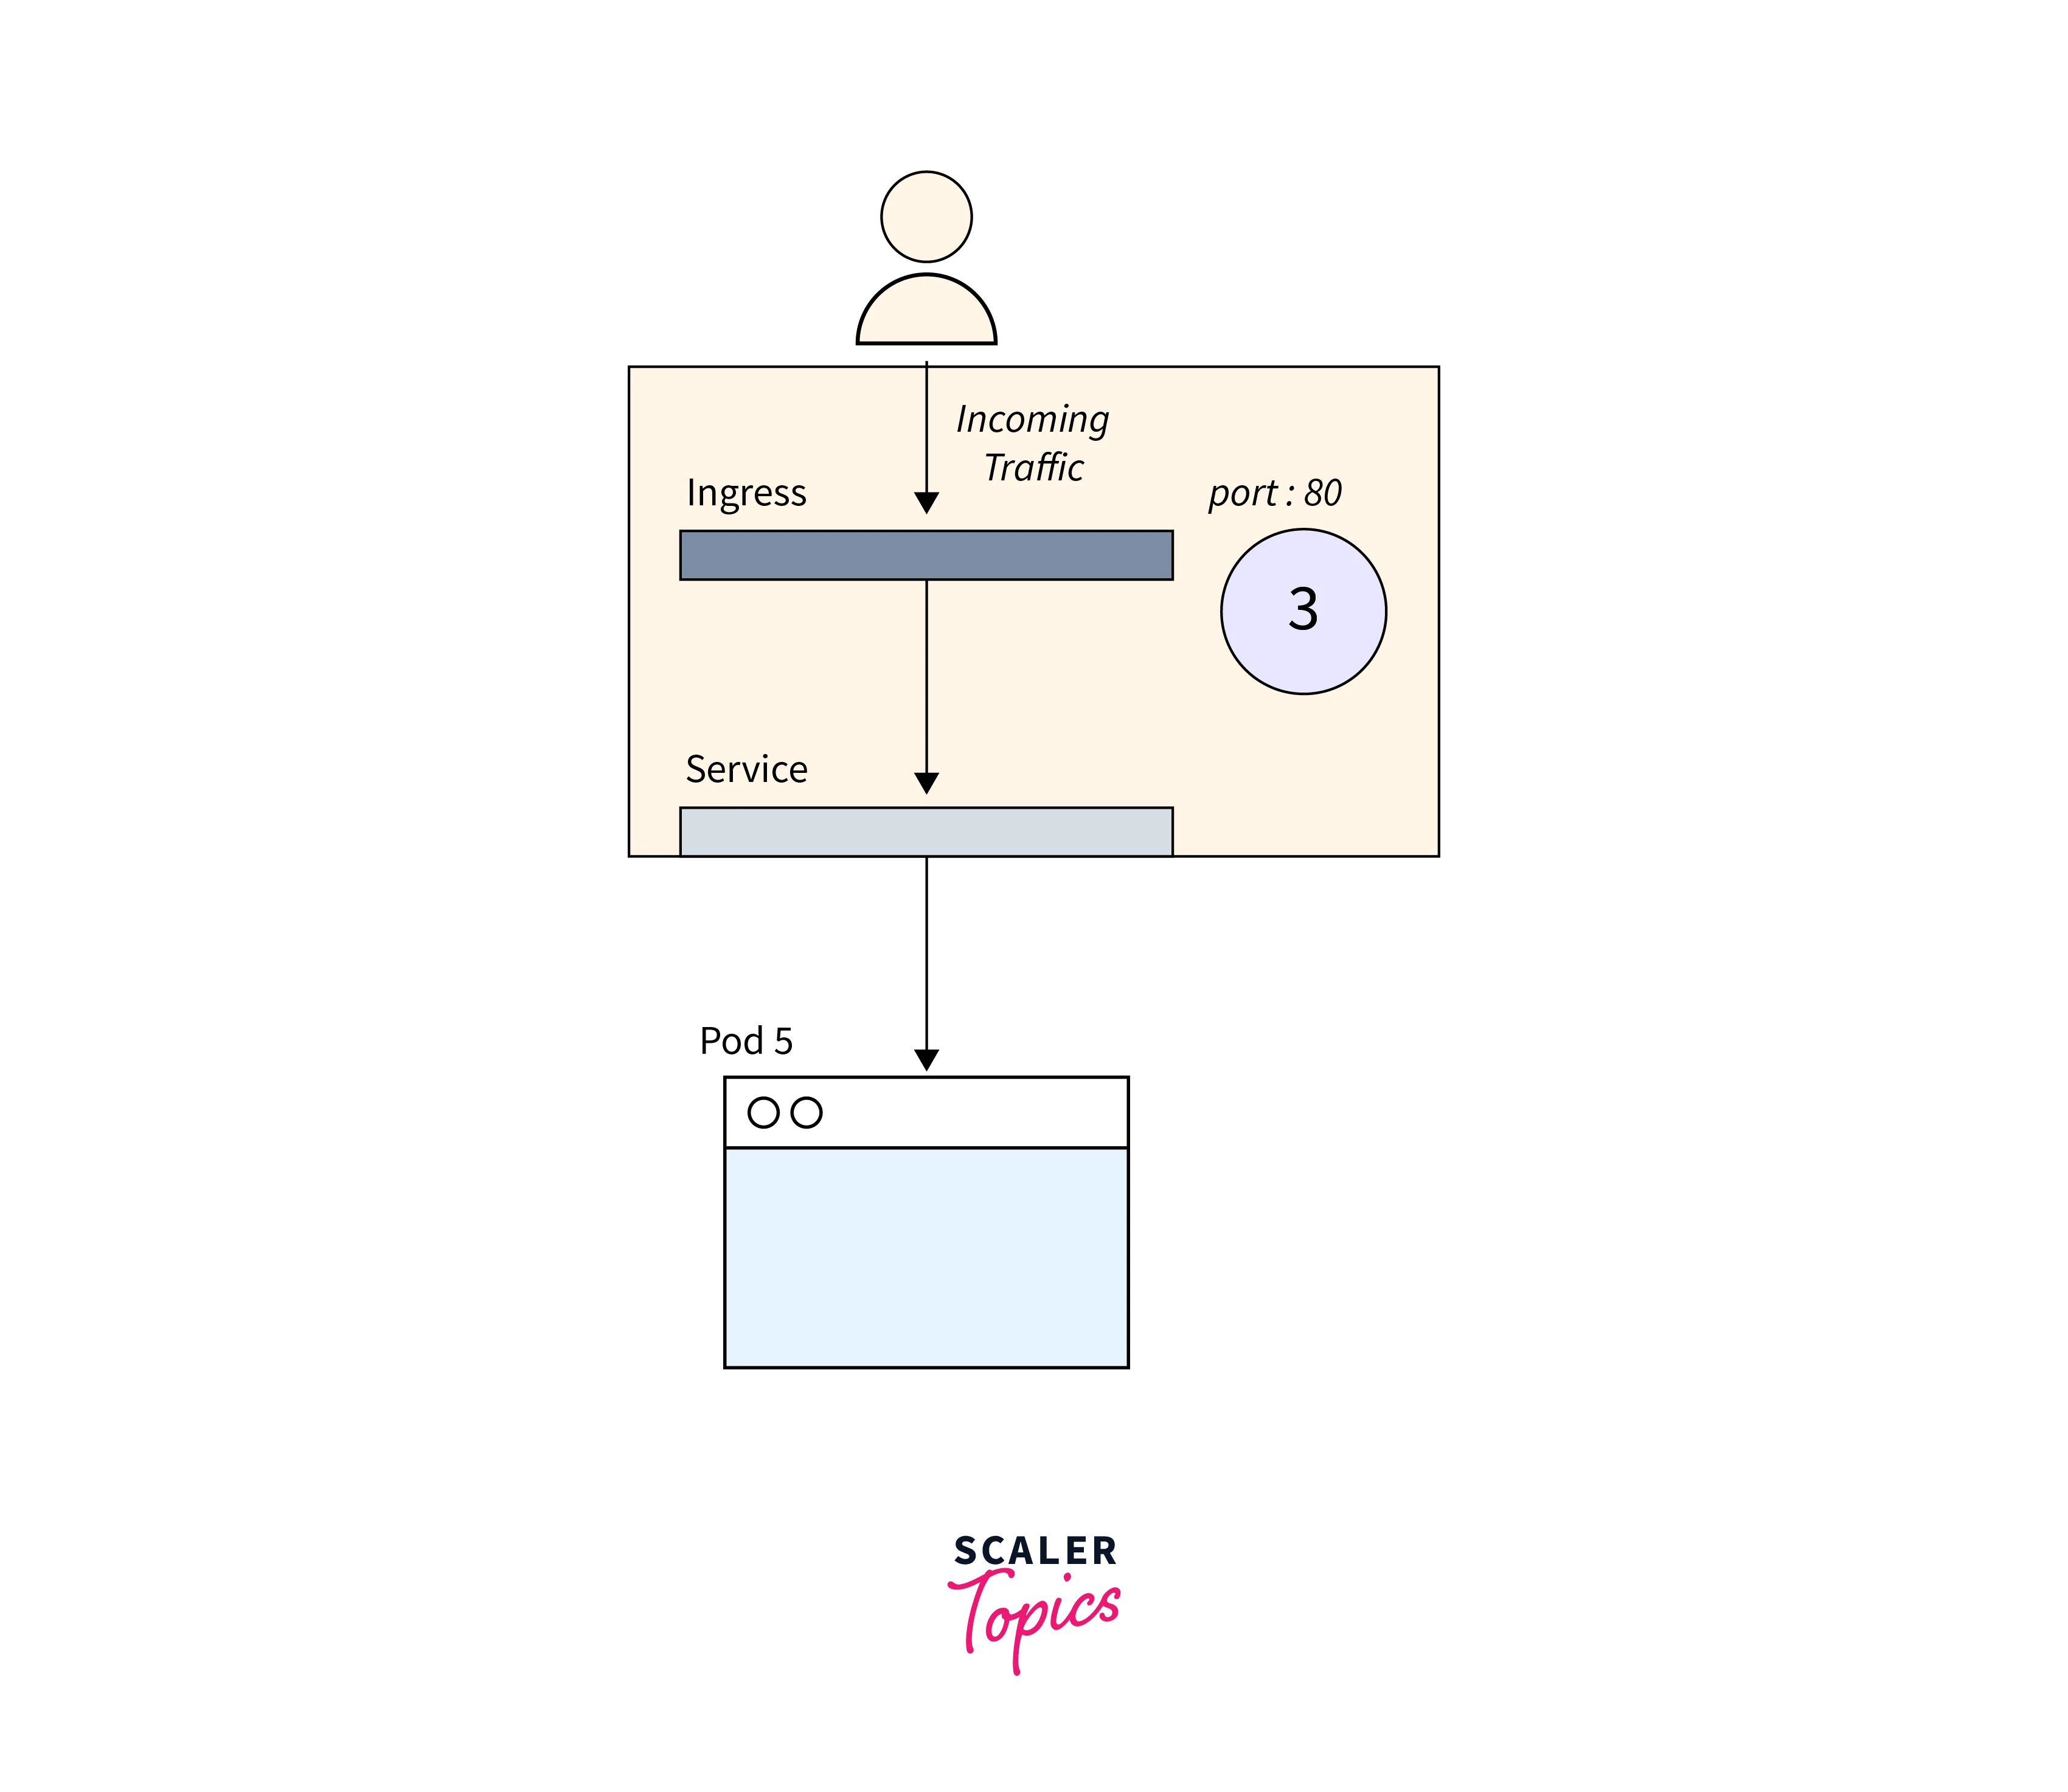
The Ingress controller, a third-party component in the cluster, differs in debugging processes based on its type. To connect to the service, use service.name and service.port.
You should double-check that they are properly setup.
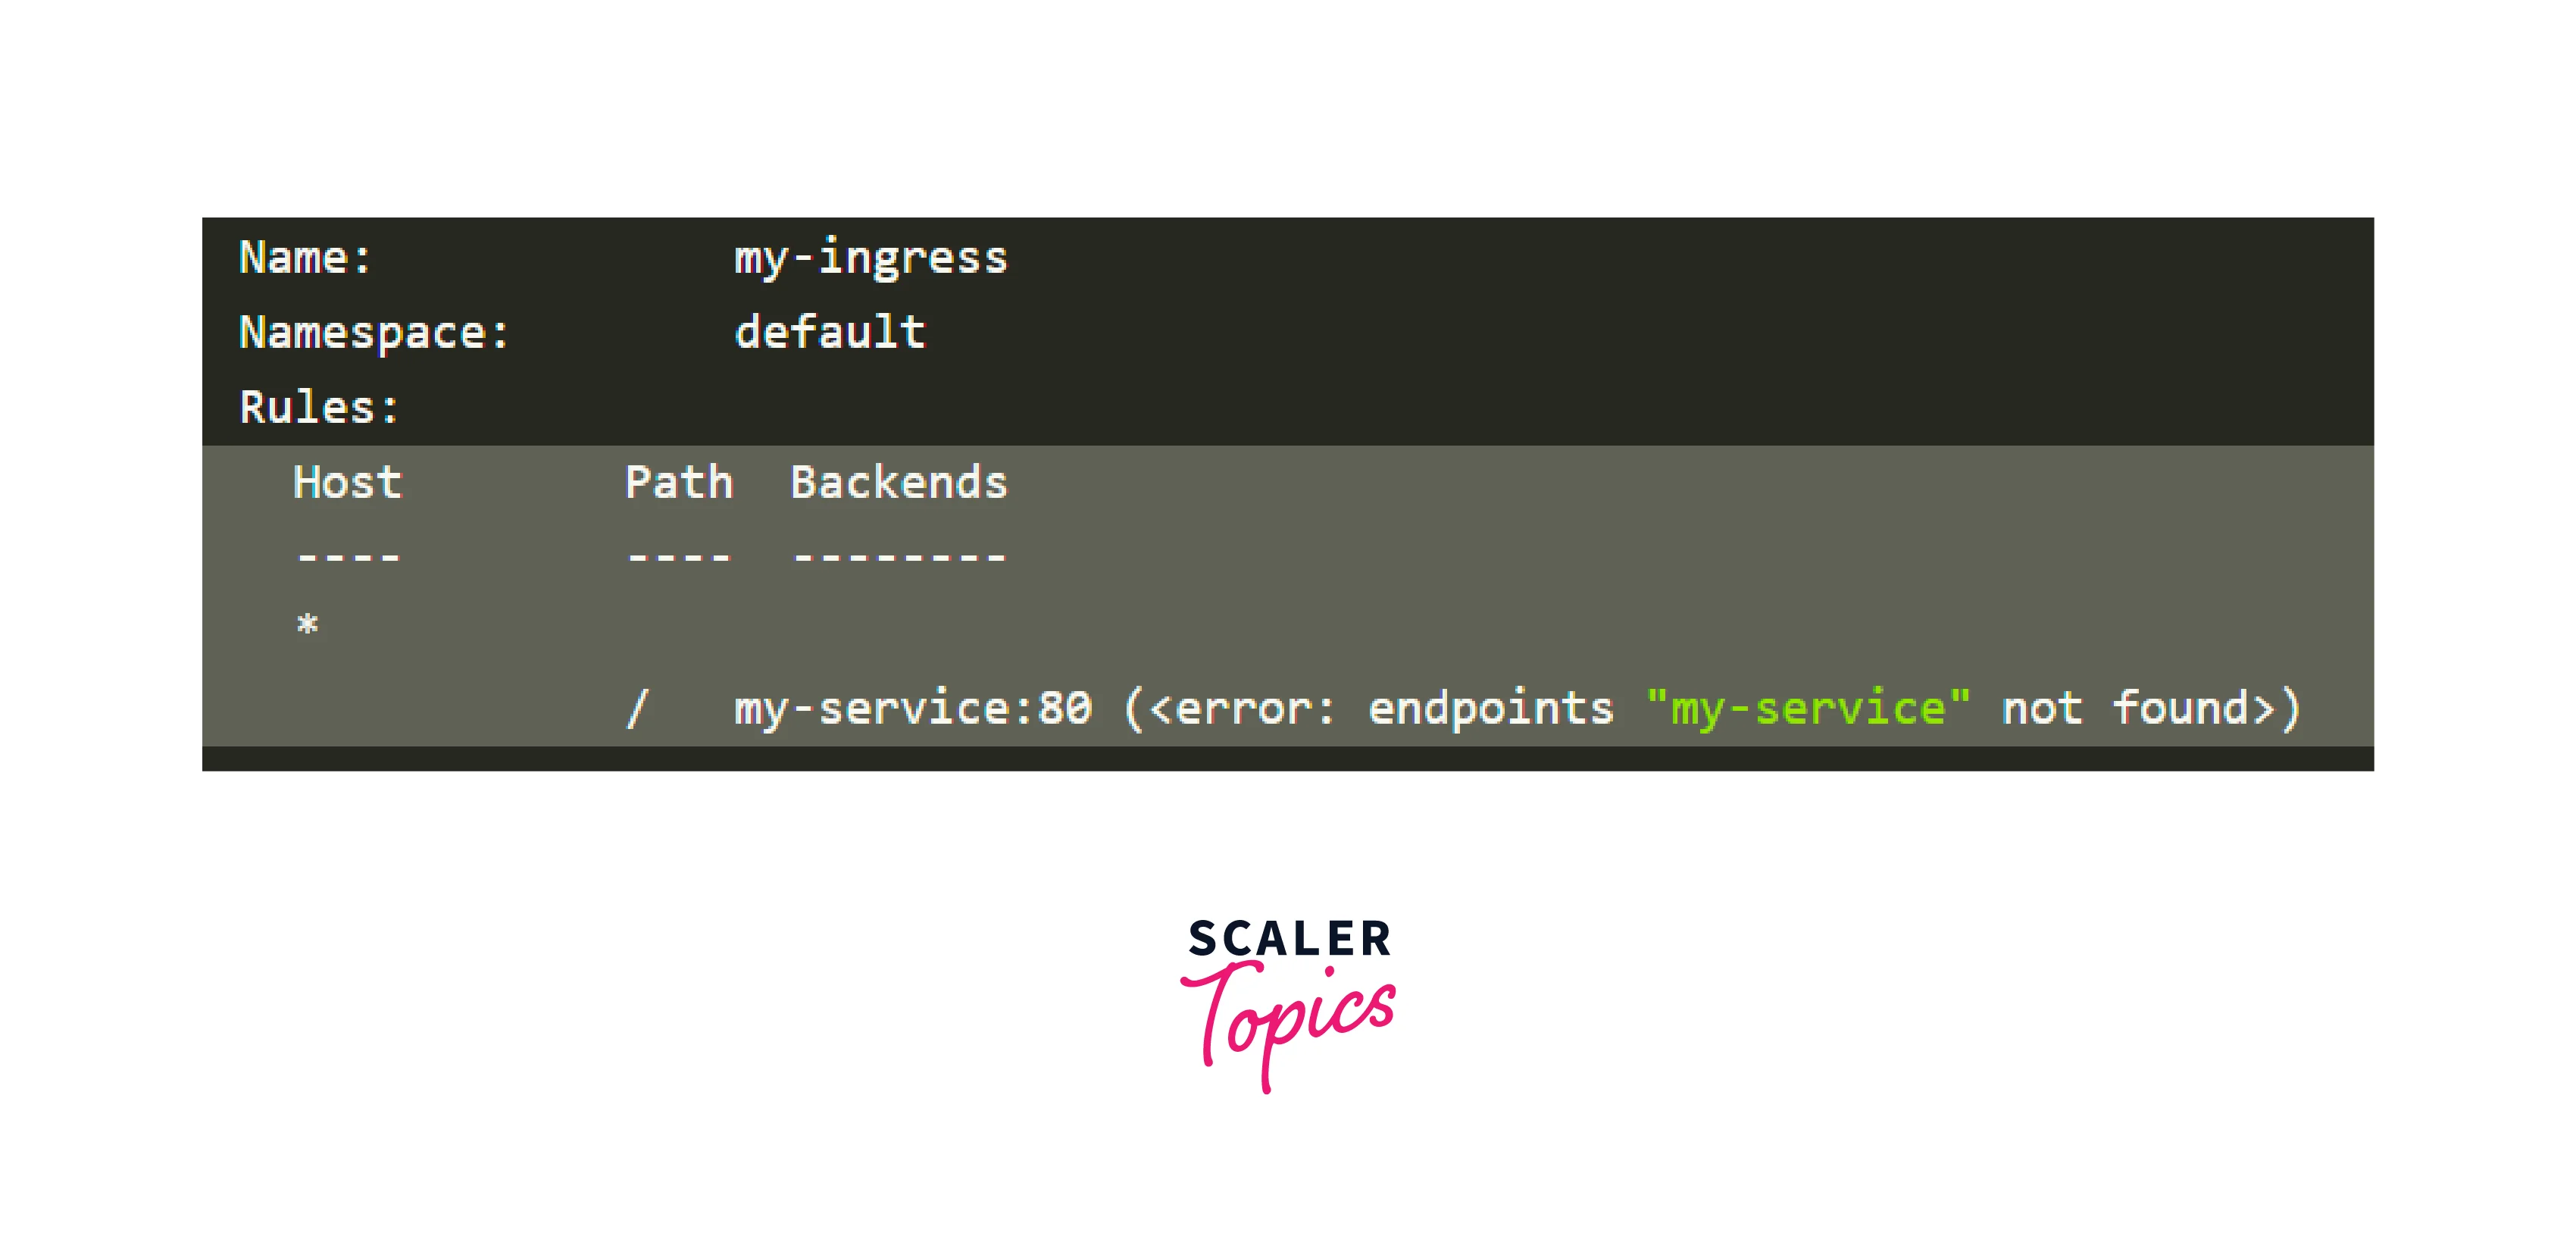
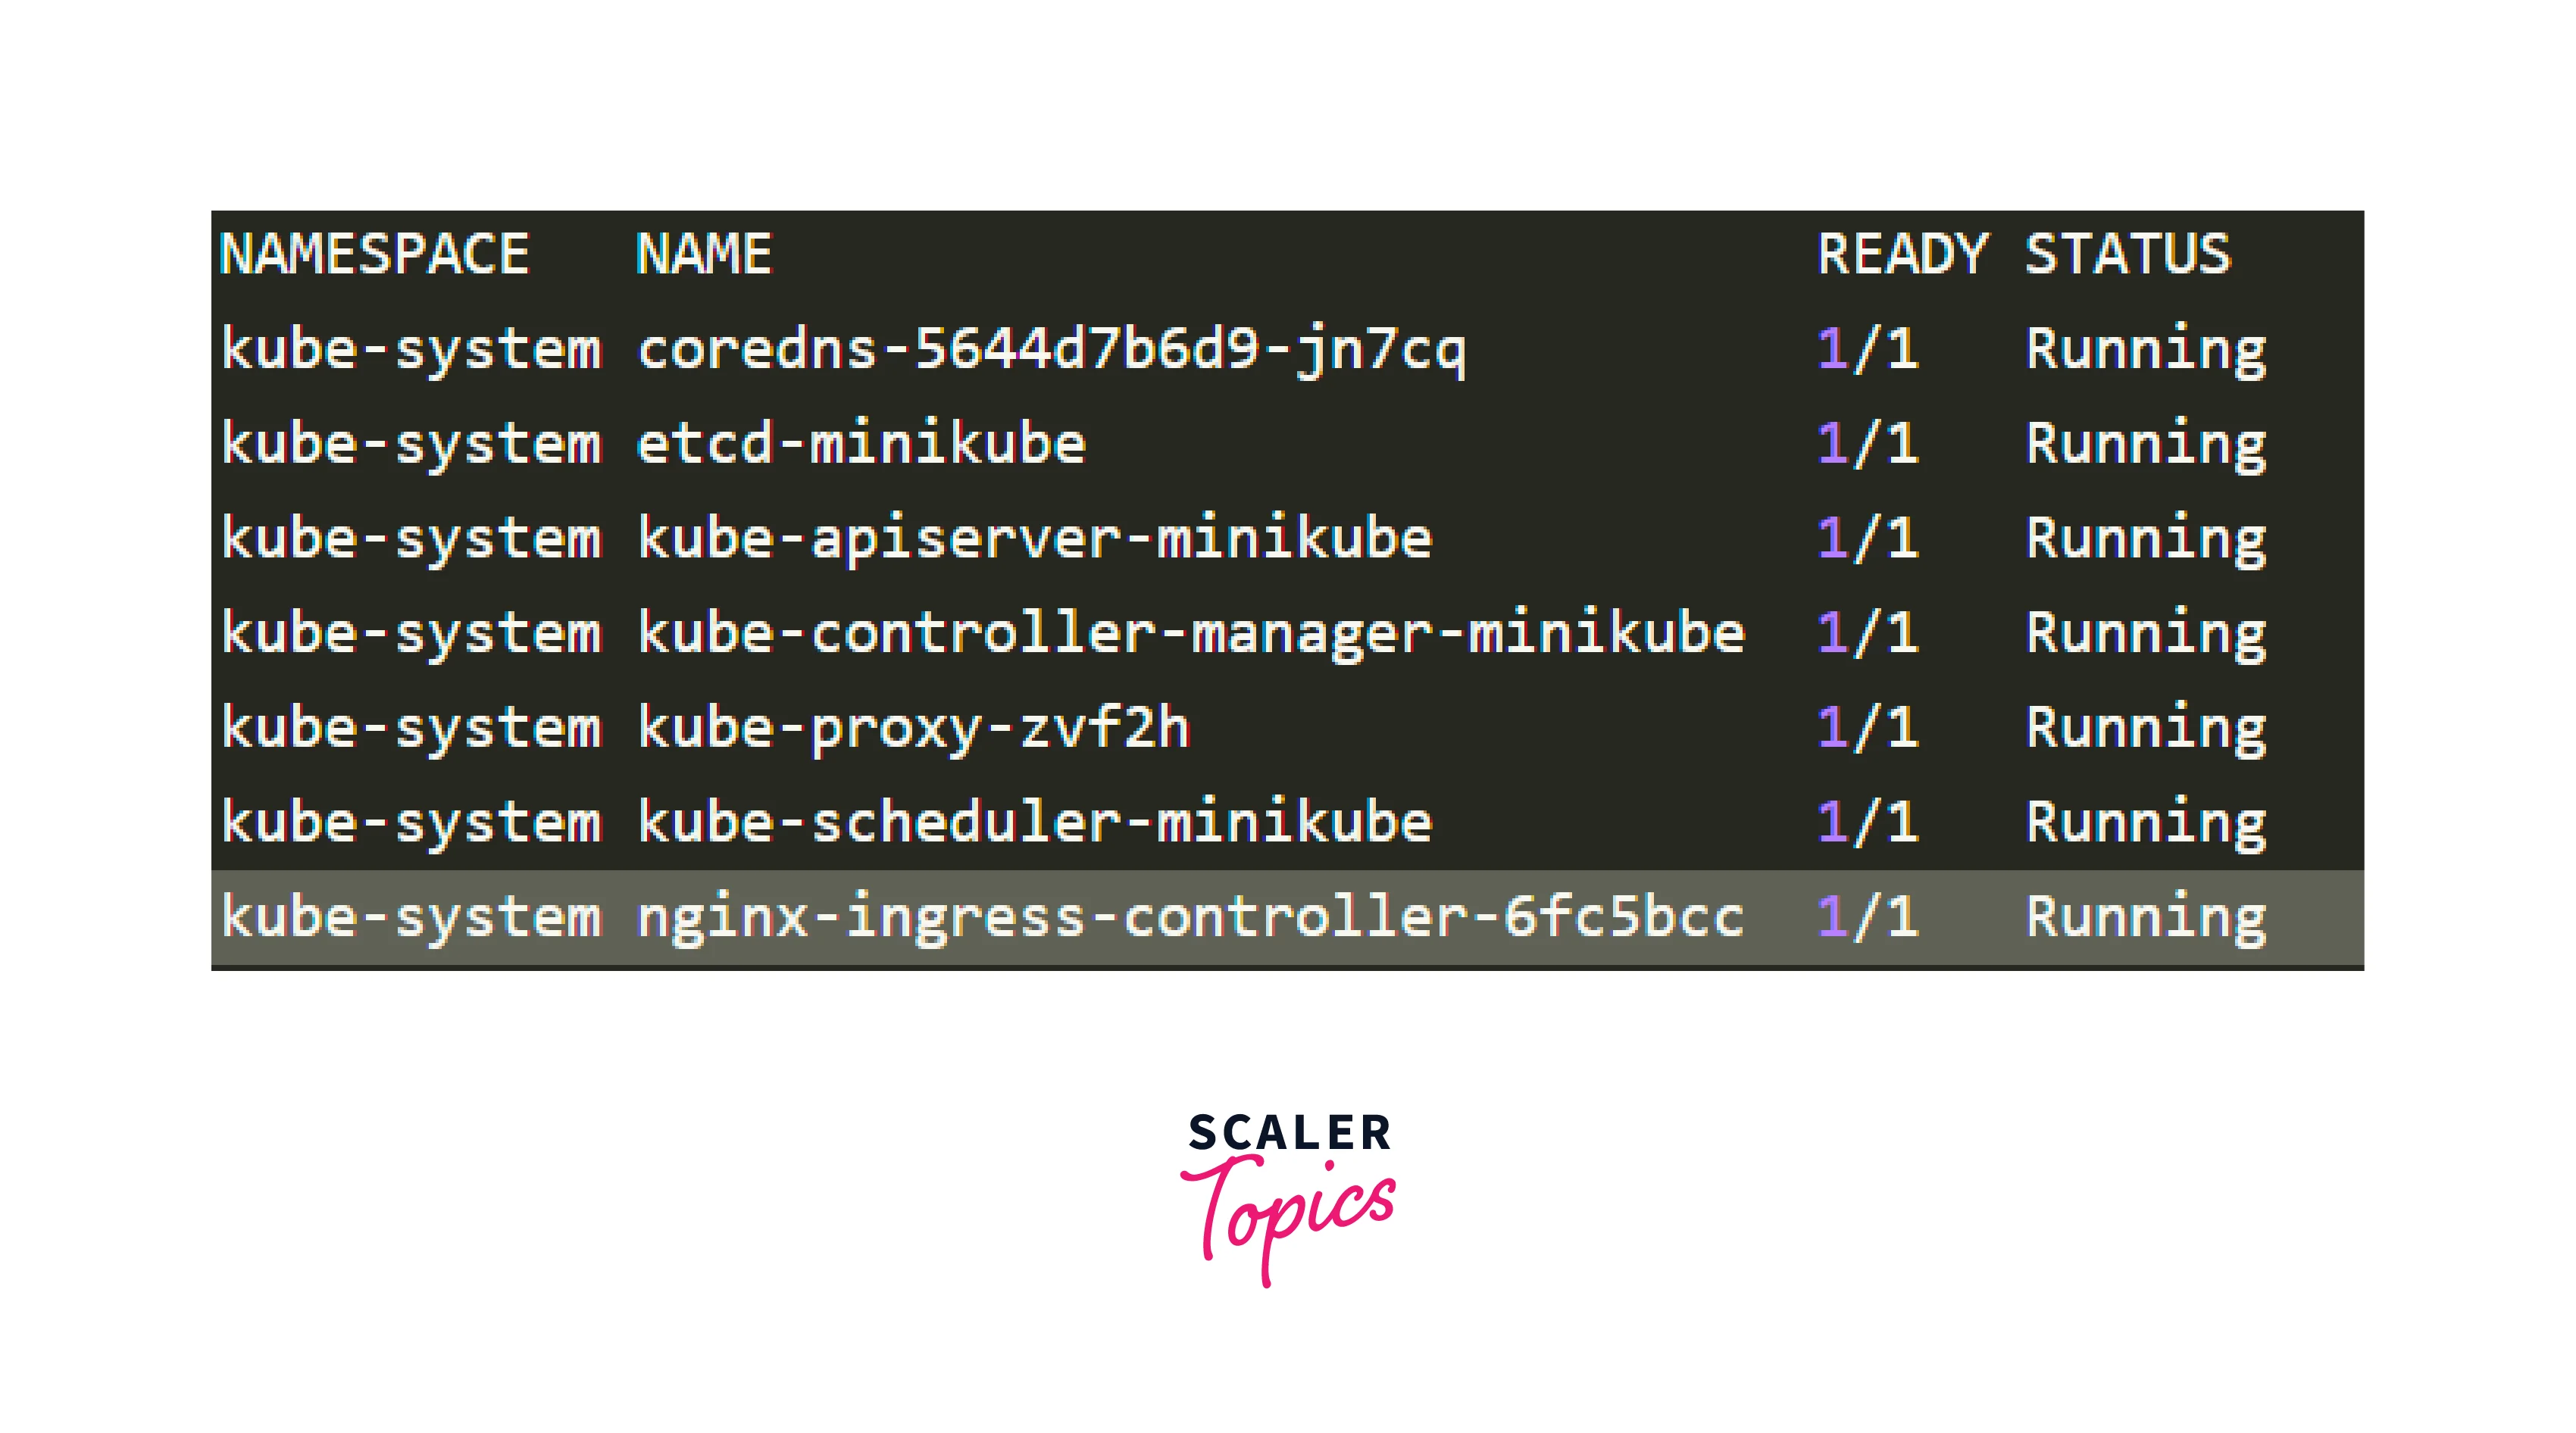
The Ingress Pod may have a setup mistake, causing an empty Backend column and preventing access to the application due to the Ingress and cluster being made available to the public internet.To begin, identify the Pod for your Ingress controller (which may be in a different namespace):
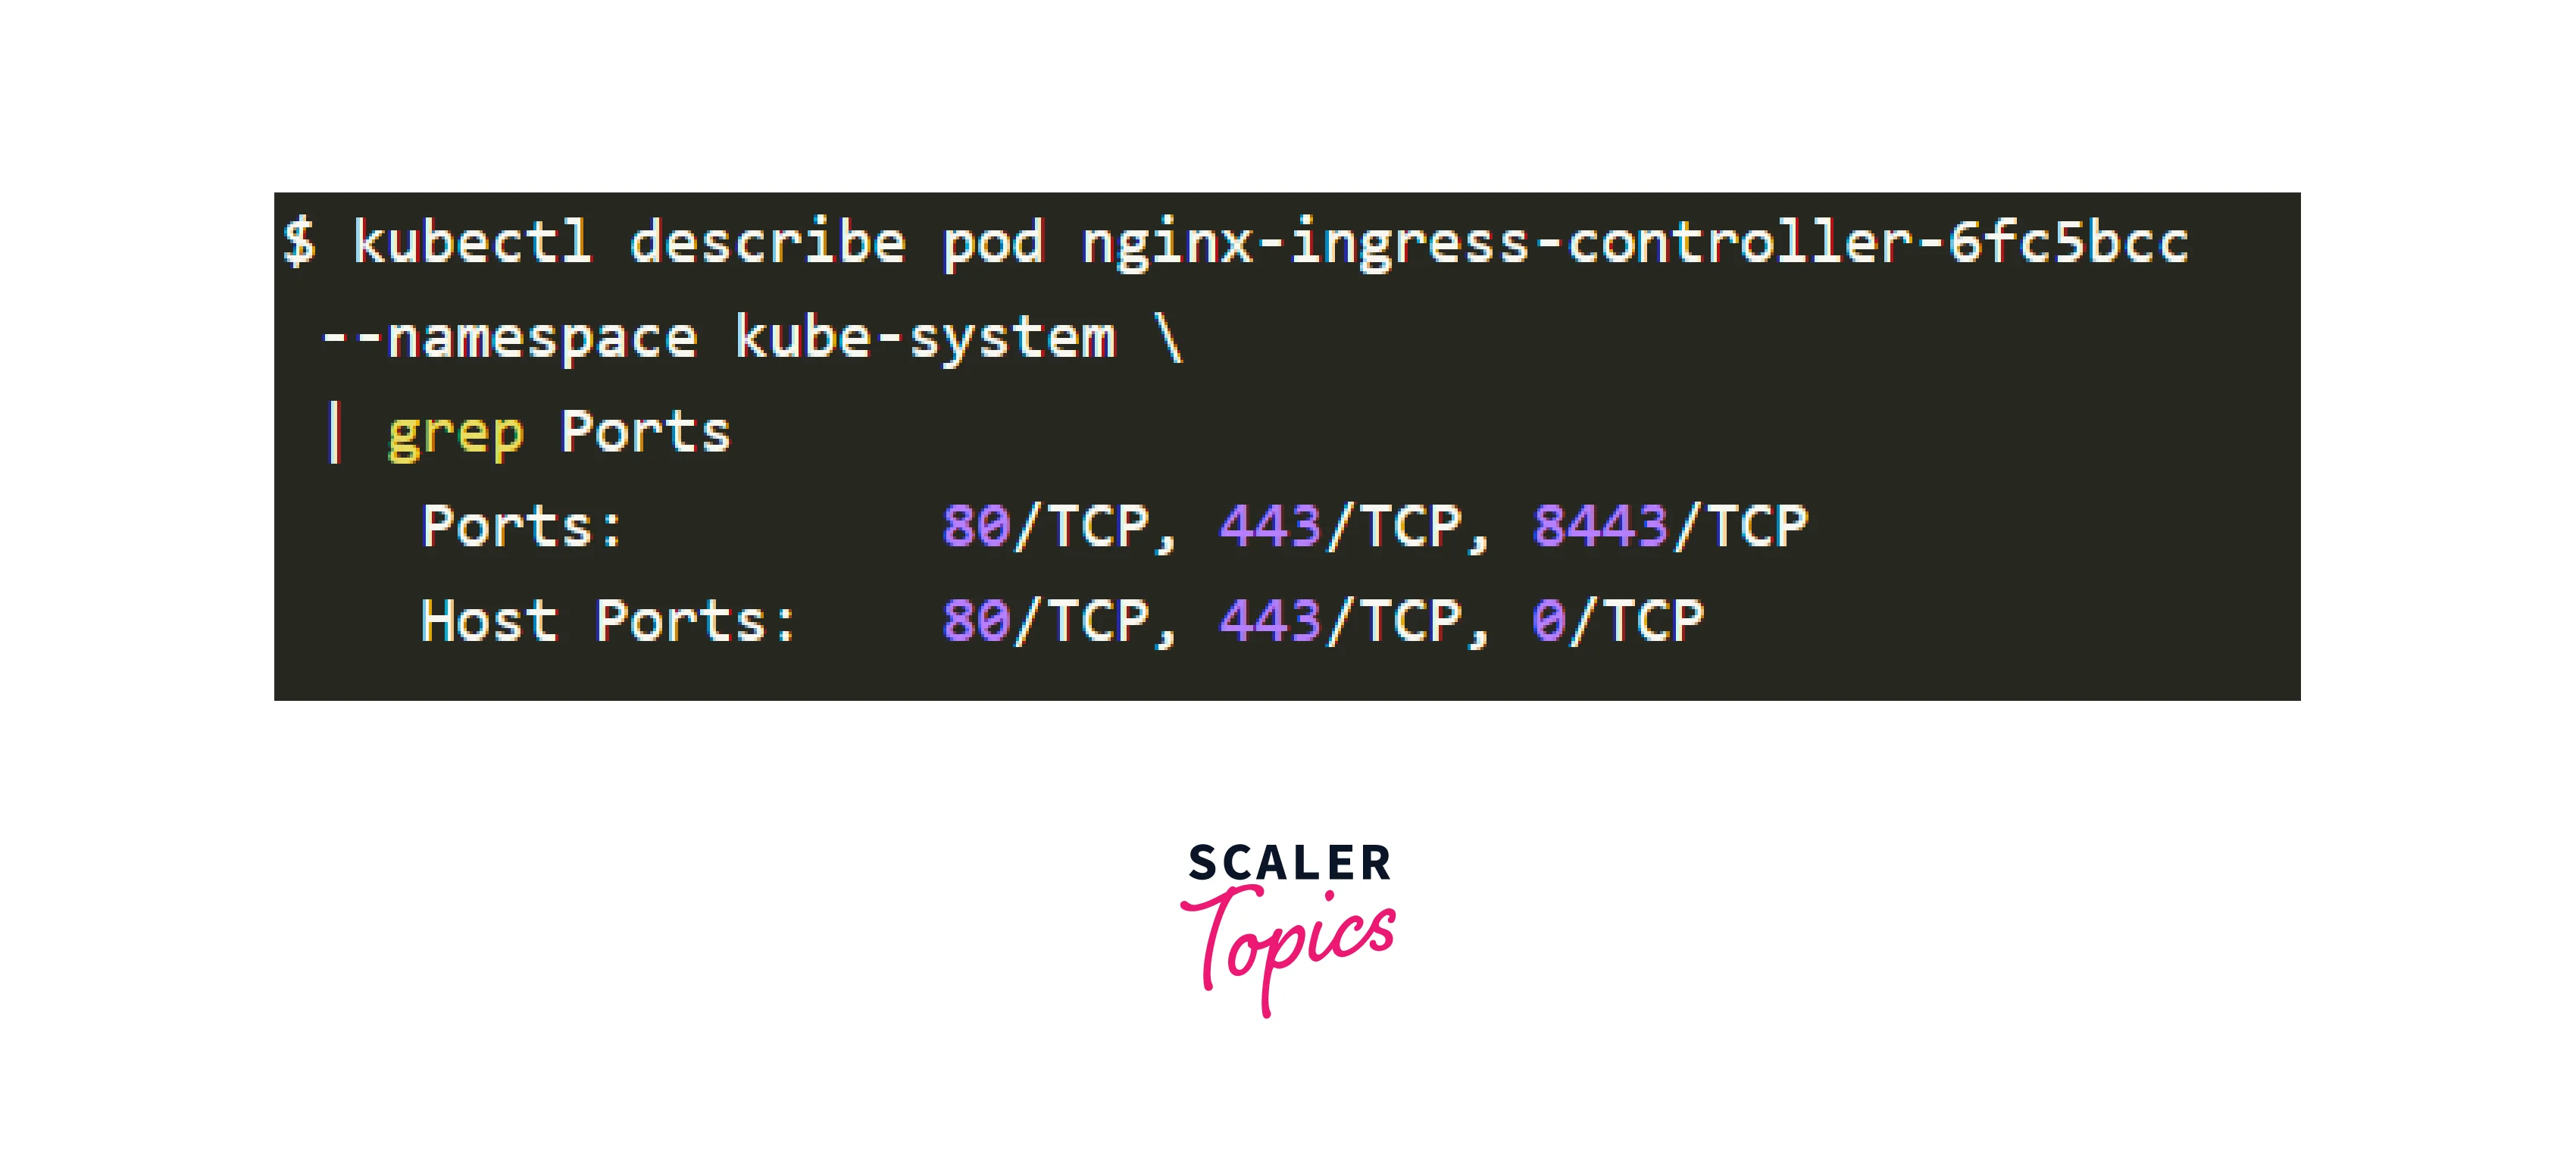
To retrieve the port, describe it as follows:
Finally, connect to the Pod as follows:
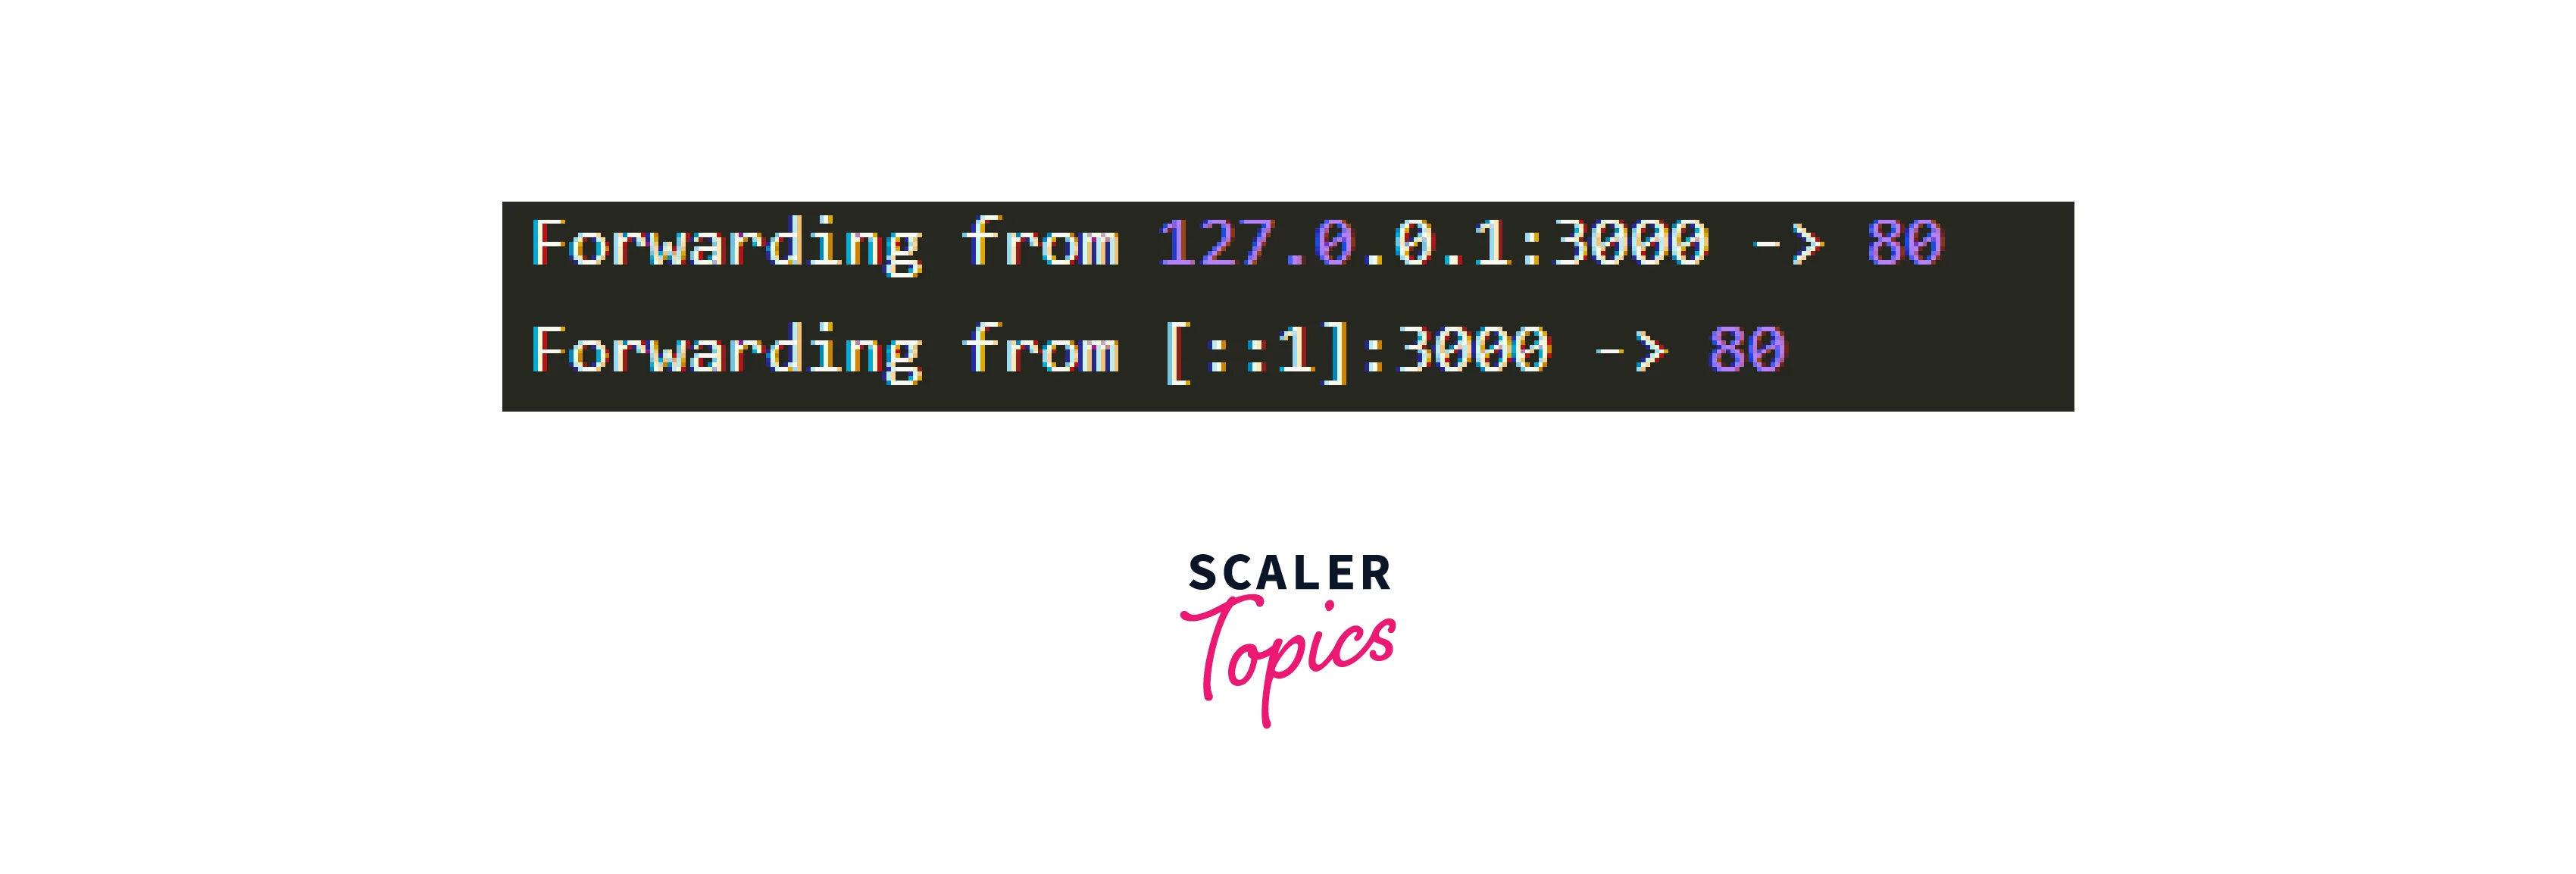
At this moment, each request made to port 3000 on your computer is routed to port 80 on the Pod.
1.Debugging Ingress Nginx
- You may use the kubectl ingress-nginx command to:
- Examine logs, backends, certificates, and so on.
- Connect to the Ingress server.
- Take a look at the present setup.
2.You should try the following commands:
- The kubectl ingress-nginx lint command examines the nginx.conf.
- To view the backend, use kubectl ingress-nginx backend (equivalent to kubectl describe ingress ingress-name>).
- To see the logs, use kubectl ingress-nginx logs
Node and Cluster-Level Issues
In Kubernetes troubleshooting, identifying and resolving node and cluster-level issues is crucial for maintaining a healthy and stable Kubernetes environment, as they significantly impact application stability, performance, and availability. The following are some typical node and cluster-level difficulties, as well as potential solutions:
Node-Level Problems
- Node Not Ready:
- Network difficulties, including resource limitations, setup errors, and nodes not responding, can cause issues in the network.
- Solutions:
Examine resource use, review node logs, confirm network connectivity, and fix any configuration issues.
- Node Drain and Eviction:
- During maintenance or due to resource limitations, nodes may be drained and evicted.
- Planned maintenance and resource depletion are the causes.
- Solutions:
Before doing maintenance, use kubectl drain to smoothly migrate pods off a node. Add nodes or optimize workloads to address resource limitations.
- Node Crashes:
- Hardware faults, kernel difficulties, or resource fatigue** can all cause nodes to crash.
- Causes include hardware issues,kernel panics, and resource fatigue.
- Investigate node logs,monitor hardware health, and optimize resource allocation as solutions.
Cluster-Level Issues:
- Etcd Issues:
- Etcd, the distributed key-value store, is essential for cluster state storage.
- Causes:
Etcd failures, data corruption, and resource limits. - Solutions:
Monitor etcd health, keep backups, provide enough resources, and optimize etcd performance.
- Network Problems:
- Network connectivity difficulties might interfere with pod communication and external access.
- Causes include misconfigured networking, firewall rules, and DNS issues.
- Solutions include checking network setups, inspecting DNS settings, and troubleshooting connection.
- Persistent Storage Failures:
- Persistent storage issues might have an influence on stateful applications.
- Causes Storage provider issues, incorrectly configured storage classes.
- Solutions include monitoring storage health, validating storage class setups, and ensuring backups.
Networking Troubleshooting
In Kubernetes Troubleshooting, Kubernetes is a renowned container orchestration platform that enables communication between cluster components, making it a critical feature for managing and deploying containerized applications.However, networking problems can be difficult to identify and resolve.
-
Verify Connectivity to the Kubernetes API Server
- Before Kubernetes troubleshooting networking issues, it's crucial to ensure connectivity to the Kubernetes API server.
- Use the kubectl command-line tool to verify the status of the Kubernetes API server.Run the following command:
- If the API server is not functioning properly, you may get an error message indicating the issue.
- You may also verify the status of the API server using the Kubernetes dashboard.
-
Check Kubernetes Cluster Networking
- There are various parts to Kubernetes networking, including nodes, pods, and services.
- Communication problems between components may result from improperly setup networking.
- To view the condition of the cluster's networking components, use the kubectl command-line tool.
- The commands listed above will provide you details about the nodes, pods, and services in your Kubernetes cluster.
- You might need to conduct additional troubleshooting if you discover any problems with networking components.
-
Verify Pod Networking
- A vital component of Kubernetes networking is pod networking. It allows for communication inside a cluster of pods.
- Communication difficulties between components may result from any pod networking problems.
- Run the command for the following:
- To access the container within the pod and check the network connectivity, you may also use the kubectl exec command.
-
Check Network Policies
- To manage traffic flow between pods, Kubernetes lets you set network policies. Communication problems between components may result from improper network policy configuration.
- To examine the network policies in your Kubernetes cluster, use the following command:
- The above command will provide you with information on the network policies in your Kubernetes cluster.
Handling Persistent Storage Issues
In Kubernetes troubleshooting, by using the power of an effective Kubernetes storage solution, you can streamline and simplify storage management in Kubernetes settings while offering a number of advantages including scalability, resilience, flexibility, automation, and performance.
Choosing the Best Storage Provider for Kubernetes
-
StorageClasses: Quality of Services (QoS)
- Storage classes specify how Kubernetes apps can store data.
- Customizable in terms of performance and dependability.
- Developers define QoS requirements based on application requirements.
- Storage companies give monitoring tools for visibility into performance.
-
Multiple Data Access Modes:
- Access modes determine how pods and nodes interact with storage.
- RWO (Read Write Once):
A single node that handles both reading and writing. - ROX (Read Only Many):
Multiple nodes can read from storage at the same time. - RWX (Read Write Many):
Multiple nodes can read and write at the same time. - RWOP (Read Write Once Pod):
A single pod has exclusive read and write access. - Important for maximizing flexibility and supporting a wide range of application circumstances.
-
PV (Persistent Volume):
- Data abstraction for managing and storing data outside of containers.
- Storage is decoupled from the container lifecycle, increasing flexibility.
- Backup, restore, and data protection are all supported.
- Storage setup is decoupled from application deployment, facilitating mobility.
-
Dynamic Provisioning:
- Creates persistent volumes automatically when apps request them.
- Simplifies the deployment and administration of storage resources.
- Storage capacity, performance, and redundancy are all specified by developers.
- Reduces the complexity of application migration between Kubernetes clusters and environments.
Troubleshooting Application Deployments
Due to the complexity of the Kubernetes platform, Kubernetes Troubleshooting may have many areas to investigate in order to identify the problem's underlying causes.
But by looking at these three things, you can frequently identify the cause:
- Examine your pods.
- Examine the Service
- Check the Ingress or Route
- Examine your pods.
- Check Pod Status and Logs:
- Get pod status:
- View pod logs:
- Inspect Pod Logs for Errors:
- Look for warning or error logs: These indicate issues within the application.
- Check for continuous restarting or crashing patterns.
- Troubleshoot Application Issues:
- Verify if necessary config files are available.
- Check if the app is connecting to existing services.
- Examine correctness of database URLs or API endpoints.
- Verify correct usage of usernames and passwords.
- Test App from Inside the Pod:
- Access the app from within the container:
Examine the Service
- In Kubernetes troubleshooting ,checking the Service is the next step after testing your application Pods.
- In Kubernetes, the load-balancing object is the Service. Because it makes the application available within the cluster, it is significant.
- But it's simple to configure a Service incorrectly. I've made mistakes before, ranging from a minor typo to utilizing the wrong ports.
Troubleshooting tips
- Identify Service Name:
- Get a list of services:
- Access Service from Another Pod:
- Open terminal in another Pod:
- Try accessing the service:
- Check Service Configuration:
- Describe the service:
- Common Service Errors and Solutions:
- Incorrect Service Port:
Ensure Service port matches your app's port. - Incorrect Service Selector:
- Check labels in Service's selector field.
- Ensure labels match those in your Deployment/DeploymentConfig.
- Incorrect Service Port:
Check the Ingress or Route
- Accessing the App via Route or Ingress:
- If your app is externally accessible, it's likely through a Route (OpenShift) or an Ingress (Kubernetes).
- Check External Access:
- Verify if your app works inside the cluster.
- Then, ensure you can access it from your desktop.
- Using Web Browser and Curl:
- For web apps, try opening in a web browser.
- For APIs, use curl to access the endpoint.
- Troubleshoot Route or Ingress:
- If timeouts or access issues occur, Route or Ingress might be problematic.
- Get Information about Route/Ingress:
- Describe Ingress object:
Troubleshooting Ingress and Load Balancers
- Verify Ingress Configuration:
- Check that your Ingress resource is properly setup with the appropriate rules and pathways.
- Verify that the backend service and port are properly provided.
- Check the Ingress Controller:
- Ensure that the Ingress Controller is correctly deployed and operating in your cluster.
- Check the Ingress Controller logs for any errors:
- Examine the Ingress Controller Service:
- Determine that the Ingress Controller Service is of the LoadBalancer type:
- Check to see if an external IP address is assigned.
- Check Load Balancer Status:
- If the Ingress Controller Service is using a LoadBalancer, check its status:
- Rules for a Firewall or Security Group:
- Check that no firewall rules or security groups are preventing inbound traffic from reaching your Ingress Controller.
Upgrades and Maintenance Troubleshooting
In Kubernetes troubleshooting , Upgrades and maintenance in Kubernetes are critical to ensuring your cluster's stability, security, and performance. Troubleshooting typical upgrades and maintenance issues are from the following :
- Upgrade Errors:
- Problem:
The upgrade process fails due to mismatched setups or limited resources. - Troubleshooting:
For compatibility requirements, consult the upgrading manual. Make sure you have enough CPU, RAM, and disk space. Examine upgrade logs and error messages to discover particular problems.
- Problem:
- Draining of Nodes:
- Problem:
During maintenance, nodes fail to drain effectively, creating interruption. - Troubleshooting:
Make sure the kubectl drain command is being used appropriately. Look for pods with PodDisruptionBudgets to avoid draining. Look for anti-affinity regulations in pods that inhibit proper evacuation.
- Problem:
- Pod Eviction:
- Due to resource limits, pods are evicted during maintenance.
- Troubleshooting:
Examine the pod's resource needs and limitations. To guarantee optimal scheduling and eviction behavior, use Kubernetes' built-in resource management.
- Networking Concerns:
- Problem: Networking issues develop following maintenance, impeding pod communication.
- Check for misconfigured Network Policies or firewall rules when troubleshooting. Check that networking plugins such as Calico, Flannel, or Cilium are working properly.
Debugging with Events and Auditing
In In Kubernetes troubleshooting, Kubernetes Audit Logs are crucial for troubleshooting Kubernetes issues by recording API calls to the API Server, including those by users and Kubernetes components. They provide visibility into Kubernetes cluster events, ensuring security and compliance. Properly configured audit logs help detect abnormal activities like failed logins and unauthorized access.
The rules defined in the Audit policy are reviewed in sequence, and the first matching rule determines the event's audit level. Each request can be connected with a stage. The following steps can have audit logging enabled:
- RequestReceived:
The stage for events that occur immediately after the audit handler gets the request. - ResponseStarted:
After the response headers have been sent but before the response body. - ResponseComplete:
The body of the answer has been completed. - Panic:
The events that occur when a panic occurs.
Make the following data available in an audit policy file called /etc/kubernetes/audit/policy.yaml:
Best Practices for Kubernetes Troubleshooting
- Observability and Monitoring
- Establish reliable monitoring using Prometheus, Grafana, and Kubernetes-specific tools (like kube-state-metrics).
- Keep an eye on important performance indicators including CPU, memory, network, and application-specific data.
- To be informed about unusual behaviour or resource shortages, create alerts.
- Event analysis and logs:
- Utilise technologies like Fluentd or Loki to gather and centralize logs from all Kubernetes apps and components.
- To quickly find, examine, and visualize logs for troubleshooting needs, use log aggregation solutions.
- To find problems, pay attention to error messages, warnings, and informational logs.
- Proactive Testing and Staging:
- Before implementing them in production, test modifications, updates, and new deployments in a staging or development environment.
- Utilise canary deployments to deliver updates gradually and keep an eye out for any unforeseen problems before they affect all customers.
- Debugging Tools:
- Familiarize yourself with Kubernetes debugging tools like kubectl debug,kubectl exec, and kubectl logs for interactive troubleshooting.
Conclusion
Kubernetes troubleshooting is crucial for ensuring the stability, performance, and dependability of containerized applications within Kubernetes clusters, addressing issues in application deployment, networking, storage, and cluster-level concerns.The following are some major takeaways from the information provided:
- Common Kubernetes Issues:
Common Kubernetes issues include inaccurate labels, safety checks, insufficient monitoring, default namespace misuse, cluster scalability, persistent storage issues, resulting from misconfigurations, resource constraints, compatibility issues, and network connection concerns. - Monitoring and Observability:
Monitoring cluster health, node usage, pod deployment trends, and application availability helps identify bottlenecks, optimize performance, and ensure smooth operation. - Troubleshooting Tools:
Kubernetes provides various troubleshooting tools like kubectl commands, plugins, kubectl exec, kubectl logs, and kubectl debug for analyzing pod status, obtaining container logs, and interactively troubleshooting issues. - Node and Cluster-Level Issues:
Troubleshooting for application stability and availability involves determining node readiness, addressing drain and eviction issues, and addressing cluster-wide issues like etcd failures and networking issues. - Networking Troubleshooting:
To resolve networking issues in Kubernetes clusters, it's crucial to test API server connectivity, ensure proper cluster configuration, and troubleshoot pod networking and network rules.