What are the Best Linux Debuggers You Can Use on Linux?
Overview
There are several powerful linux debuggers available that help developers identify and fix software issues. GDB (GNU Debugger) is a versatile and widely used linux debugger supporting multiple programming languages and offering features like breakpoints, watchpoints, and real-time tracking.
LLDB (LLVM Debugger) provides a modern and extensible debugging experience with support for multiple platforms and languages. Valgrind is primarily used for memory debugging, detecting memory leaks, and buffer overflows. strace traces system calls made by a program, providing insights into its behavior. Perf is a performance analysis tool that collects and analyzes performance data.
What is a Debugger?
A debugger is a software tool used by developers to identify and fix issues in computer programs. It provides a controlled environment for monitoring and analyzing program execution, allowing developers to understand the behavior of their code and diagnose problems. Debuggers are essential for software development, helping to streamline the debugging process and improve overall code quality.
Debuggers offer a range of features to aid in the debugging process. Some common features include:
- Breakpoints:
Developers can set breakpoints at specific lines of code or conditions that, when triggered, pause program execution. This allows for careful inspection of the program's state at that particular point. - Stepping:
Debuggers provide options for stepping through code, allowing developers to execute the program line-by-line. This helps in understanding the flow of execution and identifying issues. - Variable Inspection:
Developers can examine the values of variables and data structures at different points during program execution. This is crucial for understanding how data is manipulated and identifying incorrect values or unexpected behavior. - Watchpoints:
Watchpoints allow developers to track changes to specific variables. When the value of a watched variable is modified, the debugger pauses execution, enabling detailed examination. - Call Stack Inspection:
Debuggers provide a call stack, which shows the sequence of function calls leading to the current point of execution. This helps identify the chain of events leading to a bug or error. - Memory Inspection:
Debuggers often provide memory inspection capabilities, allowing developers to examine the contents of memory locations. This can be useful for identifying memory-related issues such as buffer overflows or memory leaks. - Conditional Breakpoints:
In addition to standard breakpoints, developers can set conditional breakpoints based on specific conditions or expressions. Program execution will pause only when the condition evaluates to true, allowing for targeted debugging. - Post-Mortem Analysis:
Some advanced debuggers support post-mortem analysis, allowing developers to examine the state of a crashed or terminated program. This helps in understanding the cause of the crash and diagnosing issues.
What are the Best Linux Debuggers you can Use on Linux?
GNU Debugger(GDB)
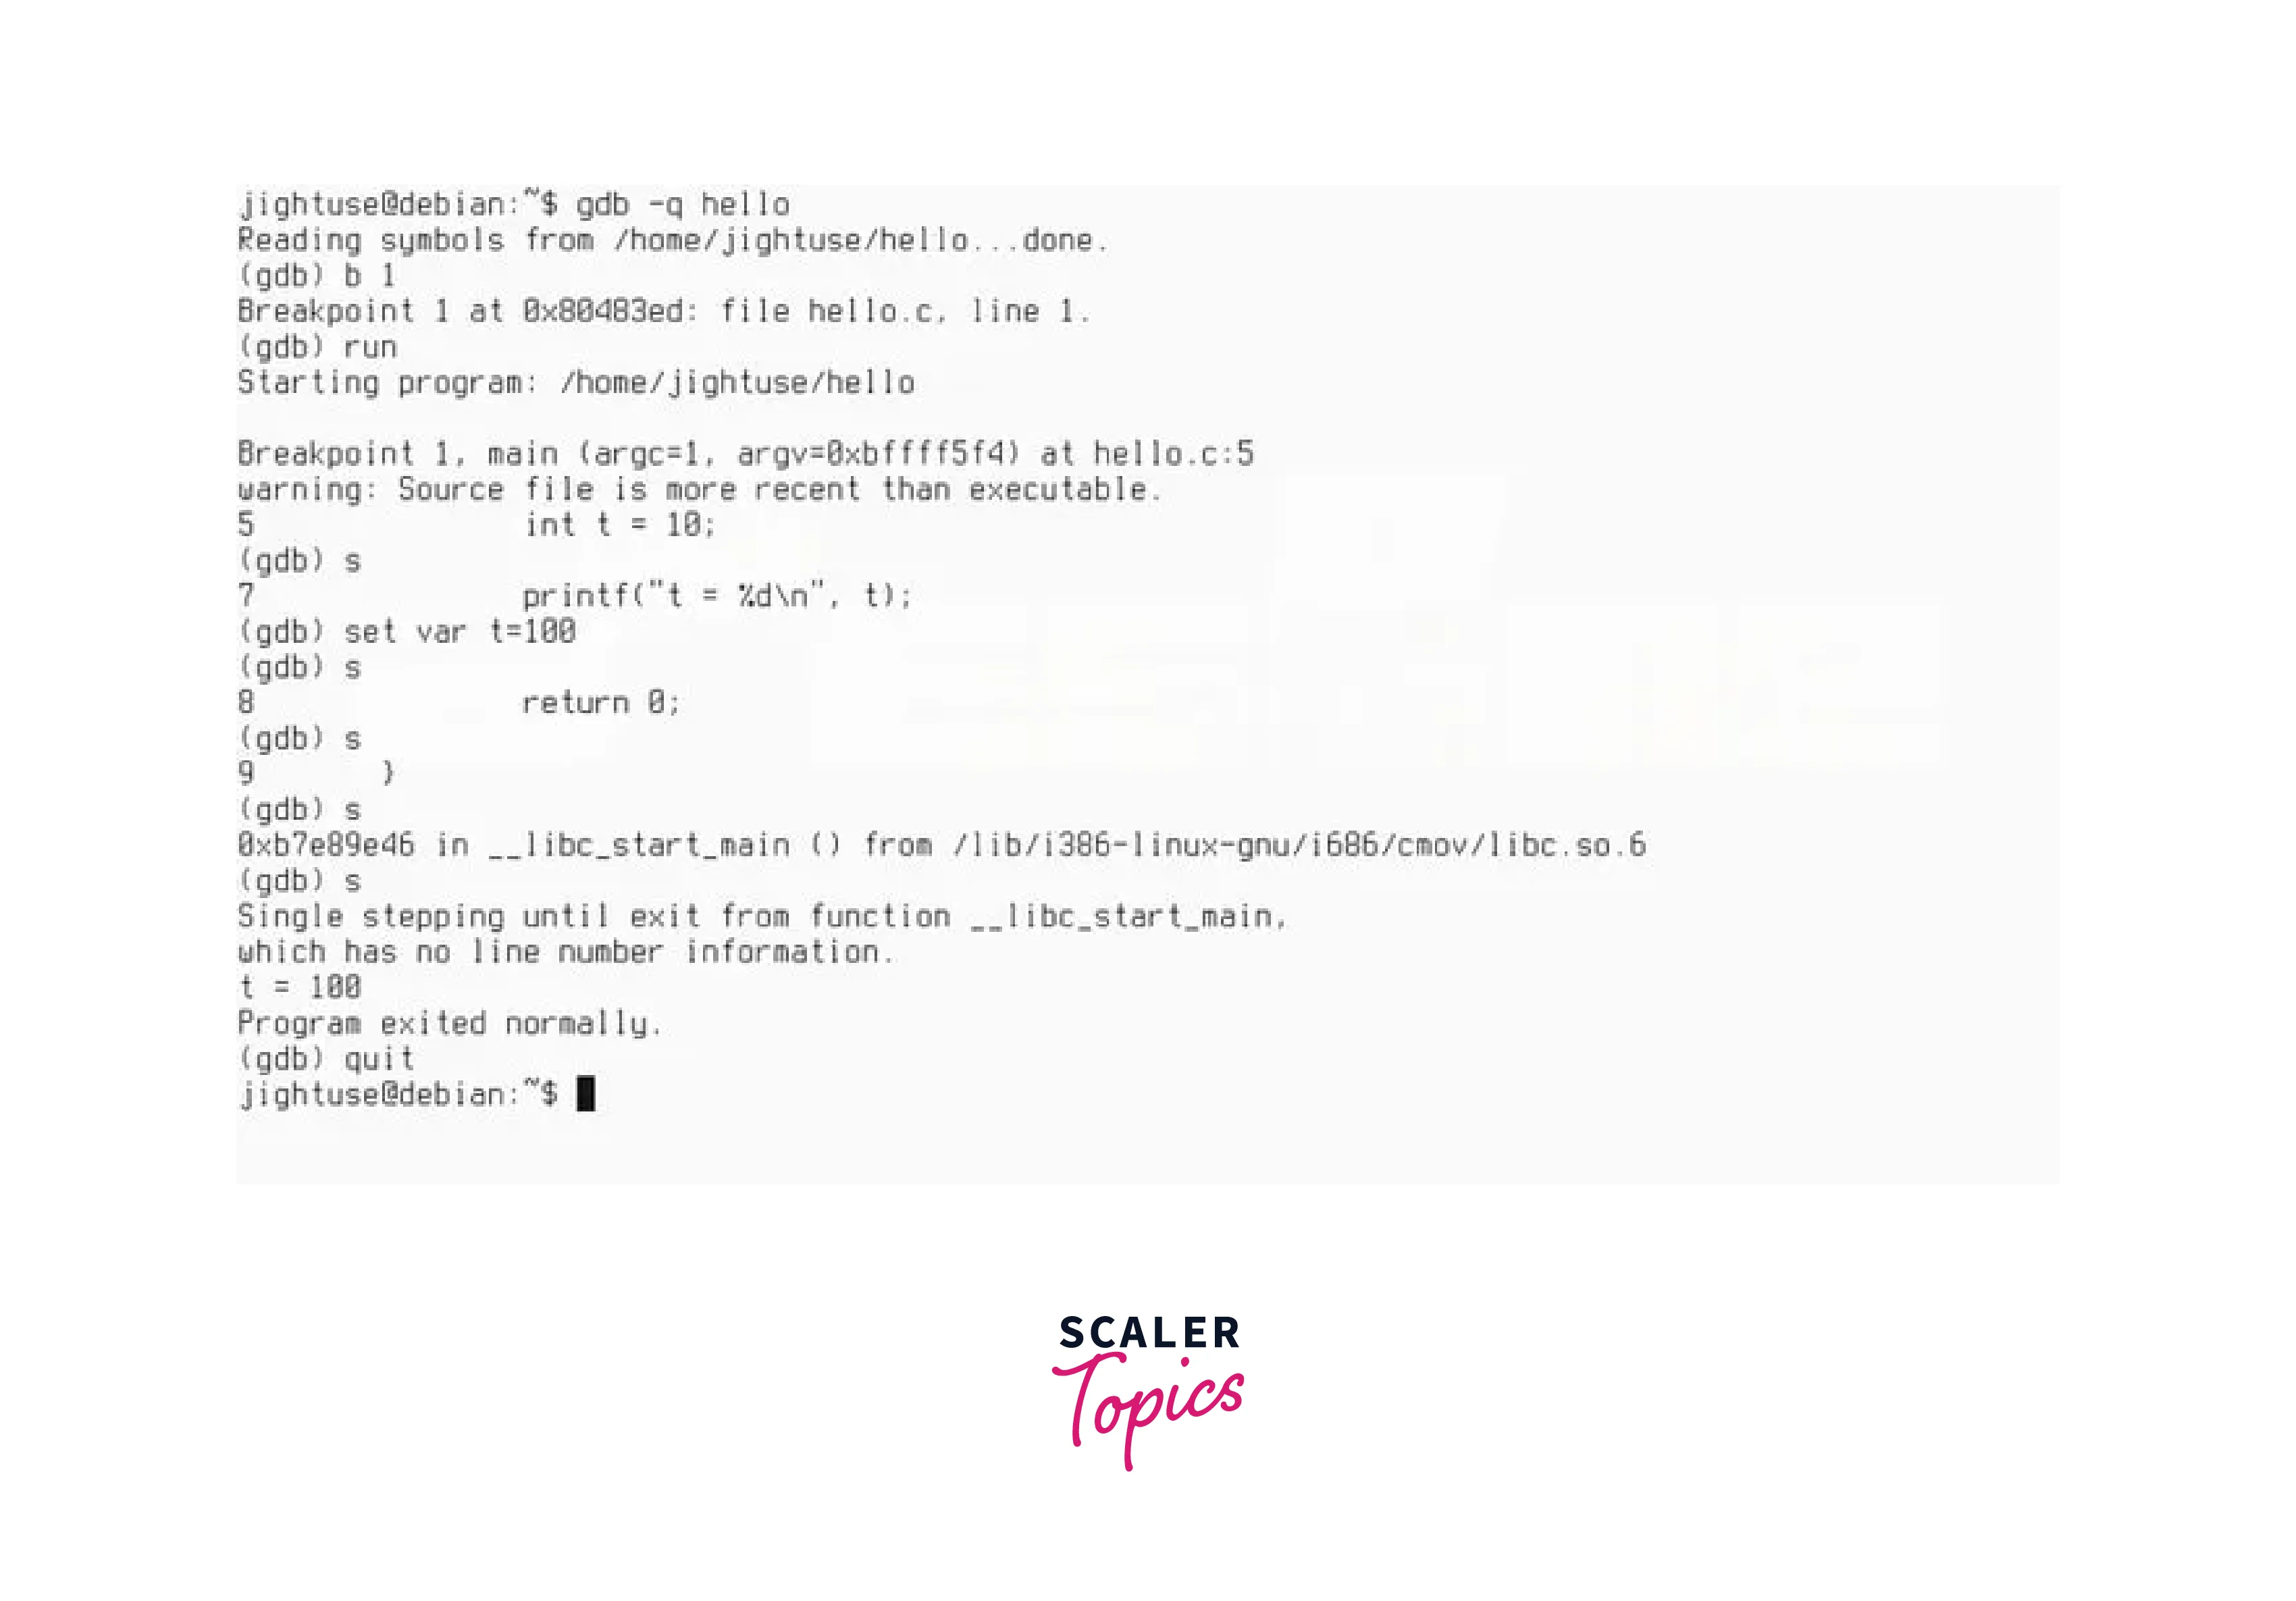 The GNU Debugger (GDB) is a highly versatile and widely used debugger for Linux. As an open-source tool, GDB provides developers with an extensive range of features and capabilities to effectively analyze and debug their programs.
GDB offers a rich set of commands and options that enable developers to navigate and analyze their code effectively. Some of the key functionalities of GDB on Linux include:
- Breakpoints:
Developers can set breakpoints at specific lines of code, functions, or memory addresses, allowing them to pause program execution at desired locations for inspection and analysis. - Stepping:
GDB provides stepping commands to execute the program line-by-line, allowing developers to observe the flow of execution and identify issues. - Variable Inspection:
Developers can examine the values of variables, data structures, and memory locations at different points during program execution. They can also modify variable values to test different scenarios. - Call Stack Examination:
GDB allows developers to inspect the call stack, providing information about the sequence of function calls leading to the current point of execution. This helps in understanding the program's flow and diagnosing issues. - Memory Inspection:
GDB provides commands to examine and modify the contents of memory locations, allowing developers to track down memory-related issues like corruption or incorrect allocation. - Remote Debugging:
GDB also supports remote debugging, allowing developers to debug programs running on different machines or embedded systems. This feature is particularly useful for debugging applications deployed on remote servers or devices.
LLDB
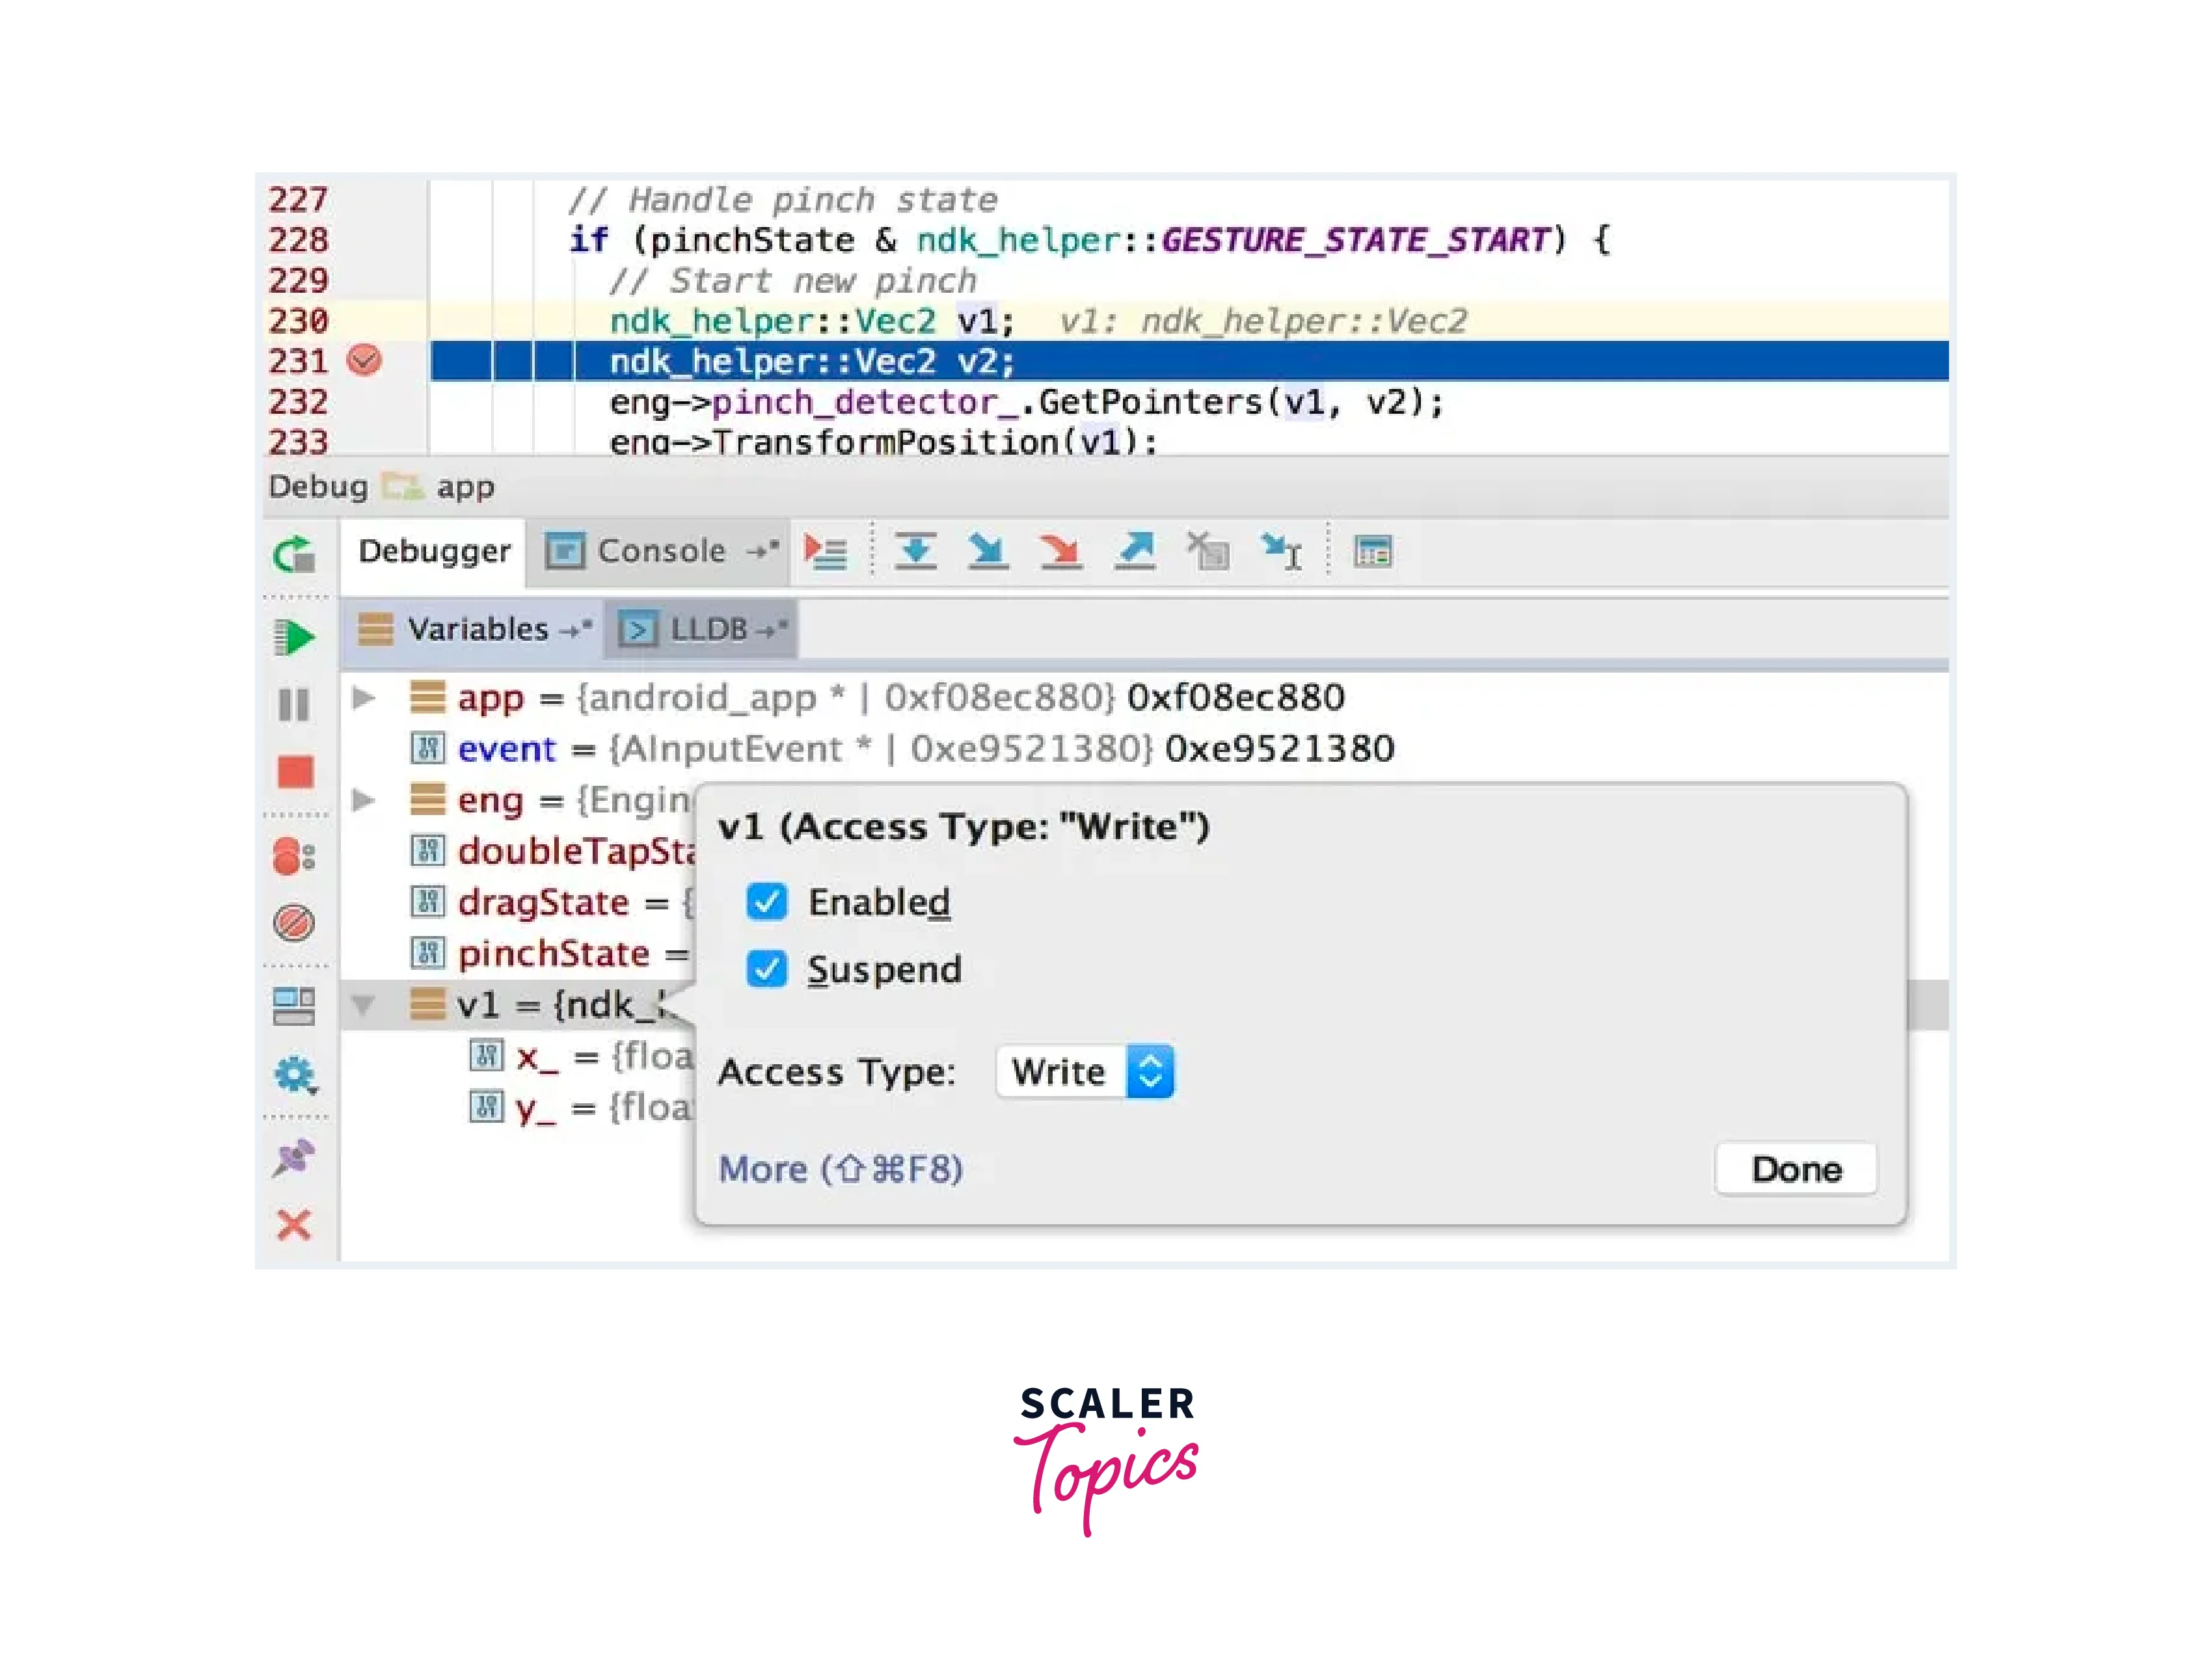 LLDB is a versatile and modern debugger primarily developed by the LLVM project. It is designed to provide powerful debugging capabilities for various programming languages and platforms, including Linux. Here's an overview of LLDB's features:
- Multi-Language Support:
LLDB supports multiple programming languages, including C, C++, Objective-C, and Swift. It provides a consistent debugging experience across these languages. - Cross-Platform Compatibility:
LLDB is designed to work on various platforms, including Linux, macOS, and Windows. It allows developers to debug applications across different operating systems seamlessly. - Symbolic Debugging:
LLDB supports symbolic debugging, allowing developers to access symbol information, such as function names and variable names, during the debugging process. This enhances the readability and comprehension of the code being debugged. - Variable Inspection:
LLDB enables developers to inspect the values of variables and data structures at various points during program execution. They can examine and modify variables, aiding in understanding and diagnosing issues within the code. - Call Stack Examination:
LLDB provides a call stack that shows the sequence of function calls leading to the current point of execution. Developers can inspect the call stack to understand the flow of program execution and identify the cause of issues. - Just-in-Time Compilation (JIT):
LLDB supports Just-in-Time Compilation, allowing developers to dynamically compile and execute code during the debugging session. This feature is particularly useful for languages like Swift that utilize JIT compilation. - Scripting and Extensions:
LLDB offers scripting support using the Python programming language. Developers can create custom scripts and extend LLDB's functionality to automate tasks or add specific debugging features. - Remote Debugging:
LLDB supports remote debugging, enabling developers to debug programs running on remote machines or embedded systems. This feature facilitates debugging scenarios where the target application is not running on the same machine as the debugger.
Nemiver
 Nemiver is a graphical debugger specifically designed for Linux-based systems. It provides developers with a user-friendly interface and a range of features to facilitate the debugging process. Here's an overview of Nemiver's key features:
- Graphical User Interface (GUI):
Nemiver offers a visually appealing and intuitive GUI, making it easy for developers to navigate and interact with the debugger. The interface provides various views, such as source code, call stack, variables, breakpoints, and watchpoints. - Multi-Language Support:
Nemiver supports multiple programming languages, including C, C++, and Fortran. It leverages the GNU Debugger (GDB) as its backend, enabling it to debug applications written in these languages effectively. - Breakpoints and Stepping:
Nemiver allows developers to set breakpoints at specific lines of code, functions, or memory addresses. They can easily manage breakpoints, enable/disable them, and specify conditions. Stepping features, such as stepping into, stepping over, and stepping out of functions, facilitate program execution control. - Call Stack Examination:
Nemiver presents a call stack view that displays the sequence of function calls leading to the current point of execution. This helps developers understand the program's flow and identify the chain of function calls. - Expression Evaluation:
Nemiver allows developers to evaluate and monitor expressions during debugging. They can enter custom expressions and view their results, helping with on-the-fly calculations or monitoring specific program states. - Memory Inspection:
Nemiver offers memory views that allow developers to examine the contents of memory locations. This is particularly useful for debugging issues related to memory allocation, deallocation, or corruption.
Interactive Disassembler(IDA)
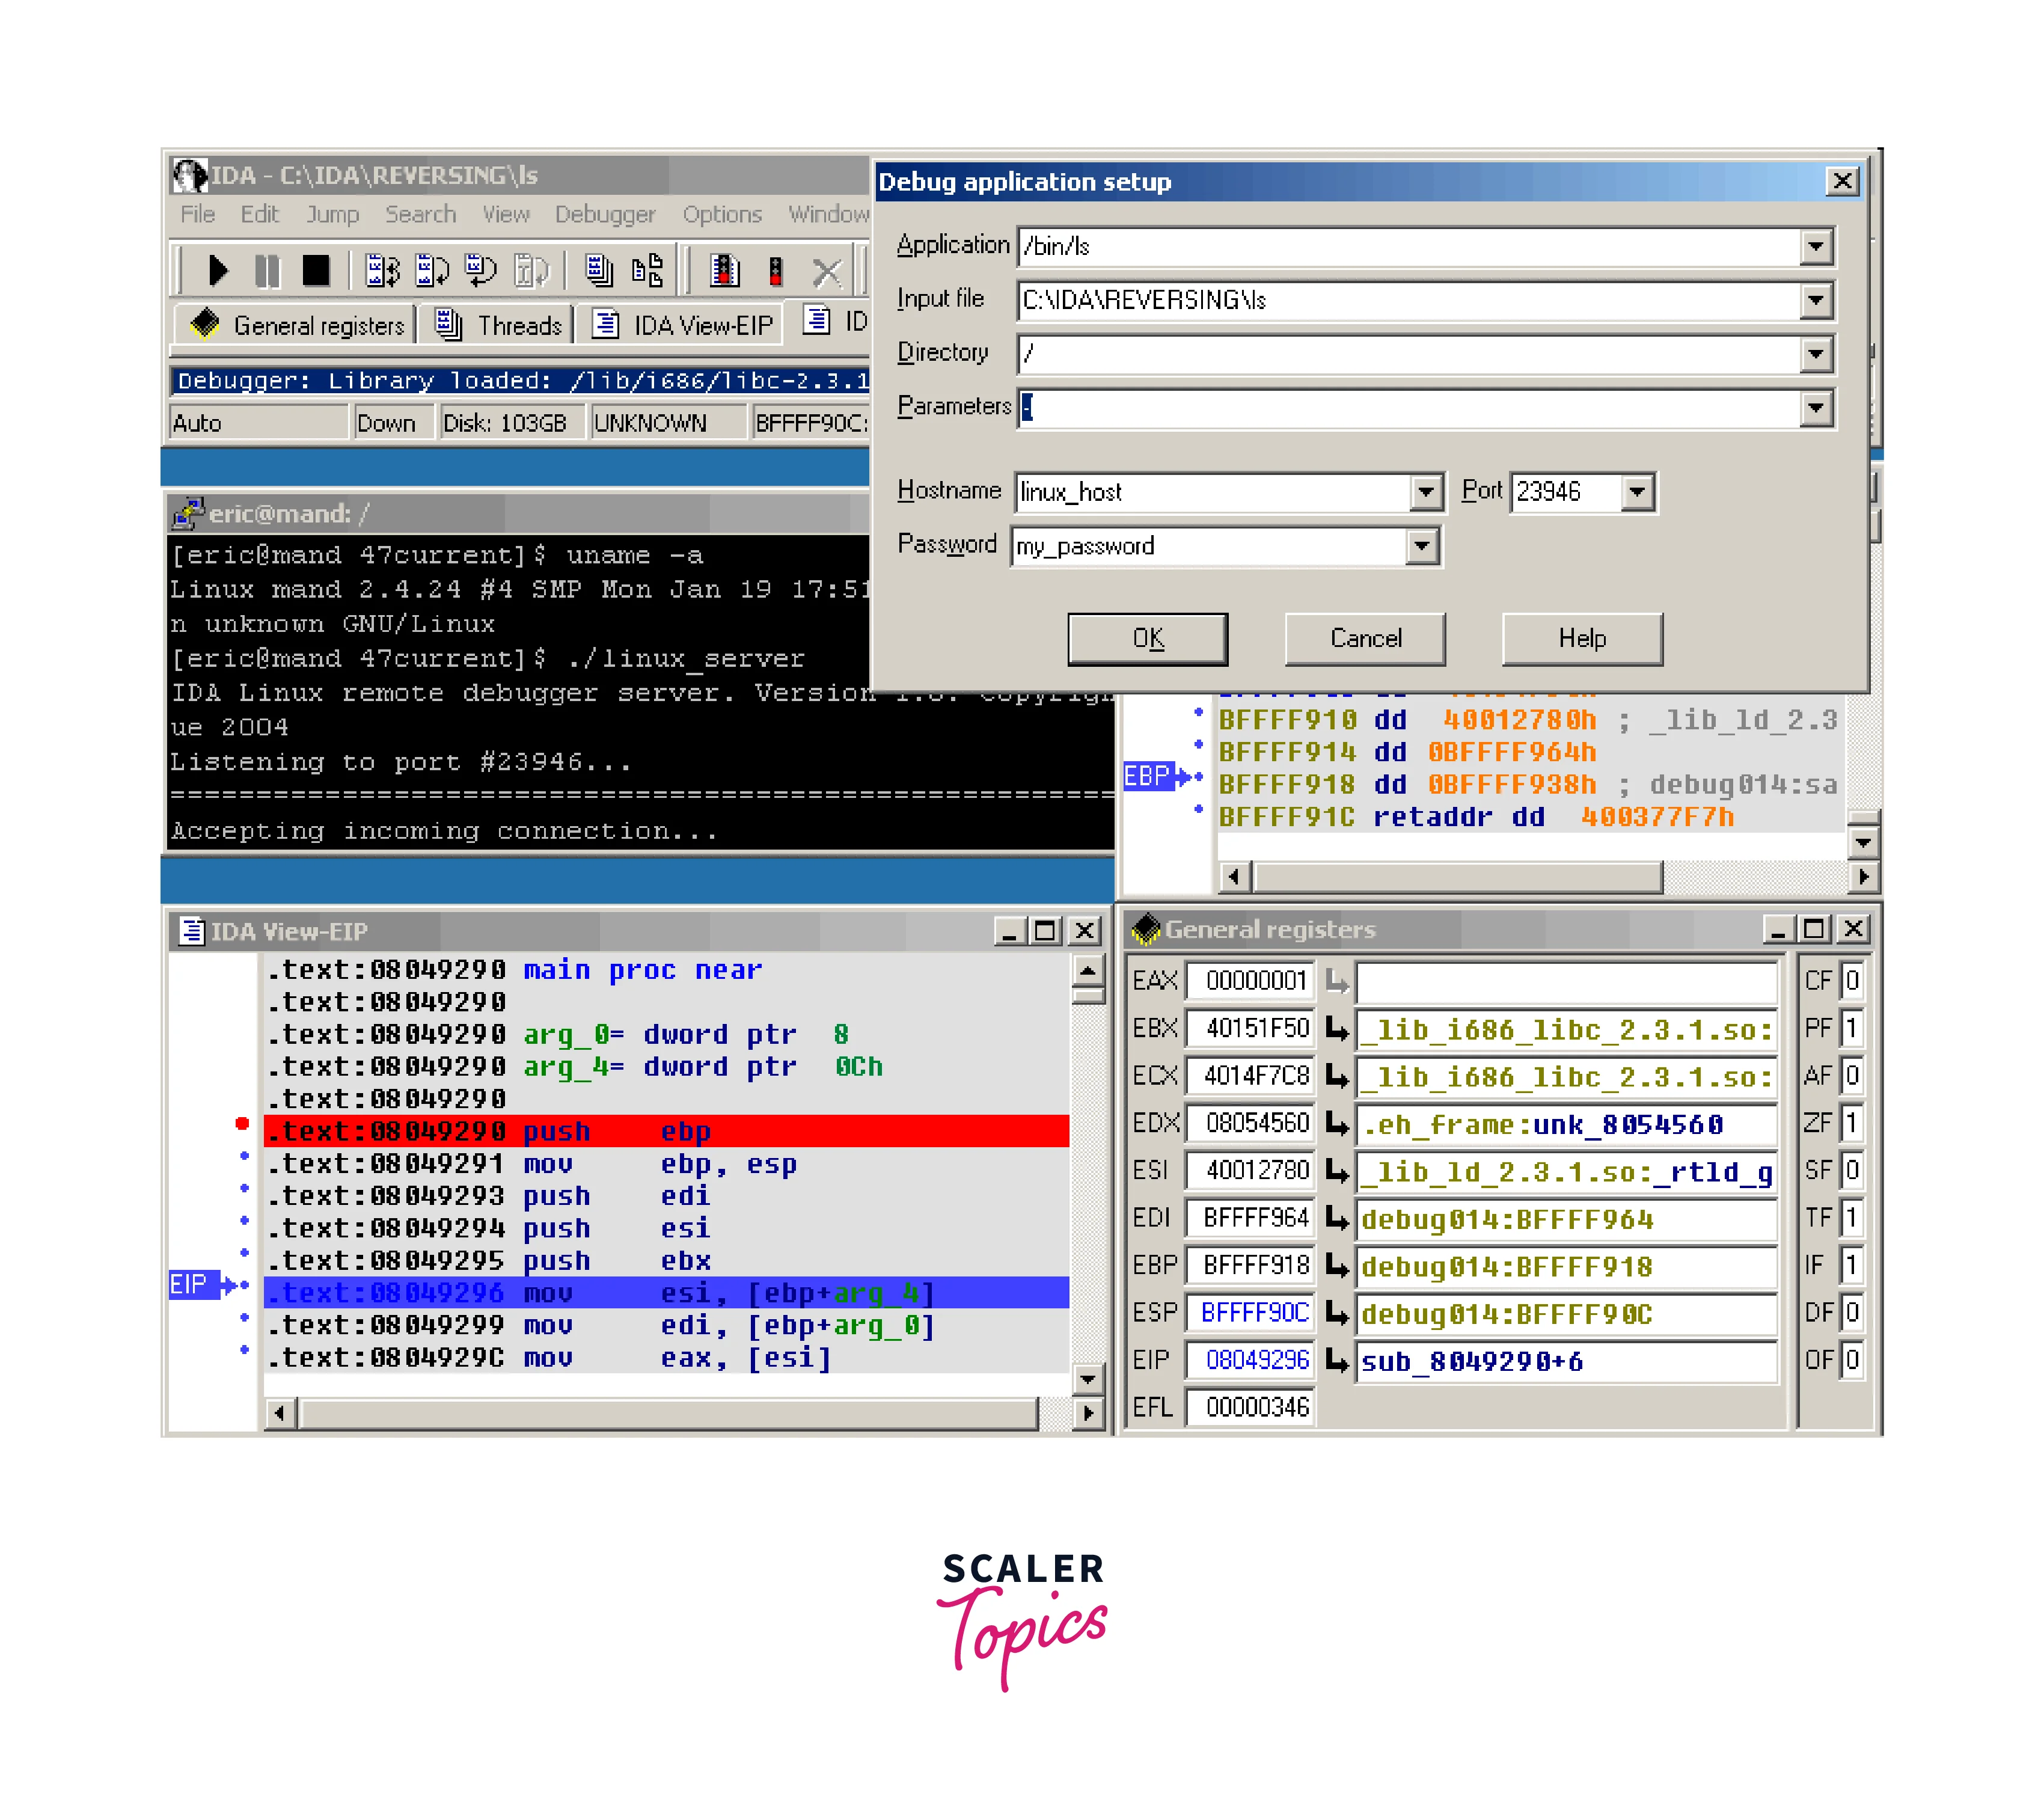
An interactive disassembler, often referred to as an IDA (Interactive DisAssembler), is a powerful tool used for reverse engineering binary code. It allows developers and security researchers to analyze and understand the low-level assembly instructions of compiled programs. Here's an overview of an interactive disassembler:
- Disassembly and Assembly:
Interactive disassemblers can transform machine code into human-readable assembly instructions, providing a high-level view of the binary program. Conversely, they can also perform assembly, allowing users to write assembly instructions and generate corresponding machine code. - Cross-Referencing and Code Analysis:
Interactive disassemblers offer cross-referencing capabilities, enabling users to track and analyze the flow of instructions, function calls, and data references within the binary. This aids in understanding the program's behavior and identifying relationships between different sections of code. - Decompilation:
Some interactive disassemblers provide decompilation features, allowing users to generate higher-level representations of the code, such as C or pseudo-C code. This assists in comprehending the program's logic and structure. - Symbolic Execution and Data Flow Analysis:
Interactive disassemblers may include advanced analysis techniques, such as symbolic execution and data flow analysis. These techniques help in tracking the flow of data and identifying potential vulnerabilities or security flaws in the code. - Patching and Binary Modification:
Interactive disassemblers often allow users to modify the binary code by patching instructions or replacing sections of code. This capability is useful for debugging or altering the behavior of a program. - Plugin Architecture and Scripting:
Interactive disassemblers often support plugins or scripting capabilities, enabling users to extend the tool's functionality and automate repetitive tasks. This facilitates custom analysis and the development of additional features.
Delve
 Delve is a powerful debugger for the Go programming language. It is designed to provide a rich set of debugging features specifically tailored for Go applications. Here's an overview of Delve's key features:
- Breakpoints and Tracing:
Delve allows developers to set breakpoints at specific lines of code or functions to pause program execution for inspection. It also supports conditional breakpoints and tracepoints for more advanced debugging scenarios. - Variable Inspection:
Delve provides a comprehensive set of commands to inspect variables, data structures, and memory locations during program execution. Developers can examine variable values, modify them for testing purposes, and navigate complex data structures with ease. - Goroutine and Concurrency Debugging:
Go's built-in concurrency features, such as goroutines and channels, can introduce unique debugging challenges. Delve offers specialized commands and features to debug goroutines, visualize their state, and detect and analyze concurrency-related issues. - Stack Traces and Call Stack Examination:
Delve allows developers to inspect stack traces and navigate the call stack, providing insights into the sequence of function calls leading to the current point of execution. This helps in understanding program flow and diagnosing issues. - Core Dump Analysis:
Delve supports the analysis of core dump files, which are generated when a Go program crashes. Developers can load core dump files into Delve, inspect the program's state at the time of the crash, and identify the cause of the failure. - Remote Debugging:
Delve includes built-in support for remote debugging, allowing developers to debug Go applications running on remote machines or containers. This feature is particularly useful for debugging distributed systems or applications deployed in production environments.
Xdebug
 Xdebug is a powerful and popular debugging extension for PHP. It is designed to assist PHP developers in analyzing and debugging their code effectively. Here's an overview of Xdebug's key features:
- Stack Traces:
Xdebug generates detailed stack traces when an error occurs, providing information about the function calls leading up to the error. This helps developers identify the exact location and context of the issue within their code. - Variable Inspection:
Xdebug allows developers to inspect variable values during program execution. They can view variables' contents, data types, and sizes, making it easier to understand and diagnose issues within the code. - Code Coverage Analysis:
Xdebug can generate code coverage reports, indicating which parts of the code were executed during a test run. This helps developers identify areas that are not covered by tests and improve overall code quality. - Profiling:
Xdebug enables profiling, which measures the execution time and memory usage of different parts of the code. Profiling data helps developers identify performance bottlenecks and optimize their applications for better efficiency. - Remote Debugging:
Xdebug supports remote debugging, allowing developers to debug PHP applications running on remote servers or virtual machines. This feature is particularly useful for debugging applications deployed in production environments. - Code Coverage Analysis:
Xdebug can generate code coverage reports, indicating which parts of the code were executed during a test run. This helps developers identify areas that are not covered by tests and improve overall code quality. - Profiling:
Xdebug enables profiling, which measures the execution time and memory usage of different parts of the code. Profiling data helps developers identify performance bottlenecks and optimize their applications for better efficiency.
KDbg
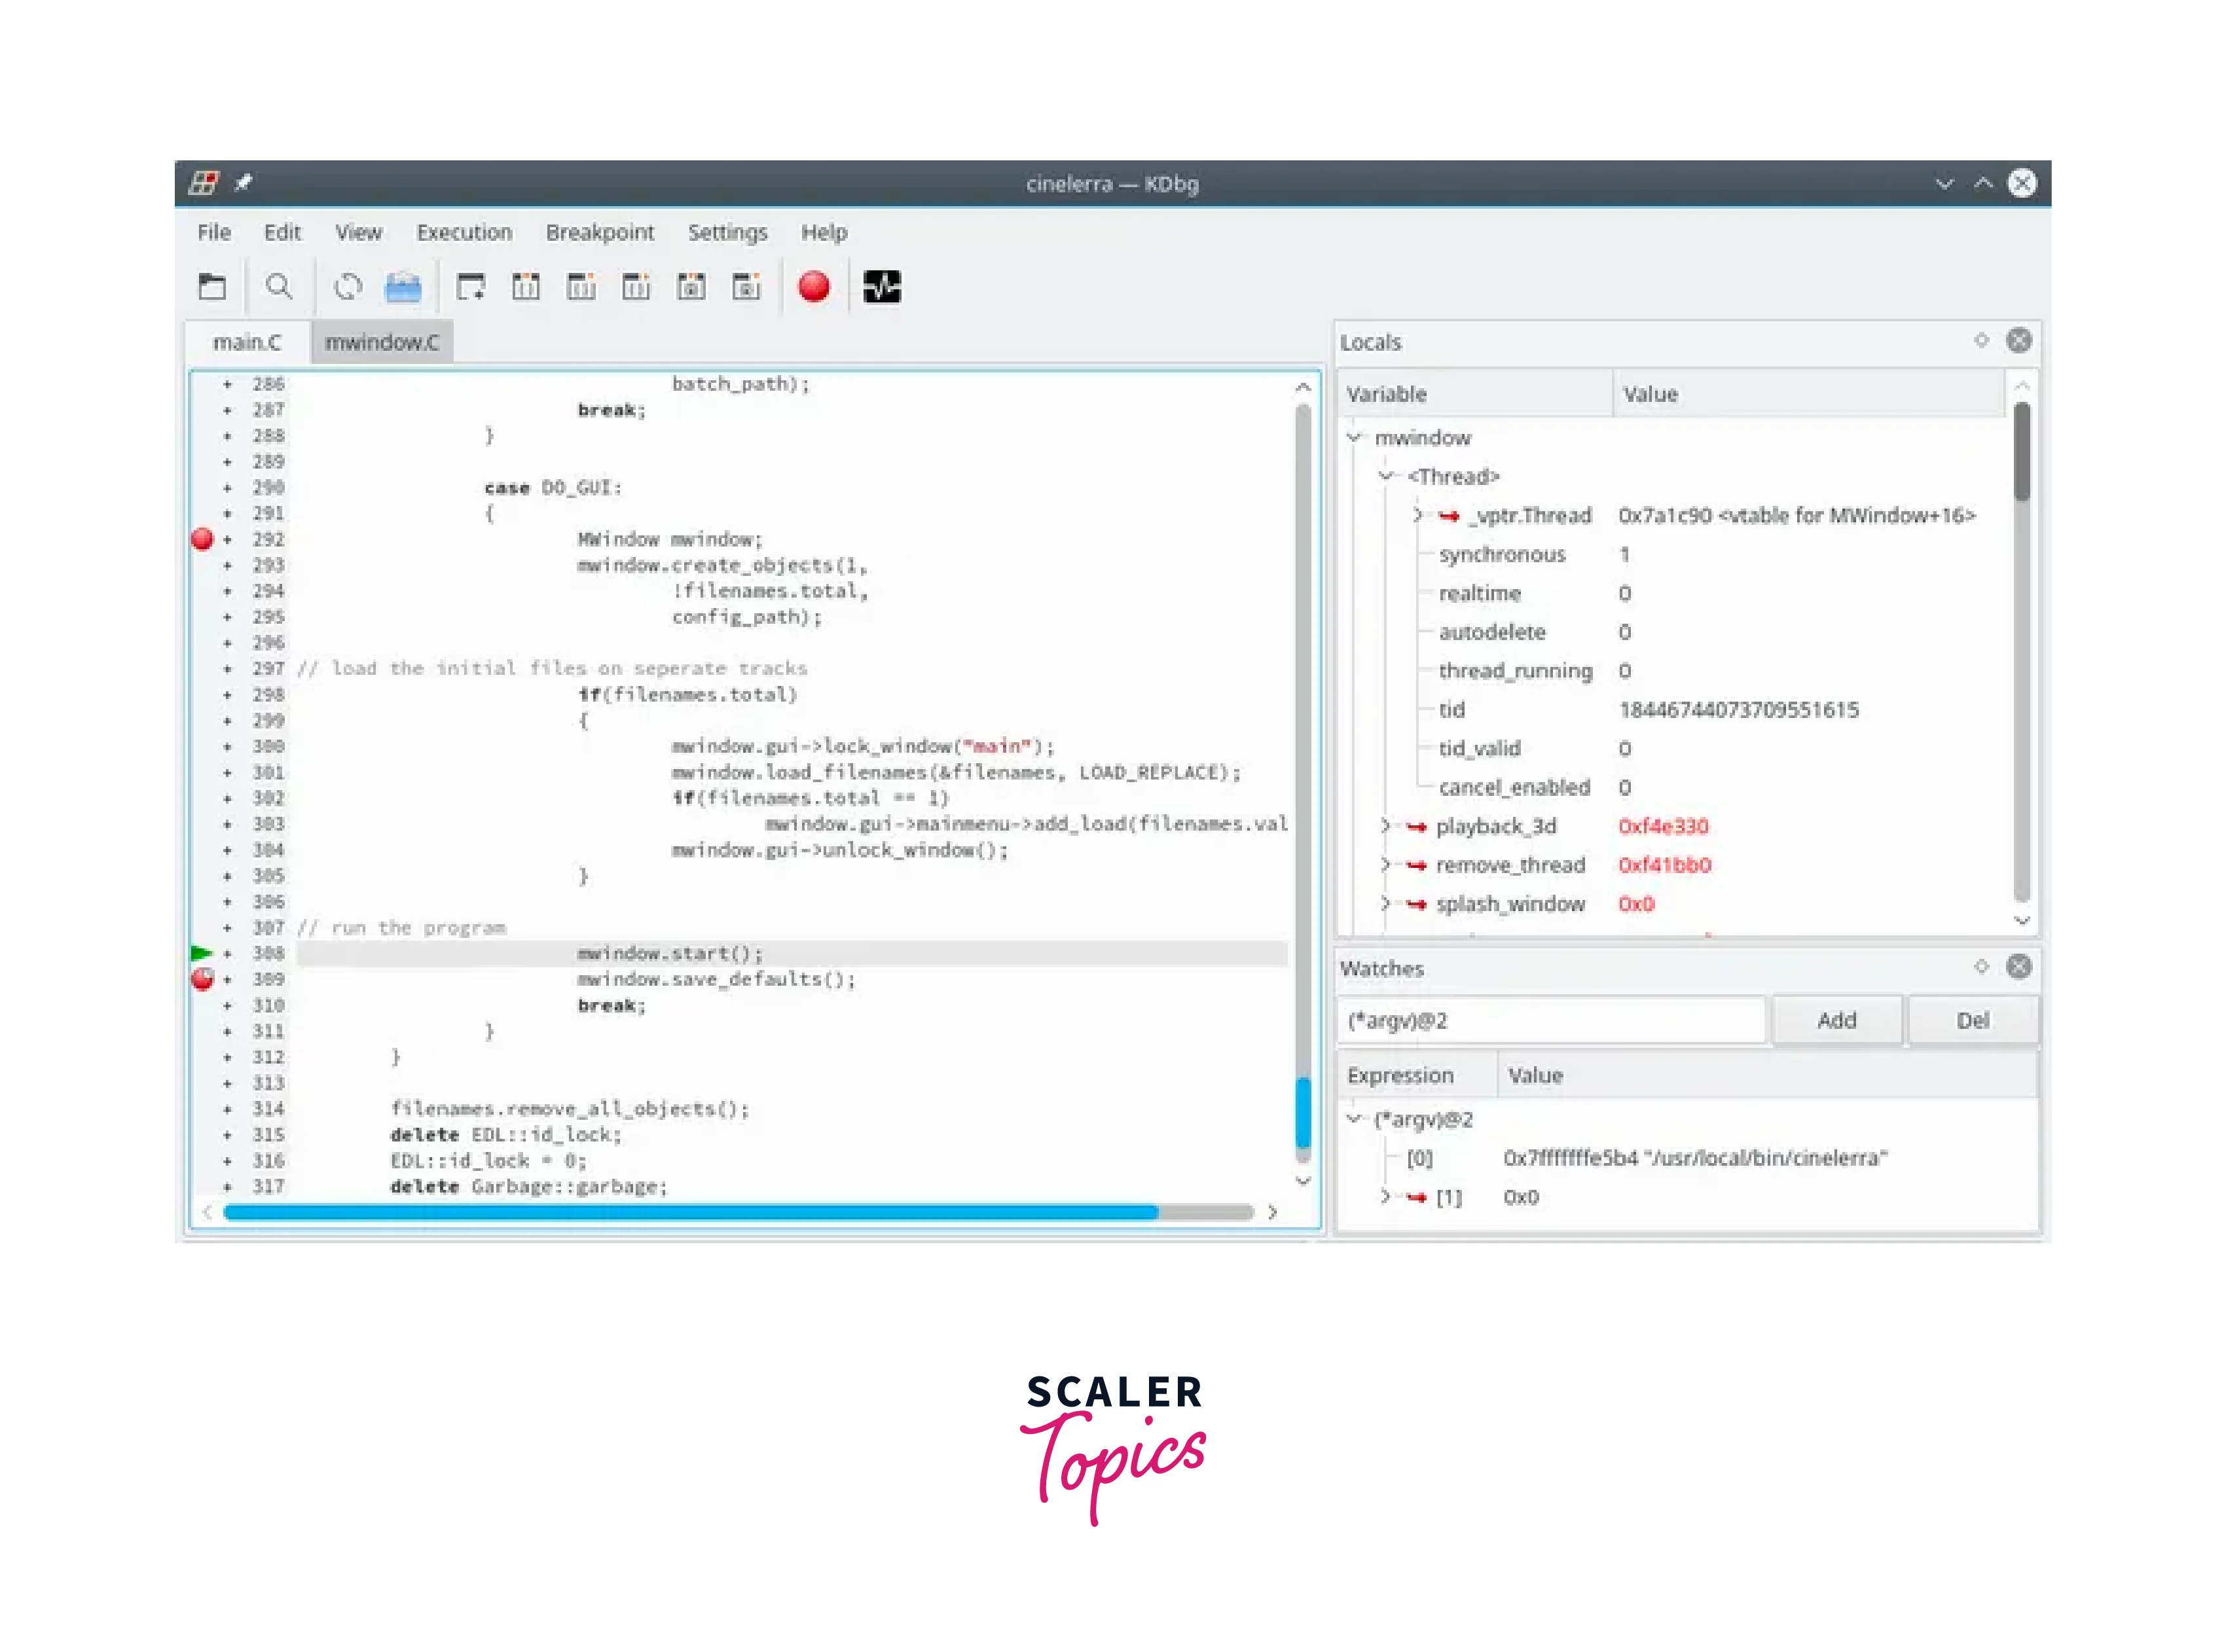 KDbg is a graphical debugger for the C, C++, and Fortran programming languages. It provides developers with a user-friendly interface and a range of features to assist in the debugging process. Here's an overview of KDbg's key features:
- Graphical User Interface (GUI):
KDbg offers a visually appealing and intuitive GUI, making it easy for developers to navigate and interact with the debugger. The interface provides various views, such as source code, breakpoints, call stack, variables, and memory contents. - Breakpoints and Stepping:
KDbg allows developers to set breakpoints at specific lines of code, functions, or memory addresses. They can manage breakpoints, enable/disable them, and specify conditions. Stepping features, such as stepping into, stepping over, and stepping out of functions, provide control over the debugging process. - Variable Inspection:
KDbg provides a dedicated view to inspect variable values during debugging. Developers can examine the contents of variables, arrays, and data structures, facilitating the understanding of the program's state at different execution points. - Call Stack Examination:
KDbg presents a call stack view that displays the sequence of function calls leading to the current point of execution. This helps developers understand the program's flow and identify the chain of function calls. - Memory Inspection:
KDbg allows developers to inspect and modify the contents of memory locations. This feature is particularly useful for debugging issues related to memory allocation, deallocation, or corruption. - Watchpoints:
KDbg supports watchpoints, allowing developers to monitor specific variables or memory locations for changes. This helps in tracking and analyzing the behavior of critical data during program execution. - Scripting Support:
KDbg offers scripting support using the JavaScript programming language. Developers can create custom scripts to automate tasks, extend the functionality of the debugger, or implement specific debugging workflows.
Valgrind
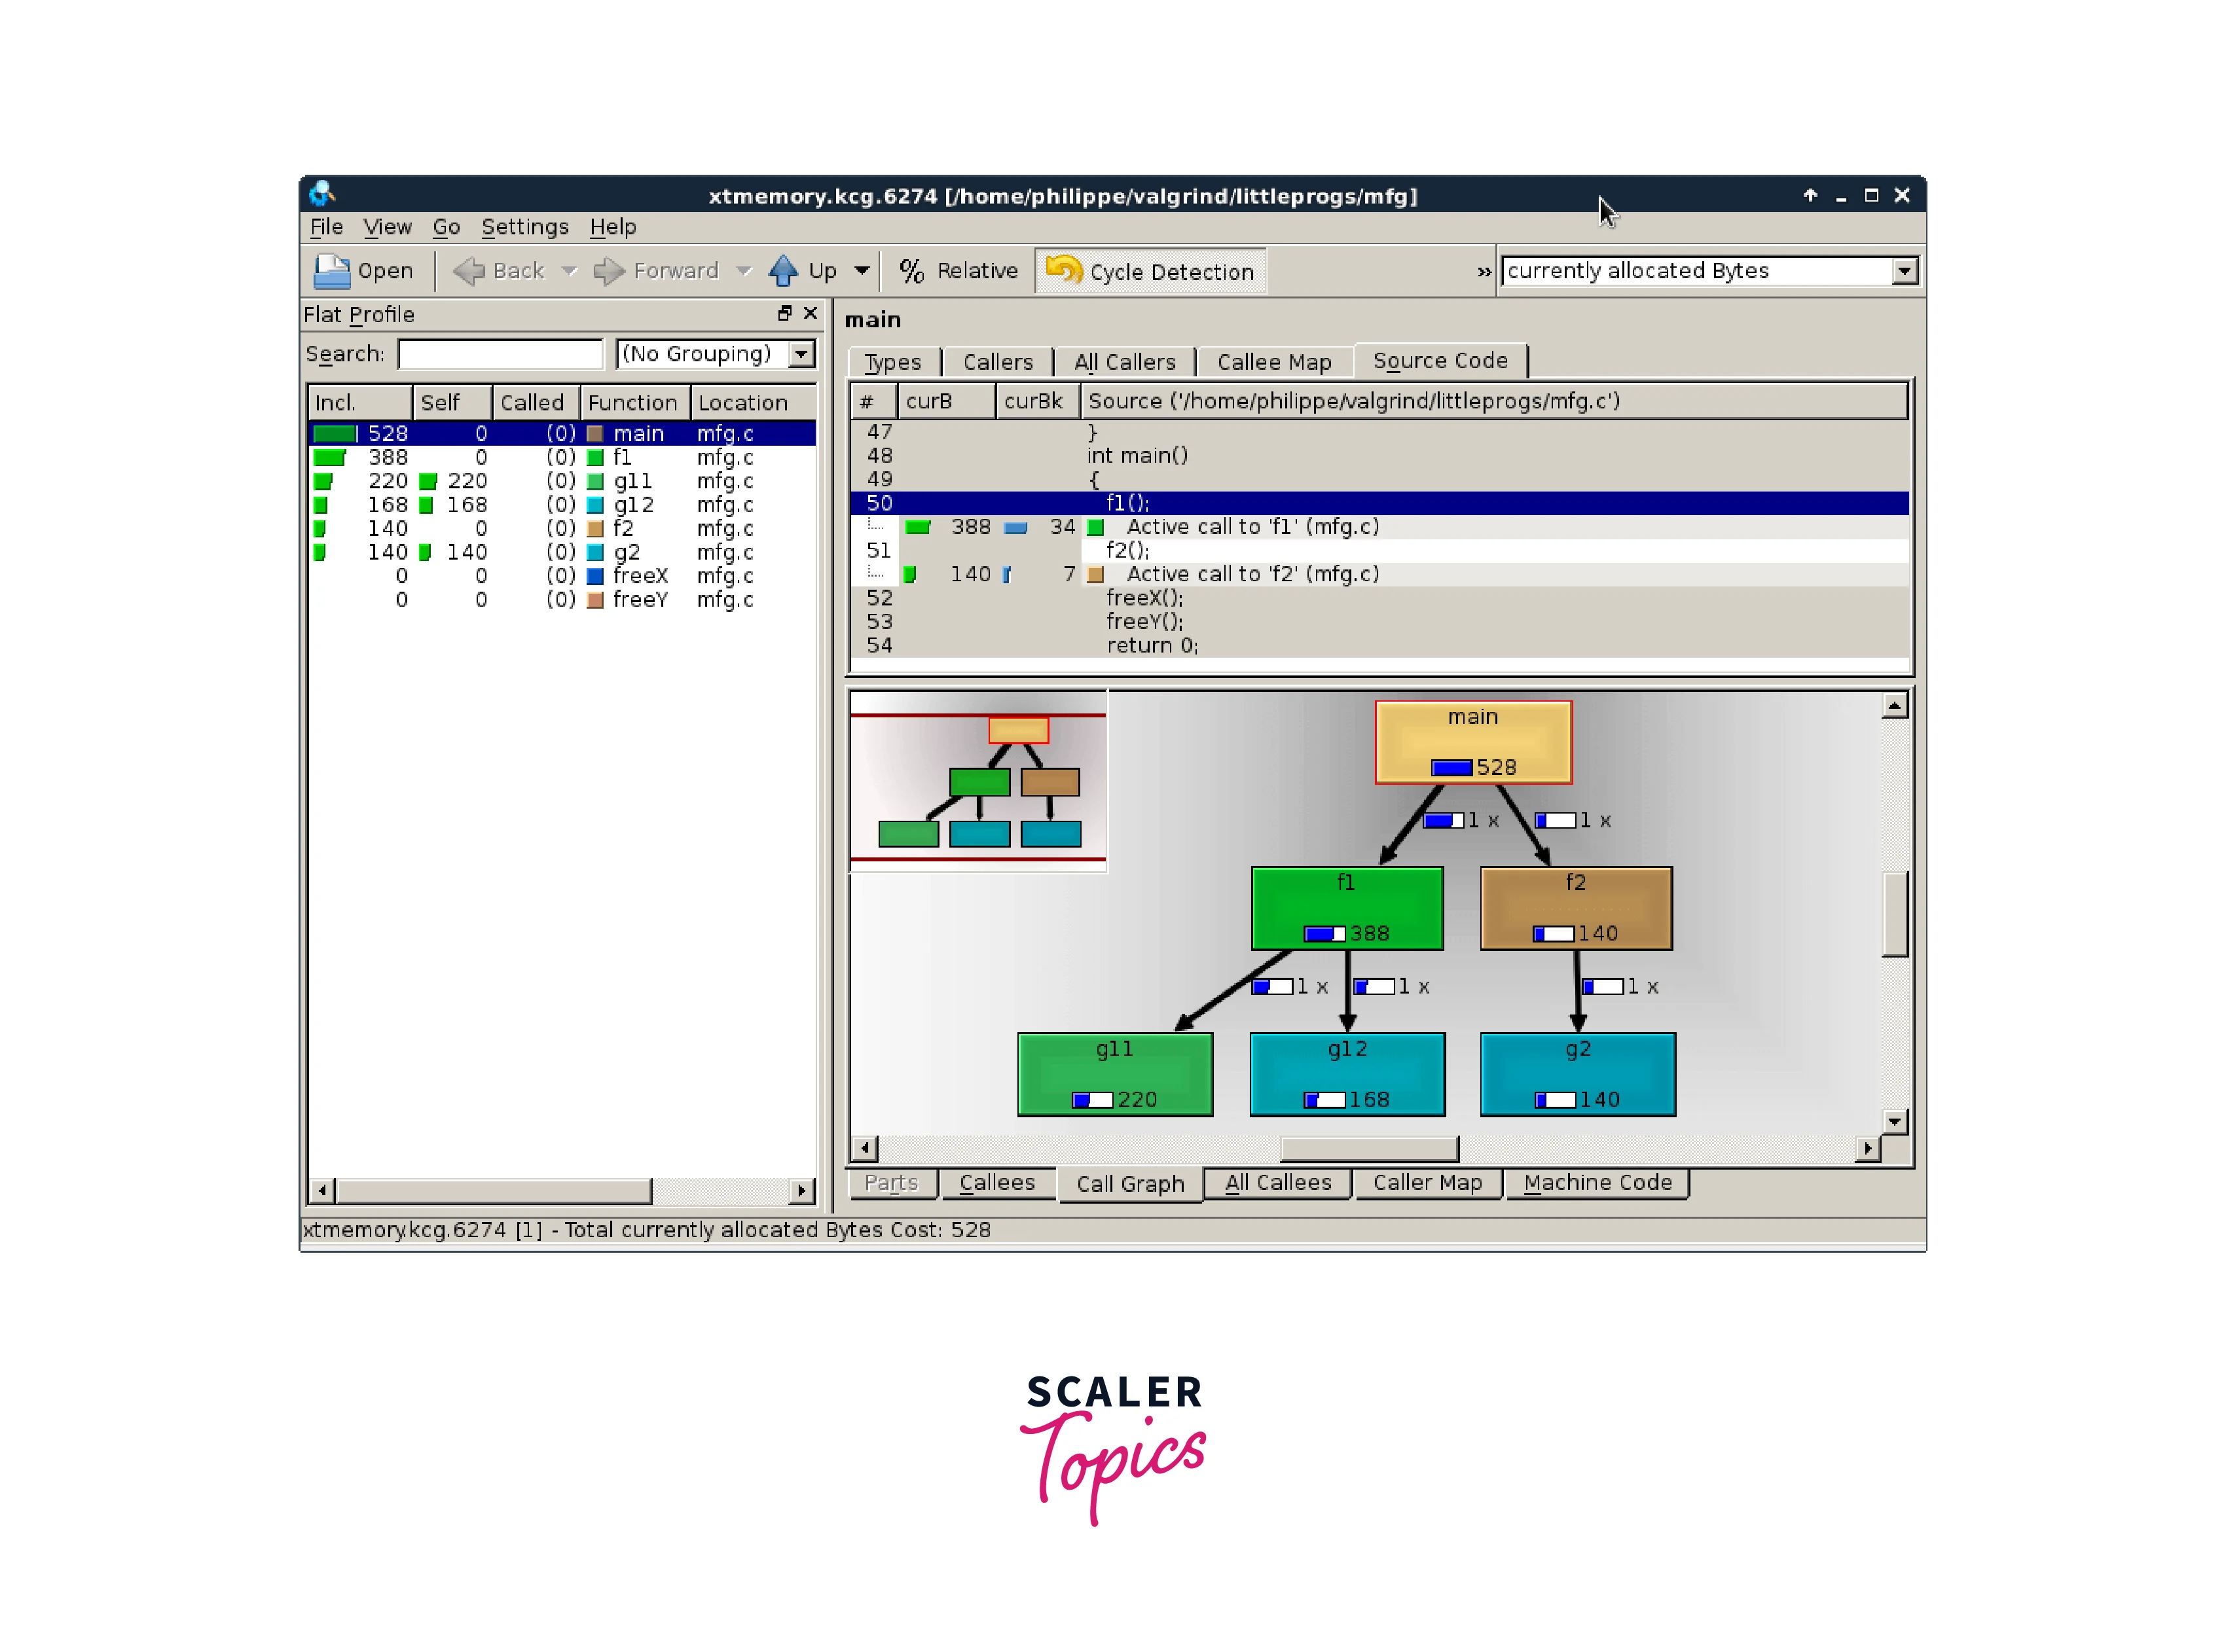 Valgrind is a powerful open-source tool designed for debugging and profiling programs on Linux. It provides a suite of tools that help detect various memory errors, such as memory leaks, invalid memory access, and uninitialized variables. Here's an overview of Valgrind's key features:
- Memory Error Detection:
Valgrind's Memcheck tool is widely used to detect memory errors. It can detect issues like reading from or writing to uninitialized memory, accessing memory after it has been freed, and invalid memory accesses. - Memory Leak Detection:
Valgrind tracks dynamically allocated memory and identifies memory leaks by detecting memory that has not been properly deallocated. This helps developers identify and fix memory leaks, preventing memory-related issues and resource exhaustion. - Thread and Synchronization Error Detection:
Valgrind's Helgrind tool analyzes thread synchronization and detects potential threading errors, such as data races, deadlocks, and thread misuses. This helps ensure thread safety and concurrency correctness in multi-threaded programs. - Heap and Stack Analysis:
Valgrind's Massif tool analyzes heap memory usage, providing a detailed memory profile that helps identify memory-intensive operations and optimize memory usage. Additionally, Valgrind can track stack usage and generate stack traces for debugging purposes. - Platform and Language Support:
Valgrind is primarily designed for Linux-based systems but can also be used on other platforms. It supports a wide range of programming languages, including C, C++, and Fortran.
BASH Debugger
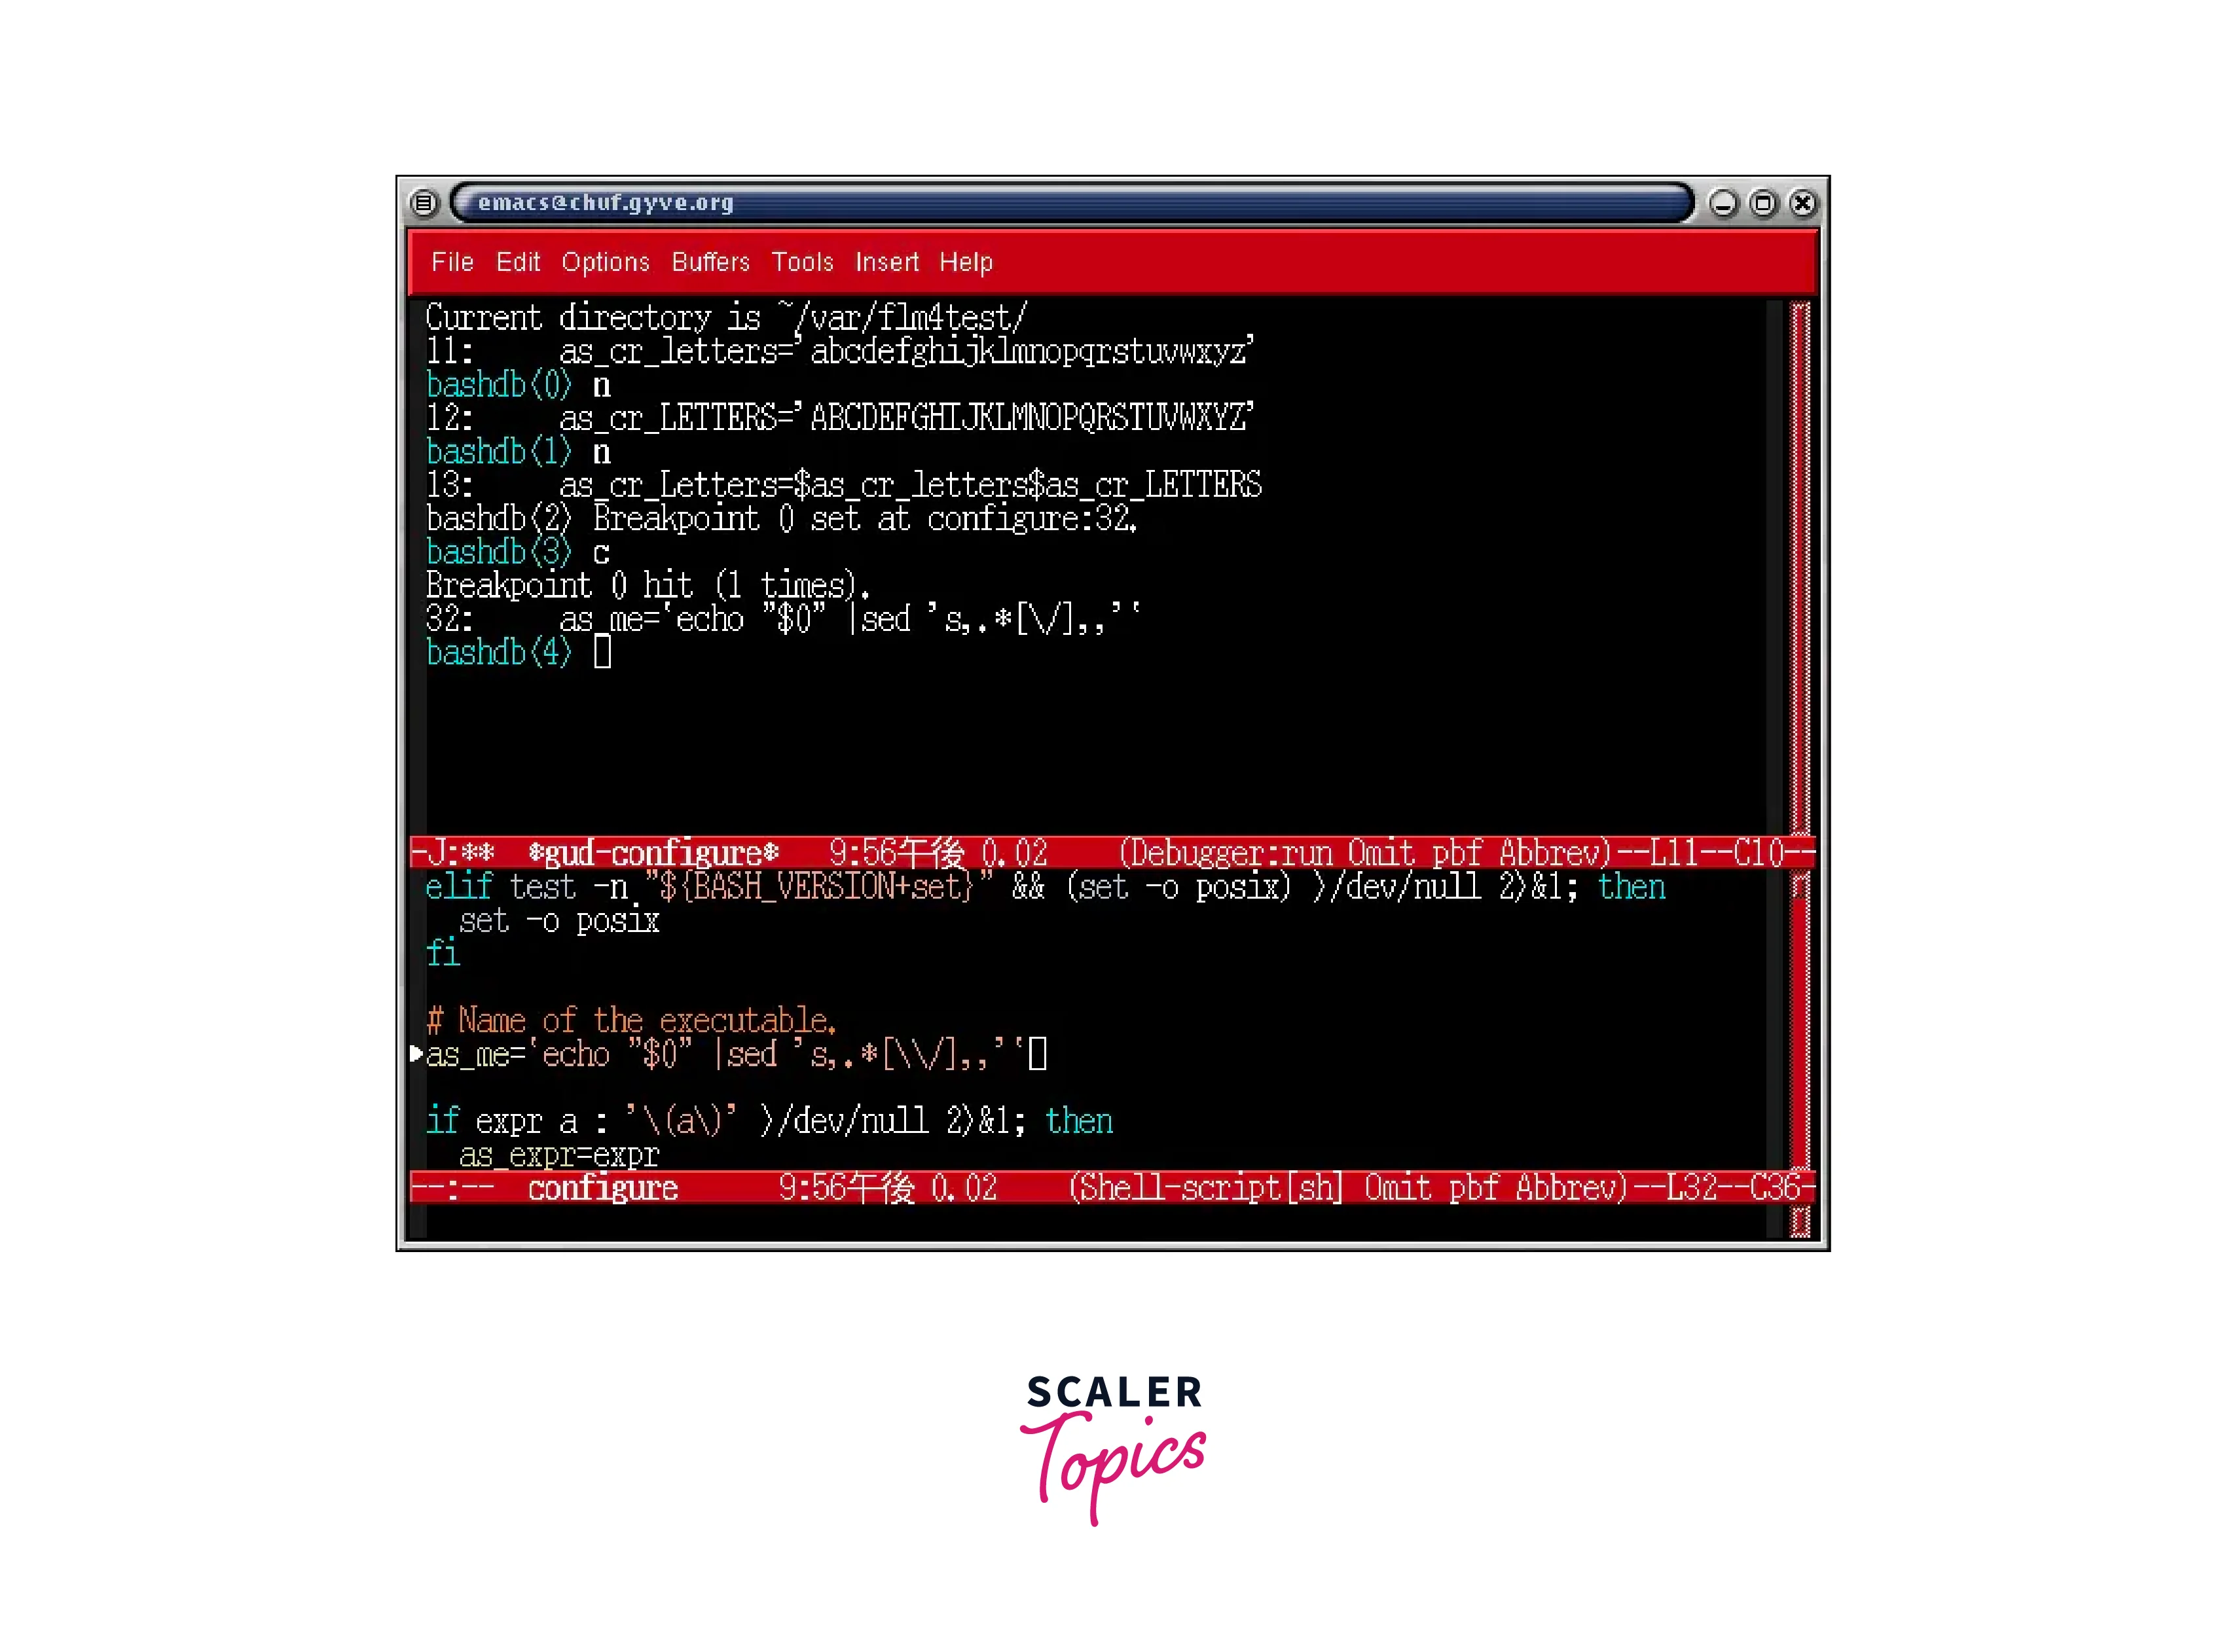 Bash Debugger (bashdb) is a command-line debugger specifically designed for the Bash shell scripting language. It allows developers to debug their Bash scripts by providing features like breakpoints, stepping, variable inspection, and more. Here's an overview of the Bash Debugger's key features:
- Breakpoints:
Bash Debugger allows developers to set breakpoints at specific lines or functions within a Bash script. When the script execution reaches a breakpoint, it pauses, allowing the developer to examine the script's state. - Stepping:
With the Bash Debugger, developers can step through their script's execution line by line, allowing them to analyze the behavior and flow of the code. Stepping options include stepping into functions, stepping over lines, and stepping out of functions. - Variable Inspection:
Bash Debugger provides the ability to inspect the values of variables during script execution. Developers can examine the contents of variables, arrays, and environment variables, helping them understand the state of the script at different points. - Tracepoints:
Tracepoints allow developers to trace specific commands or functions within a script. This feature helps track the execution flow and monitor the values of selected variables without pausing the script's execution. - Conditional Breakpoints:
Bash Debugger supports setting conditional breakpoints based on expressions. Developers can specify conditions under which the debugger should pause script execution, providing greater control over the debugging process. - Interactive Shell:
Bash Debugger offers an interactive shell mode, allowing developers to execute individual commands or test portions of their script within the debugging environment. This feature facilitates the testing and validation of code snippets. - Source Code Navigation:
Bash Debugger allows developers to navigate through the script's source code, displaying the current execution line and providing context for better understanding and analysis.
Strace
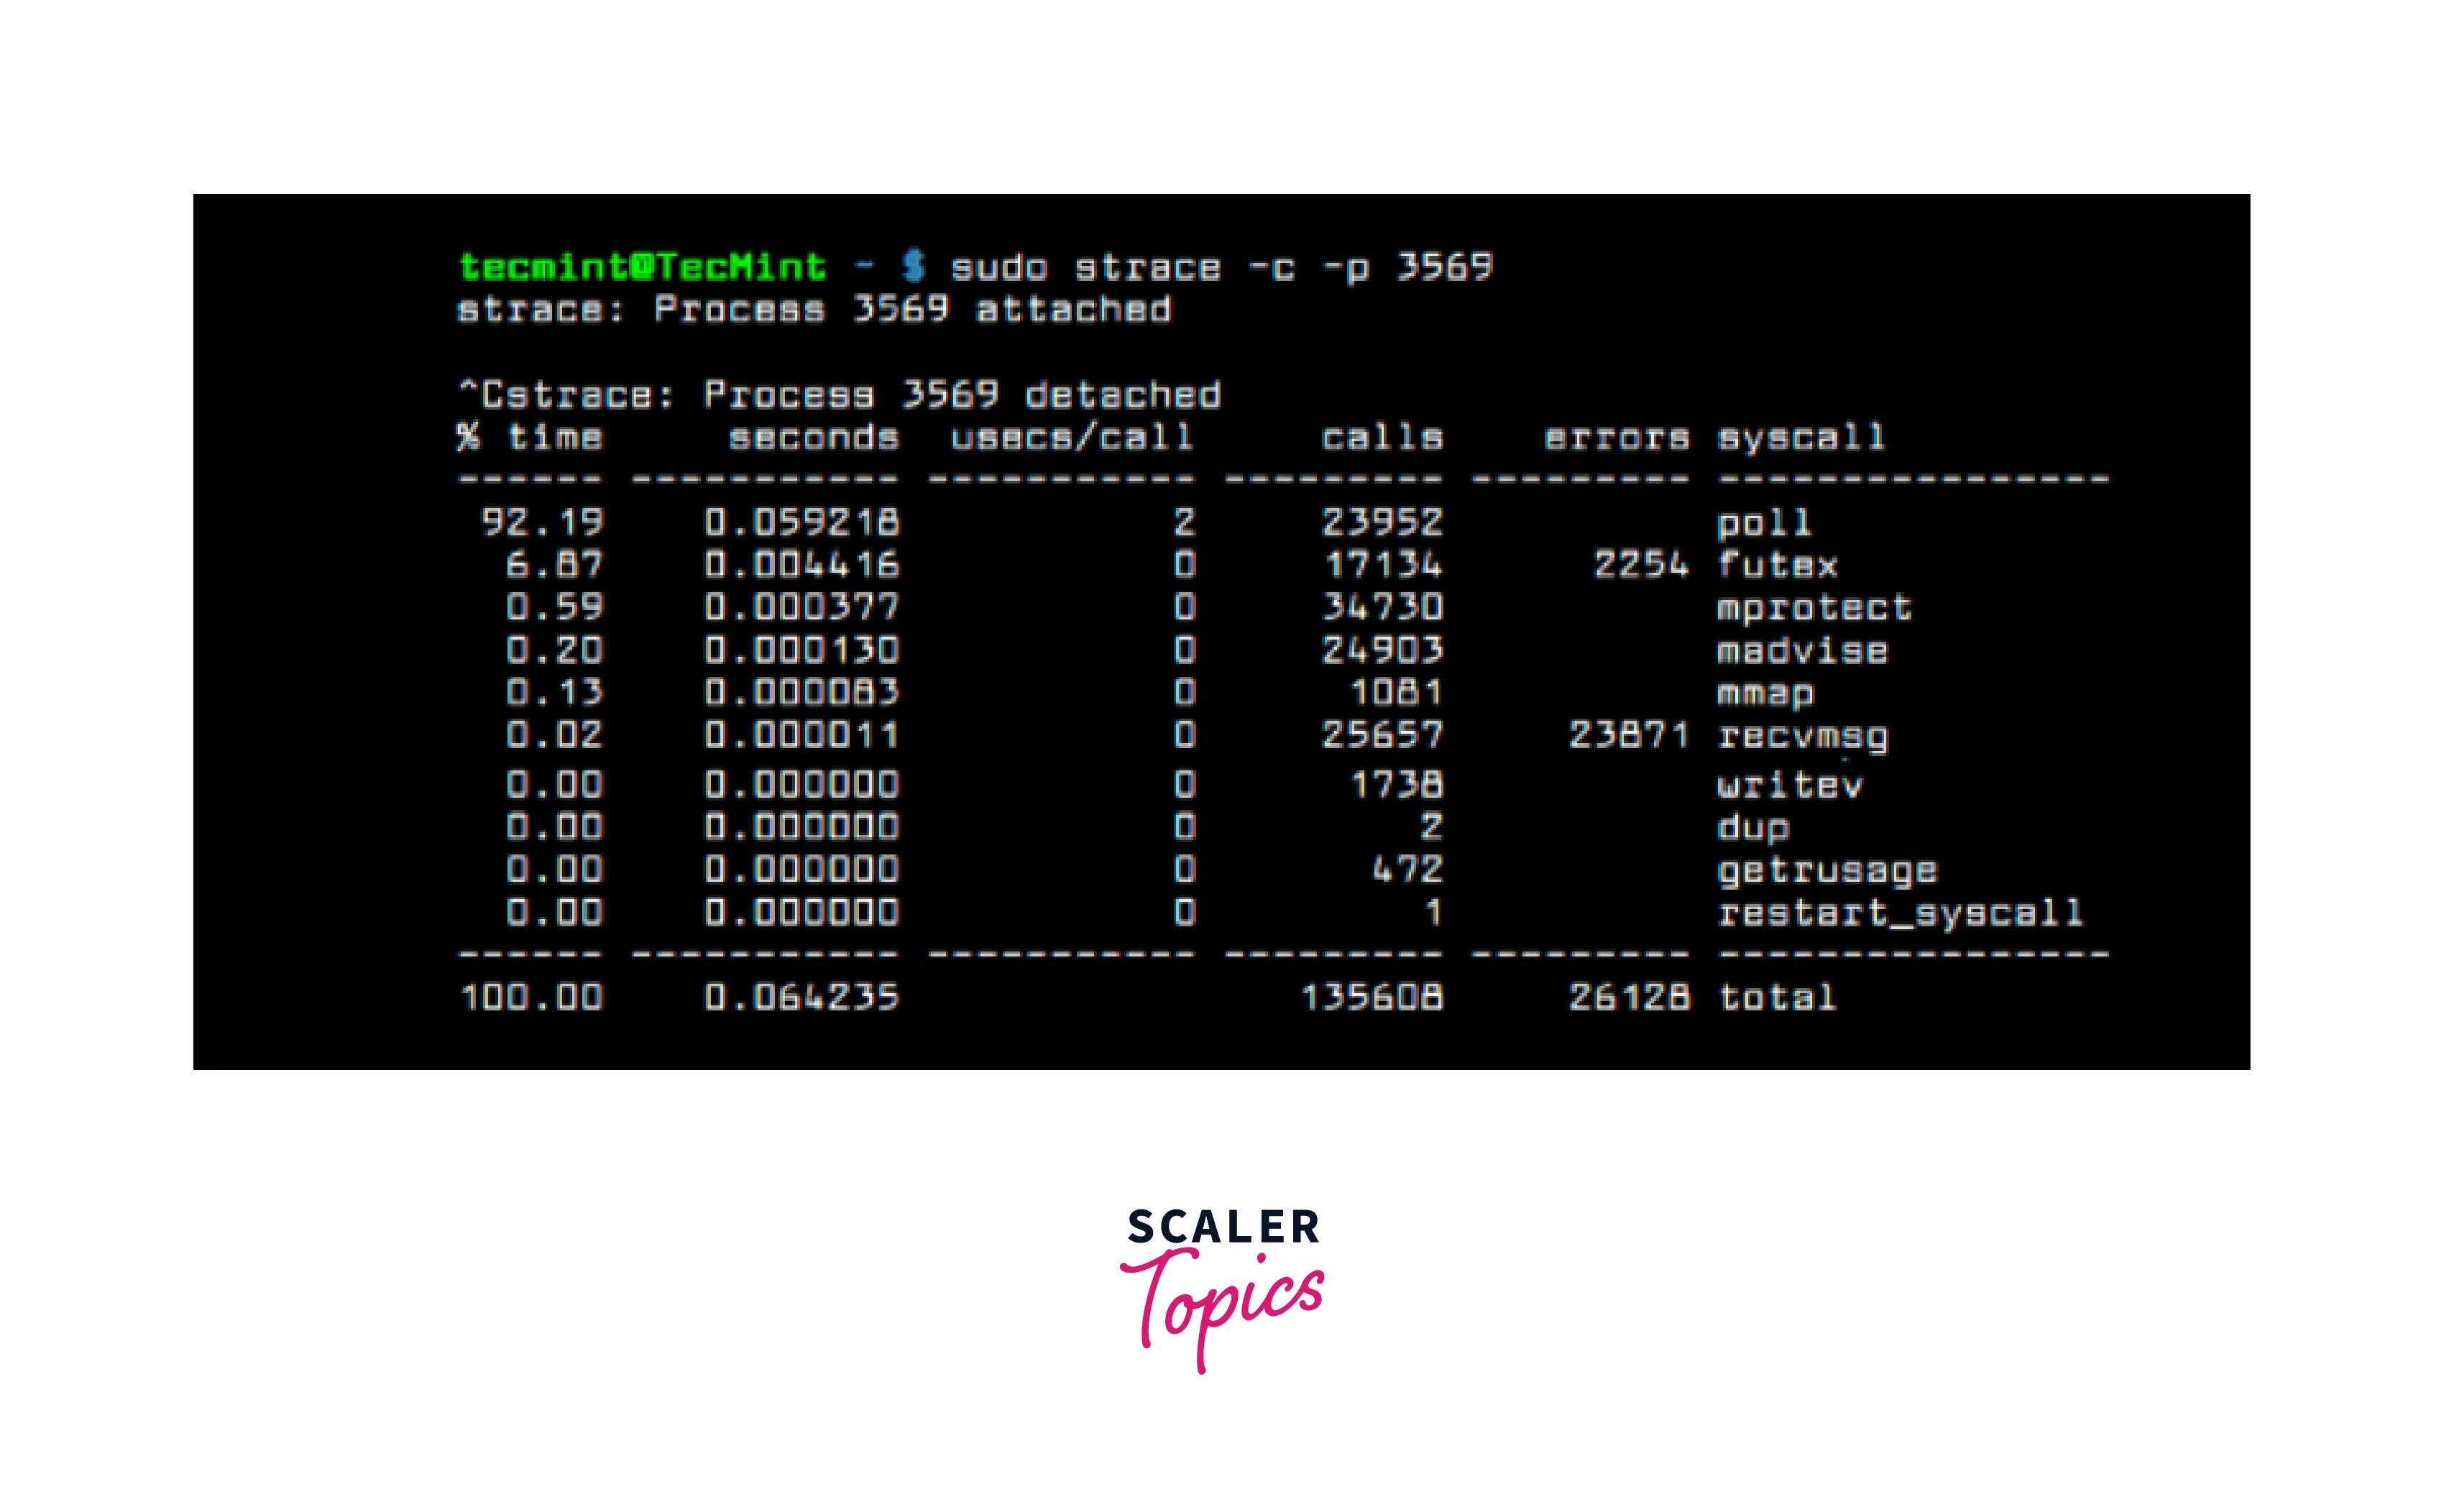 Strace is a powerful command-line tool used in Linux and other Unix-like operating systems to monitor and debug system calls made by a program. It allows developers and system administrators to observe and analyze the interactions between processes and the operating system. Here's an overview of Strace's key features:
- System Call Tracing:
Strace traces and records system calls made by a target program, including the arguments passed and the results returned. This provides insights into the system-level interactions and helps diagnose issues related to system calls. - Signal Tracing:
Strace can trace and display the signals received and sent by a program. This helps in understanding the signal handling behavior and detecting any abnormal signal interactions. - Error Reporting:
Strace captures and displays error messages generated by system calls, providing valuable information about the cause of failures or unexpected behavior in a program. - Time Stamping:
Strace can record the timestamps for each system call, allowing developers to measure the time taken by specific operations and identify performance bottlenecks. - Filtering and Selective Tracing:
Strace offers filtering options to selectively trace specific system calls or only certain processes. This allows focusing on relevant system calls and reduces the noise in the output. - File and Network I/O Tracing:
Strace can trace file operations, network communication, and other I/O-related activities. It provides details such as file descriptors, read and write operations, network socket operations, and more, helping in understanding I/O behavior and diagnosing related issues. - Post-Execution Analysis:
Strace captures a detailed log of system call activity, which can be analyzed later for debugging or performance analysis purposes. This allows developers to review the system call sequence and investigate issues that occurred during program execution.
pwndbg
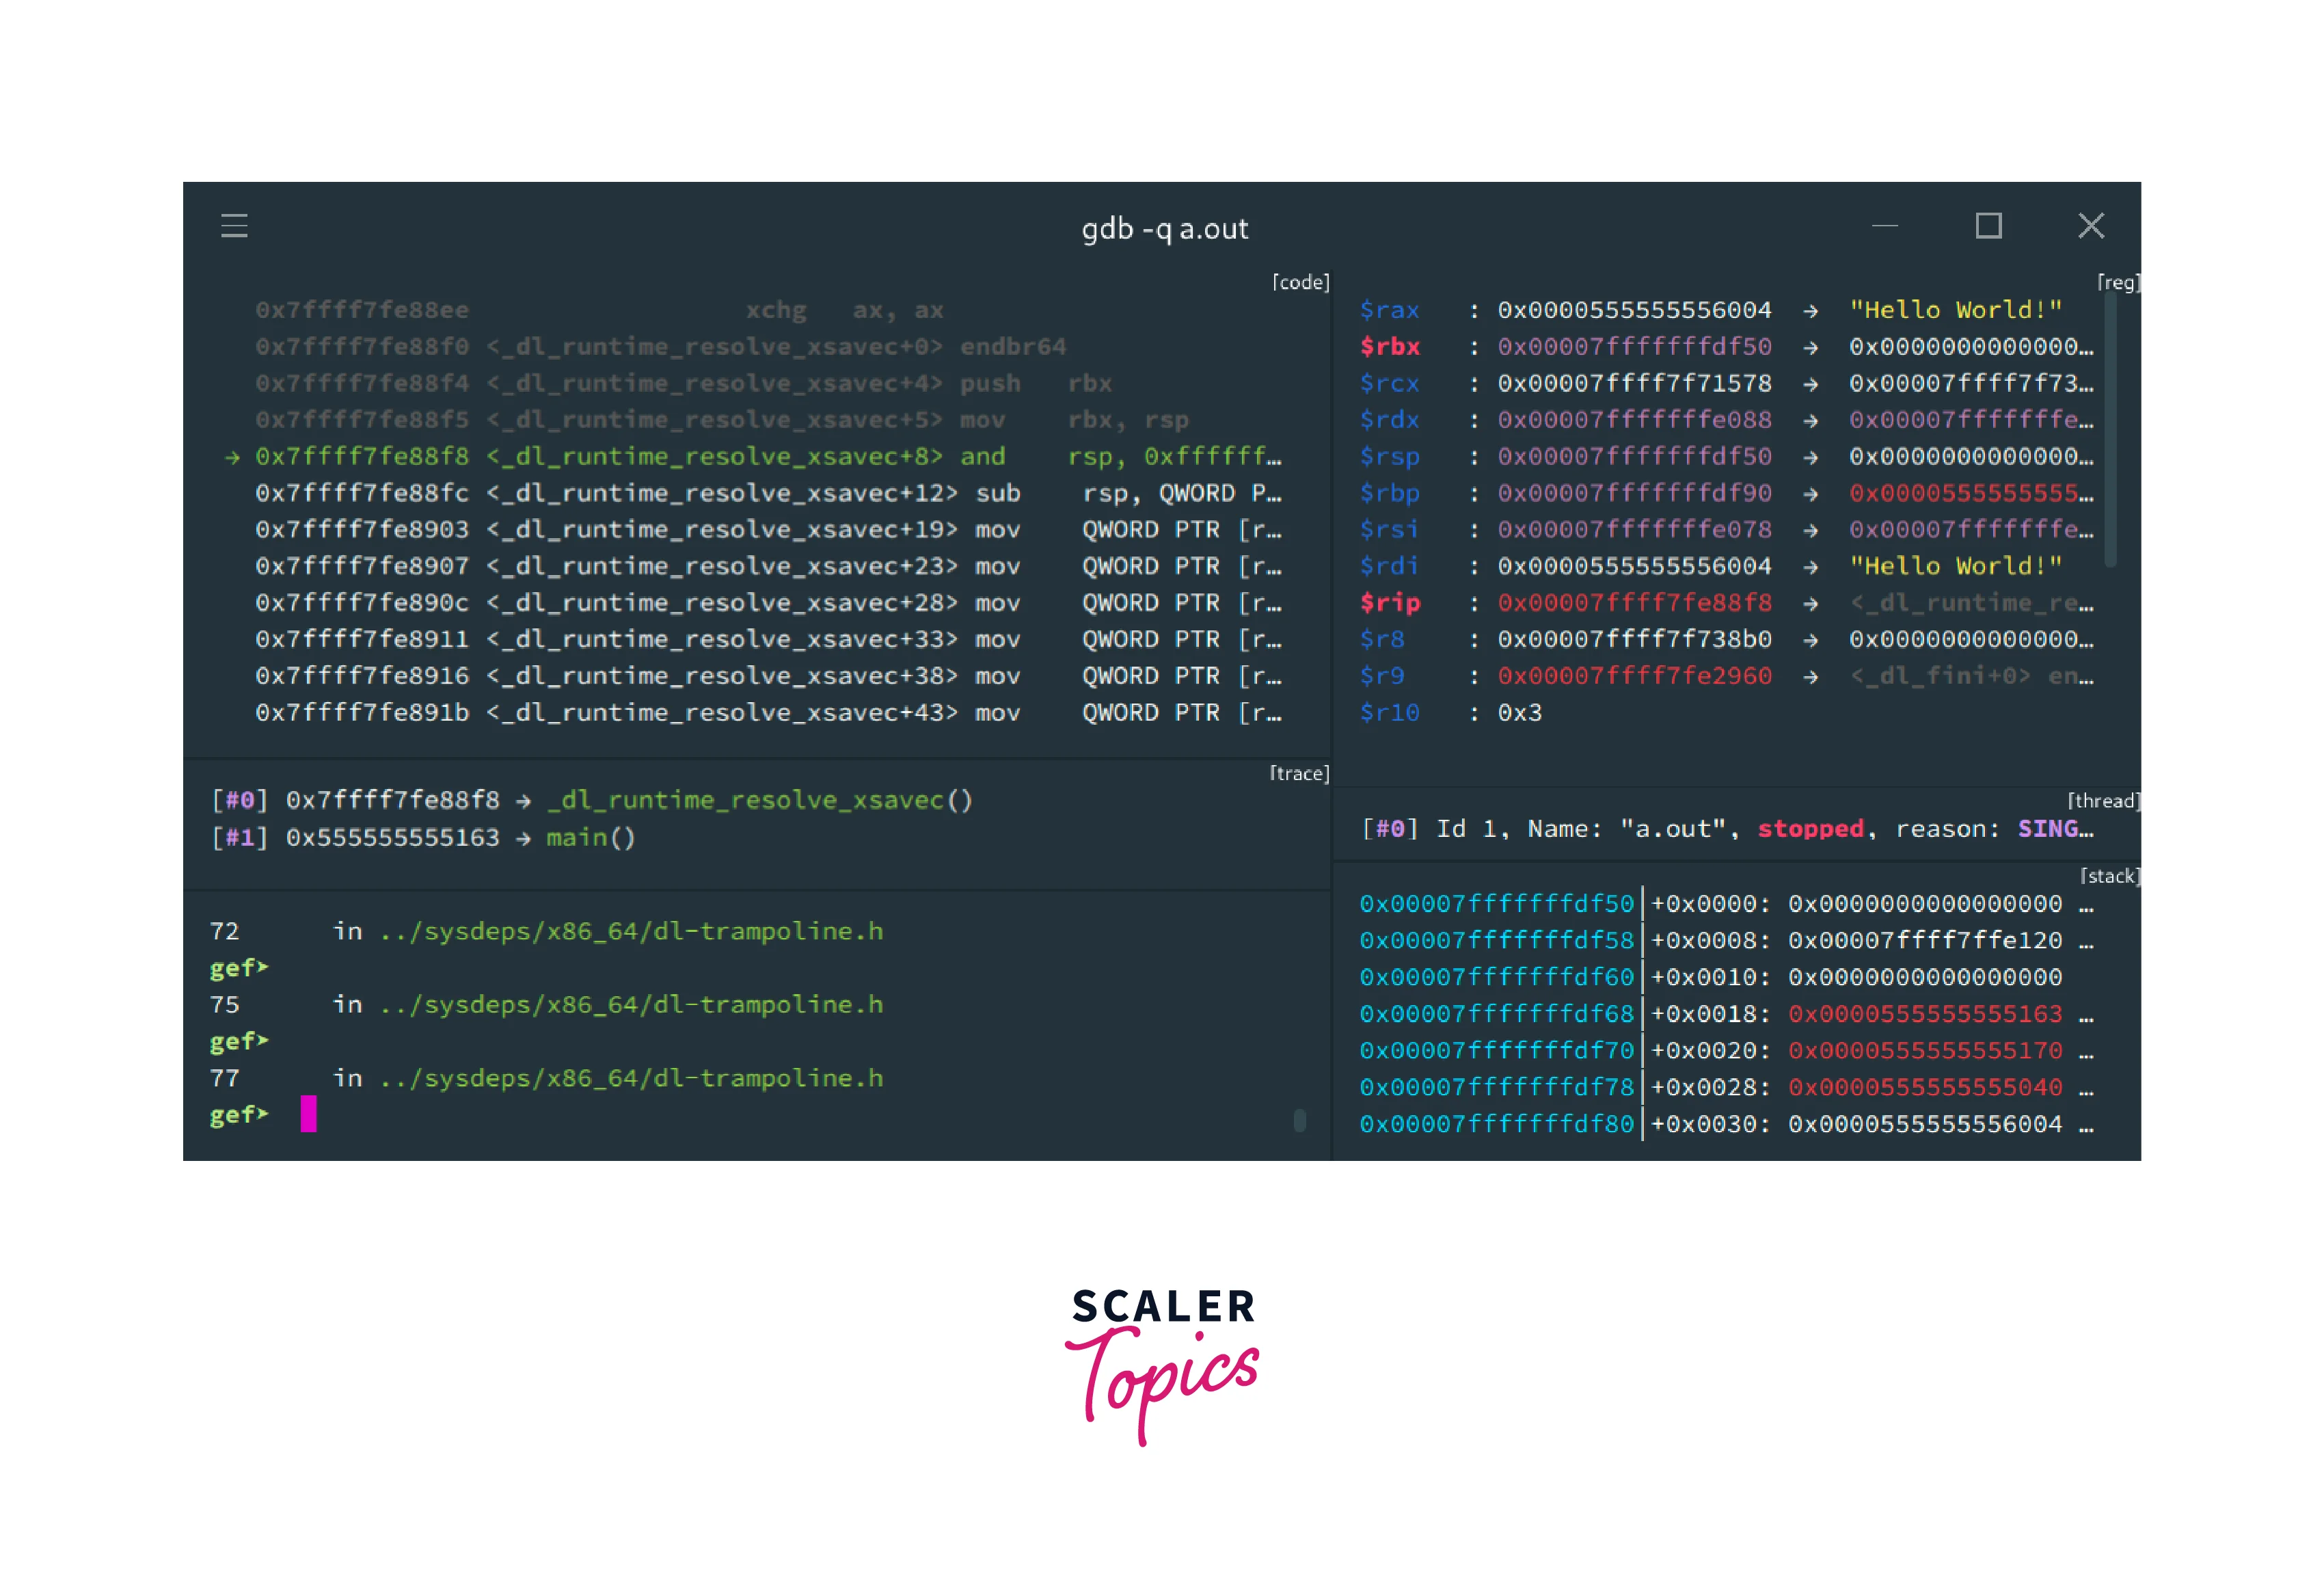
Pwndbg is a popular debugger extension specifically designed for exploit development and binary analysis in the context of Capture The Flag (CTF) competitions. It is an enhanced version of the GDB (GNU Debugger) and provides additional features and improvements for debugging and analyzing vulnerable binaries. Here's an overview of Pwndbg's key features:
- Exploit Development Features:
Pwndbg offers several features tailored for exploit development, such as automatic detection and highlighting of vulnerable functions, memory layout visualization, and utilities for generating and manipulating shellcode. - Enhanced Display:
Pwndbg improves the display of important information during debugging sessions. It provides colored output for registers, flags, and memory addresses, making it easier to understand the state of the program. - Context-Sensitive Help:
Pwndbg provides context-sensitive help for various commands and functionalities. It offers documentation and explanations specific to exploit development and CTF challenges, helping users quickly understand and utilize the available features. - Breakpoint Management:
Pwndbg includes advanced breakpoint management capabilities. It supports hardware breakpoints, software breakpoints, and breakpoints based on specific conditions, making it easier to control the flow of execution during debugging. - Exploitation Aid:
Pwndbg includes features to aid in exploitation, such as a built-in cyclic pattern generator for identifying buffer overflows, stack analysis tools, and facilities for examining function prologues and epilogues. - Stack Visualization:
Pwndbg provides enhanced stack visualization, allowing users to inspect and navigate stack frames, local variables, and function call information. This feature is particularly useful for understanding the runtime behavior of vulnerable programs. - Integration with Other Tools:
Pwndbg integrates well with other tools commonly used in exploit development, such as IDA Pro and Binary Ninja. It offers seamless transitions between these tools, enhancing the overall workflow.
Conclusion
- Debugging is an essential process in software development, allowing developers to identify and fix issues in their code.
- GNU Debugger (GDB) is a powerful and widely used linux debugger, offering features like breakpoints, stepping, and variable inspection.
- LLDB is another popular debugger alternative to GDB, known for its multi-platform support and integration with the LLVM compiler infrastructure.
- Nemiver is a graphical debugger designed specifically for the GNOME desktop environment, providing an intuitive interface for debugging C and C++ programs.
- Interactive Disassemblers, such as objdump and radare2, help analyze and understand the low-level assembly code of programs.
- Delve is a debugger designed for the Go programming language, providing features like breakpoints, stepping, and variable inspection tailored for Go development.
- Xdebug is a powerful debugger for PHP, enabling developers to debug PHP applications by providing features like breakpoints, stack traces, and profiling capabilities.
- KDbg is a graphical debugger for C, C++, and Fortran, offering features like breakpoints, variable inspection, and integration with the KDE development environment.
- Valgrind is a versatile tool used for debugging and profiling programs on Linux, offering features like memory error detection, performance profiling, and thread synchronization analysis.
- Strace is a command-line tool used to monitor and debug system calls made by a program, helping developers understand interactions between processes and the operating system.
- Pwndbg is an enhanced version of GDB designed for exploit development and binary analysis in CTF competitions, offering features specific to vulnerability analysis and exploitation.