What is the Linux perf Command?
Linux perf is a lightweight CPU profiling command-line utility that examines CPU performance counters, tracepoints, upprobes, and kprobes, monitors program events, and generates reports. It is the Linux kernel's performance monitoring subsystem. It is widely used to gather performance-related information such as CPU performance counters, hardware events, software events, and kernel events.
How to Install Perf
To use the perf command on Linux, you must first install the Linux kernel's perf tools package. The process of installing the perf command in Linux varies depending on the Linux distribution, however, here are the general steps for some popular distributions:
-
Ubuntu/Debian: To install perf on Ubuntu/Debian, execute the following commands:
-
RHEL/CentOS: To install perf on RHEL/CentOS, execute the following commands:
-
Fedora: To install perf on Fedora, execute the following commands:
When the installation is finished, the perf command should be available on your system. Run the following command to verify that Pef is installed:
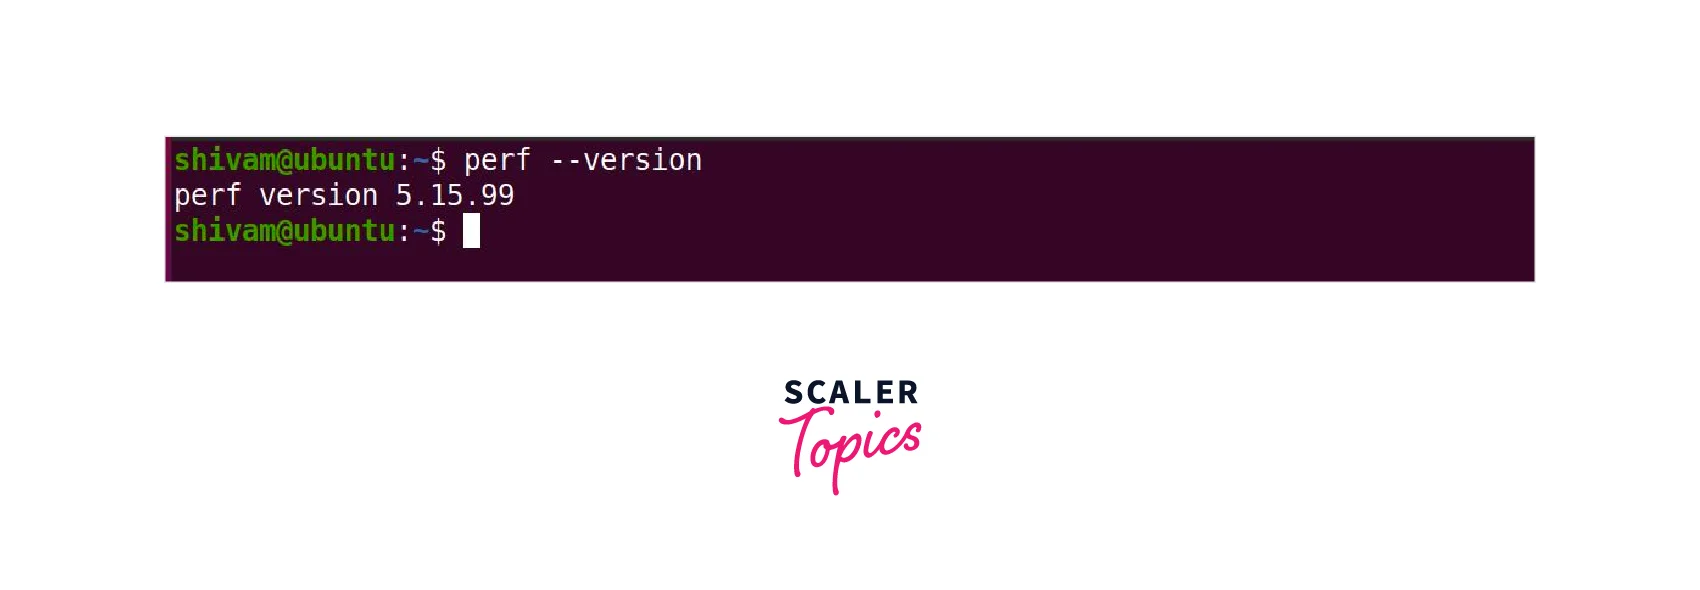
The version number is printed in the output, indicating that the installation was successful.
Note:- The Linux perf command may not provide complete results when used on virtualization platforms like VMware or VirtualBox. This is because, unlike KVM or XEN, these virtualization technologies do not allow direct access to hardware counters. It is suggested to use perf on a physical machine or a virtual machine running on KVM or XEN virtualization technologies to acquire the most reliable and accurate results.
Linux Perf Basic Syntax
The syntax of the Linux perf command is as follows:
In the above syntax, options are the different flags and arguments that can be used to control the behaviour of the perf command, and the command is the executable or script that you want to analyze with perf. The arguments are the optional arguments or parameters required by the command you're analyzing.
By default, the perf command is only accessible to the root user. To enable normal users to utilise perf, execute the following command:
This command allows regular users to utilise the perf utility in the current session. To make the changes permanent, edit the /etc/sysctl.conf file.
After that add the following line.
After that, save the changes and exit.
Linux Perf Subcommands
In Linux, the perf command has several subcommands for performing various performance analysis tasks.
Here are some commonly used perf subcommands:
| Sr. No. | Subcommand | Description |
|---|---|---|
| 1. | annotate | This subcommand reads perf.data and shows annotated code. |
| 2. | list | This subcommand lists all measurable events. |
| 3. | record | This subcommand is used to record samples of various events into a file called perf.data. |
| 4. | stat | This subcommand is used to gather and display performance statistics for a given command or program. |
| 5. | report | This subcommand reads the perf.the data file generated by the perf record command and displays a detailed profile based on the recorded performance data. |
| 6. | top | This subcommand is a profiling tool that displays the functions which consume the most CPU cycles or other specified performance events during execution. |
| 7. | script | This subcommand reads the perf.the data file generated by the perf record command and displays trace output based on the recorded performance data. |
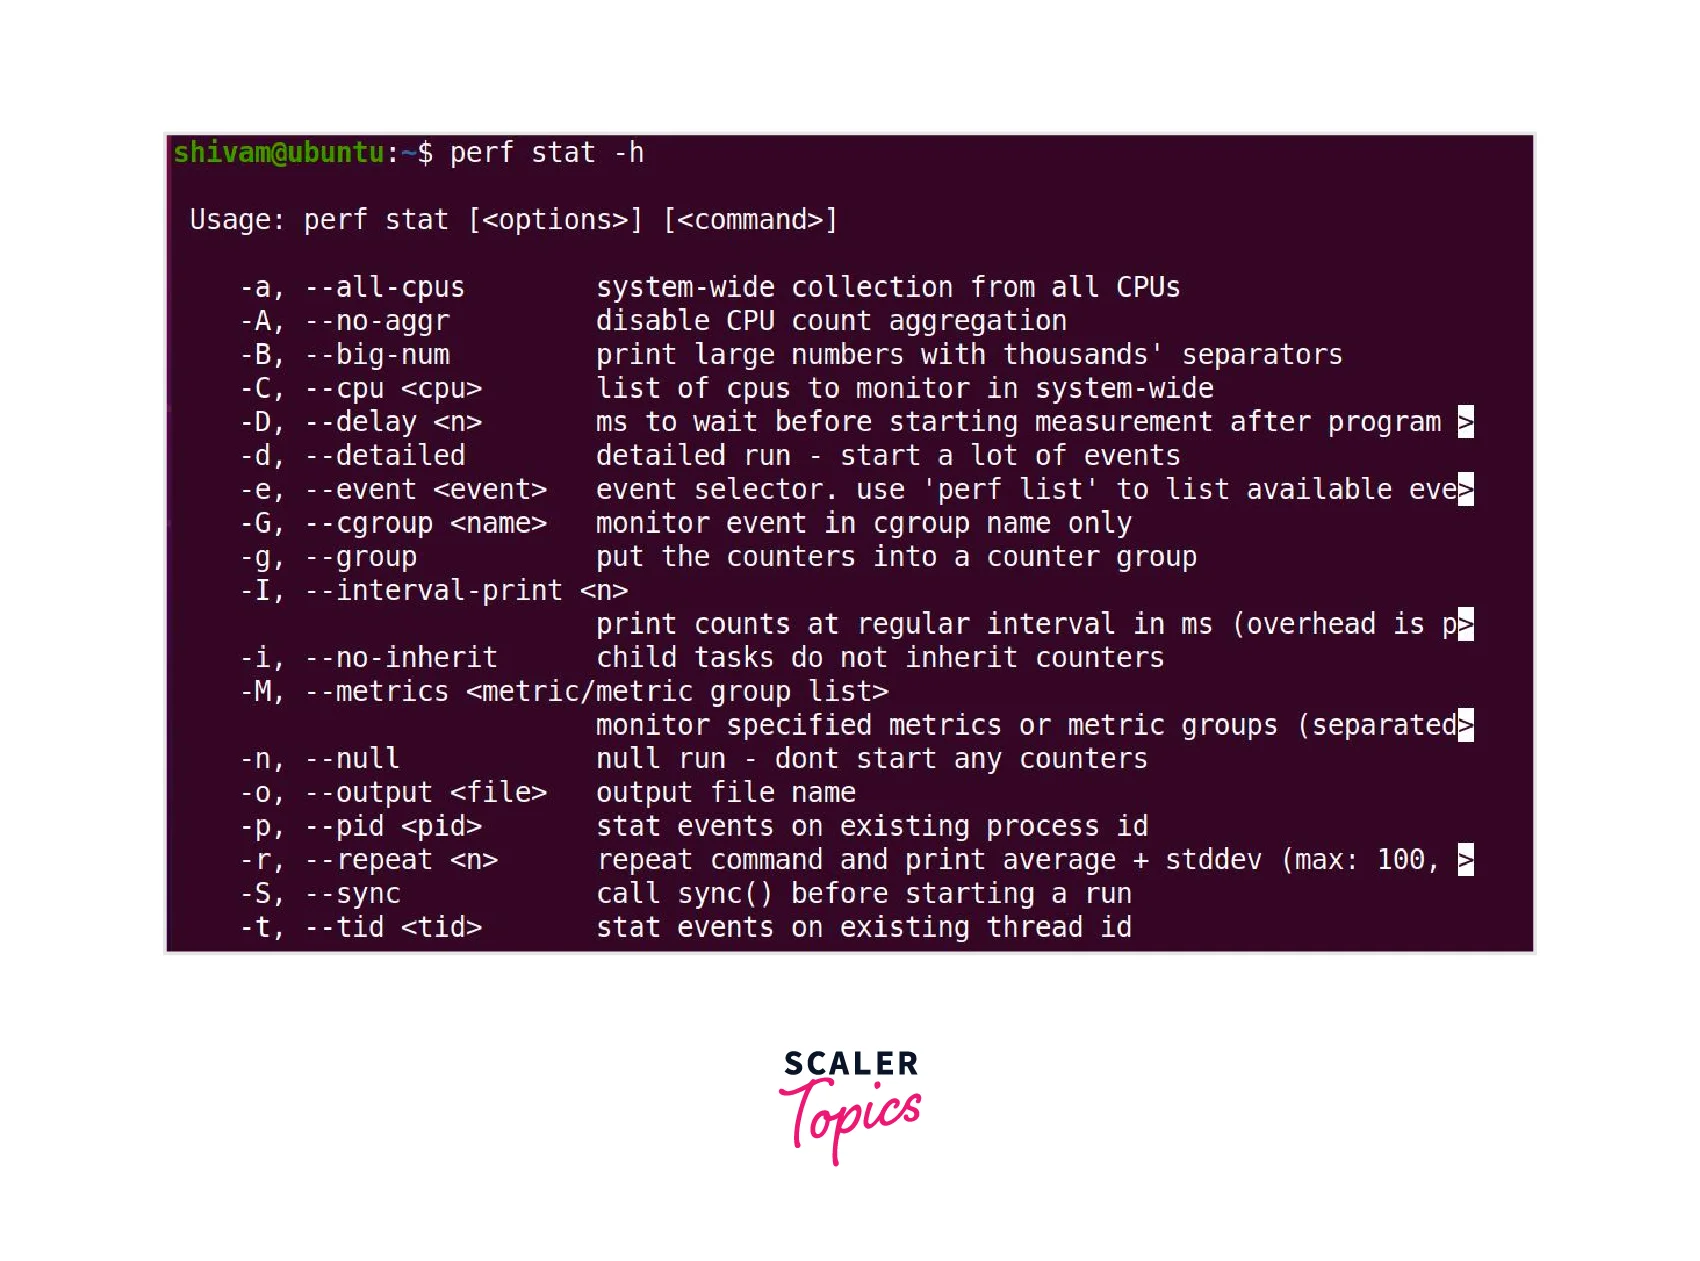
Subcommands have additional options. To see options for particular subcommands, run:
Example:
How to Use Linux Perf Command?
The perf command in Linux is a useful tool for analyzing system performance. To use it, first use "perf list" to locate available events that can be monitored. Then, "perf stat" allows you to count and show performance statistics for the entire system or a specific command. If you want to record events for further analysis, use "perf record" to write them to a file. Following that, "perf report" allows you to browse and analyze the recorded file, providing full information on events along with statistics. Finally, "perf script" can be used to dump and analyze the events from the recorded file, allowing for further in-depth analysis and interpretation of the data.
1. Listing Events:
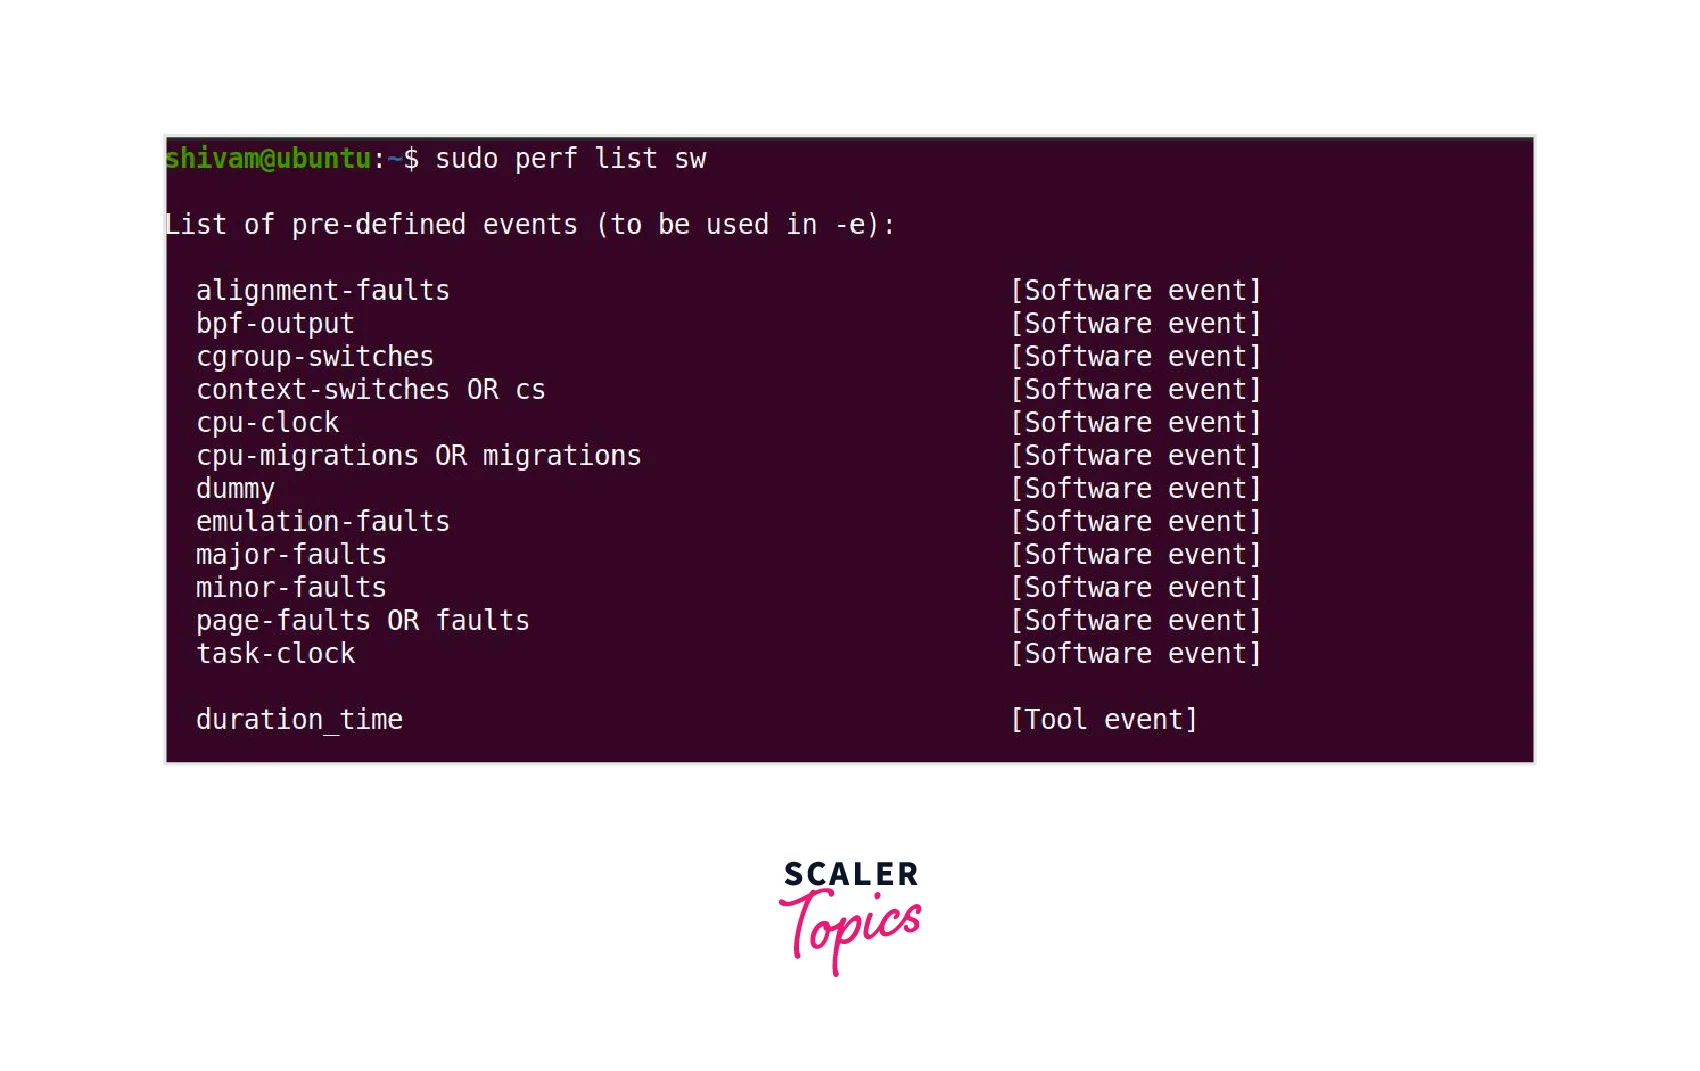
To get a list of all measurable events, use perf with the list subcommand. This subcommand displays a comprehensive list of event types that can be used for profiling or monitoring. To list the events, open a terminal and run the following command:

The output contains a list of all supported events, regardless of type. The command returns a shorter list without sudo. Add the filter option after the command to narrow the list by event name or event type. For example, to view software events, run the following command:
To view hardware events, run the following command:
2. Real-Time CPU Profile:
To view the CPU profile in real-time, use perf with the top subcommand.
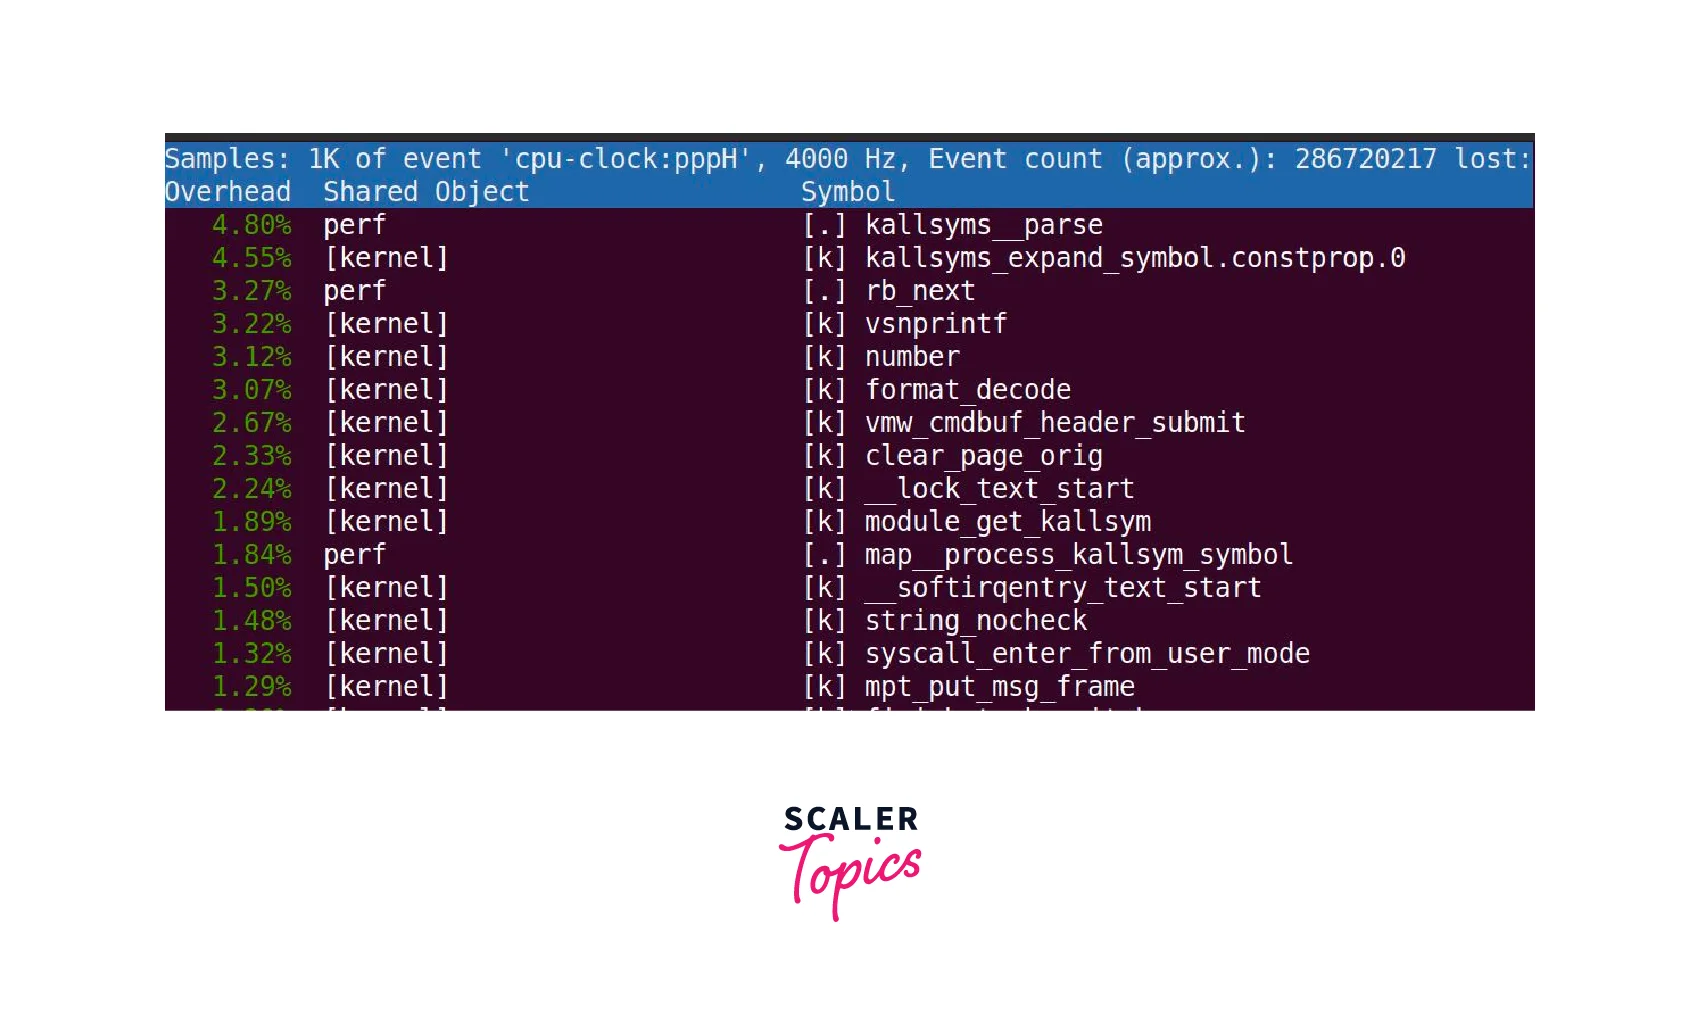
The perf top command provides a real-time view of sampled functions.
The output of perf top consists of three columns presented from left to right:
- CPU usage associated with a particular function is represented as percentages.
- The library or program utilizing the function.
- The symbol and function name, are denoted as [k] for kernel space and [.] for user space.
By default, perf top monitors all online CPUs. However, there are additional options that give you more control:
- You can use the -a option to monitor all CPUs, even idle ones.
- If you want to monitor certain CPUs rather than all of them, use the -C option followed by a list of comma-separated CPU numbers.
- You can also control the sampling frequency of perf top using the -F option.
3. CPU Performance Stats:
Run the following command to display CPU performance statistics for all standard CPU-wide hardware and software events:
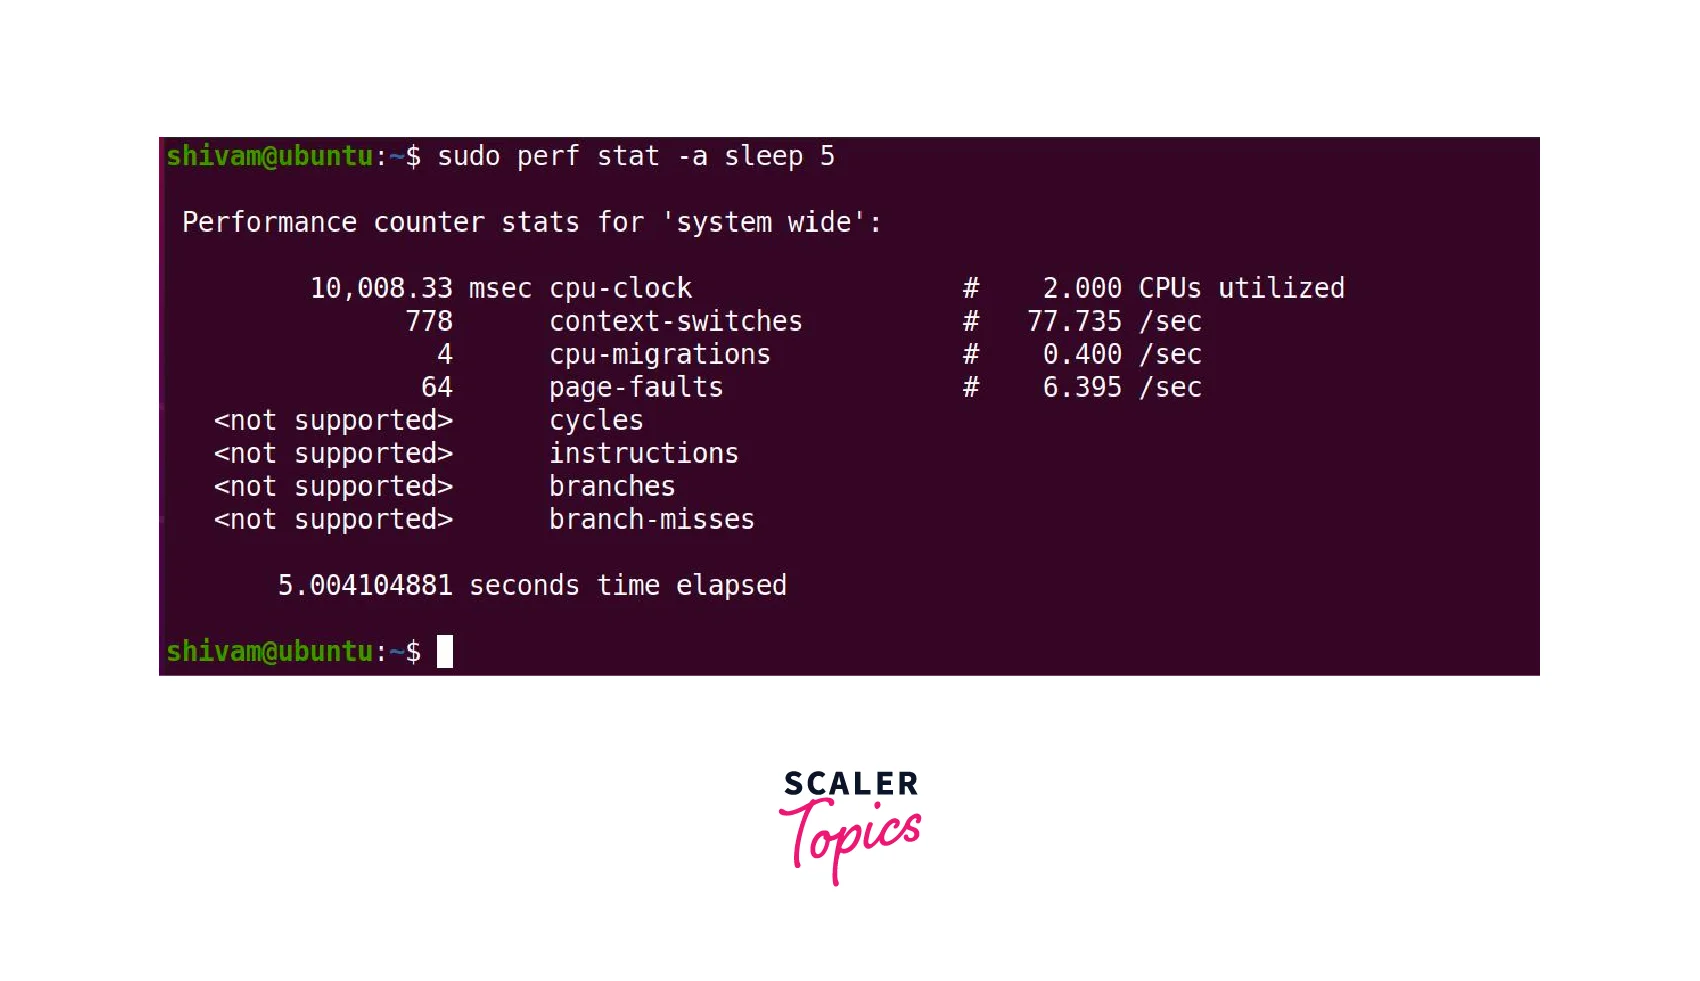
The output of perf top shows a comprehensive report for the entire system, gathered in five seconds. By default, it captures and displays performance data for the specified duration. Alternatively, if the sleep 5 command is not used, the perf top will continue to measure and gather data until it is manually terminated by pressing CTRL+C.
4. CPU Performance for any Command:
To check CPU performance statistics for a given command, use the following syntax:
For example, you can use perf stat to check the performance of the ls command.
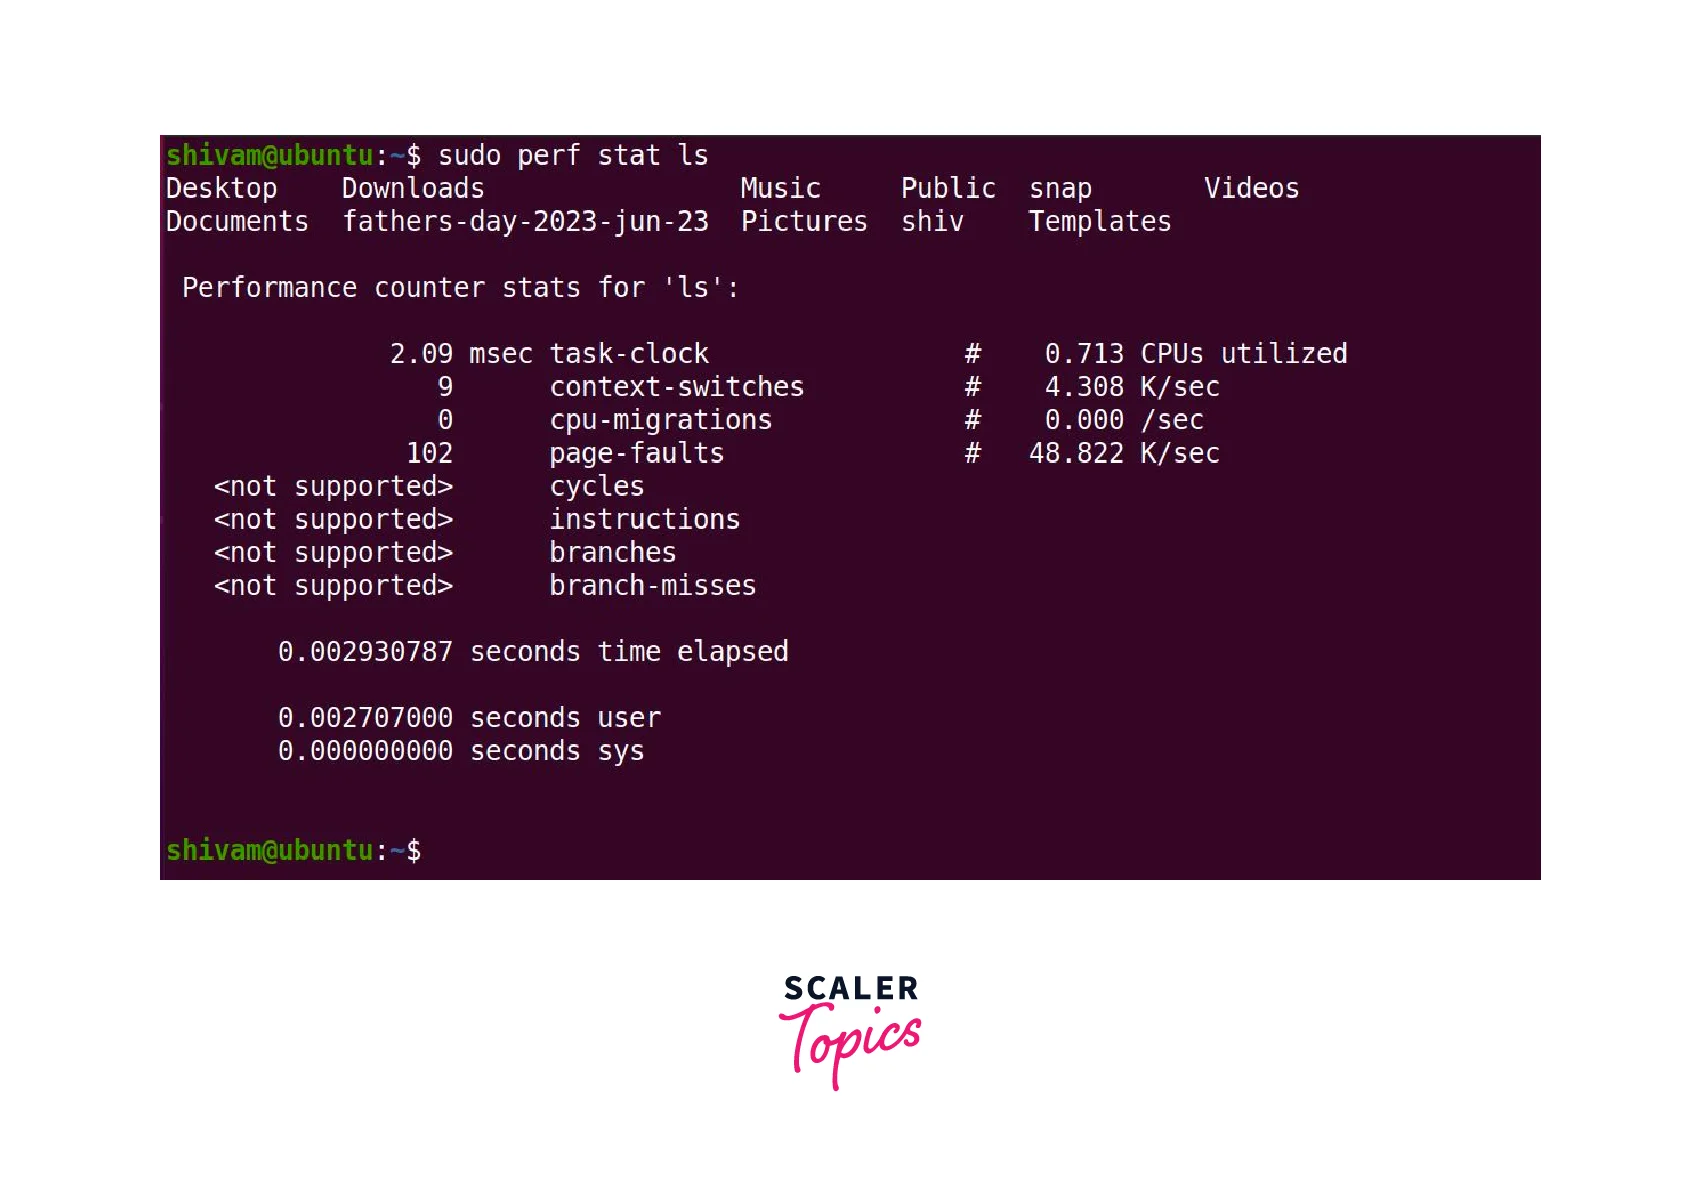
The total time taken by a command is displayed as time elapsed at the end of the output.
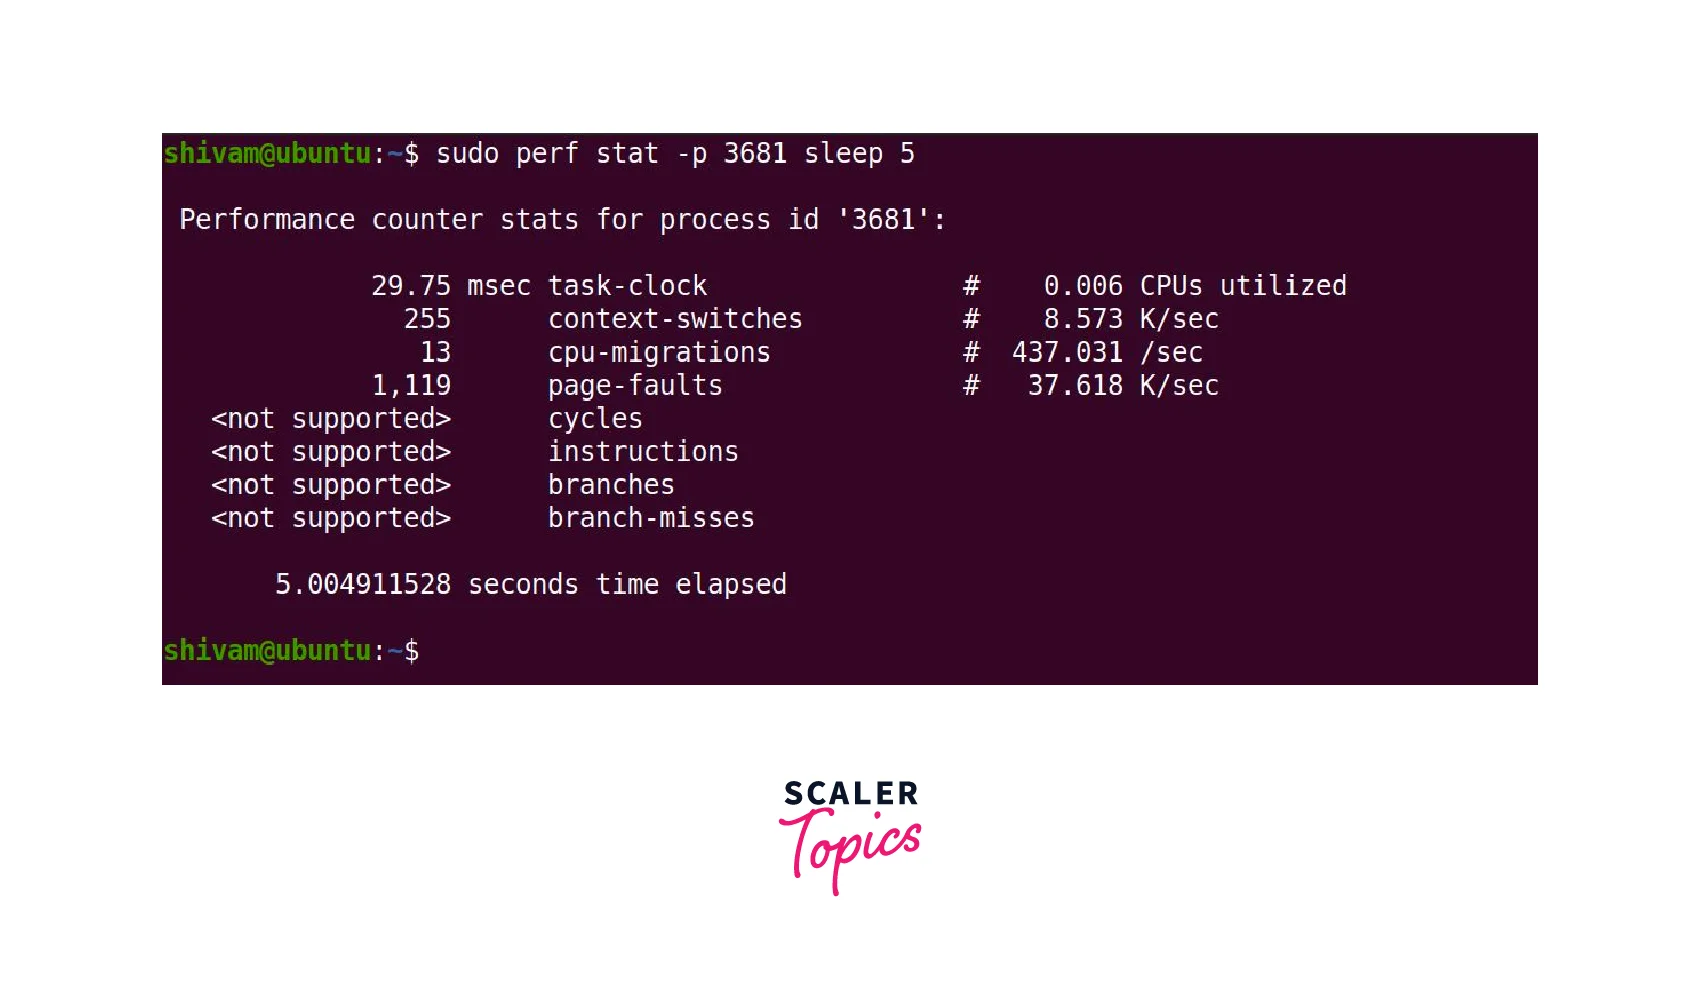
5. CPU Performance for Any Process:
When the process ID (PID) is specified with the -p option, perf will monitor and capture CPU performance statistics for that particular process.
The output of the perf command with the -p option collects and displays performance statistics for the specified process.
6. Event System Calls:
To count the Linux kernel system calls based on their types, you can use the following command:
By running the above command i.e. sudo perf stat -e 'syscalls:sys_enter_*' -a sleep 5 allows you to collect and display statistics on Linux kernel system calls, counting them by their respective types over 5 seconds.
7. CPU Cycles:
To record CPU cycles, which is a hardware event, you can use the perf record subcommand and provide the event name with the -e option.
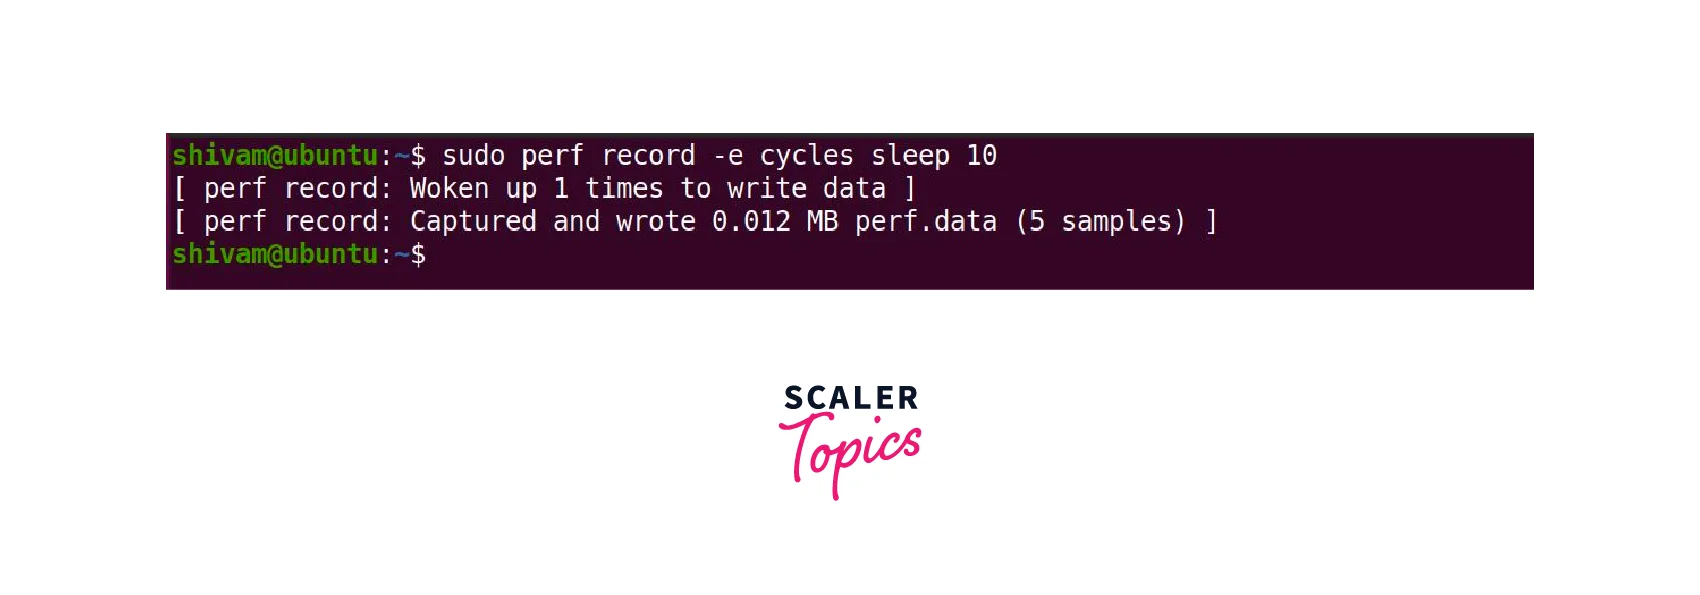
By executing the sudo perf record -e cycles sleep 10 command, you can record and collect CPU cycle information using perf for a specified duration of 10 seconds. The data acquired throughout the recording procedure is saved to a file named perf.data. The recording operation's output includes information on the size of the perf.data file and the number of data samples it contains.
8. Performance Results:
To view the performance results stored in the perf.data file, you can run the following command:
The sudo perf report command displays and analyzes the performance results stored in the perf.data file, presenting them in a comprehensive report format. To exit the viewer, press CTRL+C.
9. Sample Output Format Modification:
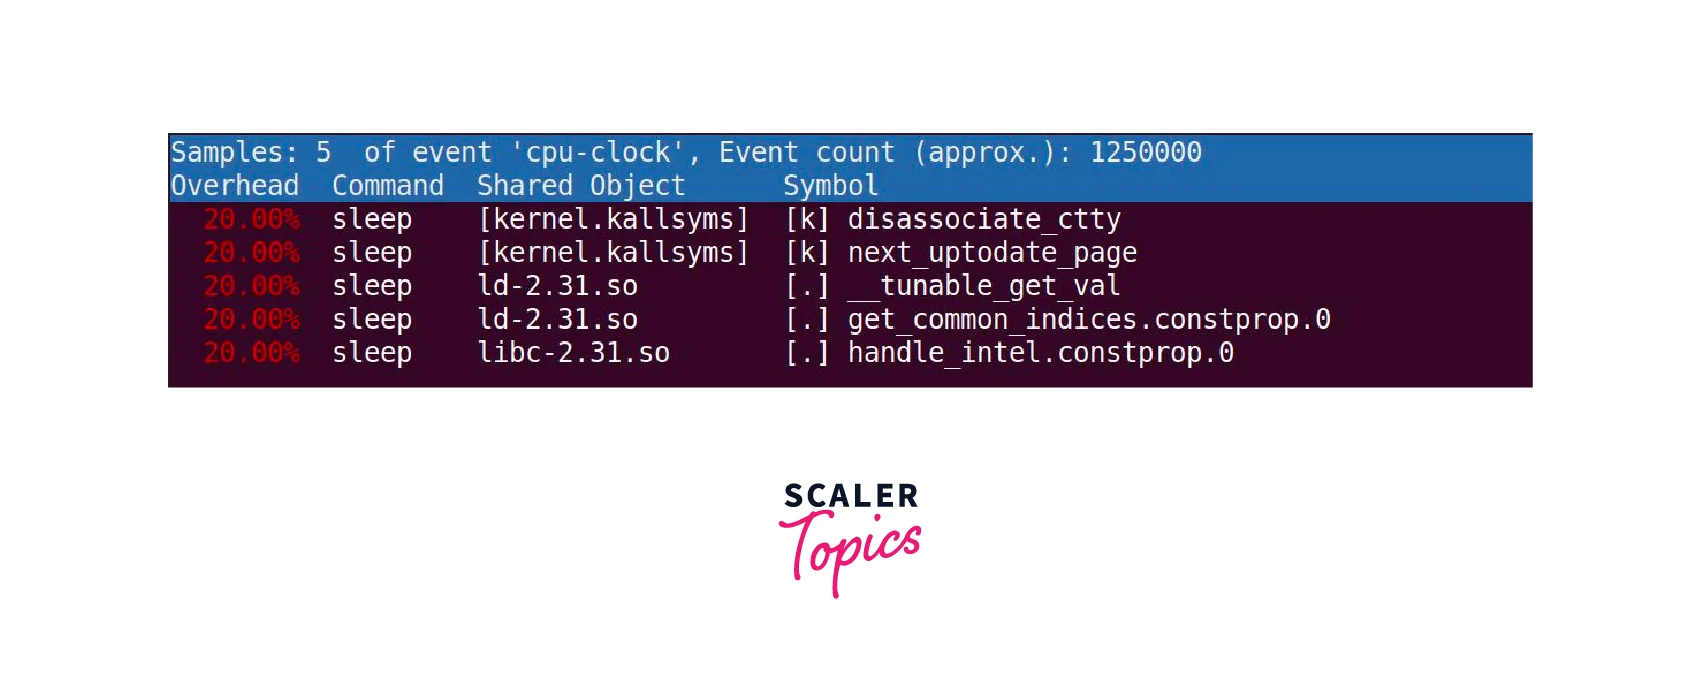
You can execute the following command to display the sample output in the standard output format:
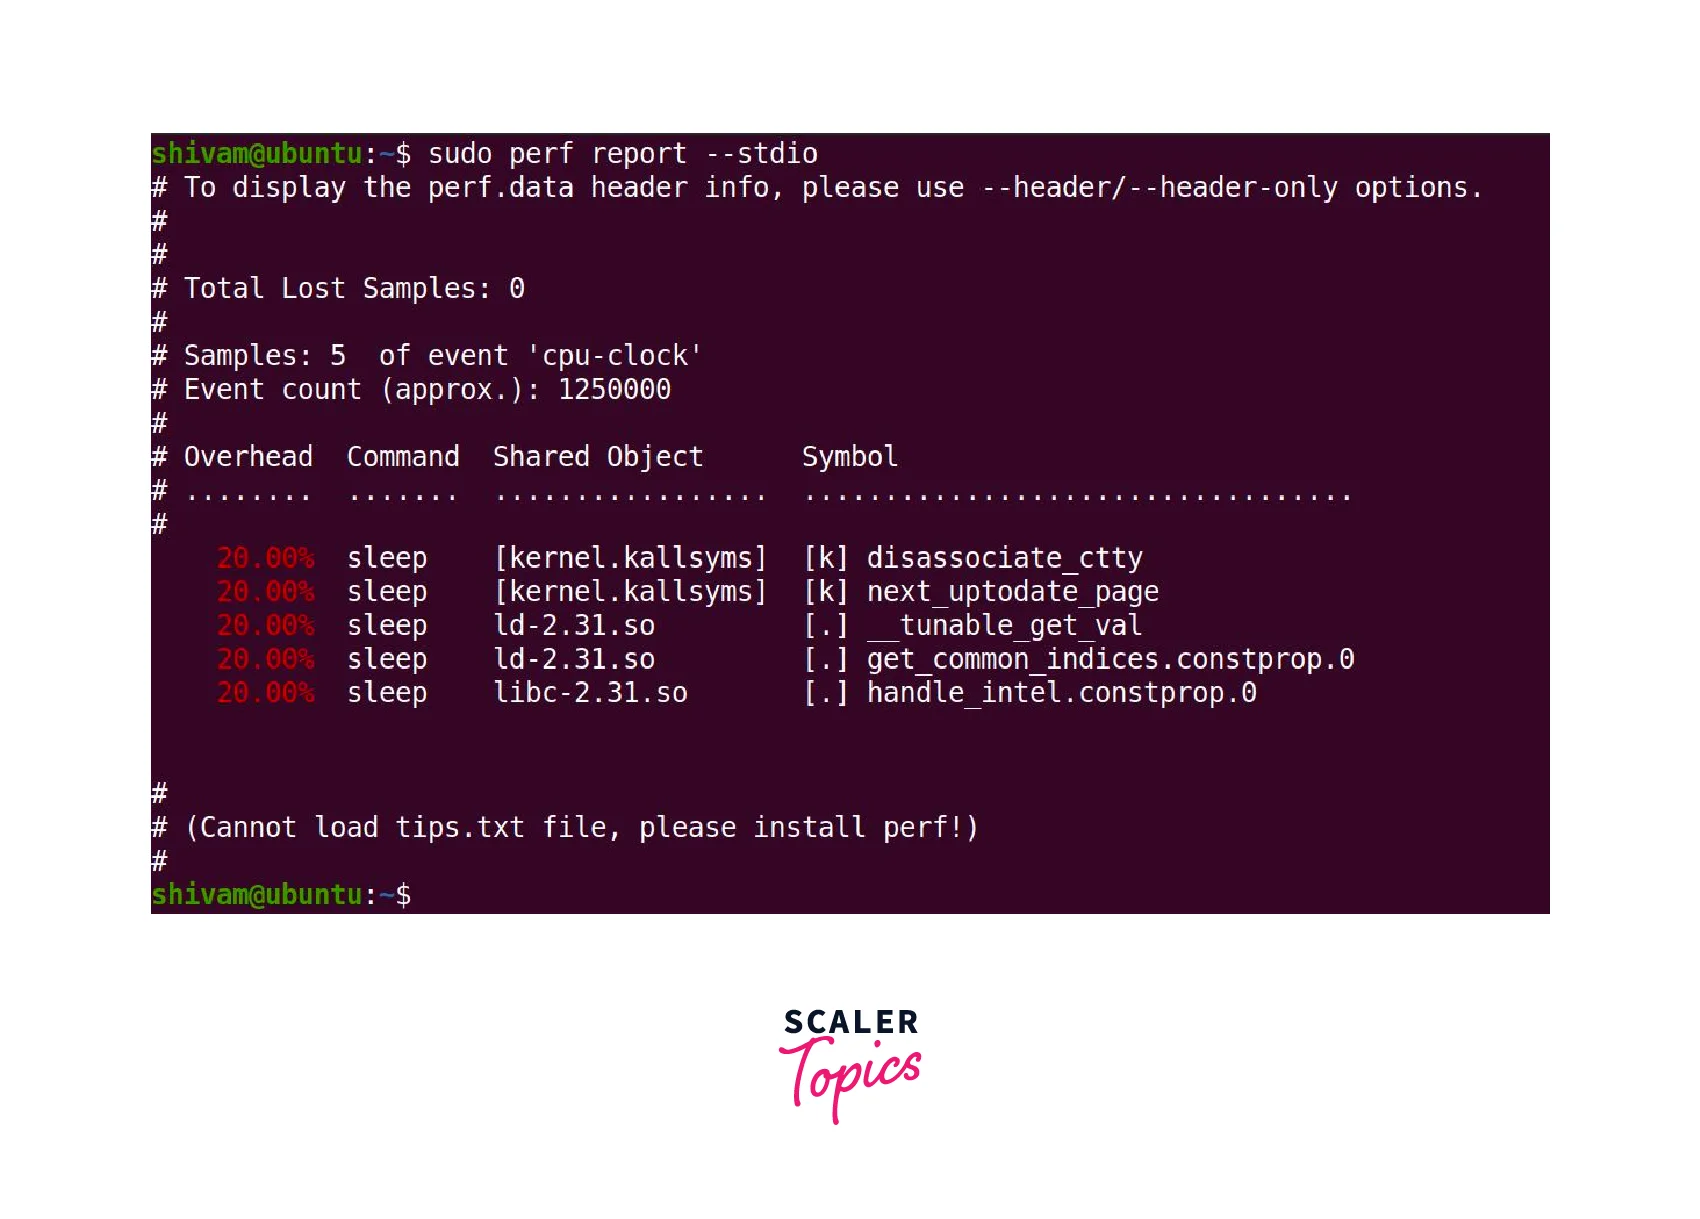
The command sudo perf report --stdio generates a performance report and presents it in standard output.
The perf report command can be modified further to alter the output. For example, you can use the -n option to display the sample number for each event. Additionally, you can specify specific columns to display and sort the output using the --sort option along with the desired column names.
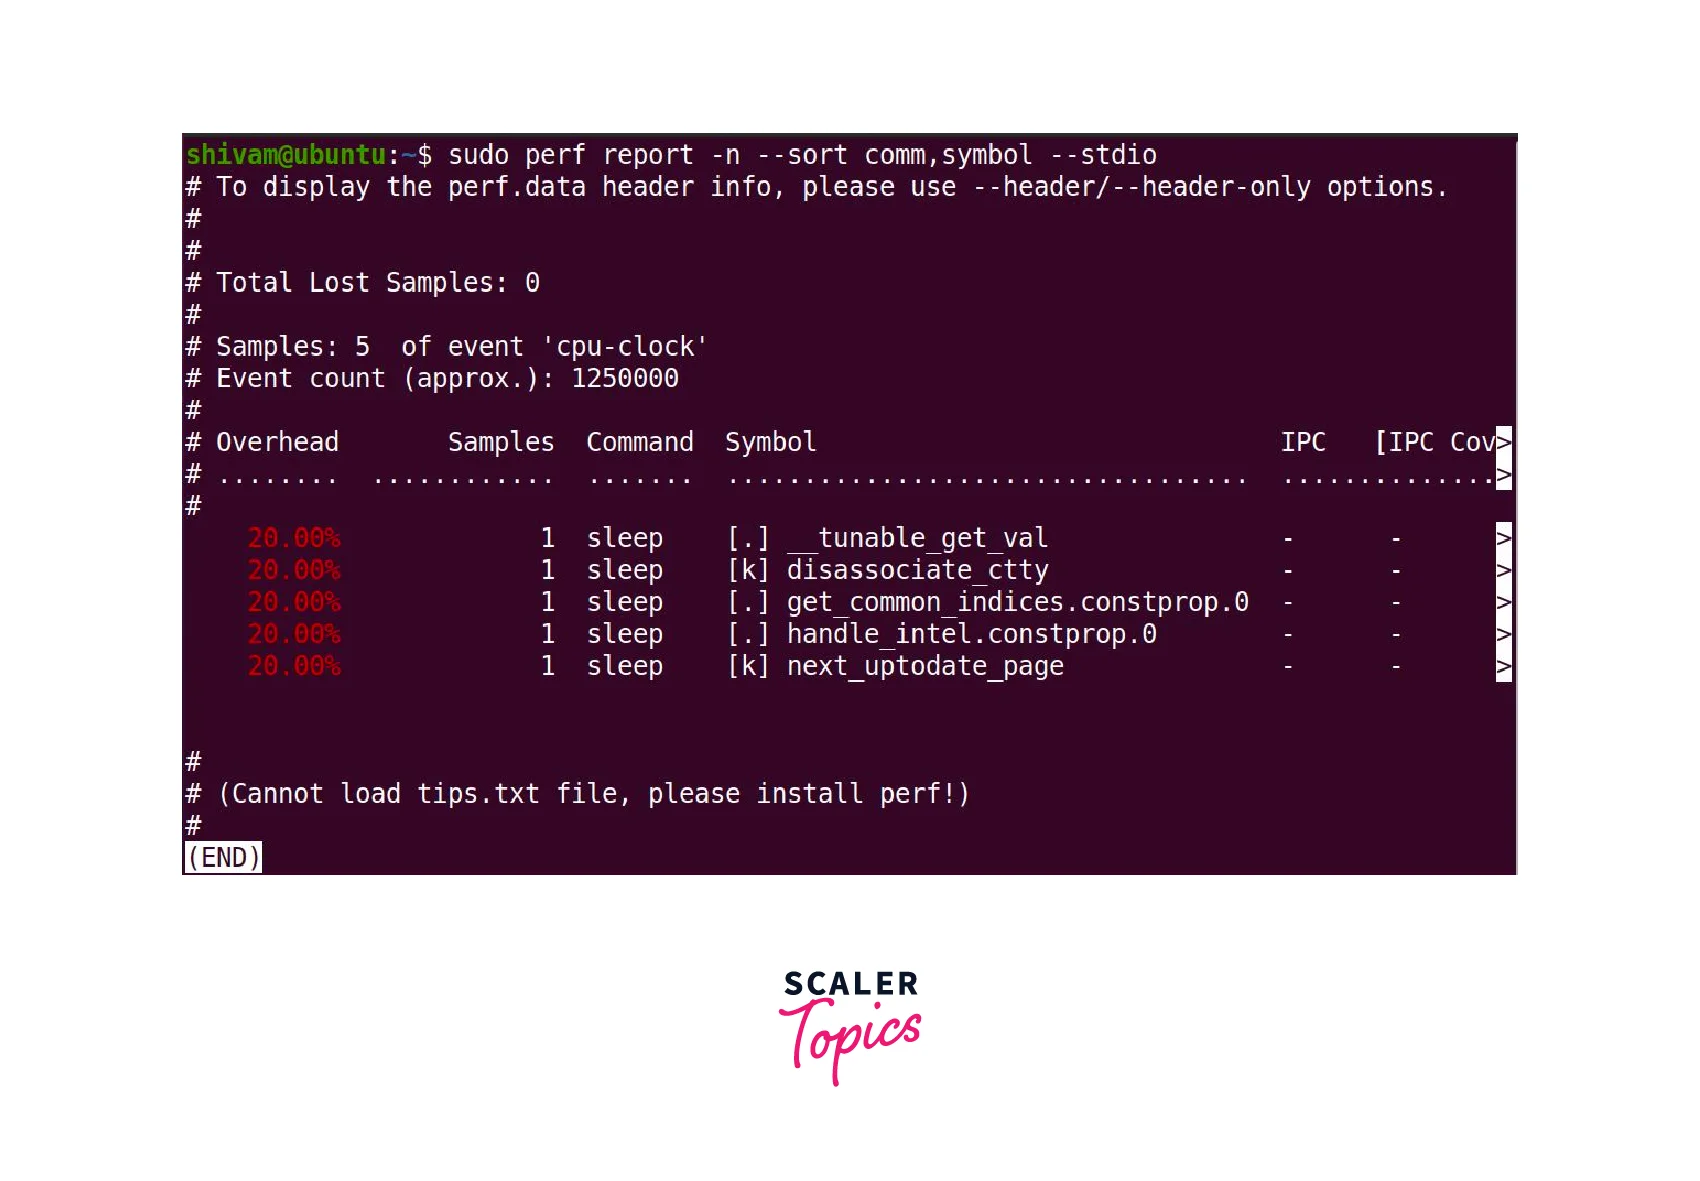
The above command generates an output that includes columns for the sample number, command, and symbol information.
10. Trace Output:
Using the perf script subcommand, you can list all events from the perf.data file.
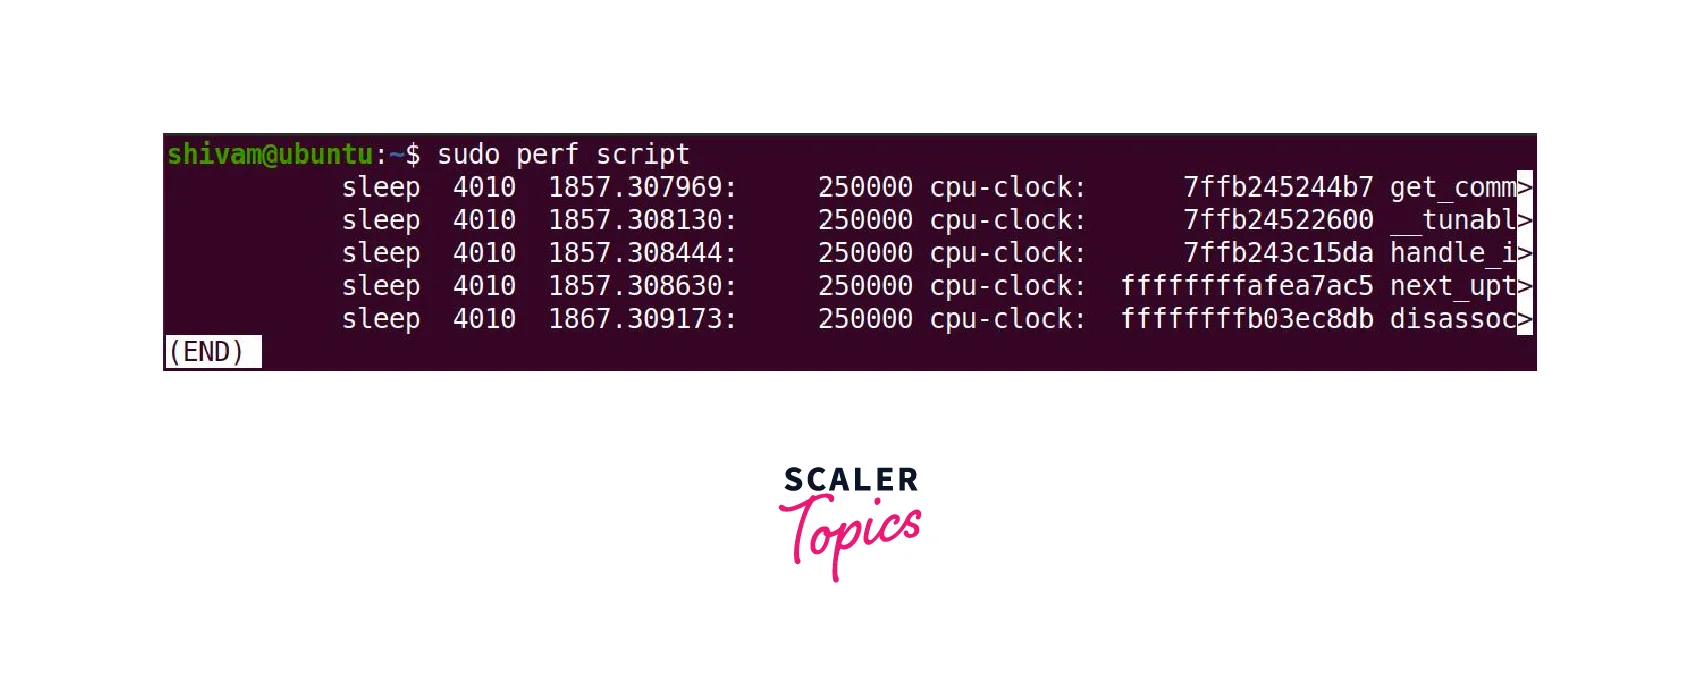
The output displays the perf.data details in order of time. Use the script subcommand as post-processing data.
11. Trace Header:
To display all the events from the perf.data file with additional trace header information, you can run the following command:
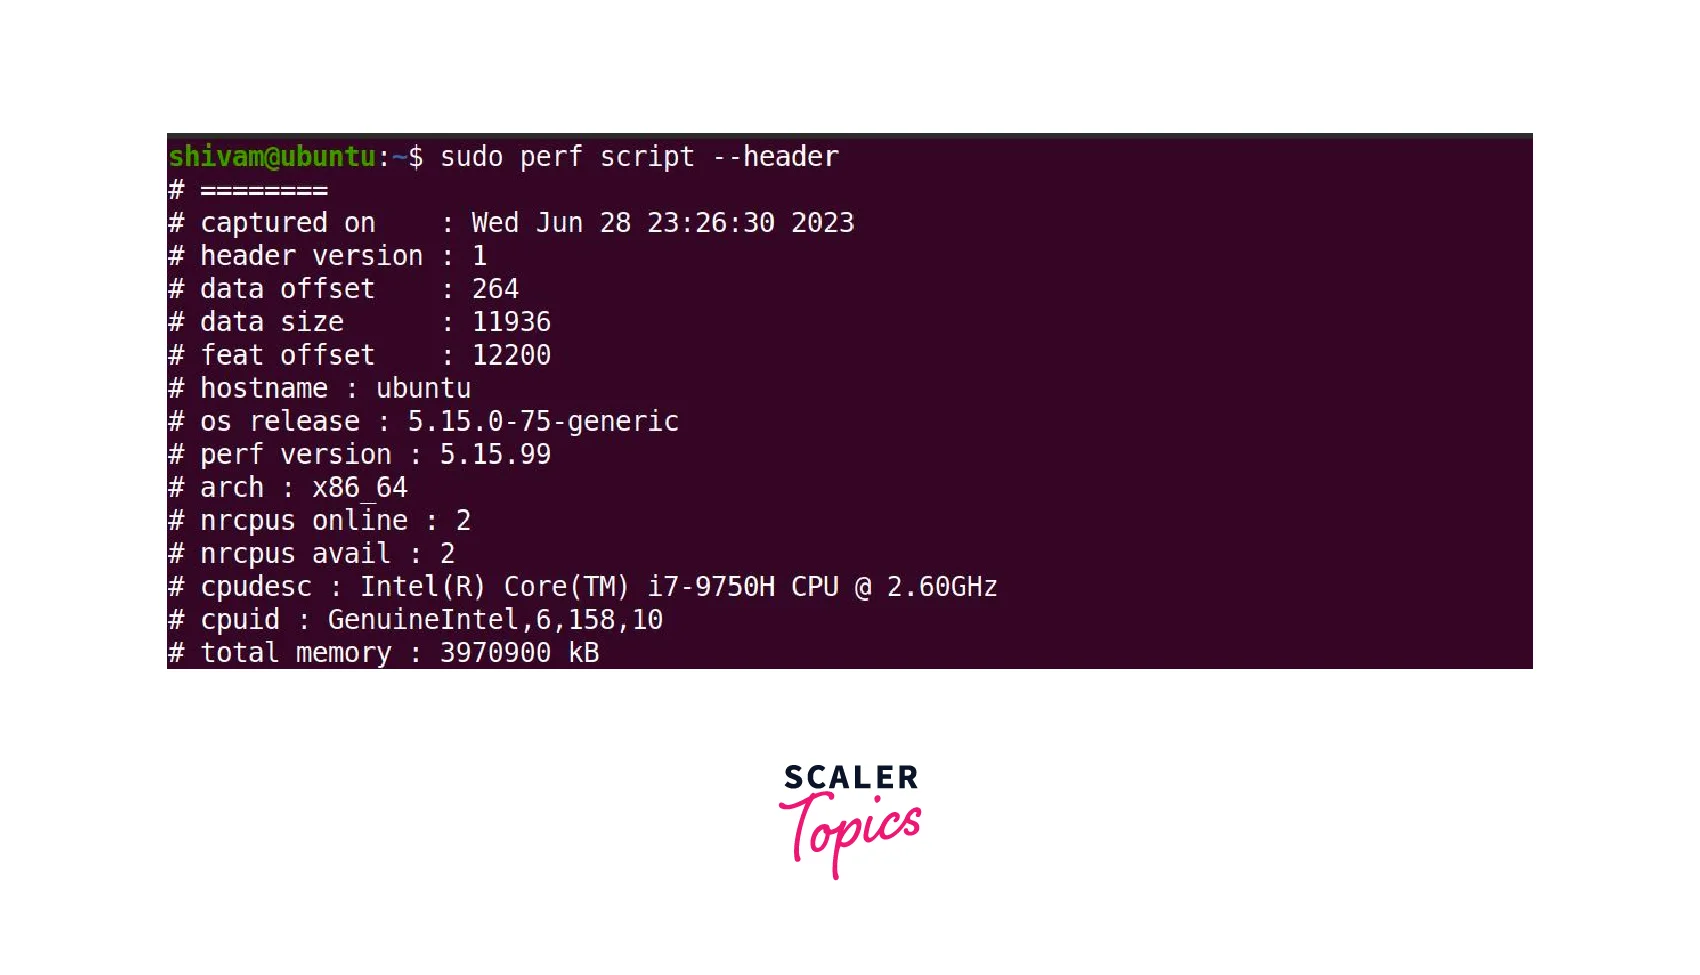
The output of the perf script --header command includes the header information of the file, which provides details about the trace session. This information typically comprises the start time of the trace, its duration, CPU-related statistics, and the command that generated the data.
12. Raw Data Dumping:
You can use the -D option with the perf script command to extract raw data from the perf.data file and display it in hexadecimal format:
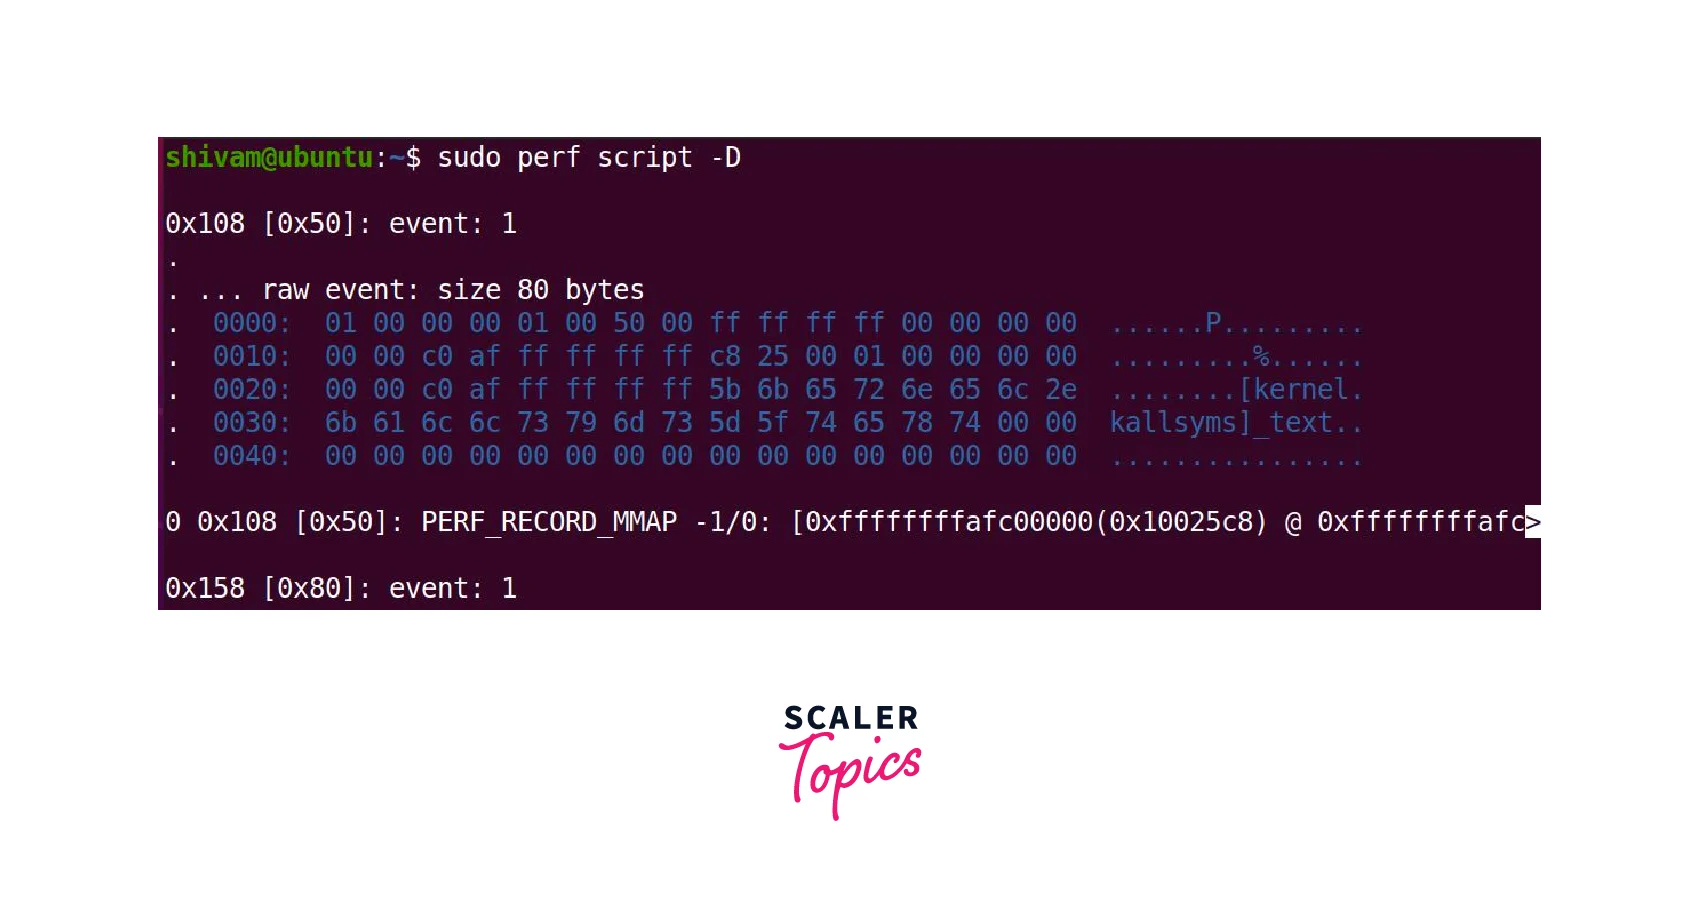
The perf script command's -D option generates raw event trace information in ASCII format from the perf.data file. This option is particularly useful for event debugging purposes.
13. Data Annotation:
You can use the perf annotate subcommand to annotate data and perform further disassemble of recorded events:
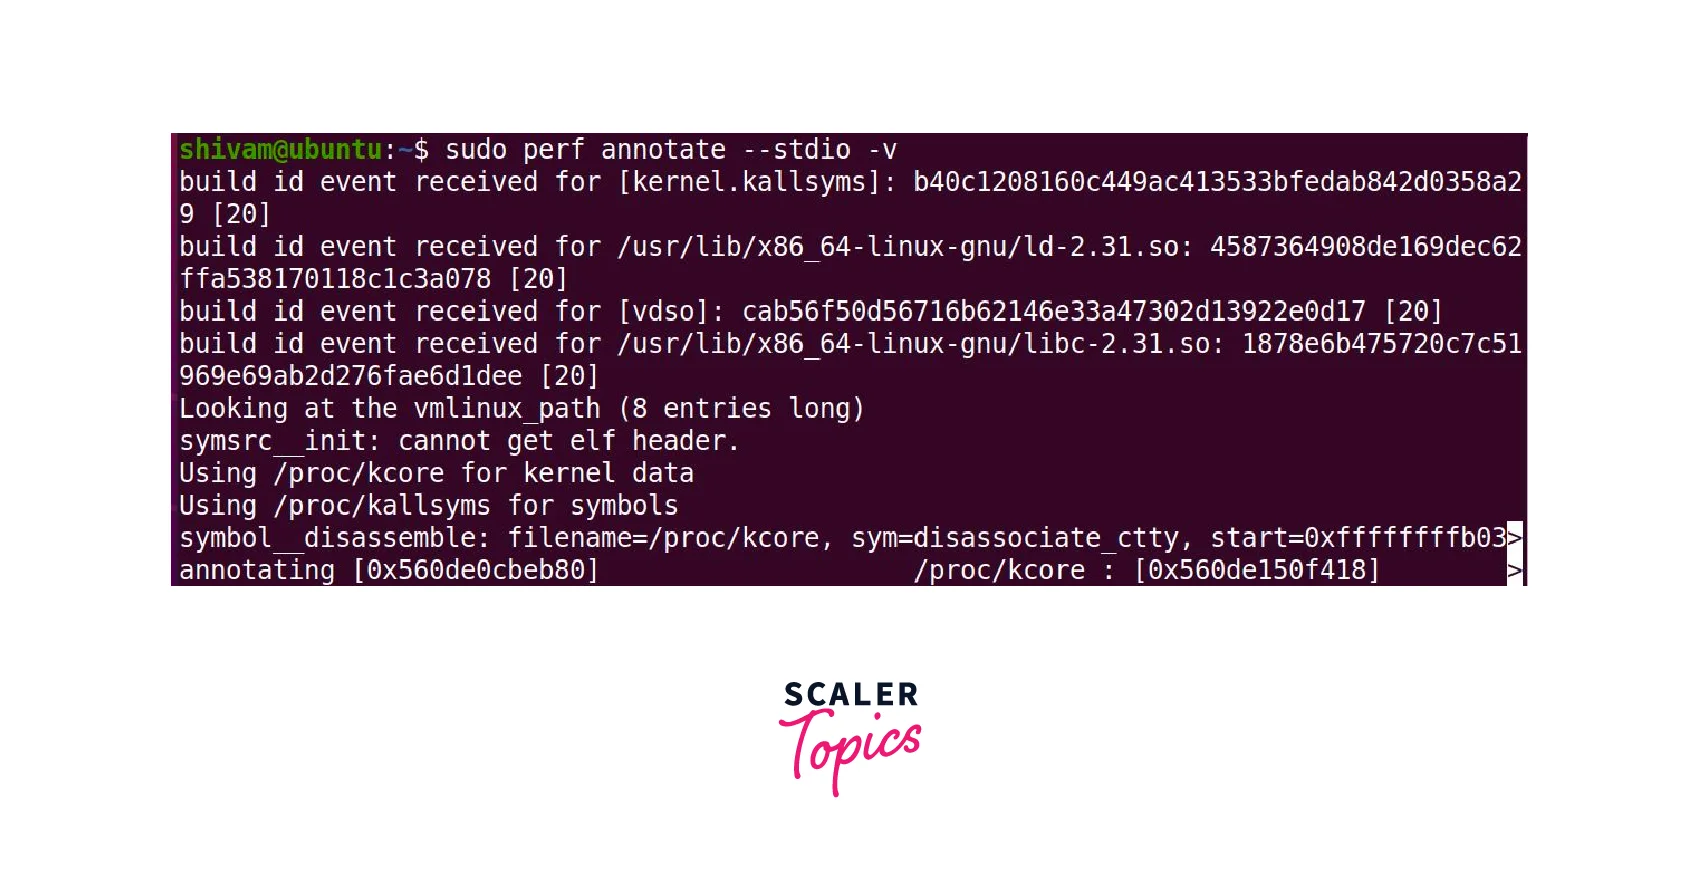
When you use the perf annotate command with the -v option, it provides a detailed output that contains both the source code and the disassembly of the recorded events.
Conclusion
- Linux perf is a lightweight CPU profiling command-line utility that examines CPU performance counters, tracepoints, upprobes, and kprobes, monitors program events, and generates reports.
- The Linux perf command may not provide complete results when used on virtualization platforms like VMware or VirtualBox.
- Run the perf --version to validate the installation. The output includes the version number, indicating that the installation was successful.
- The syntax of the Linux perf command is perf <options> command <arguments>.
- The perf command in Linux provides various subcommands, including annotate, list, stat, record, report, script, and top.
- The perf command, when used with the top subcommand, provides real-time profiling features, allowing you to monitor CPU utilisation and identify performance bottlenecks.
- You can gather performance statistics for the entire system, specific commands, or even individual processes by using subcommands such as stat and record.