Troubleshooting in Linux Using Sylog, DMESG & Sar
Overview
Linux is a popular and powerful operating system used by many system administrators, developers, and IT professionals for various purposes, including server management, data centers, and embedded systems. Troubleshooting and diagnosing issues in a Linux system are crucial tasks for maintaining its optimal performance and ensuring smooth operation.
To effectively troubleshoot and diagnose Linux systems, there are several built-in diagnostic and monitoring tools available. These tools provide insights into the system's performance, logs, and various metrics that can help identify and resolve issues. In this article, we will explore three essential Linux diagnostic tools: dmesg, syslog, and sar.
Introduction
The dmesg, syslog, and sar tools are command-line utilities that are commonly used in Linux for troubleshooting and diagnosing issues. These tools provide valuable information about system logs, performance metrics, and events, which can be useful in identifying and resolving problems.
This article will provide you knowledge and details of these tools and how they can be used for troubleshooting and collecting information in Linux systems.
What is the Dmesg Command?
The dmesg Linux command stands for "display message" and is used to display the kernel ring buffer messages. The kernel ring buffer is a log that contains messages generated by the Linux kernel during boot time and runtime. These messages provide information about various system events, including hardware detection, device drivers, system errors, and warnings.
The dmesg Linux command provides a convenient way to view these kernel messages and helps in troubleshooting hardware-related issues, driver problems, and system errors. It allows system administrators to monitor the system's health and diagnose problems in real-time or by reviewing past logs.
The dmesg Linux command provides a wide range of options and filters that can be used to customize the output and extract relevant information.
Some commonly used options with the dmesg command are:
| Options | Function |
|---|---|
| -c | Clears the kernel ring buffer after displaying the messages, which can be useful for getting fresh logs. |
| -T | Displays the timestamp of each message in human-readable format, which can help in understanding the timeline of events. |
| -p | Filters the messages based on priority level, where 0 represents the highest priority and 7 represents the lowest. |
| -r | Displays the raw message buffer without interpreting special characters or formatting, which can be useful for parsing logs programmatically. |
| -k | Displays only the kernel log messages, excluding any messages from user-level processes. |
Dmesg Commands for Troubleshooting and Collecting Information of Linux Systems
The dmesg Linux command is a powerful tool that can be used for troubleshooting and collecting information in Linux systems. Here are some common uses of the dmesg command:
Troubleshooting hardware issues : The dmesg Linux command can help identify and diagnose hardware-related issues such as device detection, driver loading, and hardware errors.
Diagnosing system errors : The dmesg Linux command can provide logs related to system errors, warnings, and crashes.
Monitoring system performance : The dmesg Linux command can provide information about the system's performance metrics, such as CPU usage, memory usage, and I/O operations.
Troubleshooting boot issues : The dmesg Linux command can provide logs related to the Linux kernel's boot process and any errors that may occur during boot.
Debugging device drivers : The dmesg Linux command can help in debugging device drivers by providing logs related to device detection, driver loading, and device configuration.
Analyzing system events: The dmesg Linux command can provide logs related to various system events, such as power management events, ACPI events, and system events triggered by user-level processes.
Here are some examples of using the dmesg command for troubleshooting and collecting information in Linux systems are:
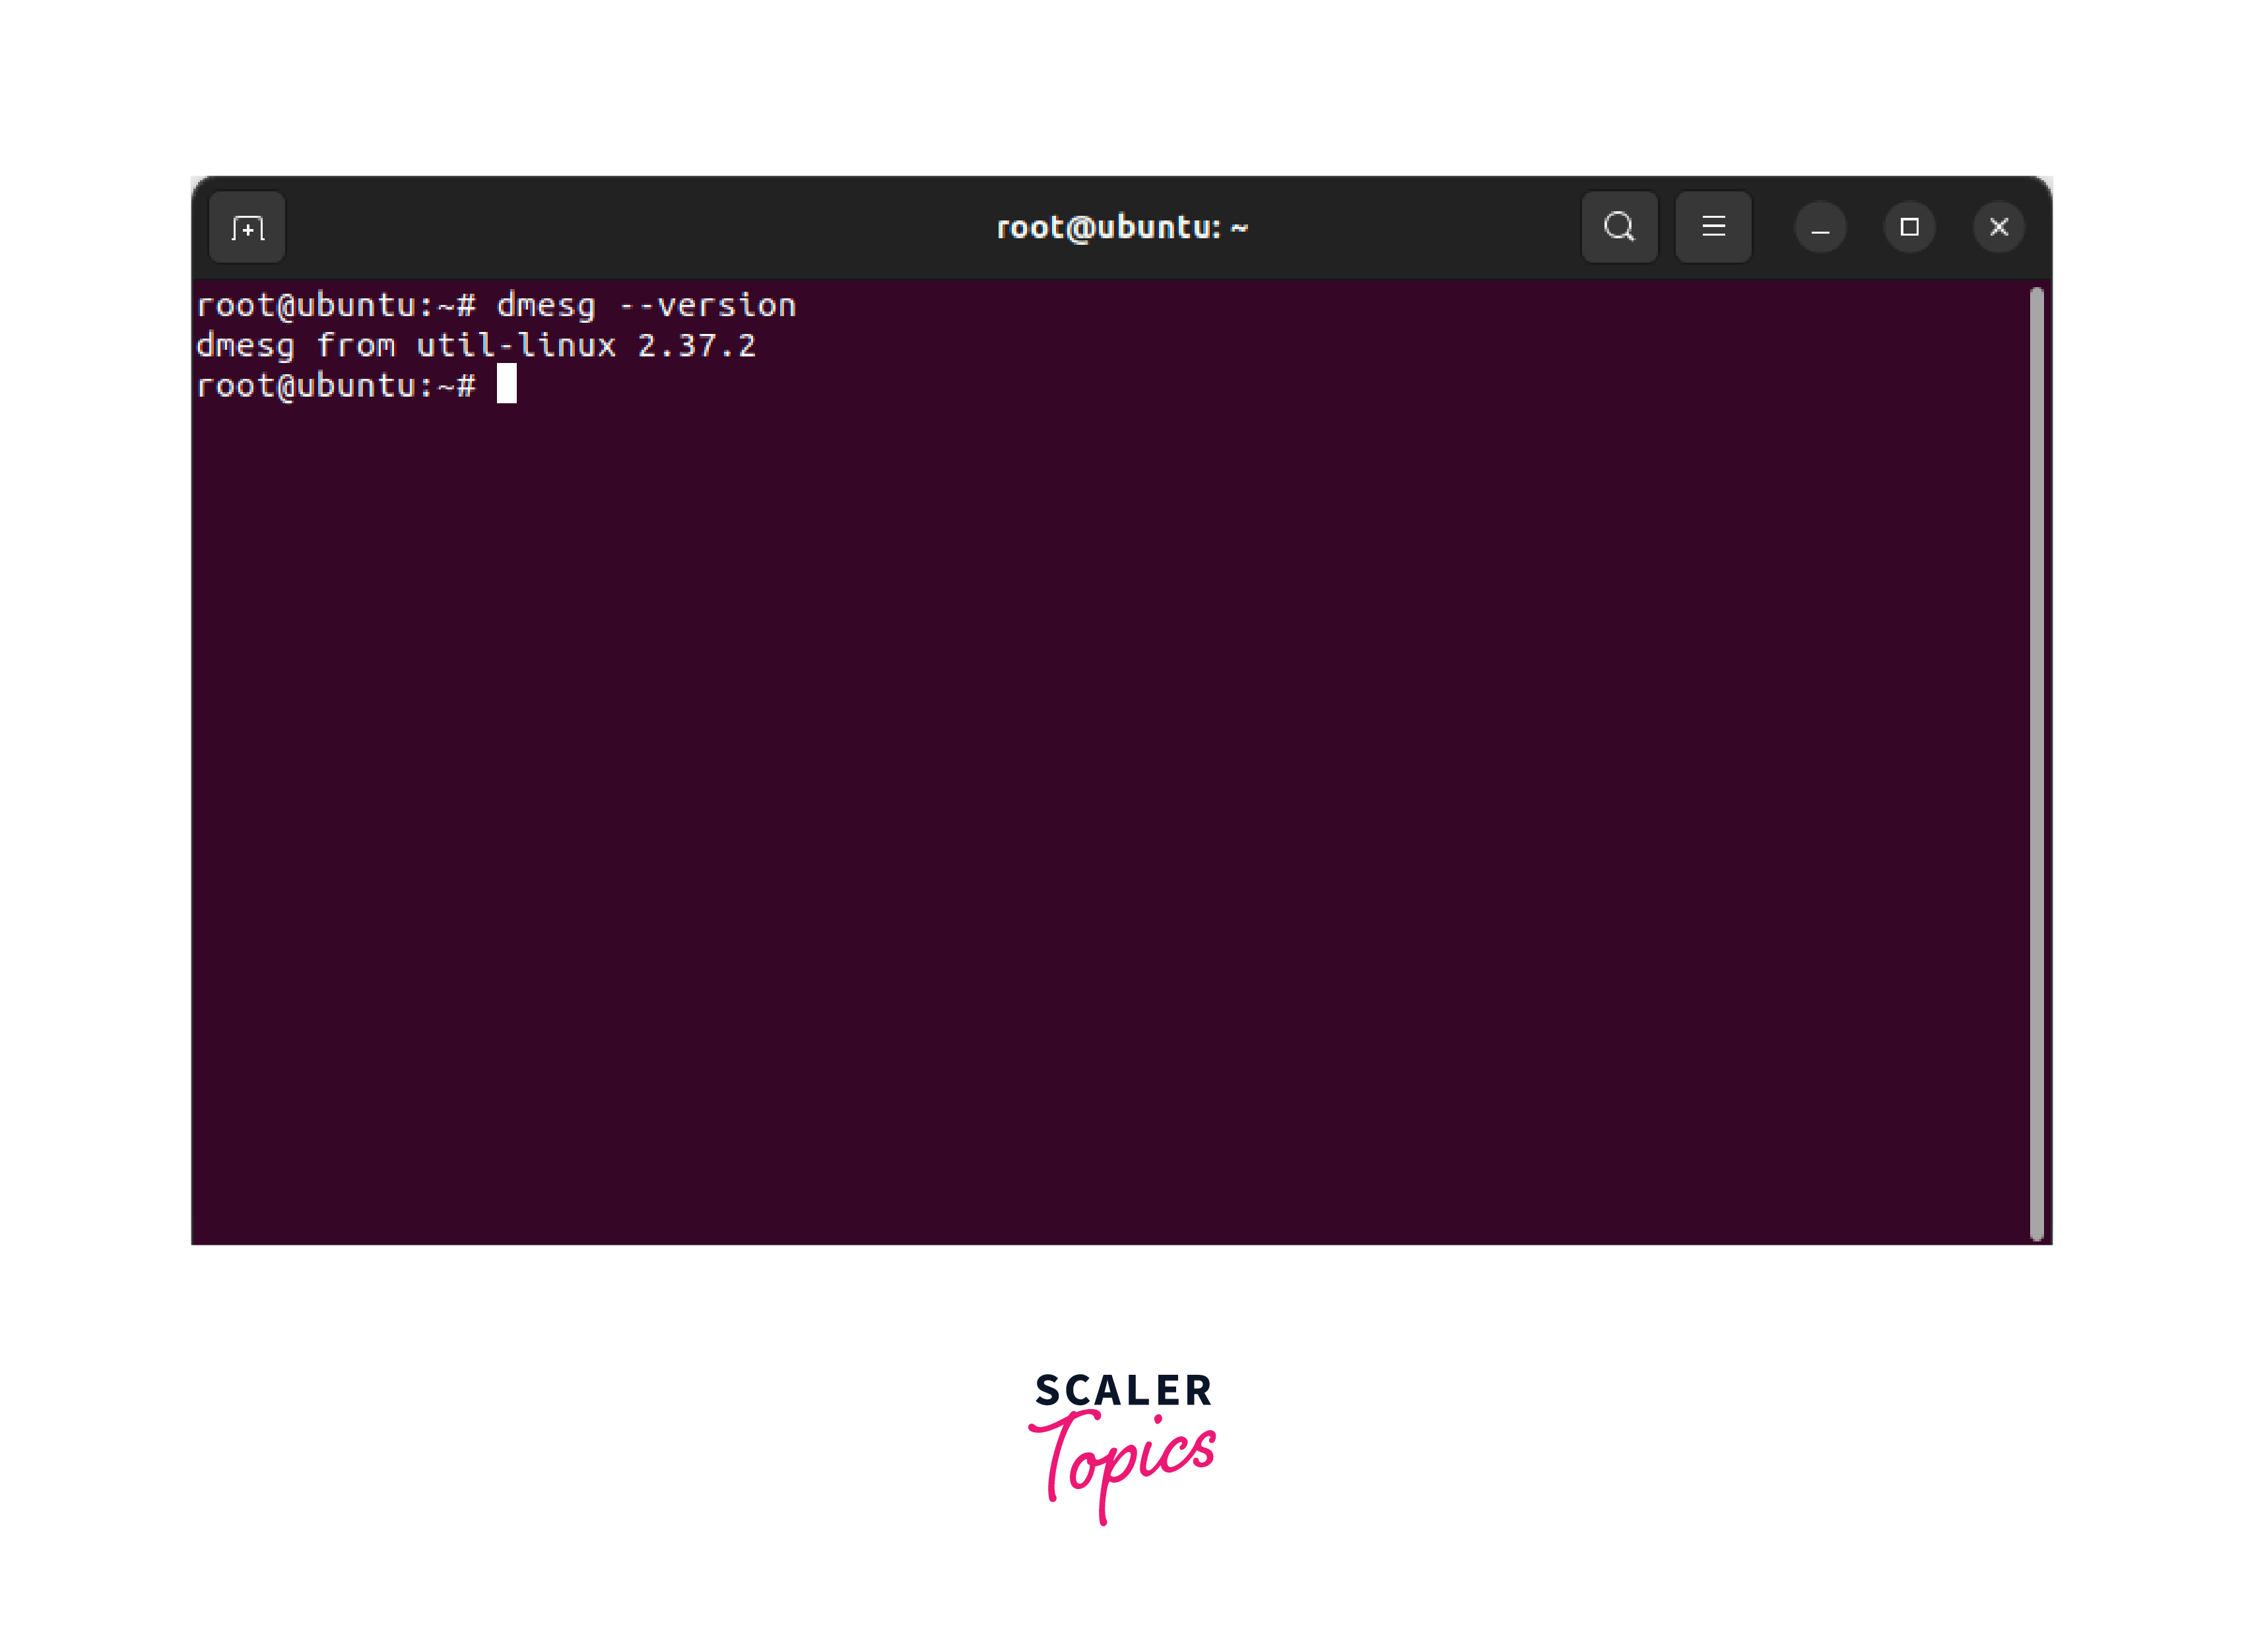
Checking the dmesg Command Version
To check the version of the dmesg Linux command, you can use the following command:
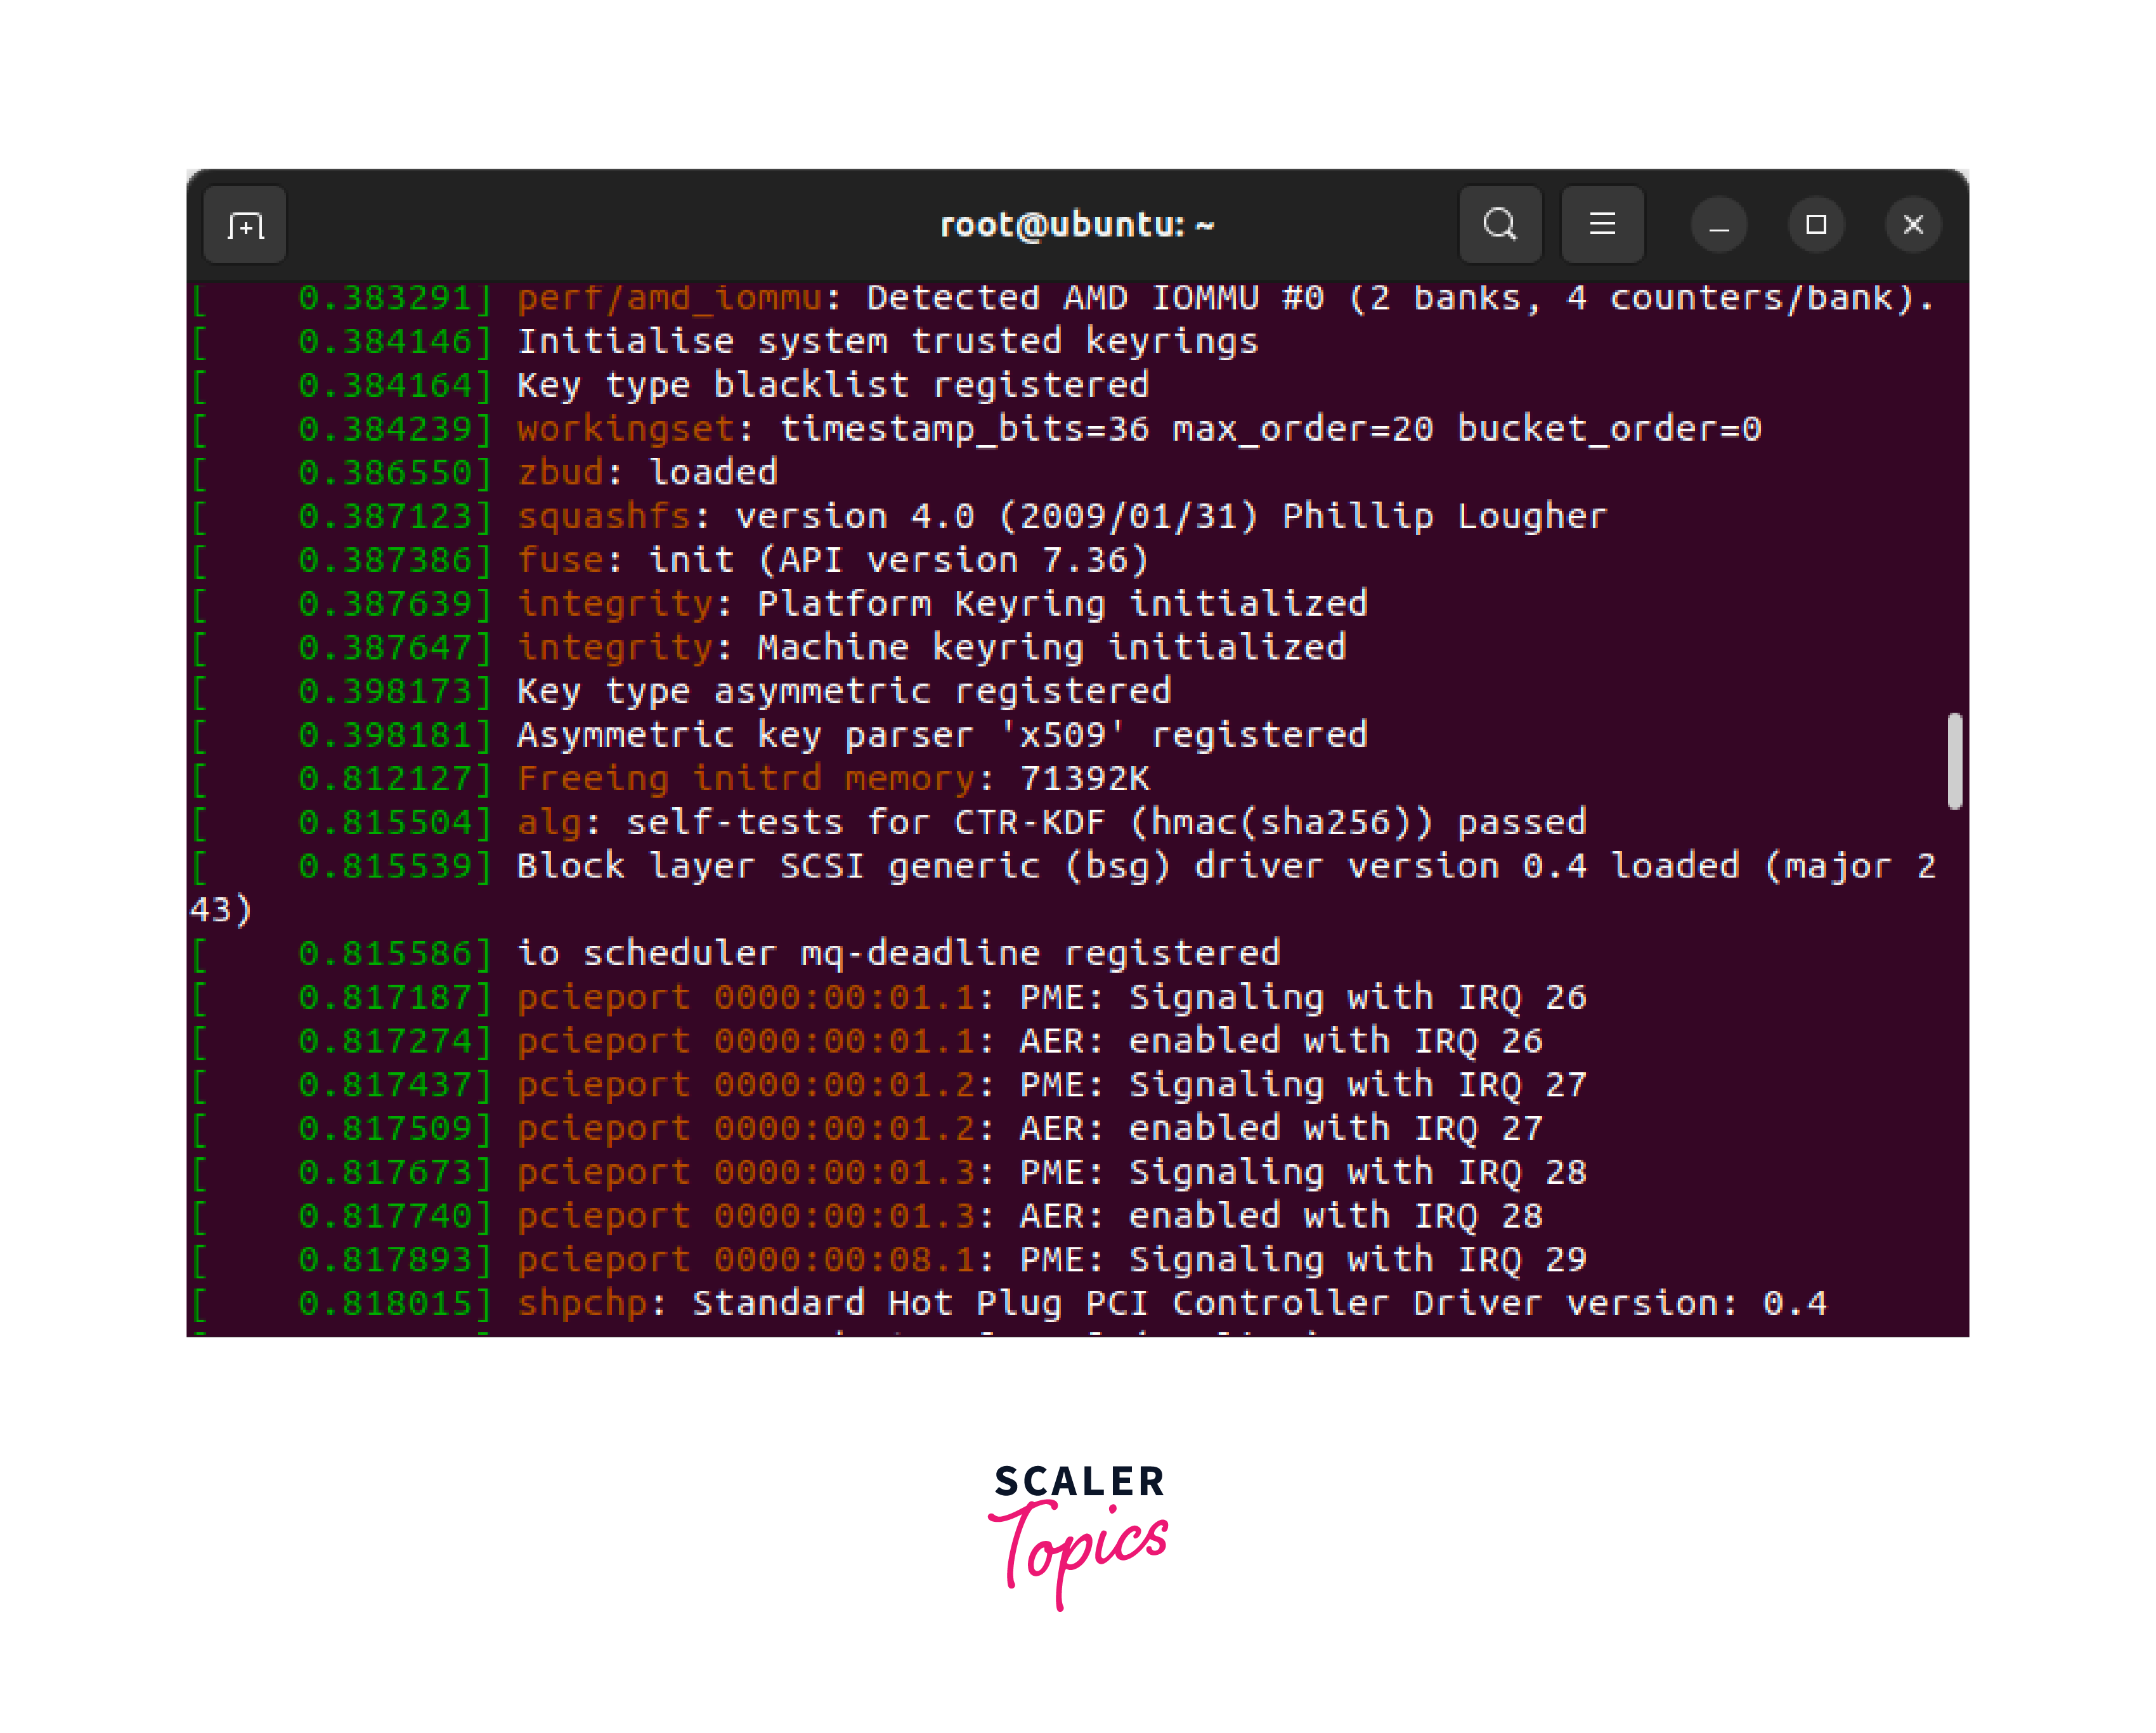
Showing All Messages from the Linux Buffer
To print all the messages from the Linux buffer, simply run the dmesg command without any options:
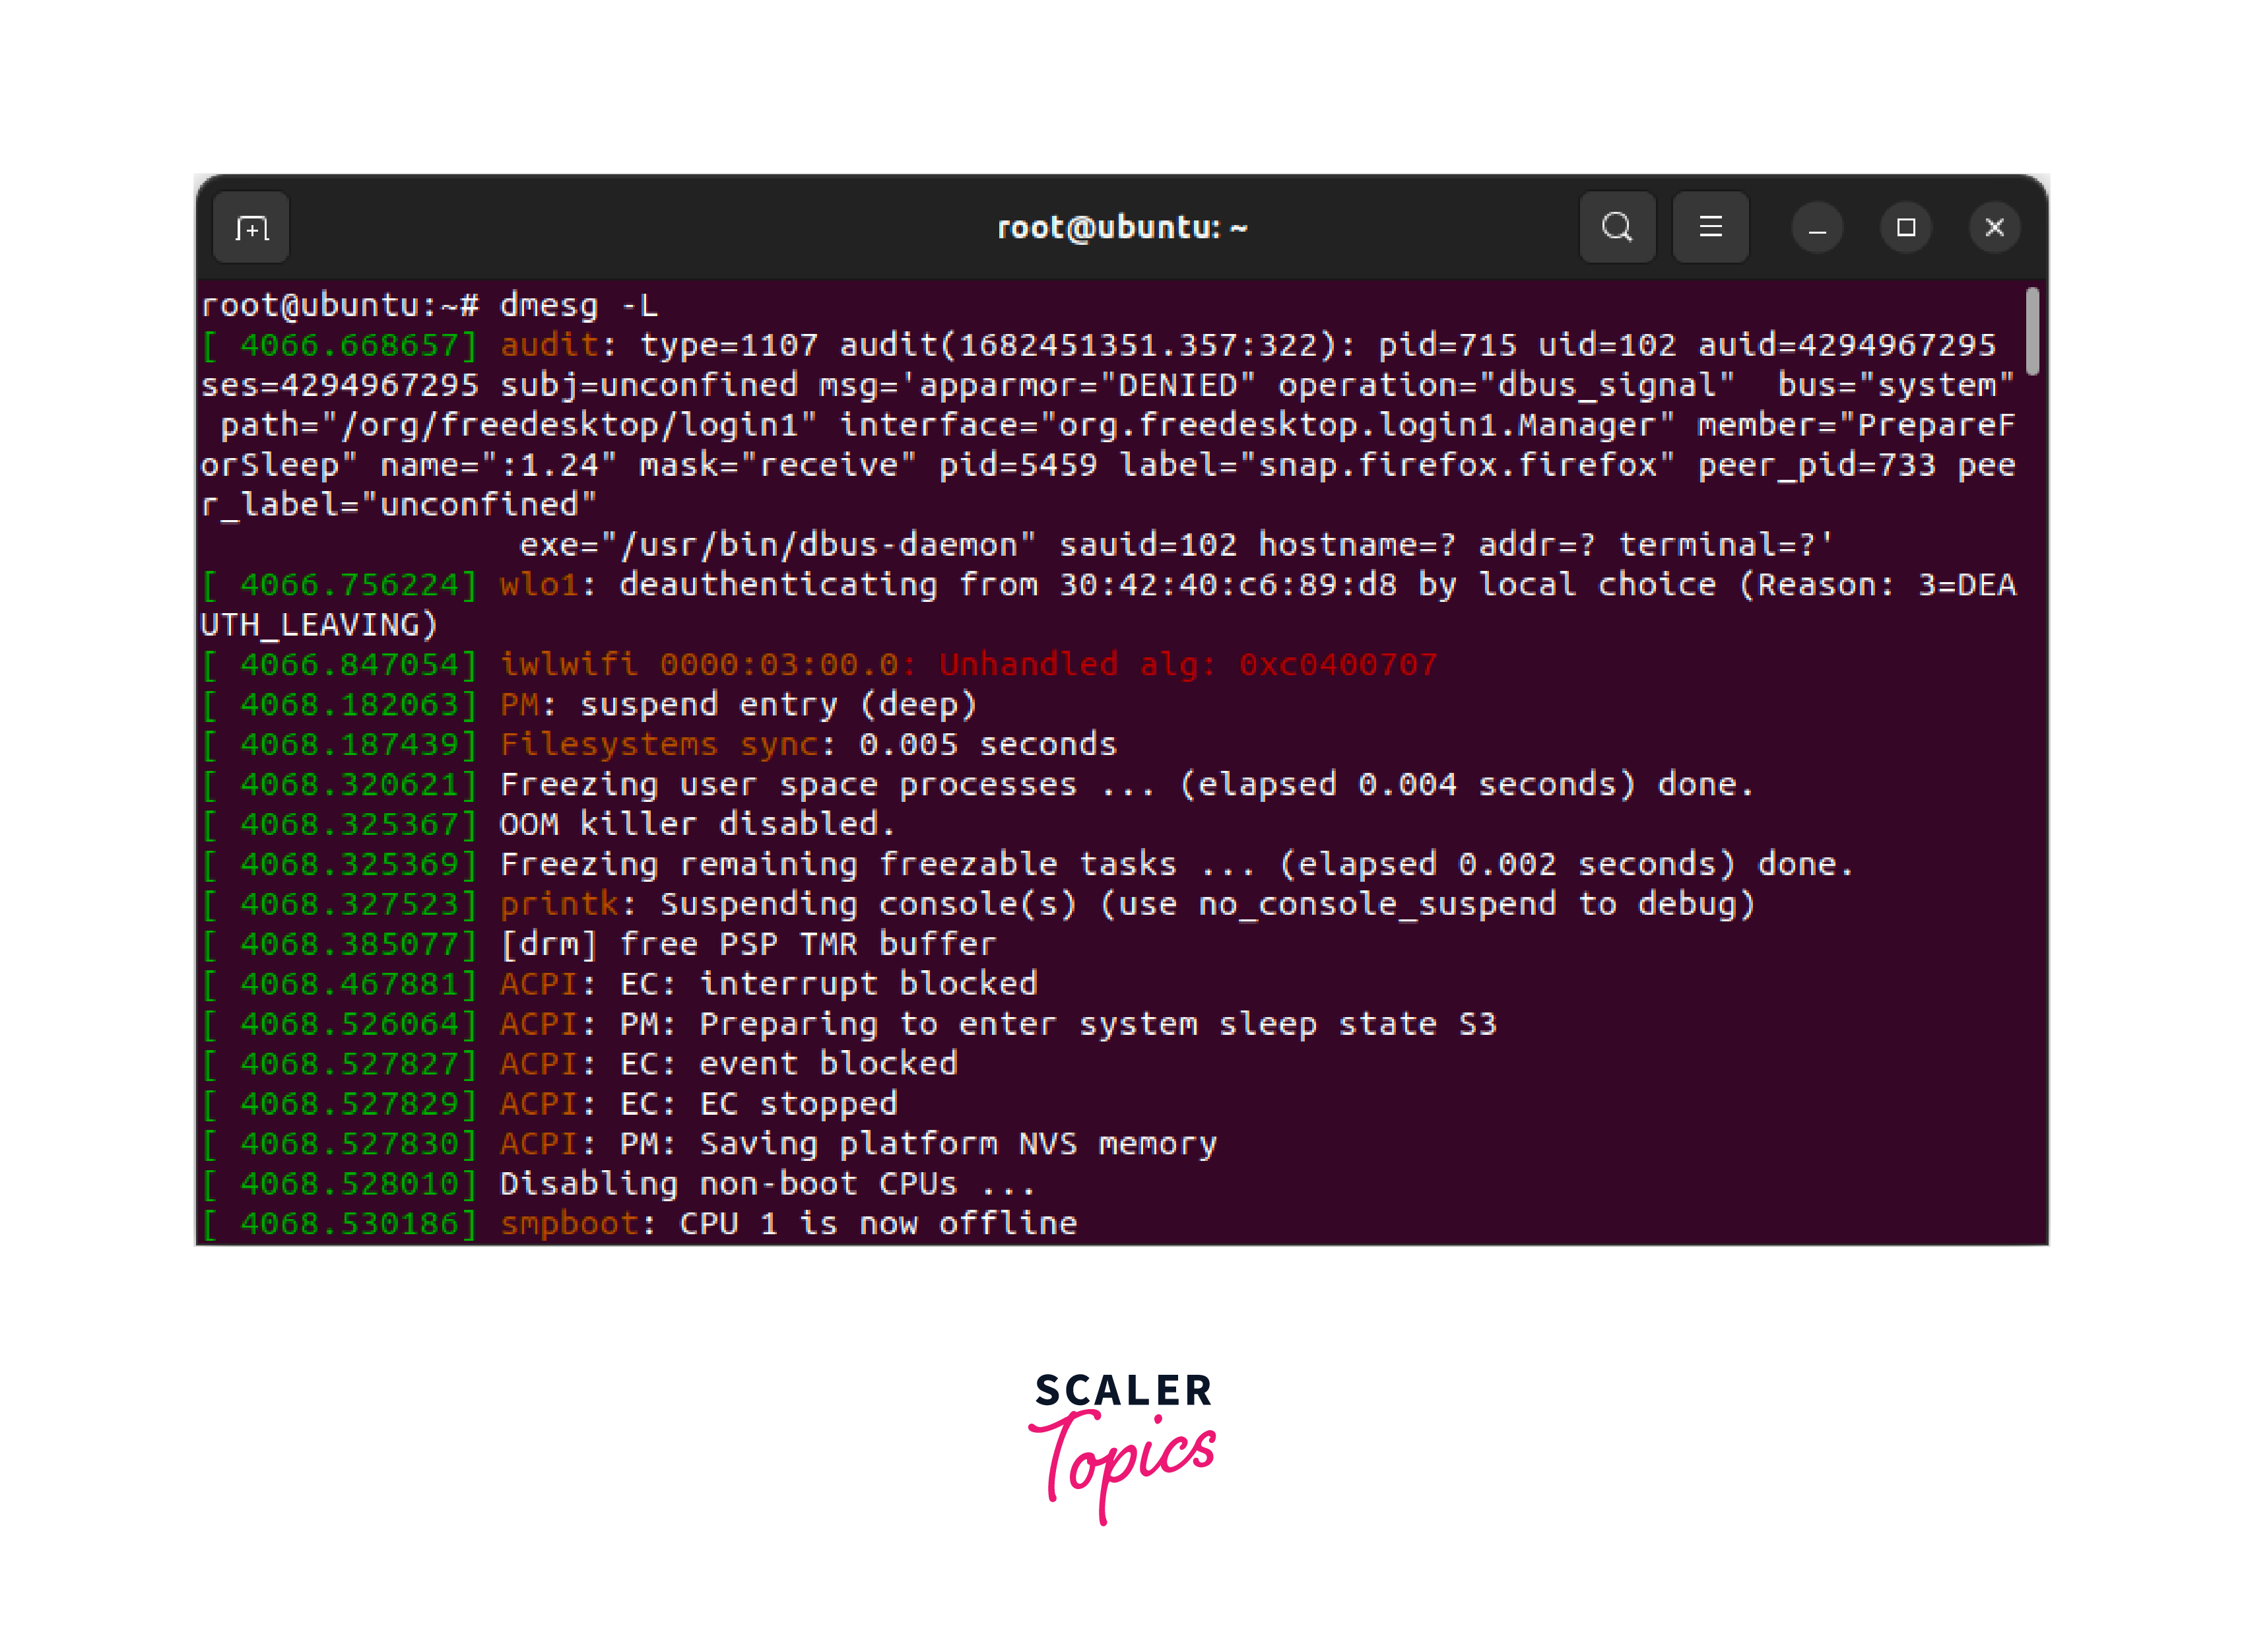
Colorizing the Output using the dmesg Command
To colorize the output of the dmesg Linux command, you can use the -L option. You can also set optional arguments such as --color to auto, never, or always:
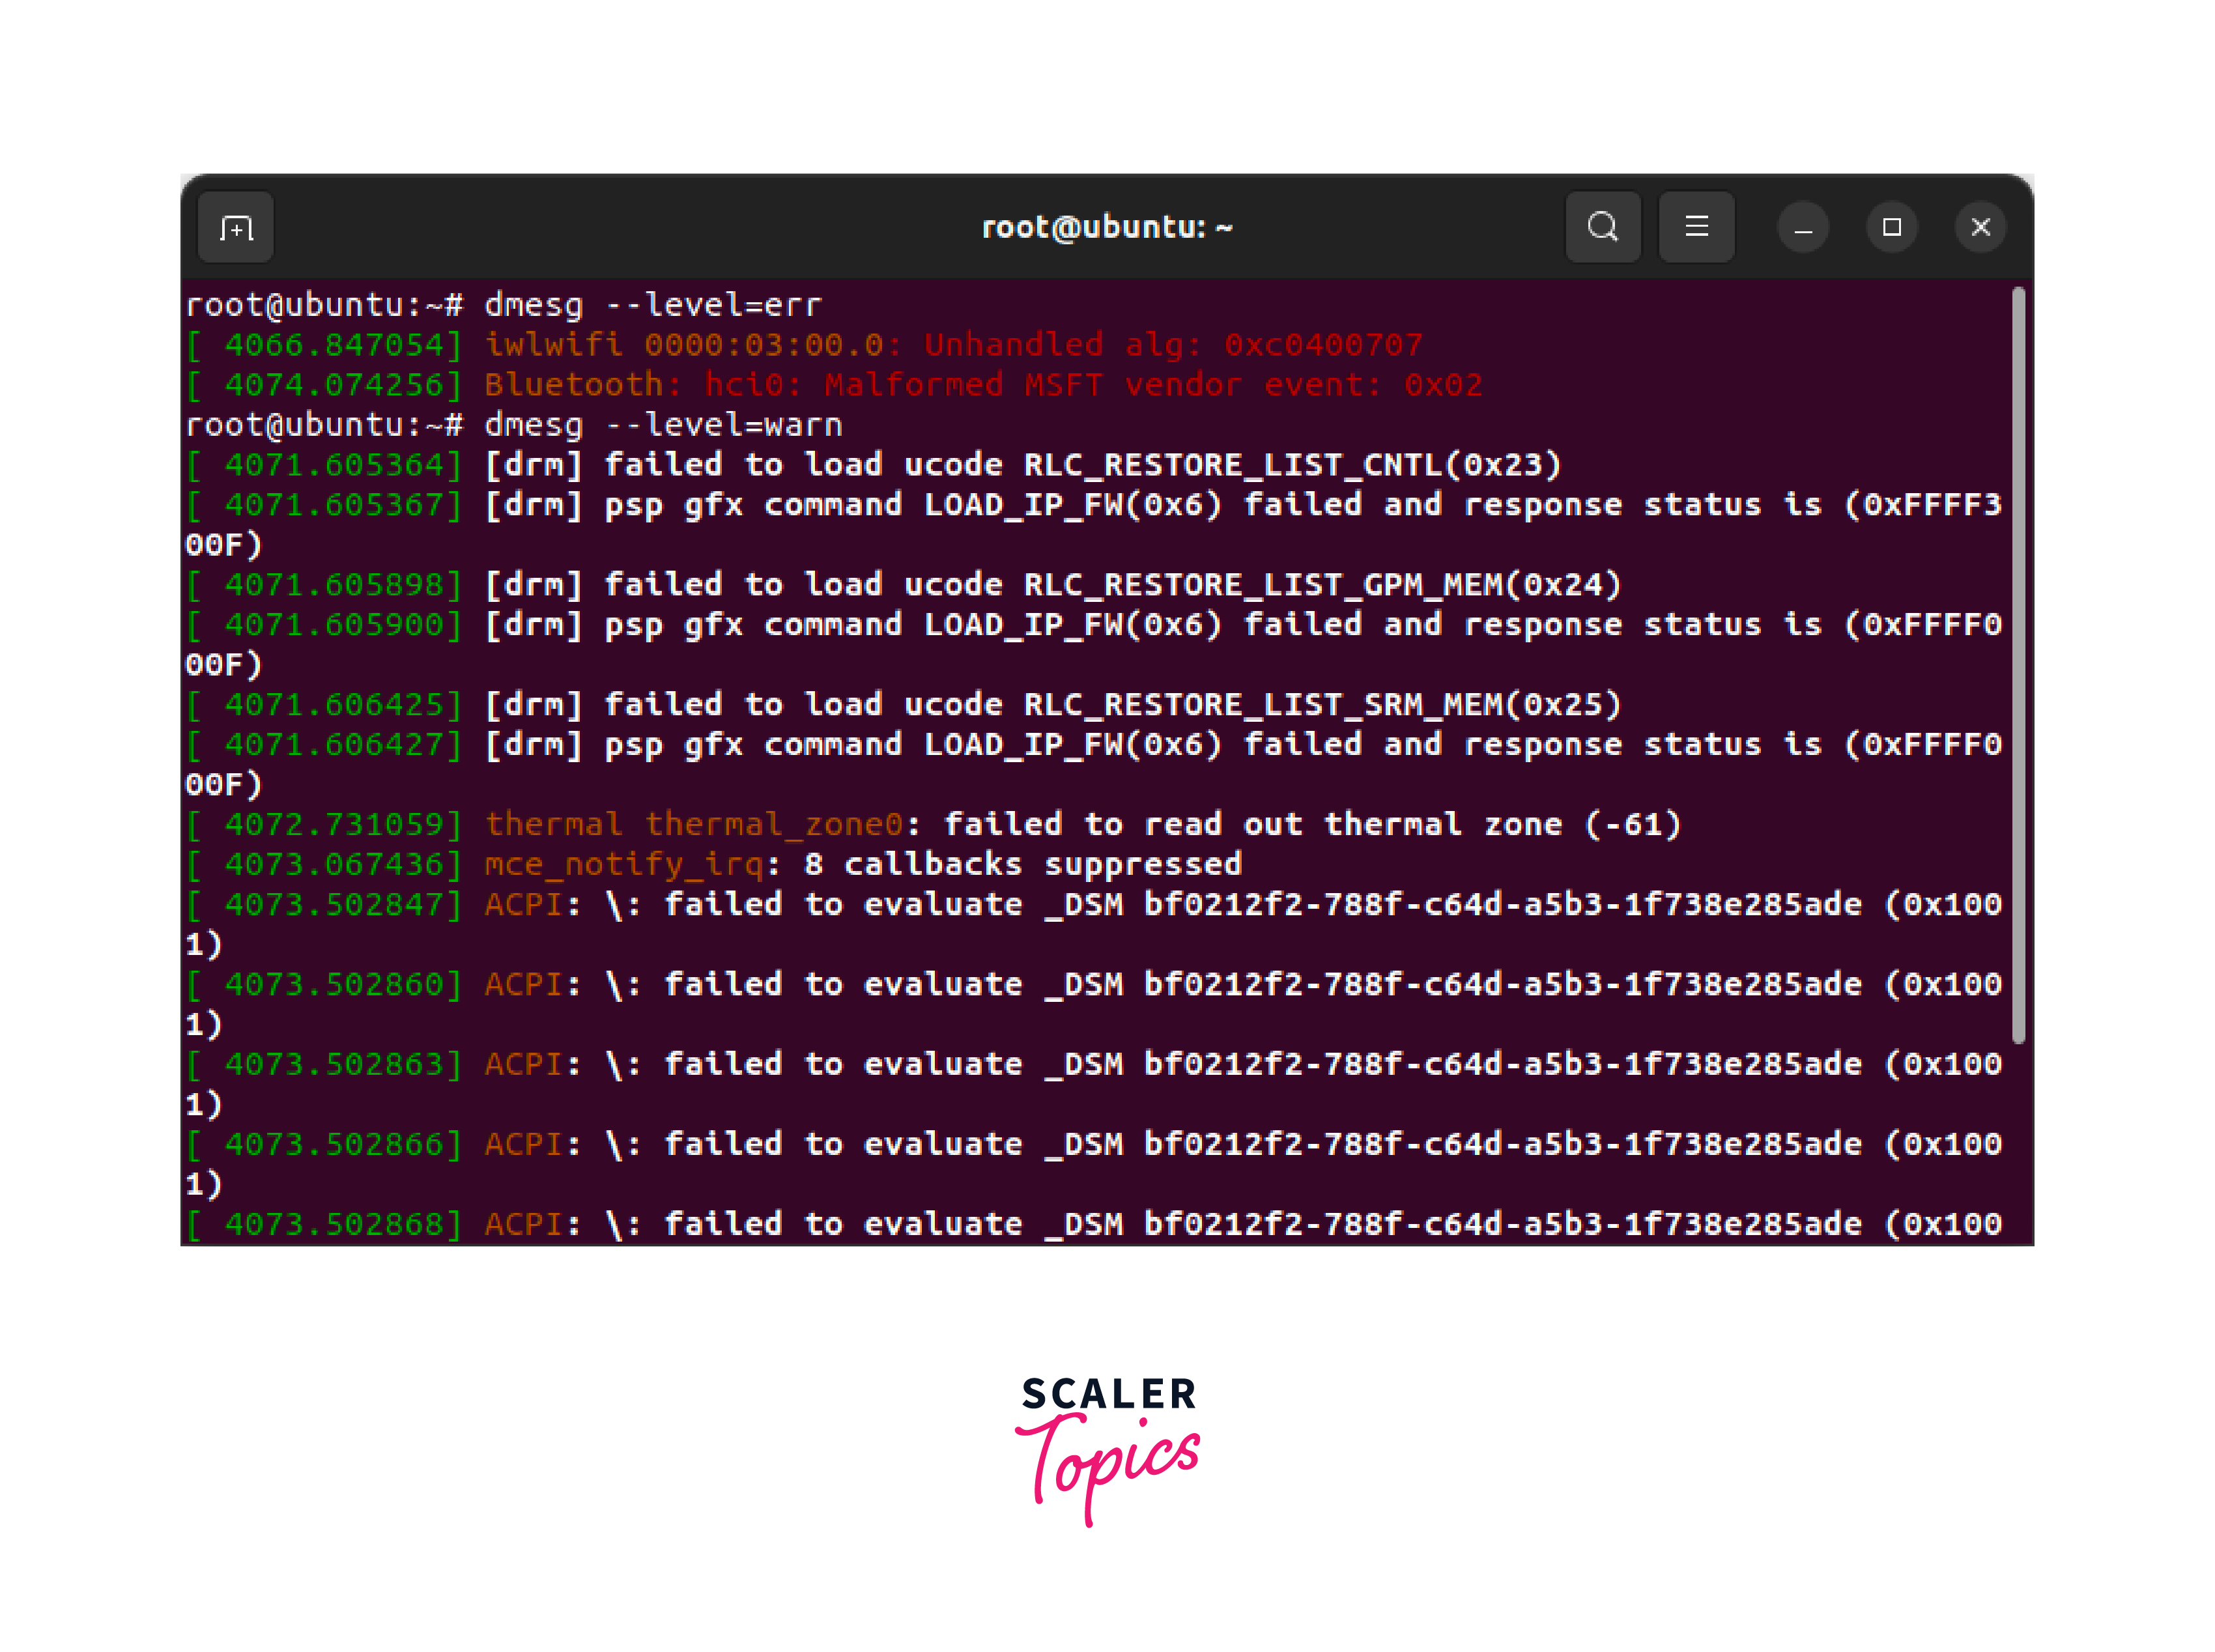
Printing error related logs
You can print logs for various levels. Logs are essentially divided into eight different levels; emerg, alert, crit, fail, caution, notice, data and investigate. You have the option to print logs of these levels by utilizing --level option. The dmesg --level=err command, as an example, is used to print all error-related to dmesg logs, as shown below.
Display dmesg Output in Human-Readable Format
By default, dmesg displays output in kernel message format. However, you can use the -H option to display the output in a human-readable format. For example:
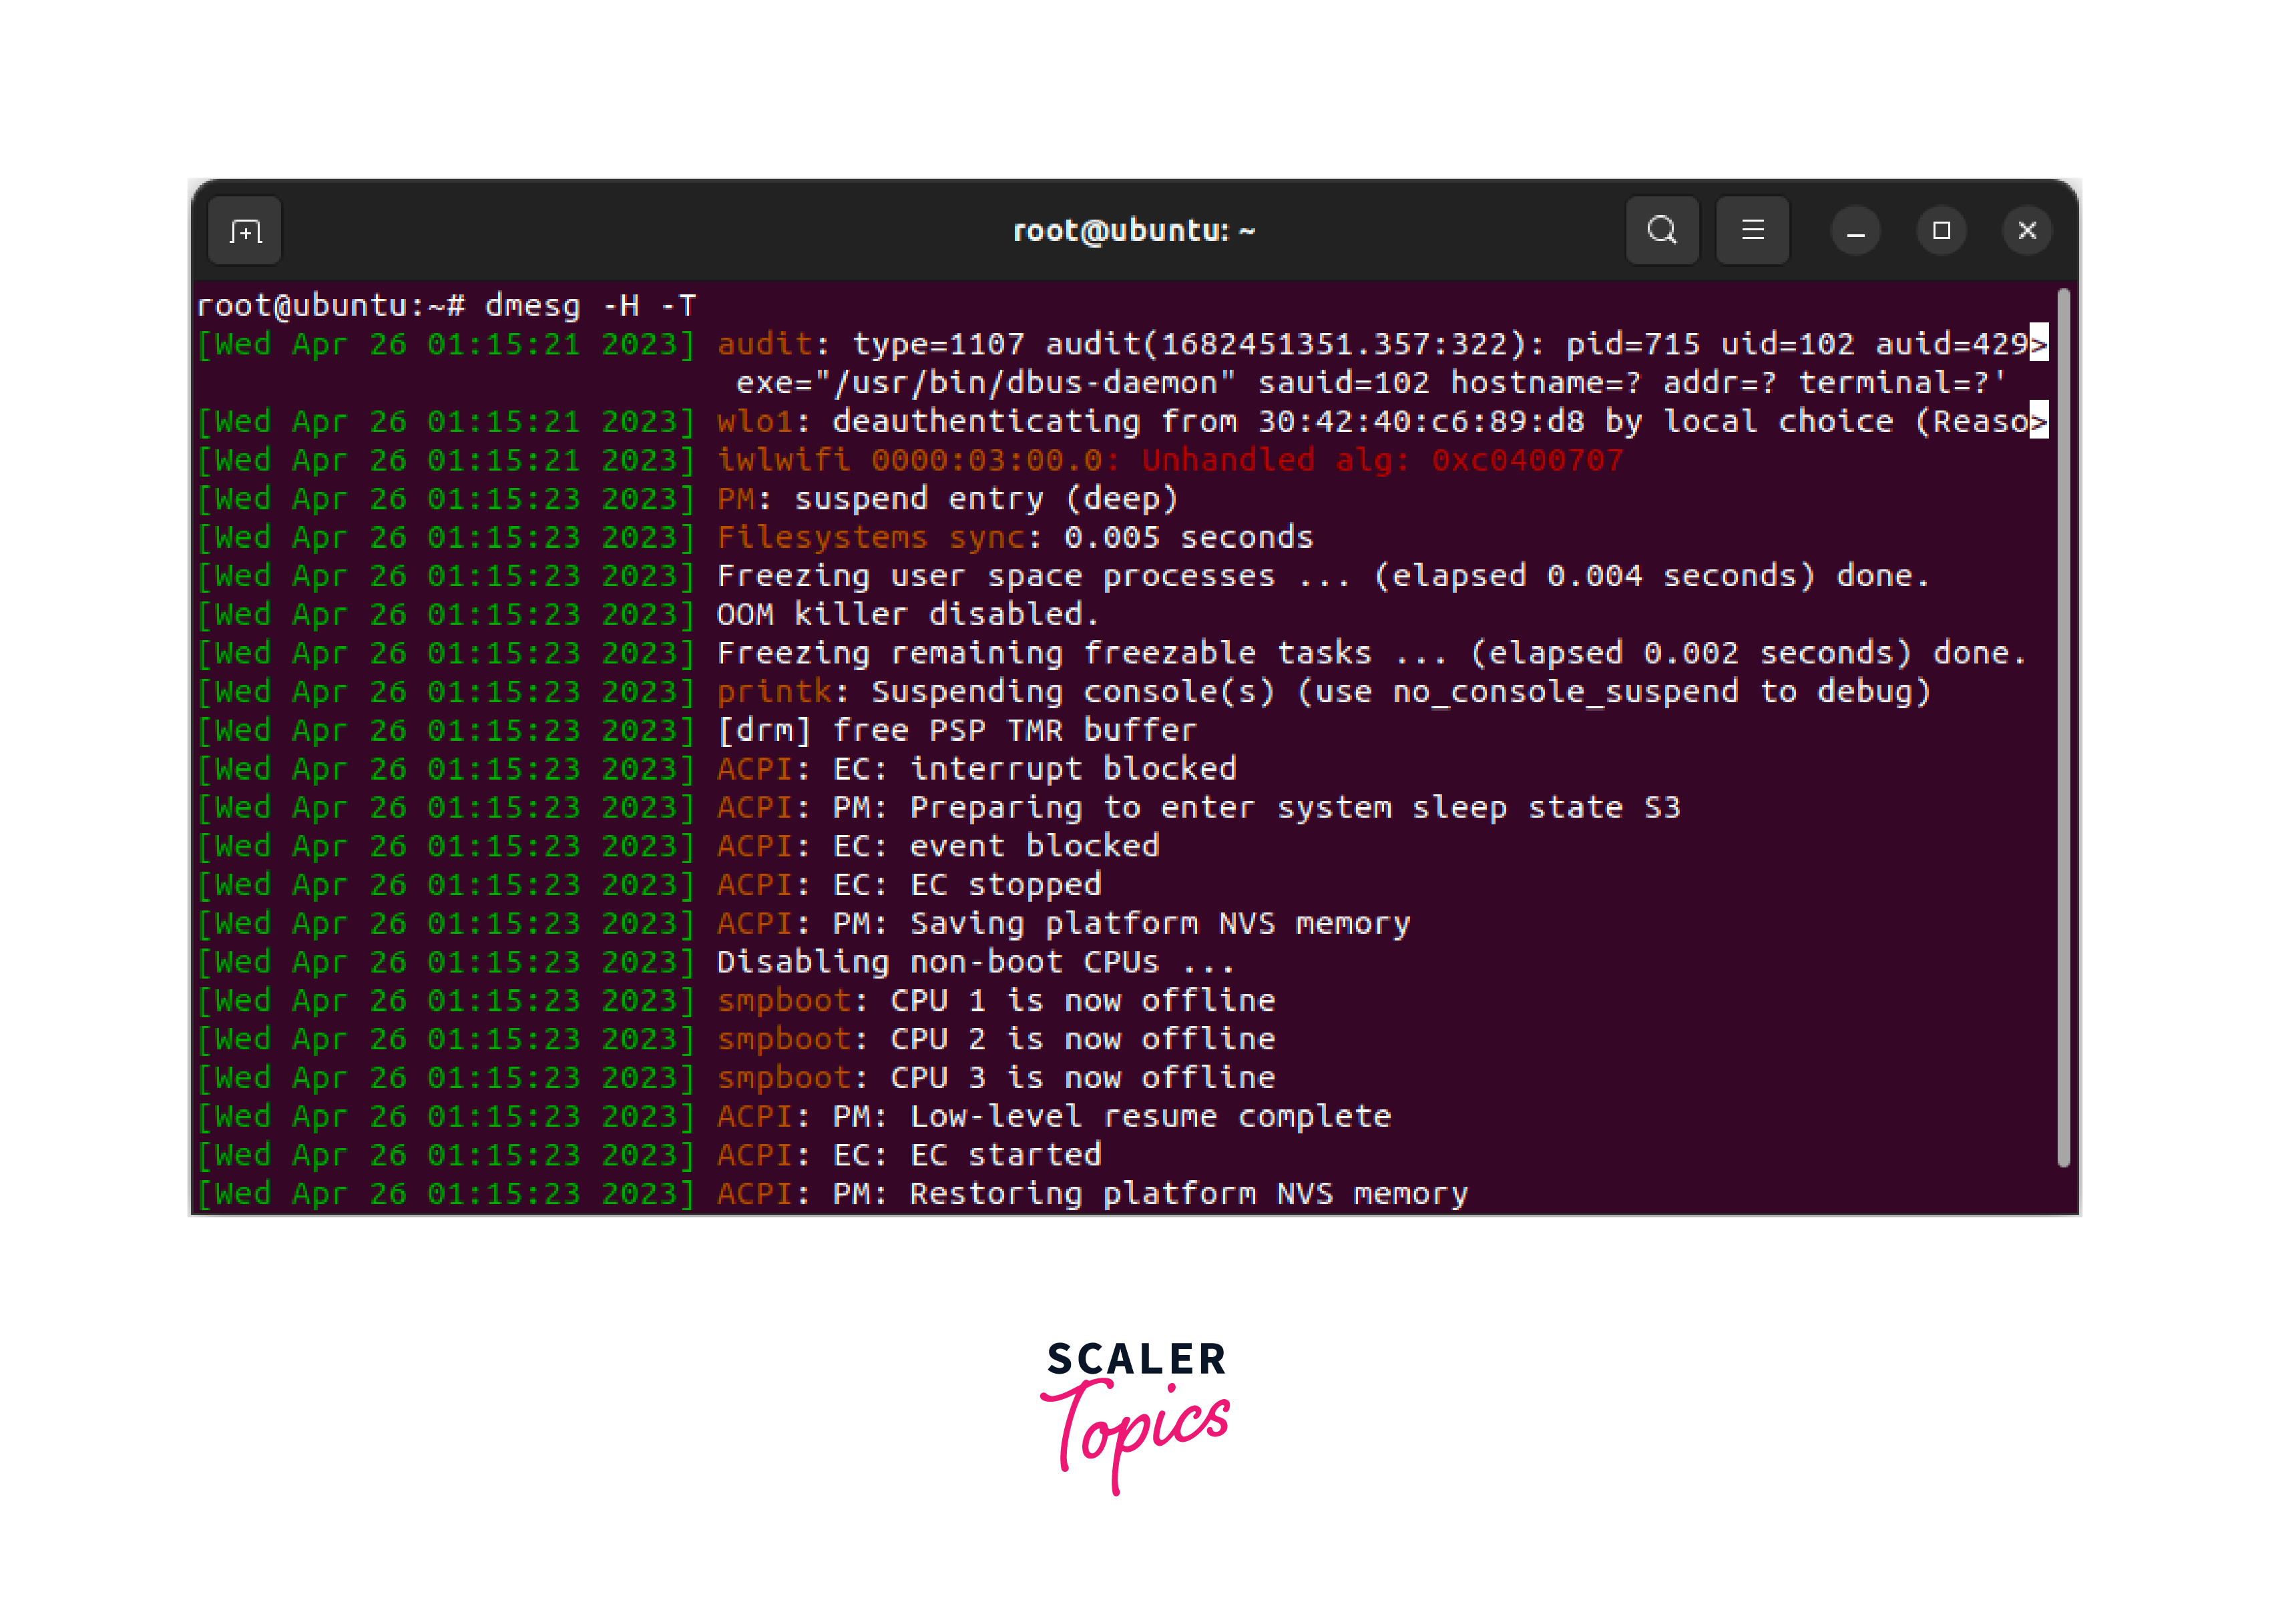
Display dmesg Output with Timestamps in Local Time Zone
You can use the -T option along with the -H option to display the dmesg output with timestamps in the local timezone, For example:
Filter dmesg Output
You can filter the dmesg output to only display specific types of messages using the grep command. For example, if you only want to see messages related to USB devices, you can use the following command:
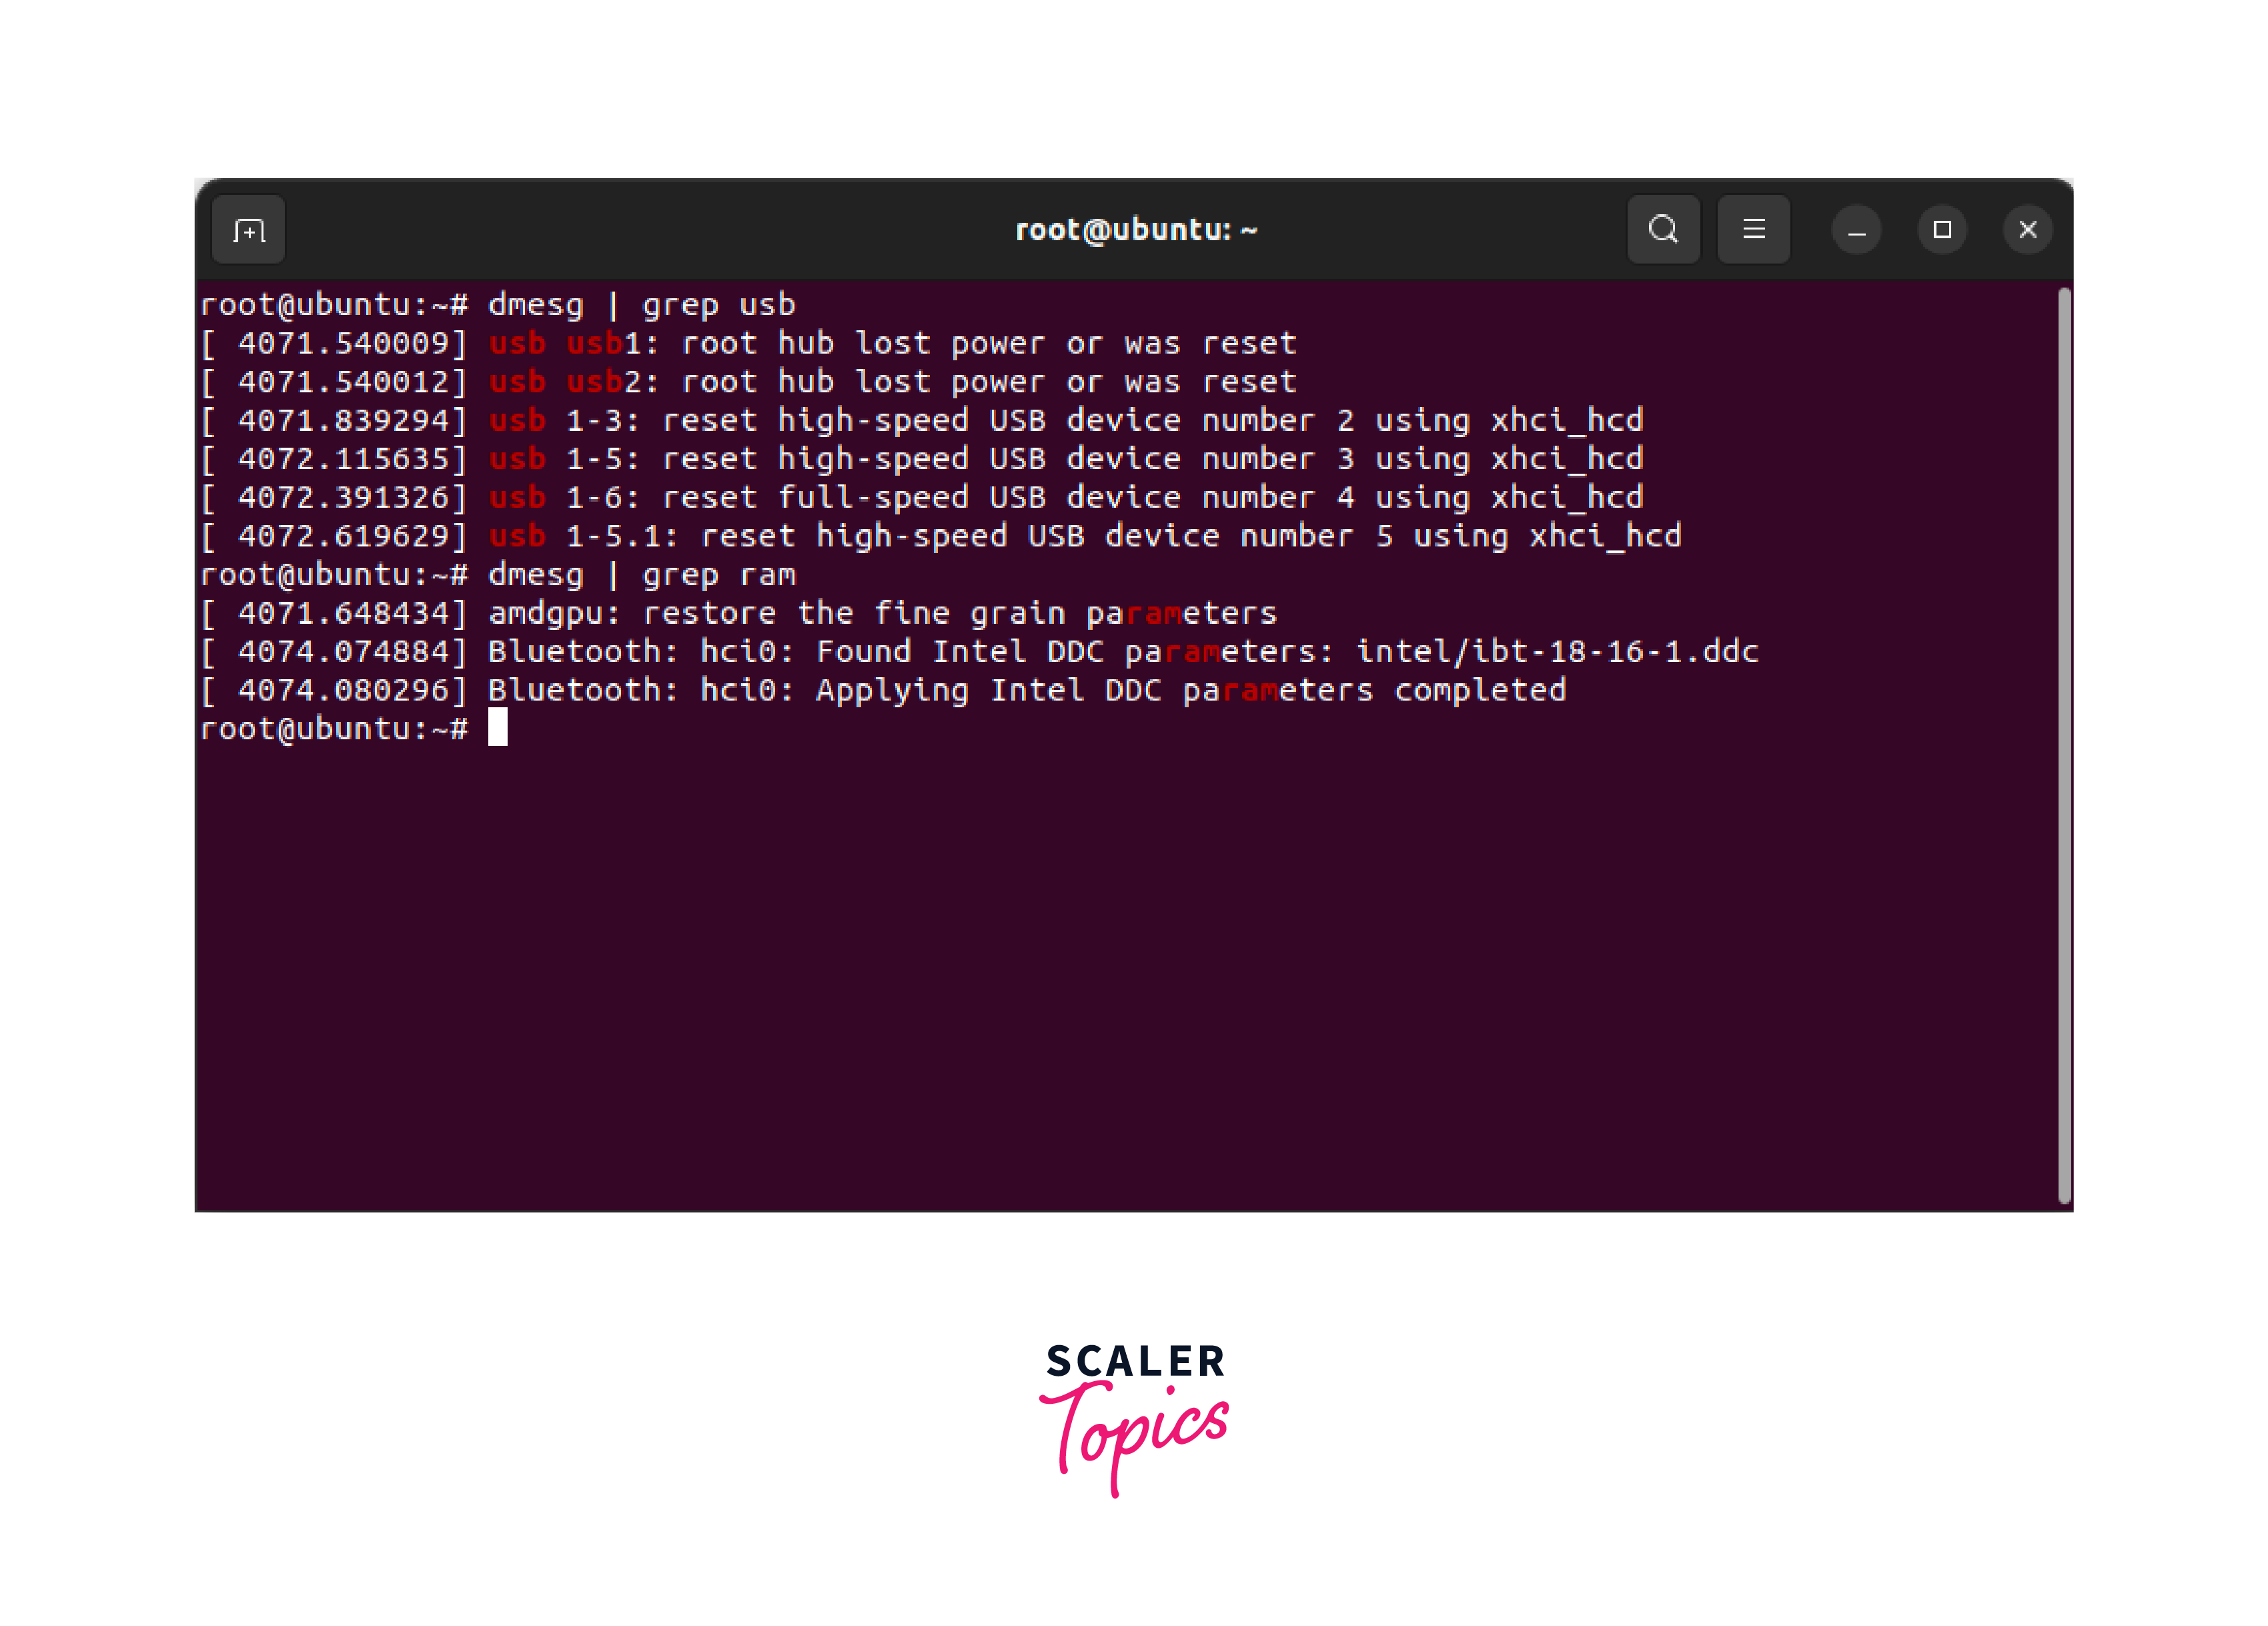
This will display only the lines from the dmesg output that contain the keyword "usb". You can replace "usb" with any other keyword or pattern that you want to filter for.
Display dmes Output in Real-Time
You can use the -w option with dmesg to display the kernel messages in real-time as they are generated. This can be useful for monitoring the system for any new messages. For example:
This will display the dmesg output in real-time, and new messages will be shown as they are generated.
Clear dmesg Buffer
The dmesg Linux command retrieves messages from the kernel's circular buffer, which has a limited size. Over time, the buffer can become full, and old messages may be overwritten by new messages. If you want to clear the dmesg buffer and start fresh, you can use the -c option. For example:
This will clear the dmesg buffer, and you will see only the messages generated after the buffer was cleared.
Making dmesg using Syslog
To make dmesg use Syslog, use the -S option with the dmesg command, as shown below. You can instruct dmesg to obtain log data from Syslog rather than /dev/kmsg by using this option.
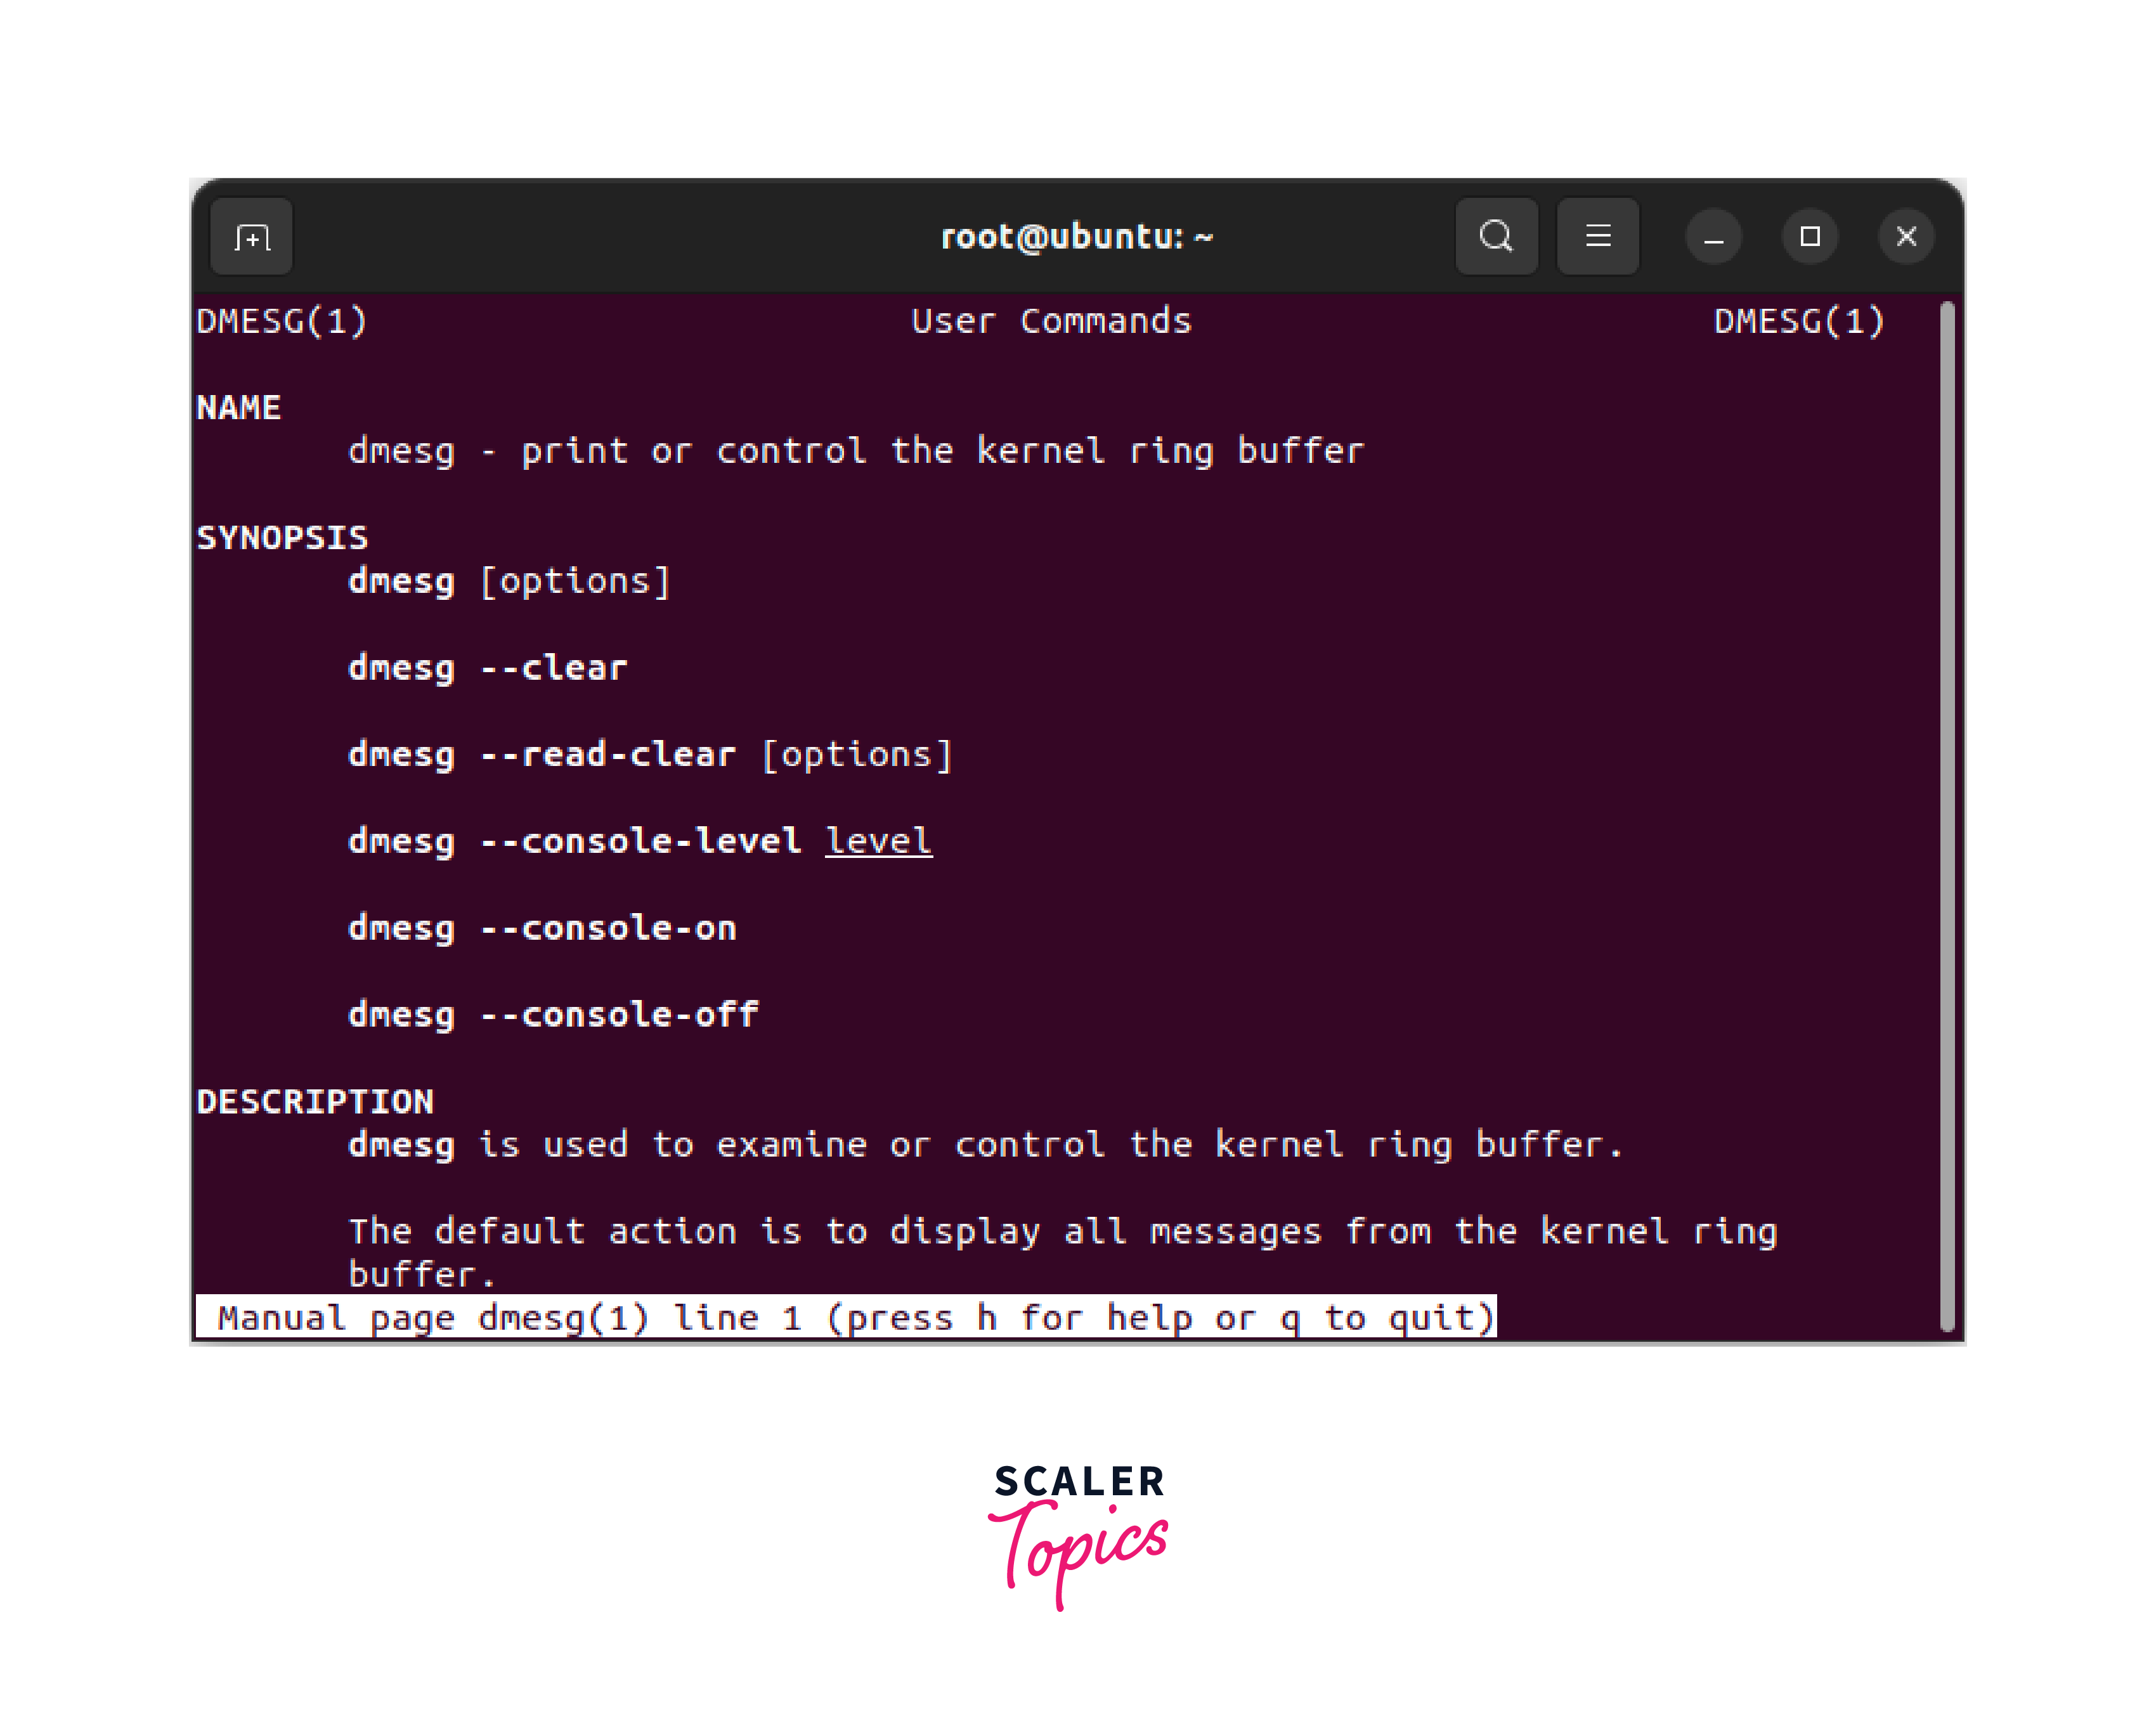
Checking dmesg man Page
If you want to check the dmesg Linux command's man page, use the man dmesg command as shown below.
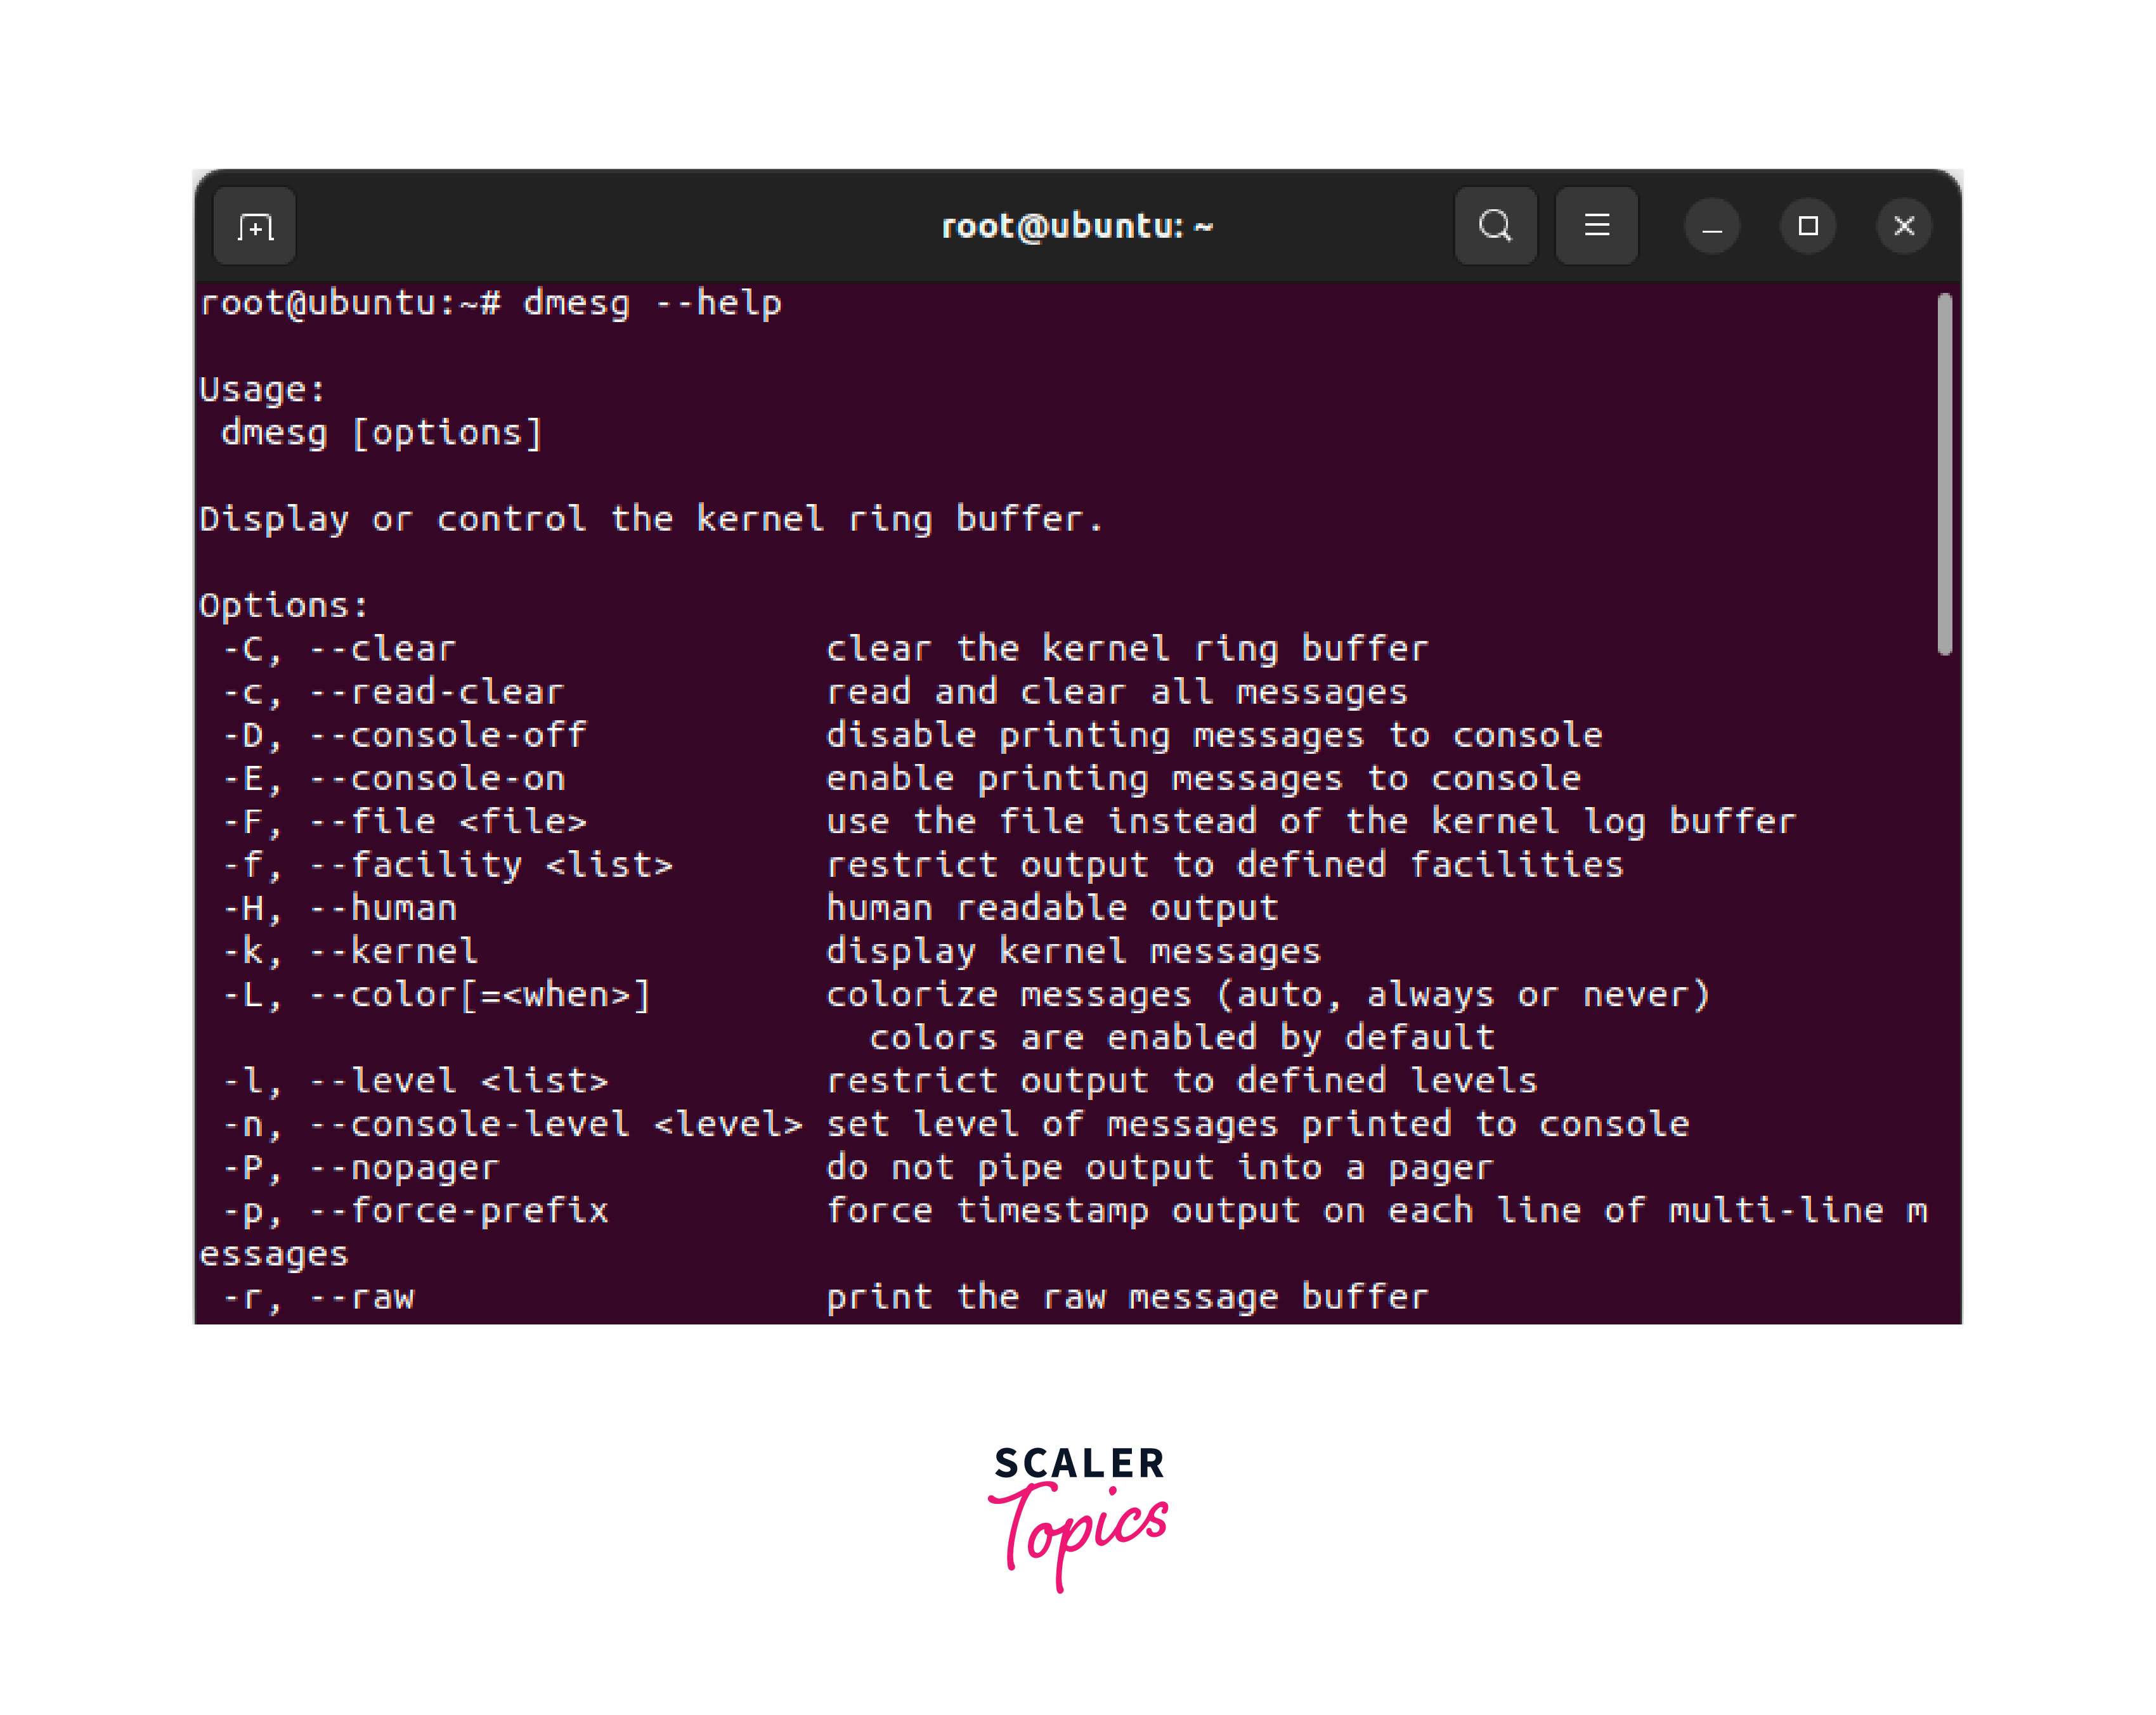
Checking all the options in the dmesg command
To check all the options available in dmesg command, use --help command as shown below.
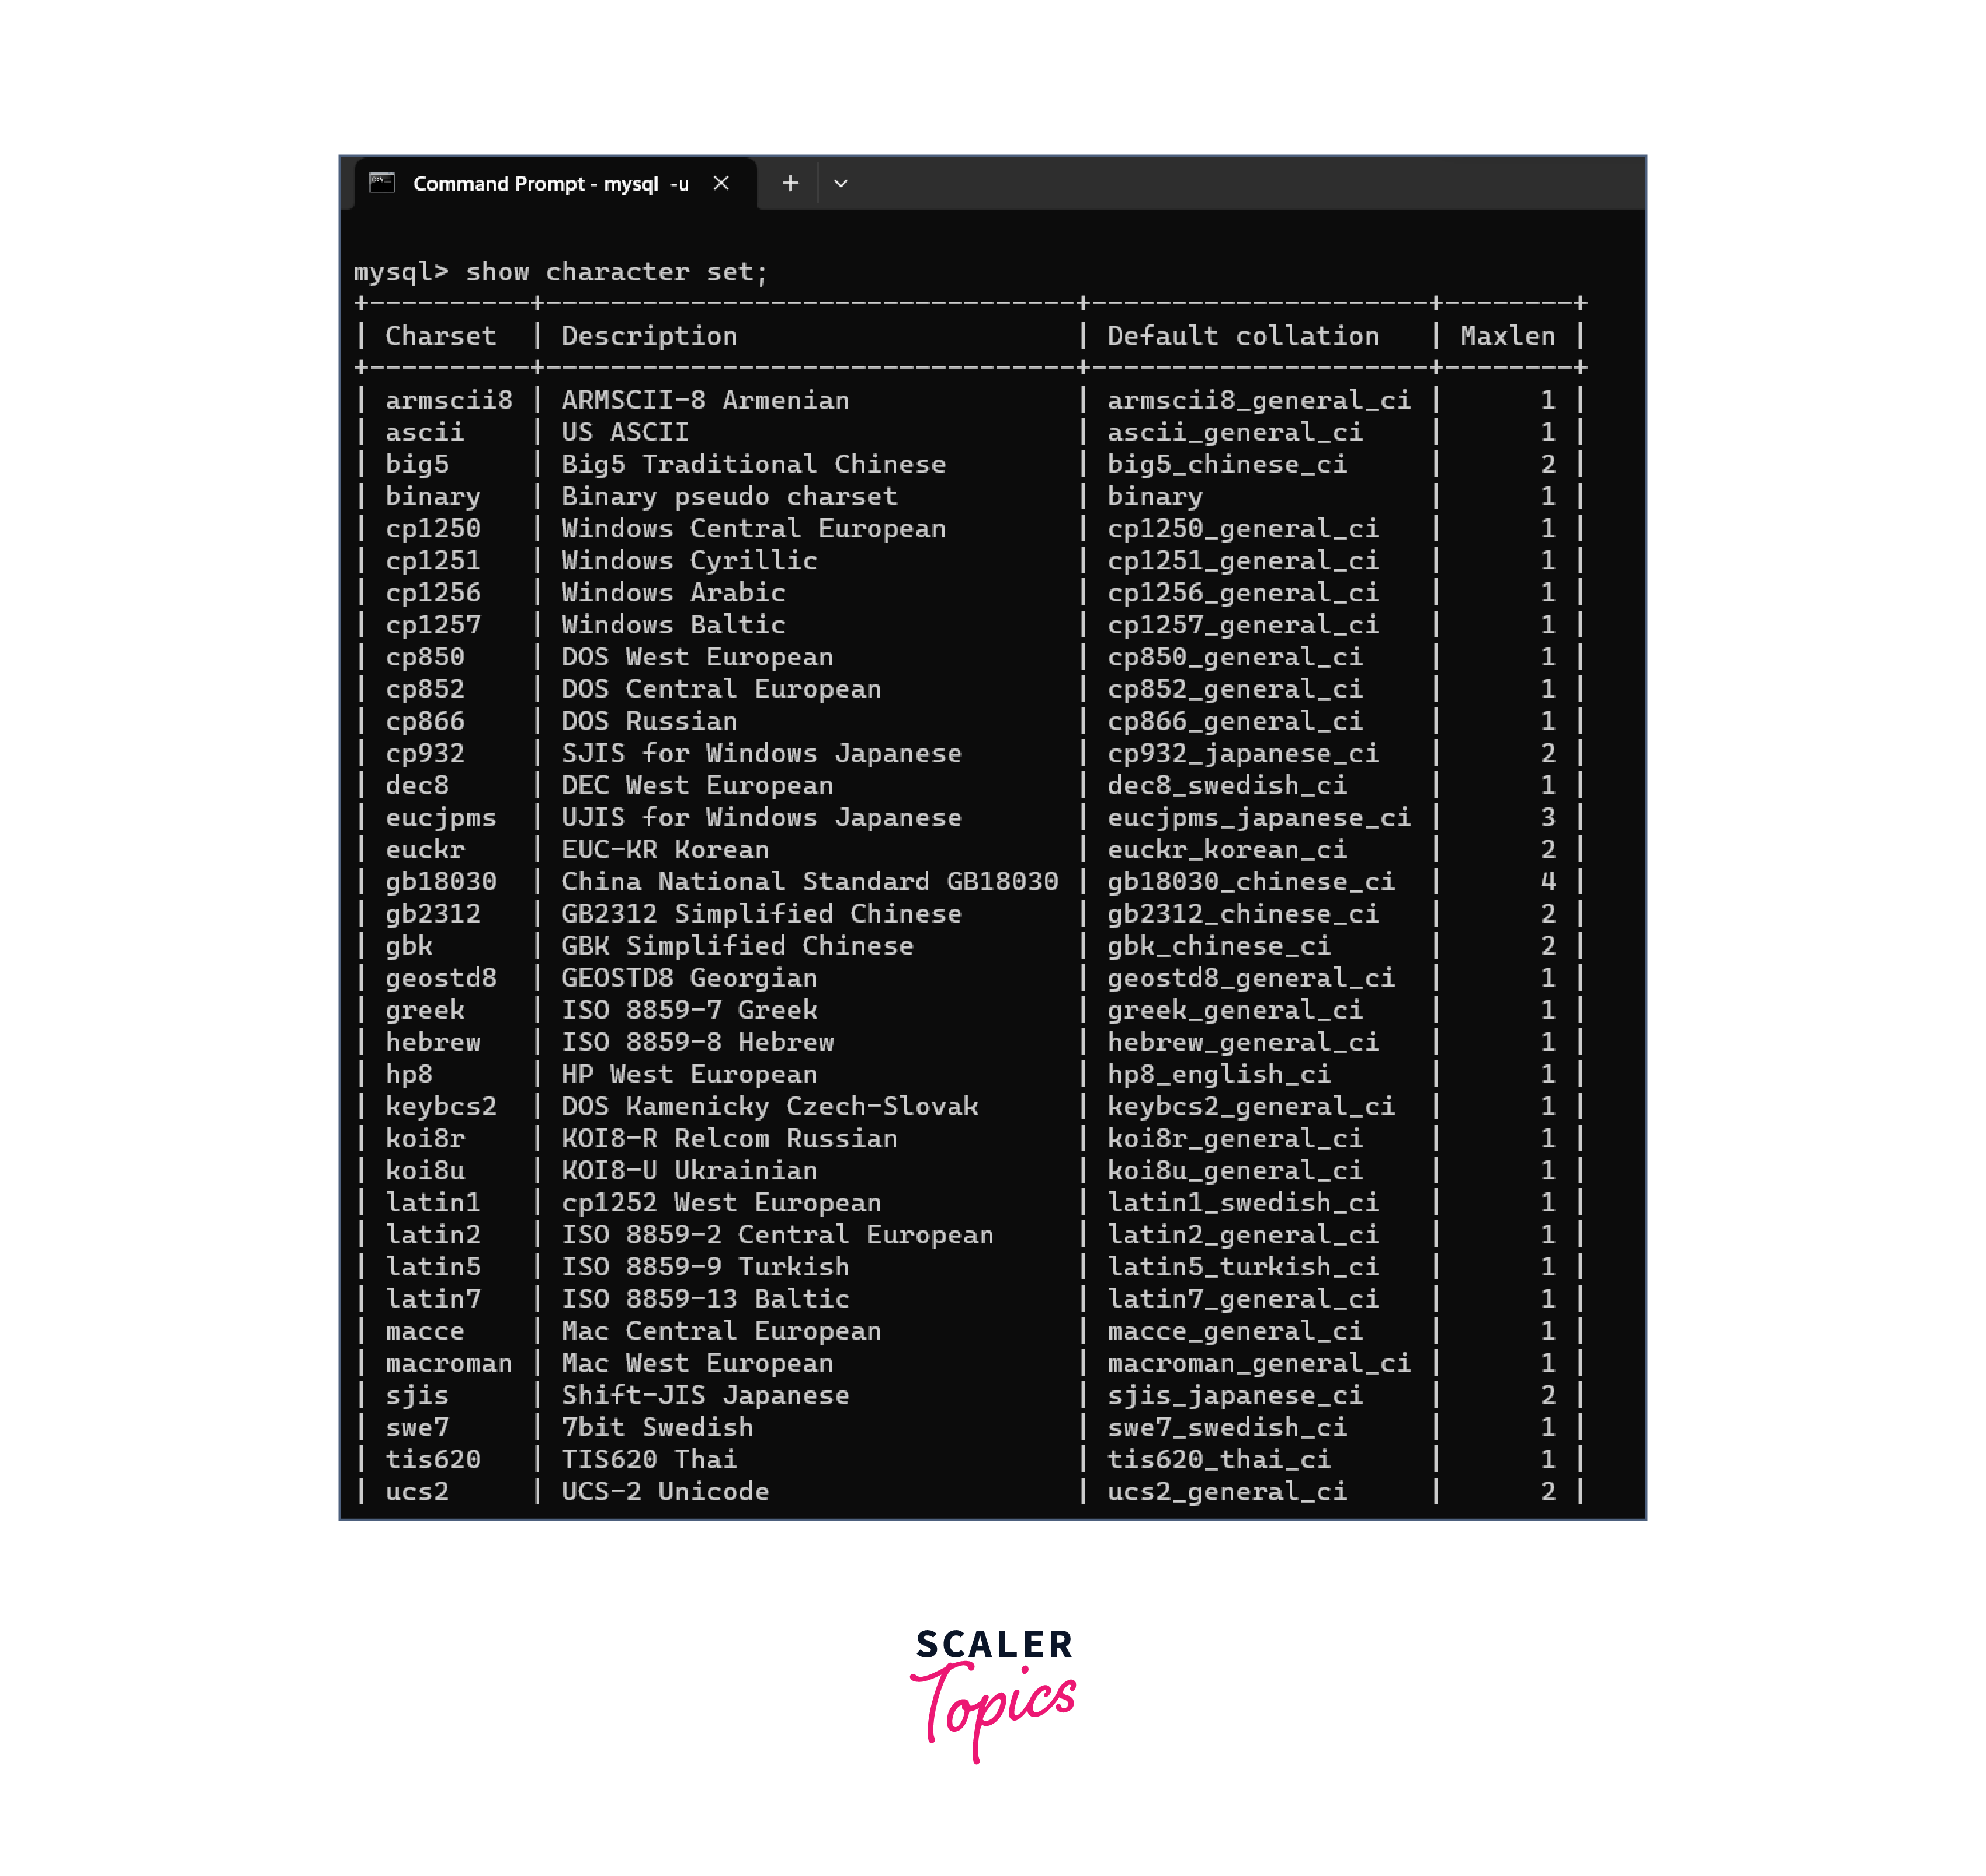
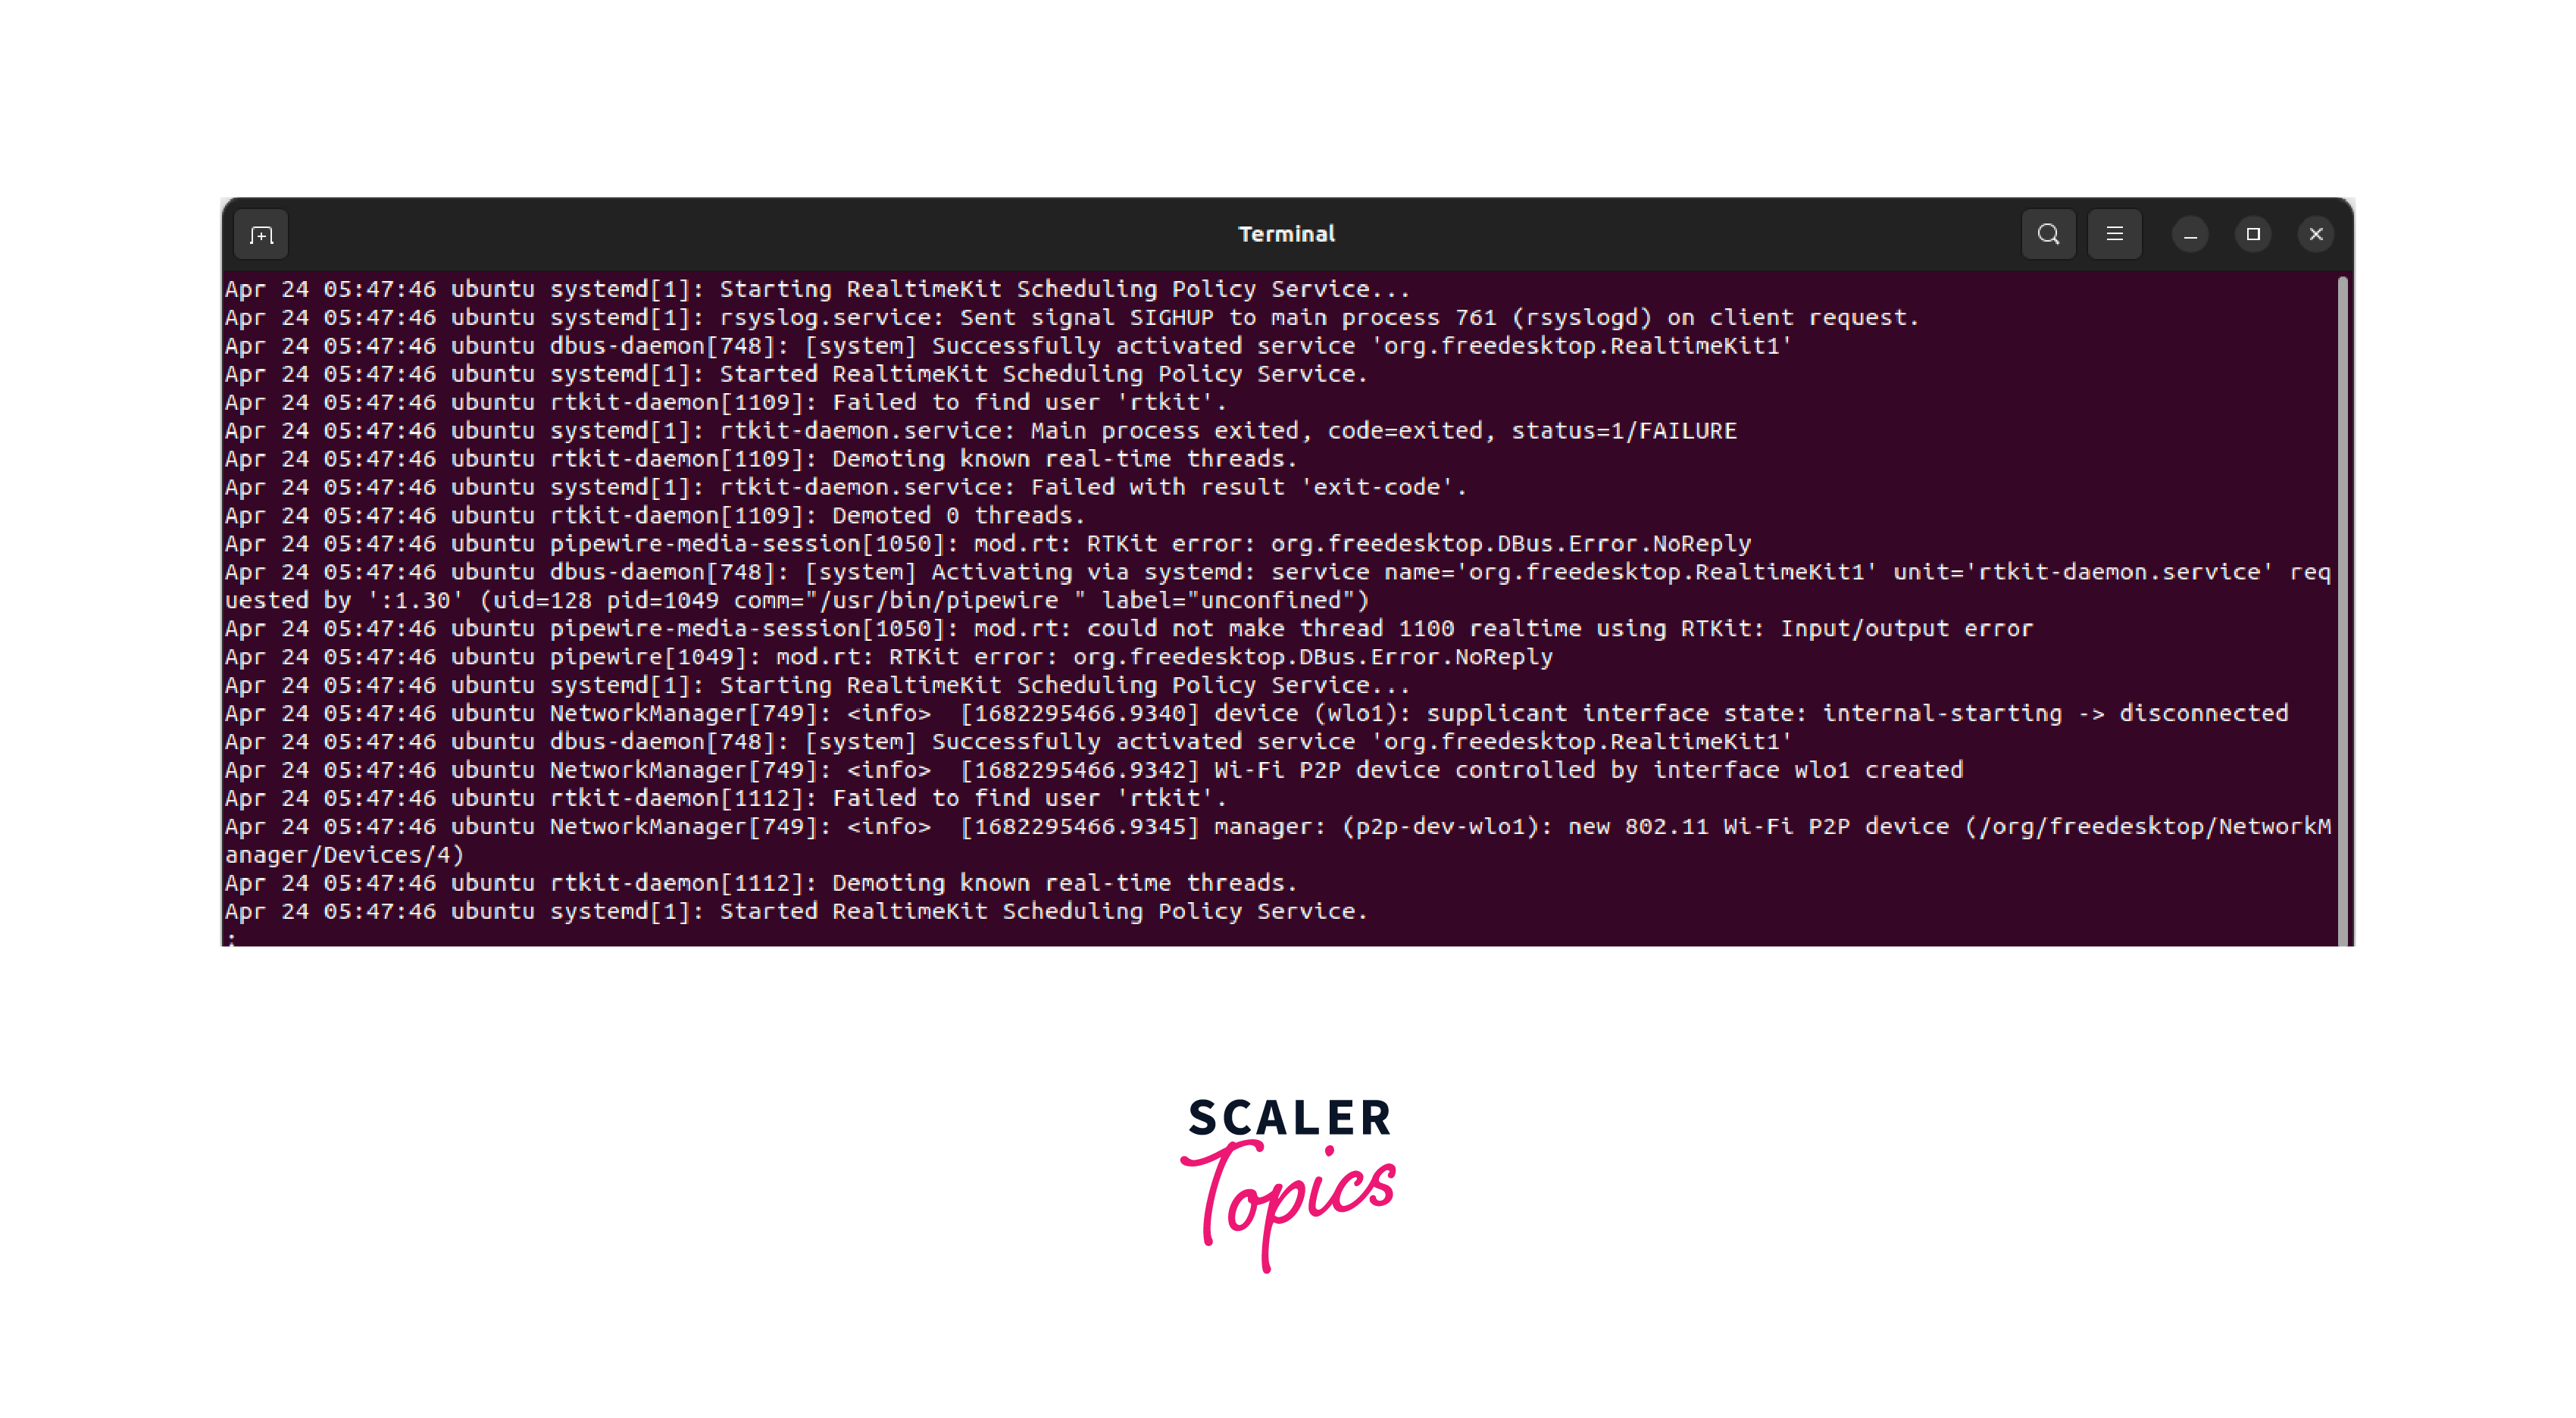
What is Syslog?
Linuxsyslog is a standard logging protocol used in Unix-based systems, including Linux, for collecting, storing, and managing system logs. It allows various system components, applications, and services to send log messages to a central logging server or store them locally for later analysis.
syslog provides a standardized format for logging messages, including a priority level, a timestamp, a hostname, and a message text. The priority level indicates the severity of the message, ranging from "emerg" (emergency) to "debug" (debugging information), which helps in filtering and categorizing log messages based on their severity.
syslog allows system administrators to configure log collection, storage, and processing according to their requirements. It provides flexibility in managing logs, such as forwarding logs to remote logging servers, storing logs locally, rotating logs to prevent disk space issues, and filtering logs based on priority or other criteria.
Configuring Syslog for Linux
Linux syslog is managed by the syslog daemon, which is responsible for receiving, processing, and storing log messages. The syslog daemon reads the configuration file /etc/syslog.conf to determine how log messages should be handled.
To configure syslog in Linux, follow these steps:
Step 1. Editing the /etc/syslog.conf file : Open the syslog configuration file /etc/syslog.conf using a text editor, such as vi or nano, with root privileges.
Step 2. Configuring logging rules : In the syslog.conf file, you can specify logging rules that define how log messages should be handled. Each logging rule consists of two parts: a selector and an action. The selector specifies the criteria for filtering log messages, such as the facility and priority level, and the action specifies what should be done with the matching log messages, such as storing them locally or forwarding them to a remote logging server.
Step 3. Defining logging destinations : In syslog, you can define logging destinations, such as local files or remote logging servers, where log messages should be sent. You can specify the logging destinations in the action part of the logging rules in the syslog.conf file. For example, you can configure syslog to store log messages in local files under /var/log directory, or forward them to a remote logging server using the IP address or hostname of the server.
Step 4. Configuring log rotation : Log rotation is a process of managing log files to prevent them from consuming excessive disk space. In syslog, you can configure log rotation by specifying the maximum size or age of log files in the action part of the logging rules in the syslog.conf file. Log rotation can help in managing log files efficiently and preventing disk space issues.
Step 5. Restarting the Linux syslog daemon : After making changes to the syslog.conf file, you need to restart the Linux syslog daemon to apply the changes. You can do this by running the appropriate command for your Linux distribution, such as systemctl restart syslog or service syslog restart.
Server Configuration for Remote System Logging
If you want to configure remote system logging in Linux, where log messages from multiple systems are forwarded to a central logging server, you need to configure both the server and client systems. Here are the steps to configure the server for remote system logging:
Step 1. Install Linux syslog server software : You need to install syslog server software on the central logging server. There are several syslog server software available for Linux, such as rsyslog, syslog-ng, and syslogd. You can choose the one that best fits your requirements and install it using the package manager of your Linux distribution.
Step 2. Configure Linux syslog server : Once the syslog server software is installed, you need to configure it to receive log messages from remote systems. This typically involves editing the configuration file of the syslog server software, such as /etc/rsyslog.conf for rsyslog, to specify the logging destinations for remote log messages.
Step 3. Specify logging destinations : In the configuration file of the syslog server software, you need to specify the logging destinations where log messages from remote systems should be stored. You can specify local files, remote files, or other destinations, such as databases or external logging services, depending on your requirements. For example, you can configure Linux syslog to store log messages from remote systems in separate log files under /var/log directory, or forward them to a remote logging service using a specific protocol.
Step 4. Configure firewall : If you have a firewall enabled on the central logging server, you need to configure it to allow incoming log messages from remote systems. You can do this by opening the necessary ports for syslog communication, such as UDP port 514 or TCP port 601 for rsyslog, in the firewall configuration.
Step 5. Restart Linux syslog server : After making changes to the configuration file of the syslog server software, you need to restart the syslog server to apply the changes. You can do this by running the appropriate command for your Linux distribution, such as systemctl restart rsyslog or service rsyslog restart.
Client Configuration for Viewing Remote Syslogs
After configuring the central logging server, you need to configure the client systems to send log messages to the remote logging server. Here are the steps to configure a client system for viewing remote syslog:
Step 1. Installing Linux syslog client software : You need to install syslog client software on the client systems that you want to send log messages to the central logging server. The syslog client software allows the client systems to generate and forward log messages to the remote logging server. You can install syslog client software using the package manager of your Linux distribution.
Step 2. Configuring Linux syslog client : Once the syslog client software is installed, you need to configure it to send log messages to the remote logging server. This typically involves editing the configuration file of the syslog client software, such as /etc/rsyslog.conf for rsyslog, to specify the logging destinations for log messages.
Step 3. Specifying logging destinations : In the configuration file of the syslog client software, you need to specify the logging destinations where log messages should be forwarded. You can specify the IP address or hostname of the central logging server, along with the appropriate port and protocol, depending on the configuration of the syslog server. For example, you can configure syslog to send log messages to the central logging server using UDP or TCP protocol on port 514 or 601.
Step 4. Restarting Linux syslog client : After making changes to the configuration file of the syslog client software, you need to restart the syslog client to apply the changes. You can do this by running the appropriate command for your Linux distribution, such as systemctl restart rsyslog or service rsyslog restart.
Step 5. Viewing remote of Linux syslogs** :** Once the syslog client is configured and restarted, it will start forwarding log messages to the central logging server. You can then view the remote syslogs on the central logging server using the syslog server software. The syslog server software typically provides tools or commands to view and analyze log messages, such as log analyzers, log viewers, or command-line tools like grep and tail.
What is SAR Command?
System Activity Reporter (sar) is a powerful command-line utility in Linux that is used for monitoring and analyzing system performance. sar Linux command collects and stores system activity data, such as CPU usage, memory usage, disk I/O, and network activity, at regular intervals, and allows you to analyze the historical performance data to identify performance issues, troubleshoot problems, and optimize system performance.
sar Linux command is a part of the sysstat package, which is available in most Linux distributions by default or can be installed using the package manager. Once installed, sar provides a rich set of commands and options to collect and analyze system performance data. sar data is stored in binary format, which can be converted into human-readable format using other commands or tools provided by the sysstat package.
Checking Linux System Performance with Sar
sar Linux command provides various commands and options to collect and analyze system performance data. Here are some commonly used SAR commands for checking Linux system performance:
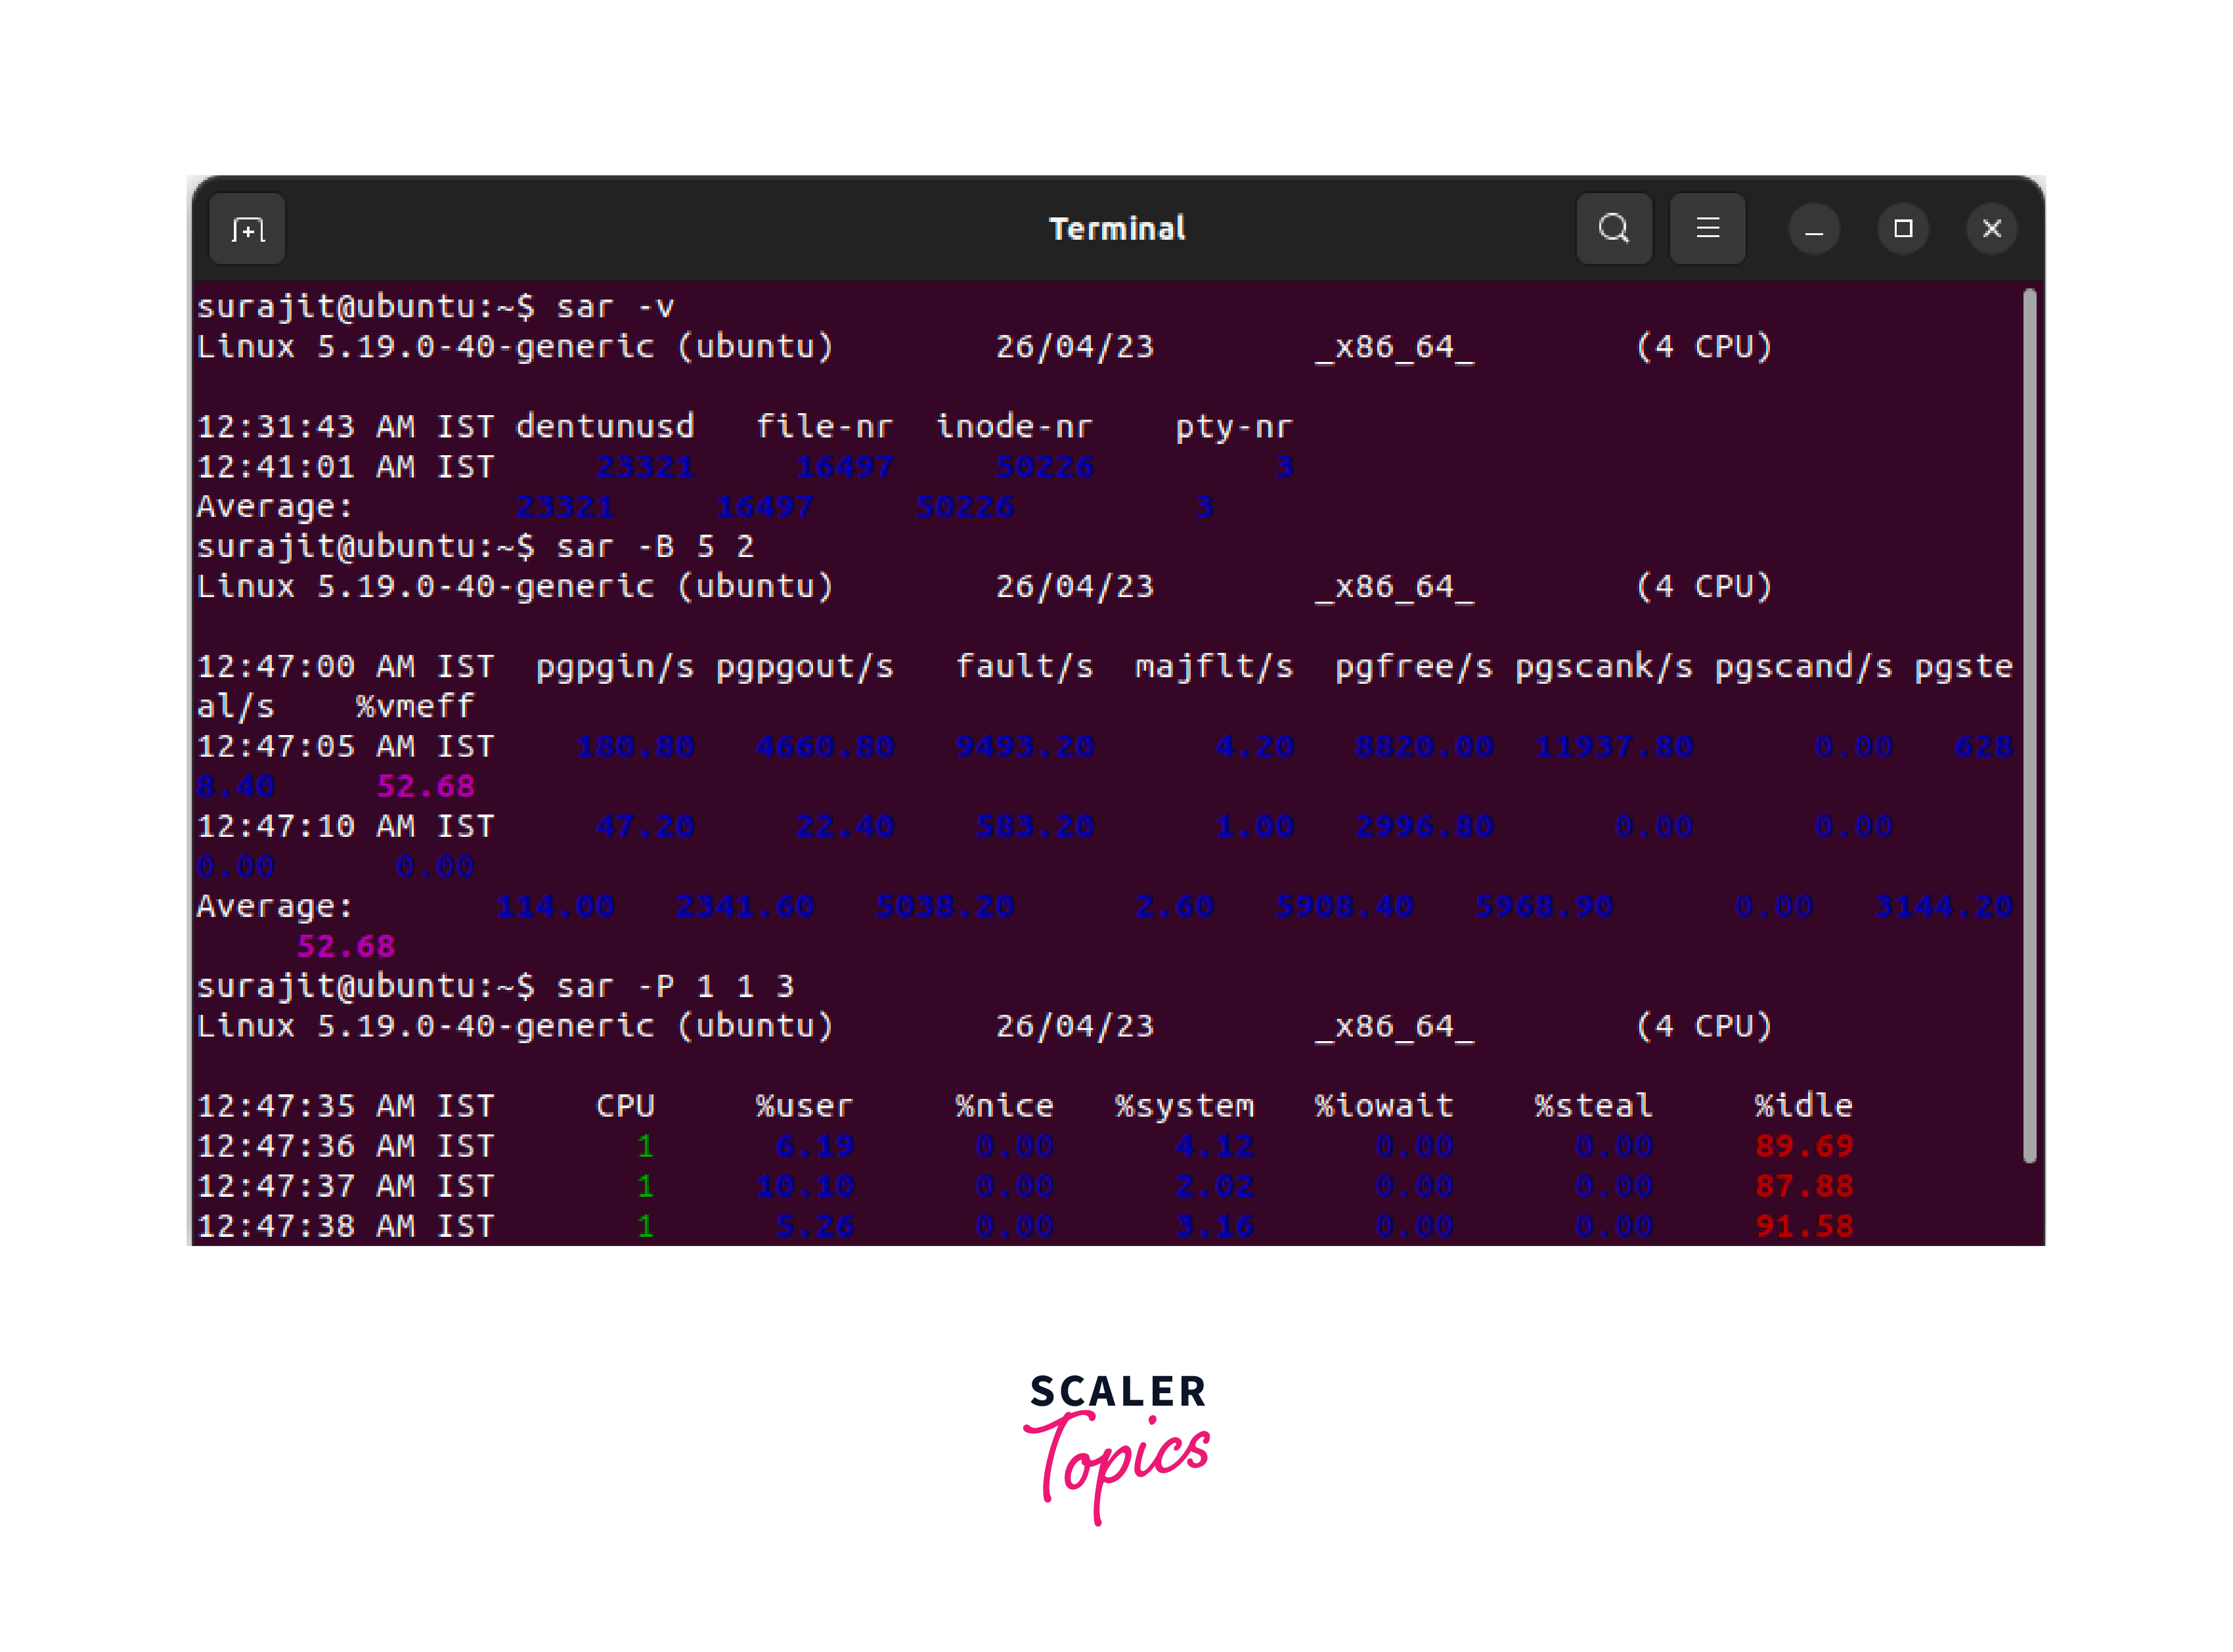
sar: The sar Linux command is the main command that collects and displays system activity data. You can specify various options with the sar command to collect specific performance data, such as CPU usage, memory usage, disk I/O, and network activity, at specific intervals. For example, you can use the command sar -u to collect and display CPU usage data, or sar -r to collect and display memory usage data.
sa1 and sa2: The sa1 and sa2 commands are used to collect and store system activity data at regular intervals. The sa1 command collects system activity data and stores it in binary format in the /var/log/sa directory, and the sa2 command generates daily summary reports from the stored data. You can configure the interval and duration of data collection using the configuration file /etc/sysstat/sysstat, and you can view the generated reports using the sar command with appropriate options.
sar -f: The sar -f command is used to read and display the contents of the binary data file generated by the sa1 command. You can specify the file path as an argument to the sar -f command to view the system activity data stored in that file. For example, you can use the command sar -f /var/log/sa/saXX to view the system activity data collected and stored by the sa1 command for a specific day.
sar -d: The sar -d command is used to collect and display disk I/O statistics. You can use this command to monitor the disk read and write activity, disk utilization, and disk throughput. The sar -d command provides various options to specify the disk devices, the interval and duration of data collection, and the type of statistics to be displayed. For example, you can use the command sar -d -p to display the disk I/O statistics for all the disk devices, or sar -d -d /dev/sda to display the disk I/O statistics only for the /dev/sda disk device.
sar -n: The sar -n command is used to collect and display network activity statistics. You can use this command to monitor the network utilization, network errors, and network throughput. The sar -n command provides various options to specify the network devices, the interval and duration of data collection, and the type of statistics to be displayed. For example, you can use the command sar -n DEV to display the network activity statistics for all the network devices, or sar -n DEV -I 5 to display the network activity statistics every 5 seconds.
sar -r: The sar -r command is used to collect and display memory usage statistics. You can use this command to monitor the system memory usage, swap space usage, and page allocation activity. The sar -r command provides various options to specify the interval and duration of data collection, and the type of statistics to be displayed. For example, you can use the command sar -r -B to display the memory usage statistics along with the page allocation activity, or sar -r -s 10:00:00 -e 11:00:00 to display the memory usage statistics for a specific time period.
sar -q: The sar -q command is used to collect and display system load statistics. You can use this command to monitor the system load average, run queue length, and context switch activity. The sar -q command provides various options to specify the interval and duration of data collection, and the type of statistics to be displayed. For example, you can use the command sar -q -u to display the system load average along with the CPU usage data, or sar -q -s 12:00:00 -e 13:00:00 to display the system load statistics for a specific time period.
Conclusion
-
Linux troubleshooting and diagnostic tools such as dmesg, syslog, and sar are powerful utilities that provide valuable insights into the performance and behavior of Linux systems.
-
These tools are essential for system administrators, DevOps engineers, and other IT professionals to diagnose and resolve issues, optimize system performance, and ensure smooth operations of Linux servers and systems.
-
In this article, we have explored the overview of dmesg, syslog, and sar, their usage, and how they can be used for troubleshooting and diagnostic purposes.
-
We have discussed how dmesg Linux command can be used to analyze kernel log messages, syslog Linux command for collecting and forwarding system logs, and sar Linux command for monitoring system performance data.
-
We have also looked into the configuration and usage of these tools, including various commands and options that can be used for specific troubleshooting scenarios.