8 min
What is Matplotlib in Python?
Matplotlib along with NumPy can be considered an open source equivalent of MATLAB. A few lines of code are typically all that is needed in a Python matplotlib script to create a visual data plot.
Knowing how to work with plots requires knowledge of the pyplot API provided by matplotlib. Two key elements of pyplot are, matplotlib.pyplot.figure and matplotlib.pyplot.axes.
Installation
To install Matplotlib, a popular plotting library for Python, you can use the following methods depending on your preferences and environment.
Using pip:
For Python 2.x:
For Python 3.x:
Using conda (if you're using the Anaconda distribution):
Installing specific versions:
If you need to install a specific version of Matplotlib, you can specify the version like this:
Using pip:
Using conda:
Installing from source:
If you want to install the latest development version of Matplotlib, you can do so from the GitHub repository. First, clone the repository:
Then navigate to the cloned directory:
Finally, build and install Matplotlib:
Getting Started With Pyplot
Pyplot is a sublibrary of Matplotlib that provides a simple interface for creating plots. Here's a step-by-step guide to help you get started with Pyplot:
Import the necessary libraries:
Create some data:
For demonstration purposes, let's create some data using NumPy. We'll generate an array of x values and compute the corresponding y values using a simple mathematical function:
Create a basic plot:
To create a simple plot, use the plt.plot() function with the x and y values:
Display the plot:
To display the plot, call the plt.show() function:
Enhancing the plot:
You can customize the plot by adding labels, a title, and a grid. Here's an example:
Saving the plot:
You can save the plot to a file using the plt.savefig() function. Specify the filename, file format (e.g., 'png', 'jpg', 'pdf', etc.), and optionally, the DPI (dots per inch):
This will save the plot to a file called sine_wave.png with a resolution of 300 DPI.
Matplotlib Subplots
Subplots are a way to create multiple plots within a single figure in Matplotlib. You can use the plt.subplots() function to create a grid of subplots. Here's a step-by-step guide to creating and customizing subplots:
Import the necessary libraries:
Create some data:
For demonstration purposes, let's create two sets of data using NumPy:
Create a subplot grid:
The plt.subplots() function takes two arguments: the number of rows and columns in the grid. It returns a Figure object and an array of Axes objects. Here, we create a 1x2 grid, meaning one row and two columns:
Plot the data on each subplot:
Use the Axes objects to plot the data on each subplot. For example, plot the sine wave on the left subplot (index 0) and the cosine wave on the right subplot (index 1):
Display the subplots:
Call the plt.show() function to display the subplots:
Audience
This Python matplotlib tutorial is aimed at learners who wish to learn the fundamentals of data visualization.
- Beginner to Intermediate python developers who are interested in data visualization.
- Experienced programmers who want to learn a Python 2D plotting library.
Prerequisite
The readers of this tutorial are assumed to be familiar with the fundamentals of Python.
- Python should already be installed, and learners should be familiar with using an IDE or any preferred editor.
- Download Anaconda, an open-source data science platform that includes Matplotlib and Python.
- Otherwise, you can get Python and Matplotlib for free online and set them up.
- Knowledge in NumPy is not required but would be an advantage.
What is Matplotlib Used for?
In the field of data science, the Matplotlib library for Python is used to analyze and visually represent the results of data analysis.
- Plotting Charts and Graphs
Plotting lets you see the correlations that emerge from the dataset and draw conclusions based on necessary factors.
- Data Visualizations
The Matplotlib library contains tools for data scientists to create various graph types, such as line plots, histograms, scatter plots, pie charts, box plots, etc.
- Animations and Graphics
The animations can be used to create 2-D and 3-D pictures, as well as to show changes or updates to a data analysis project. They can also be used to make any data visualization more dynamic.
Matplotlib is also a valuable data visualization tool in a diverse range of industries, such as finance, business, law, healthcare,education, etc.
Python Matplotlib: Types of Plots
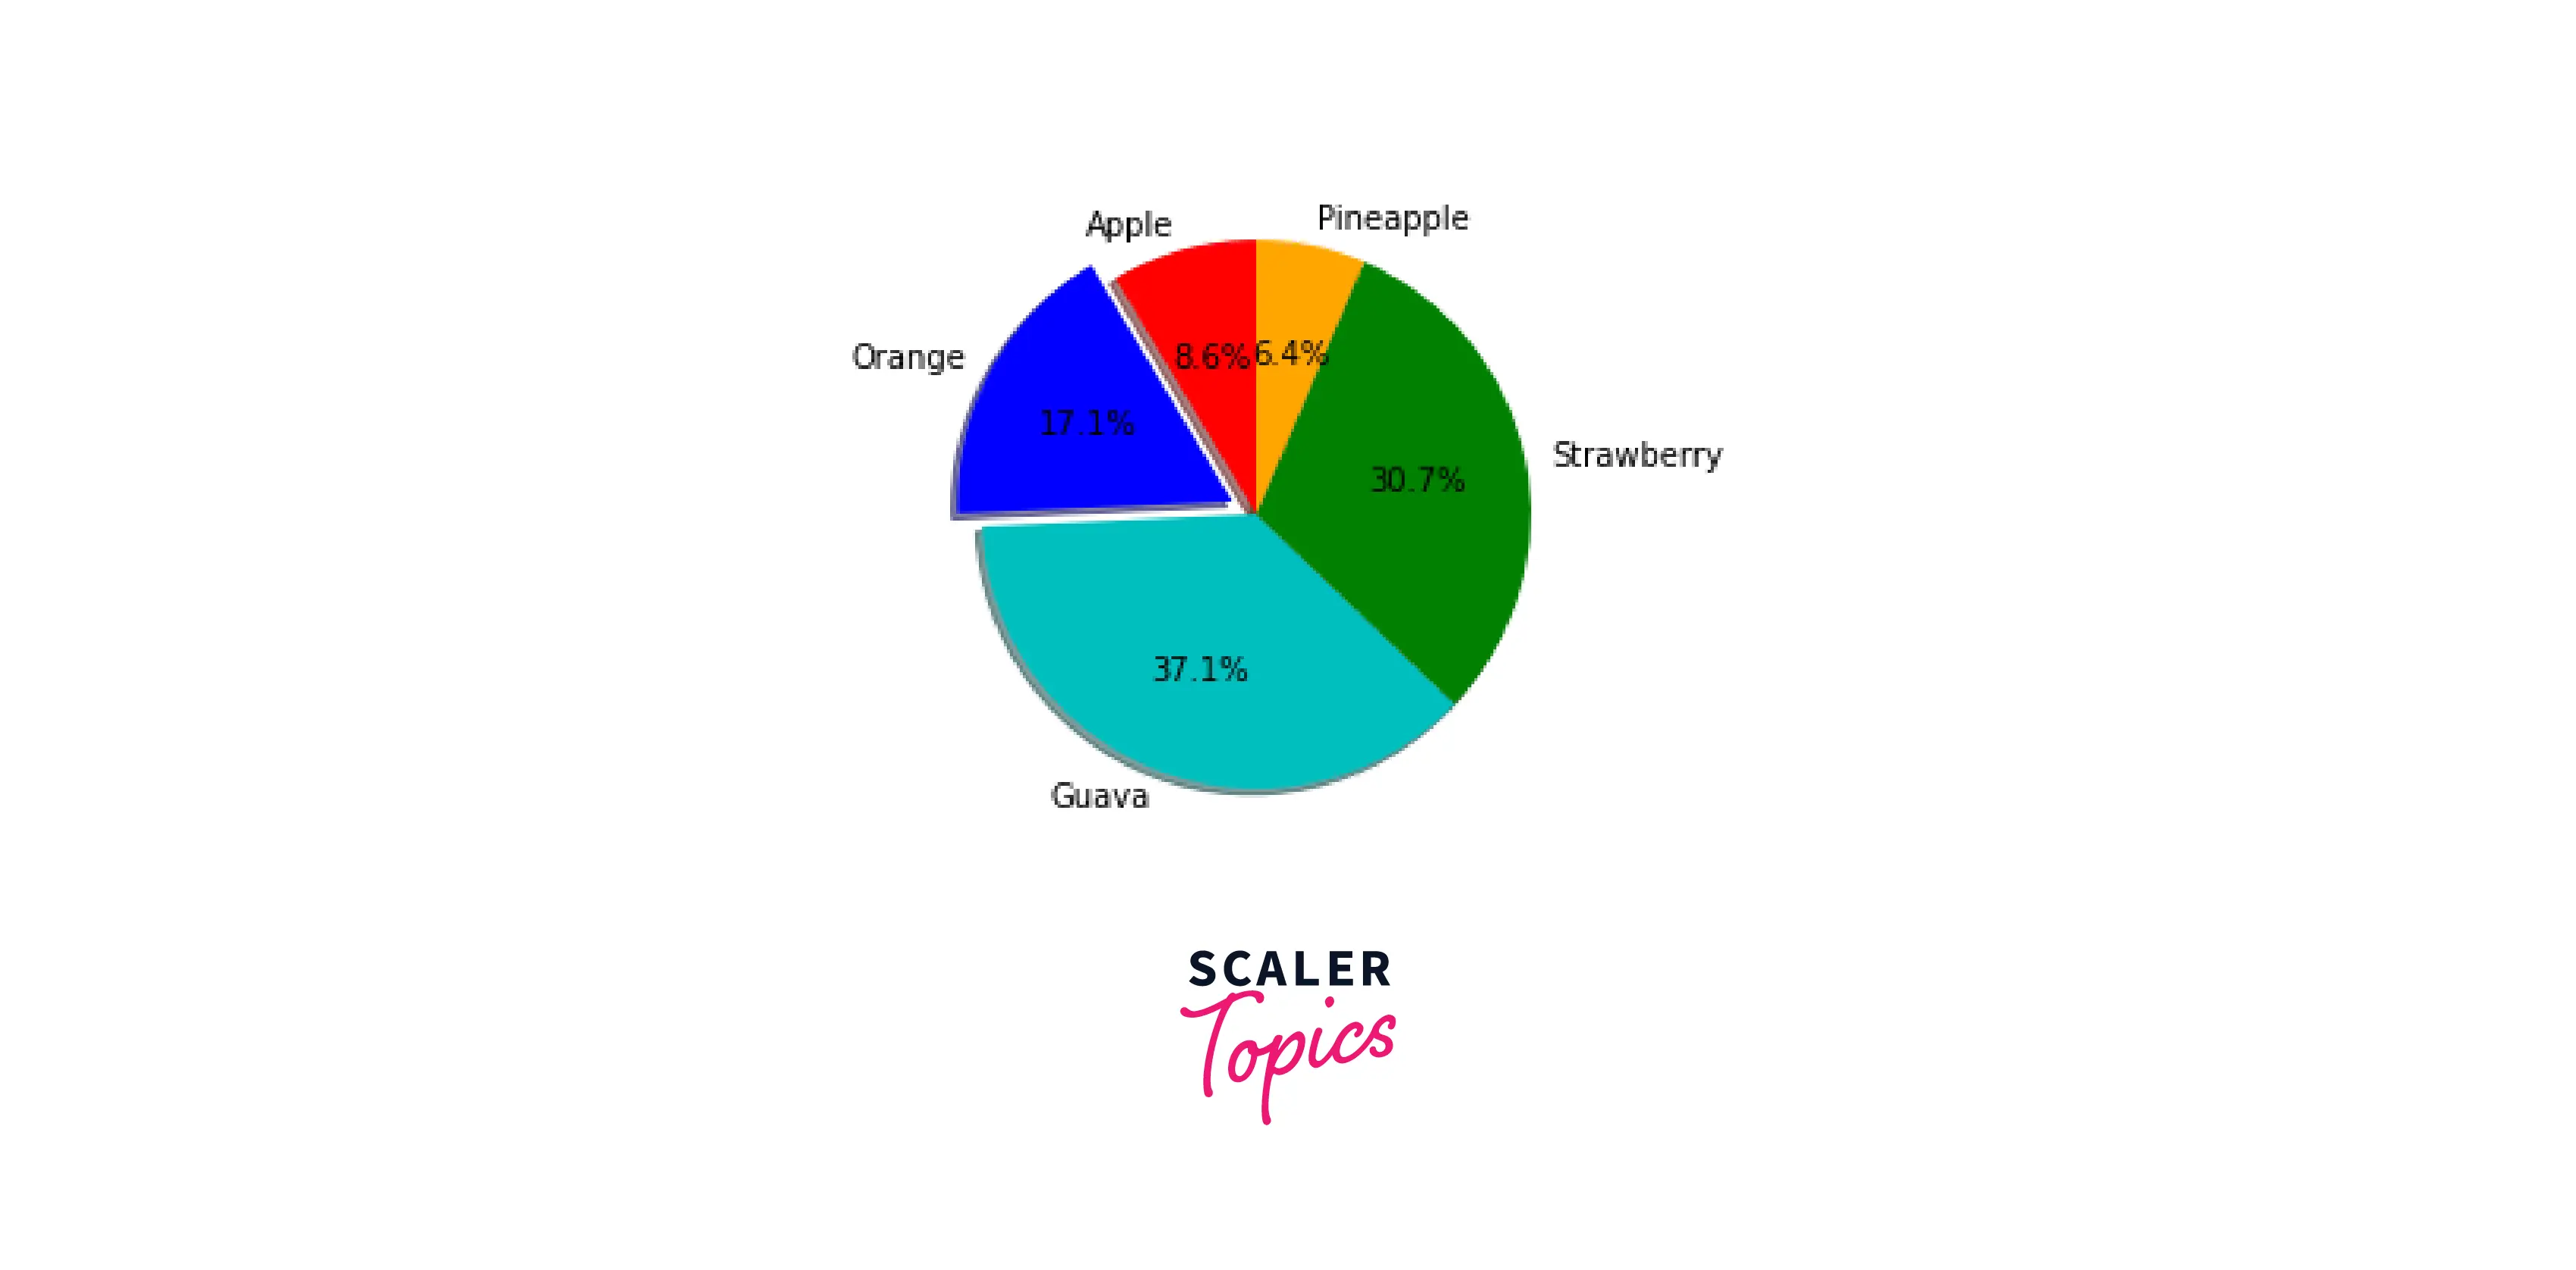
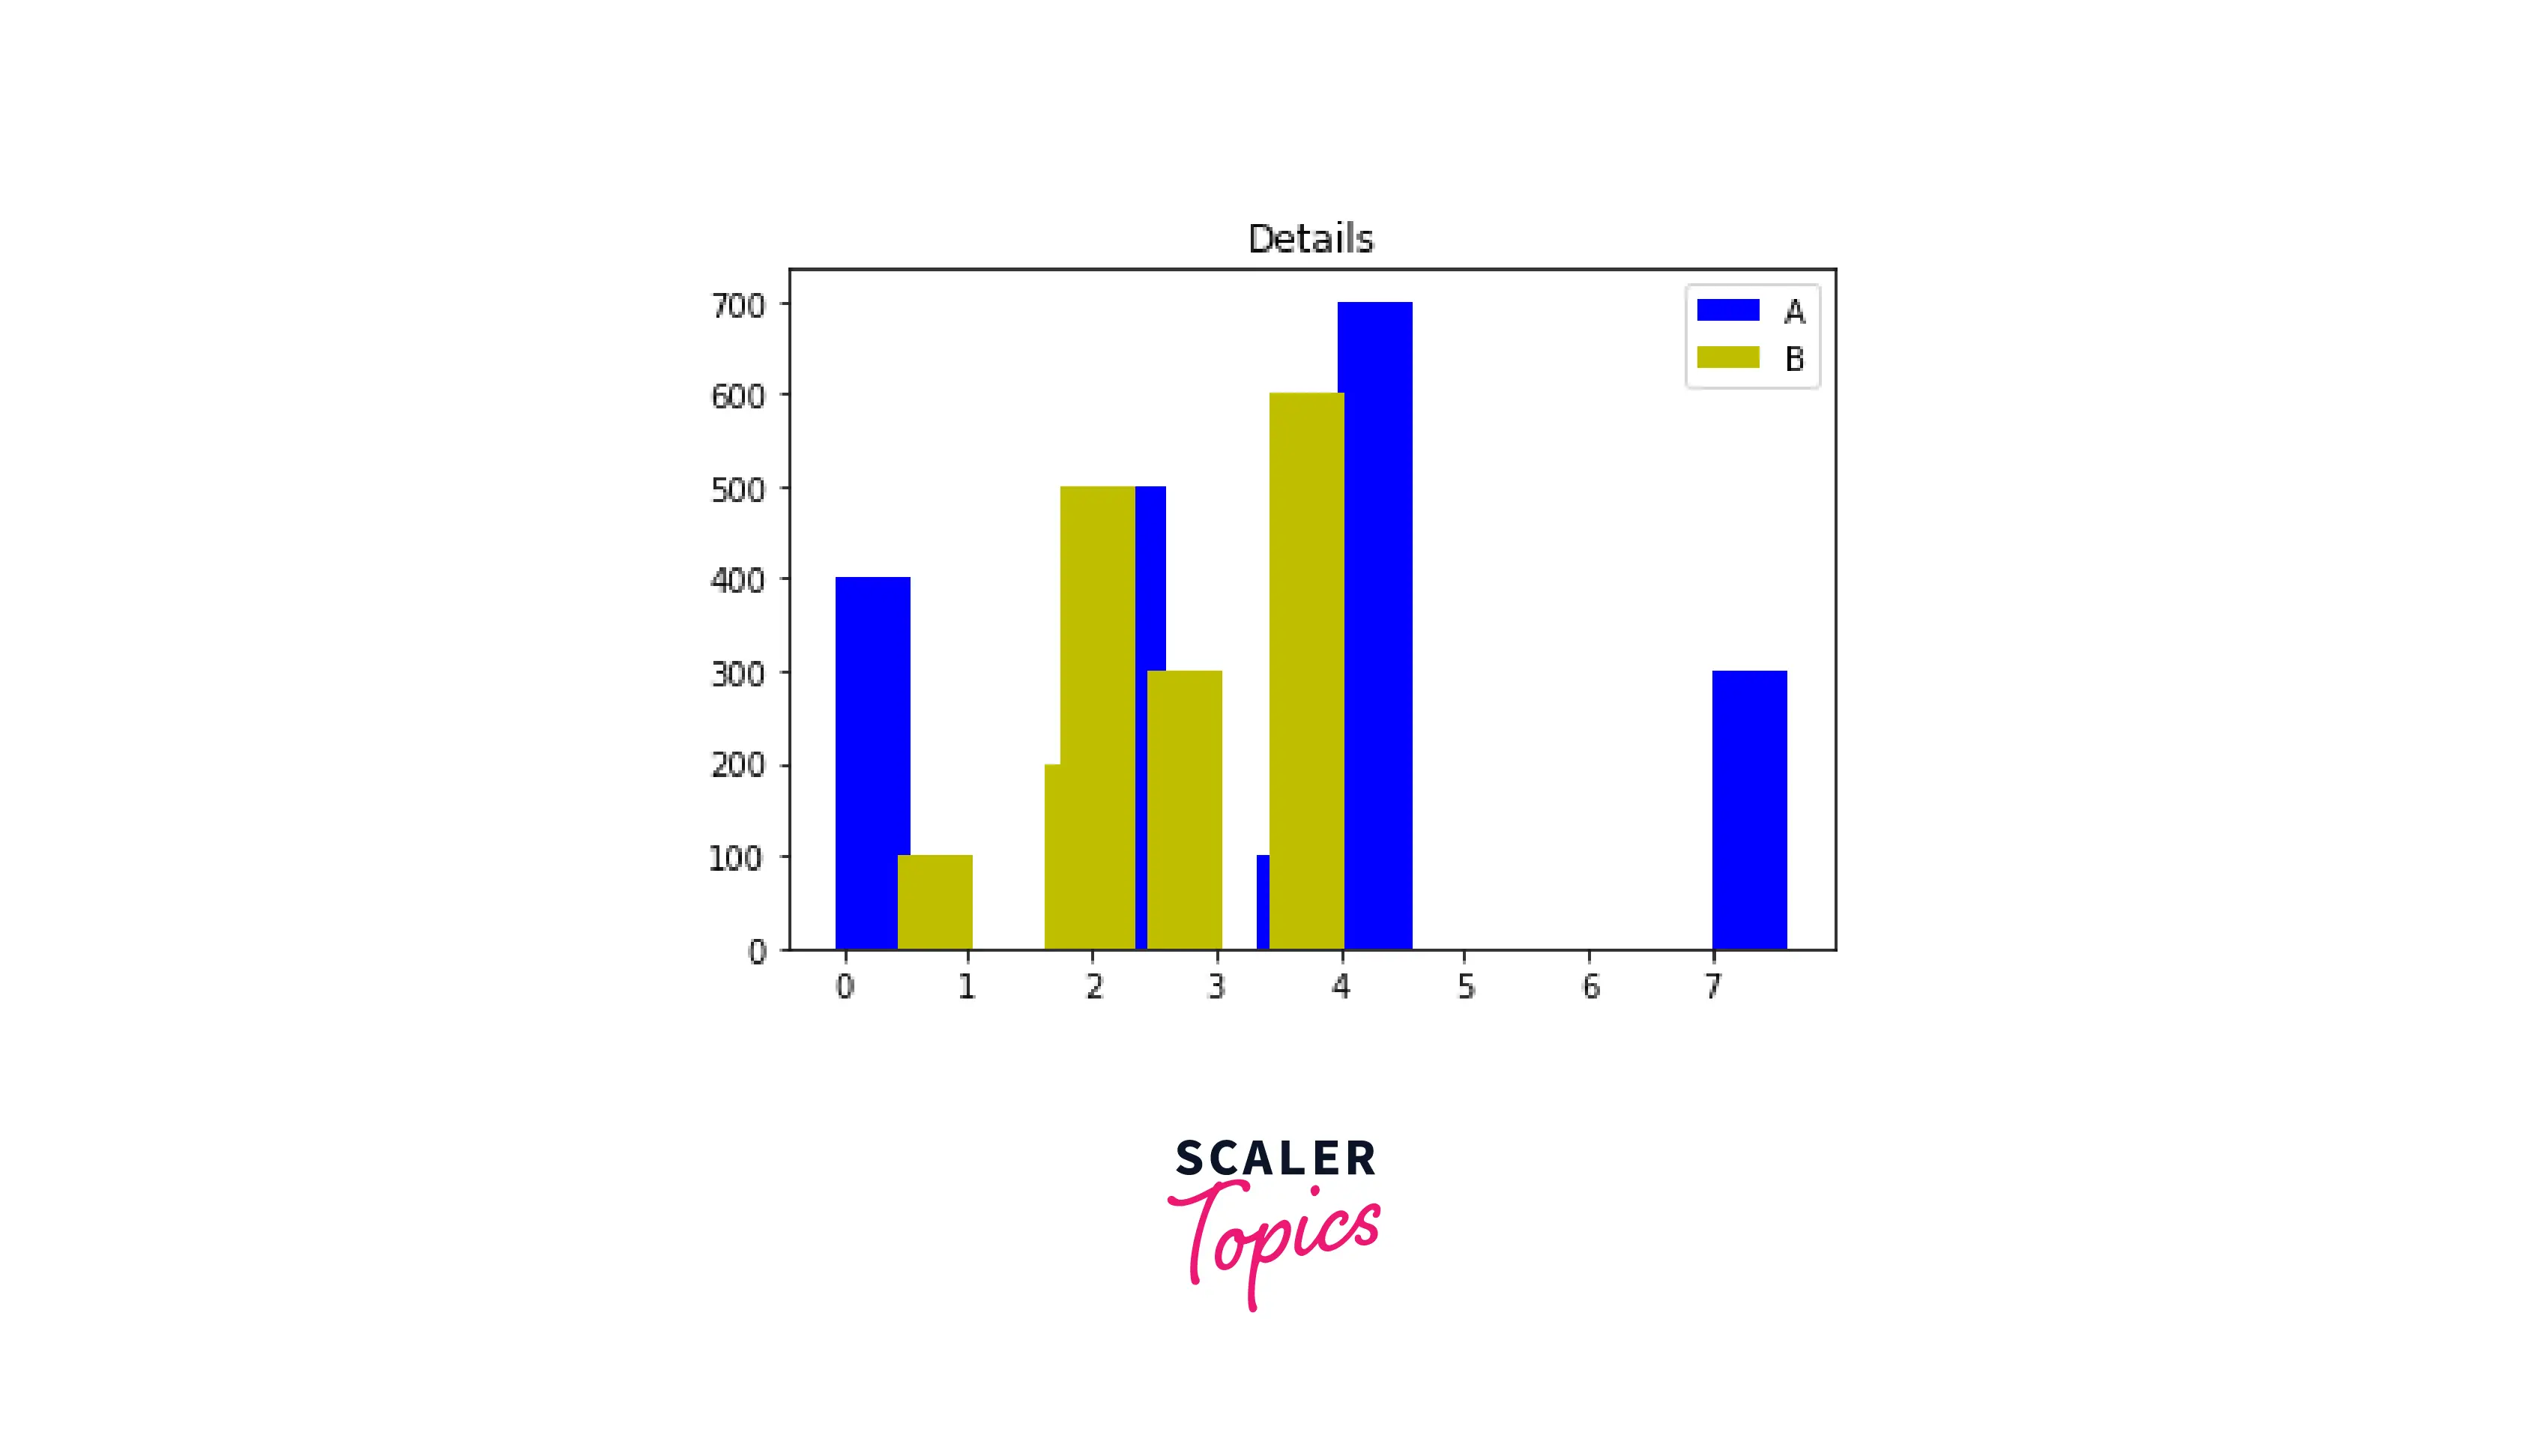
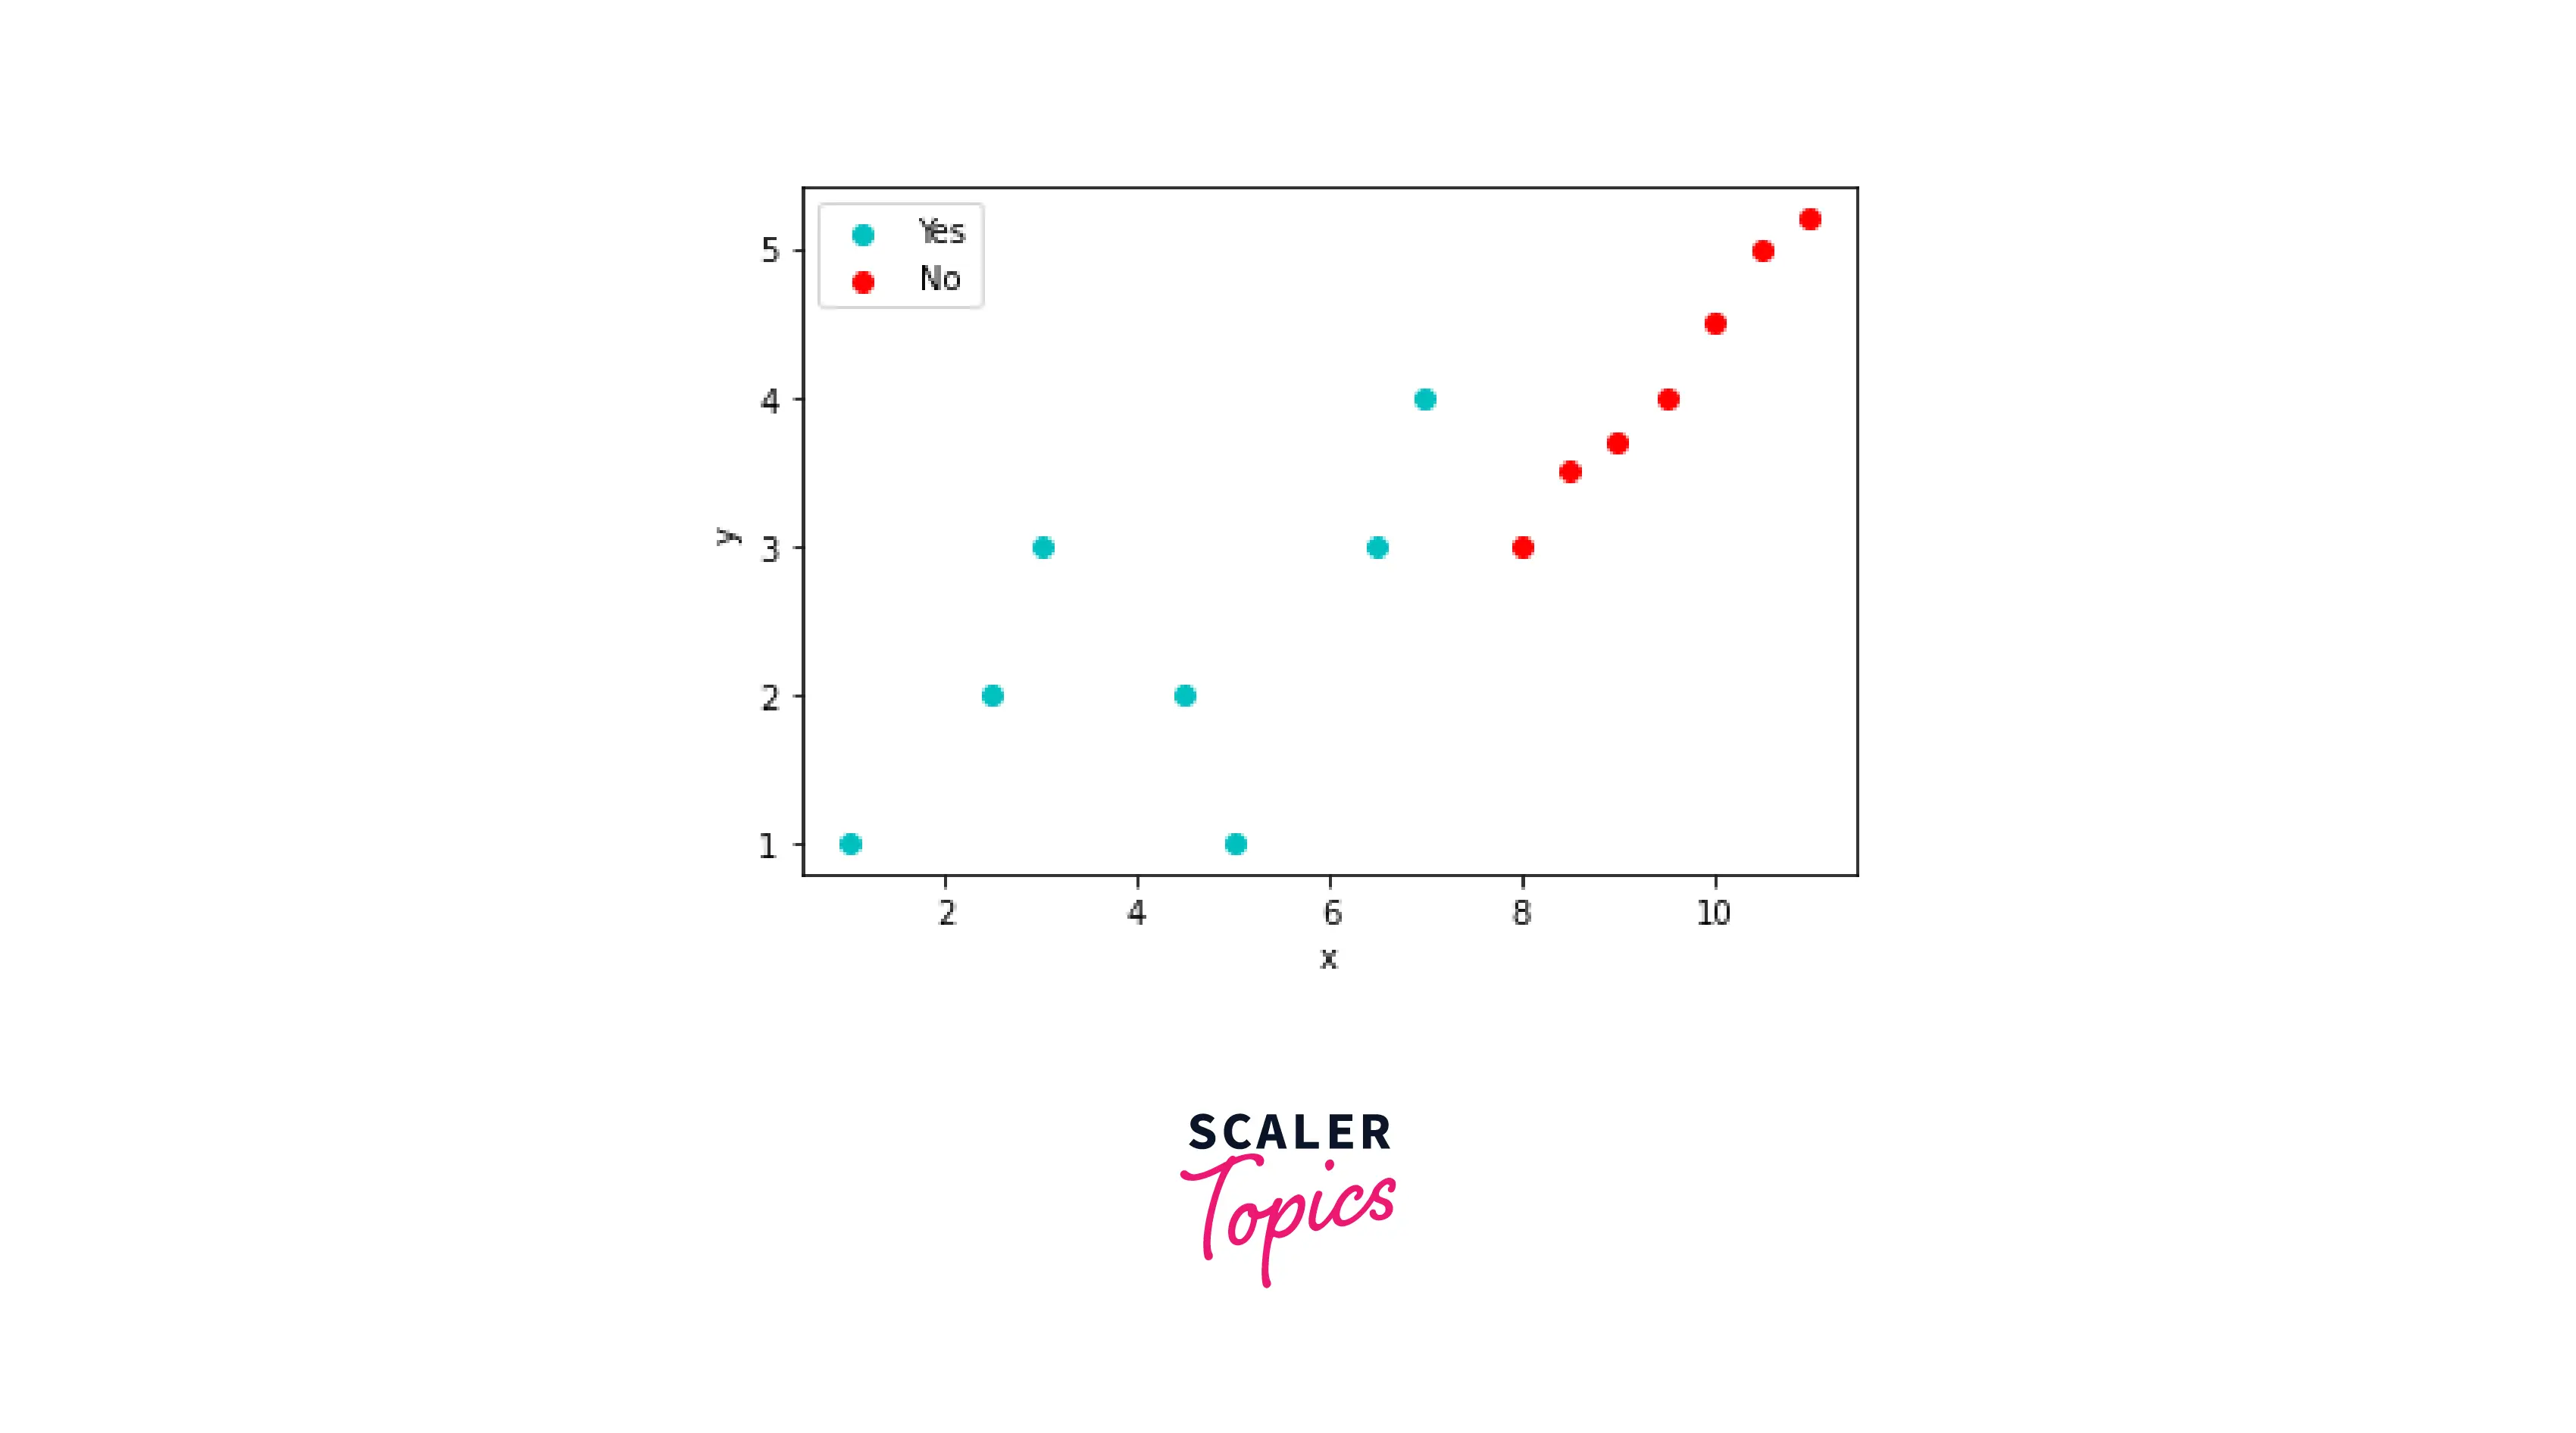
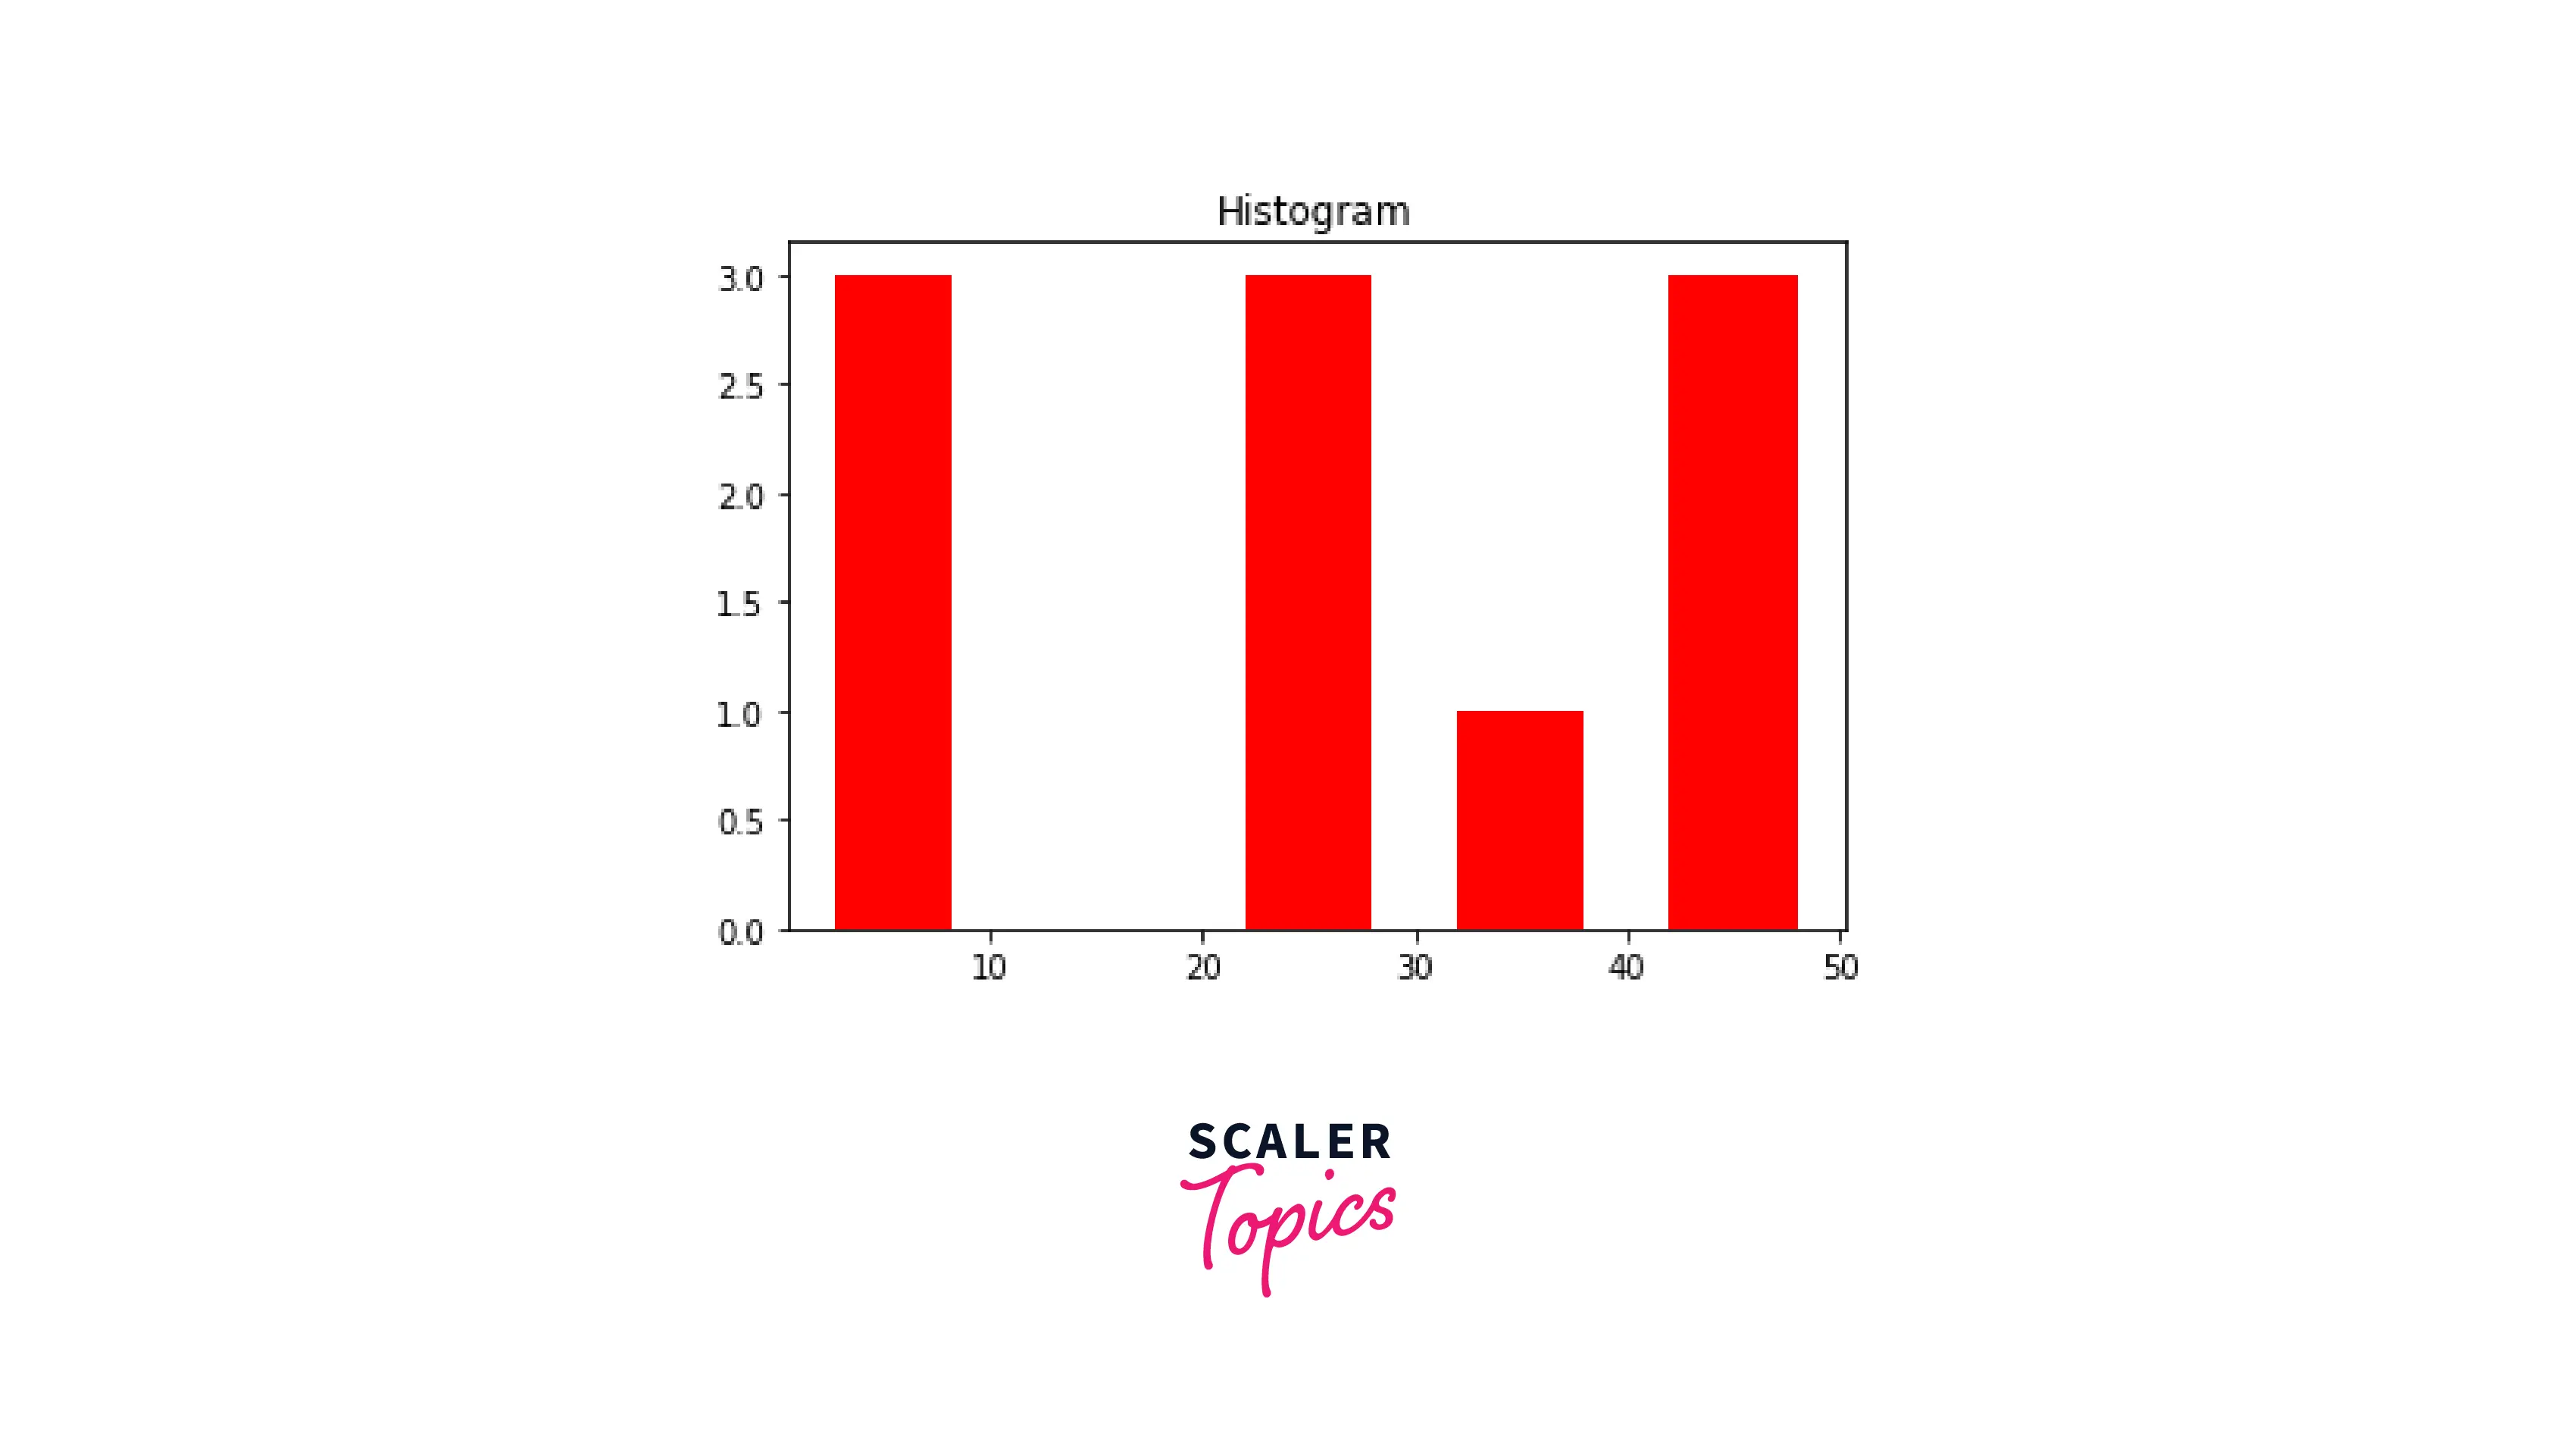
matplotlib.pyplot is the 2D plotting library used for creating plots in Python. Python's matplotlib offers a variety of plot and graph styles. Each of these will be covered in detail in the following articles by Scaler topics.
-
Pie chart
-
Bar chart
-
Scatter plot
-
Histogram
-
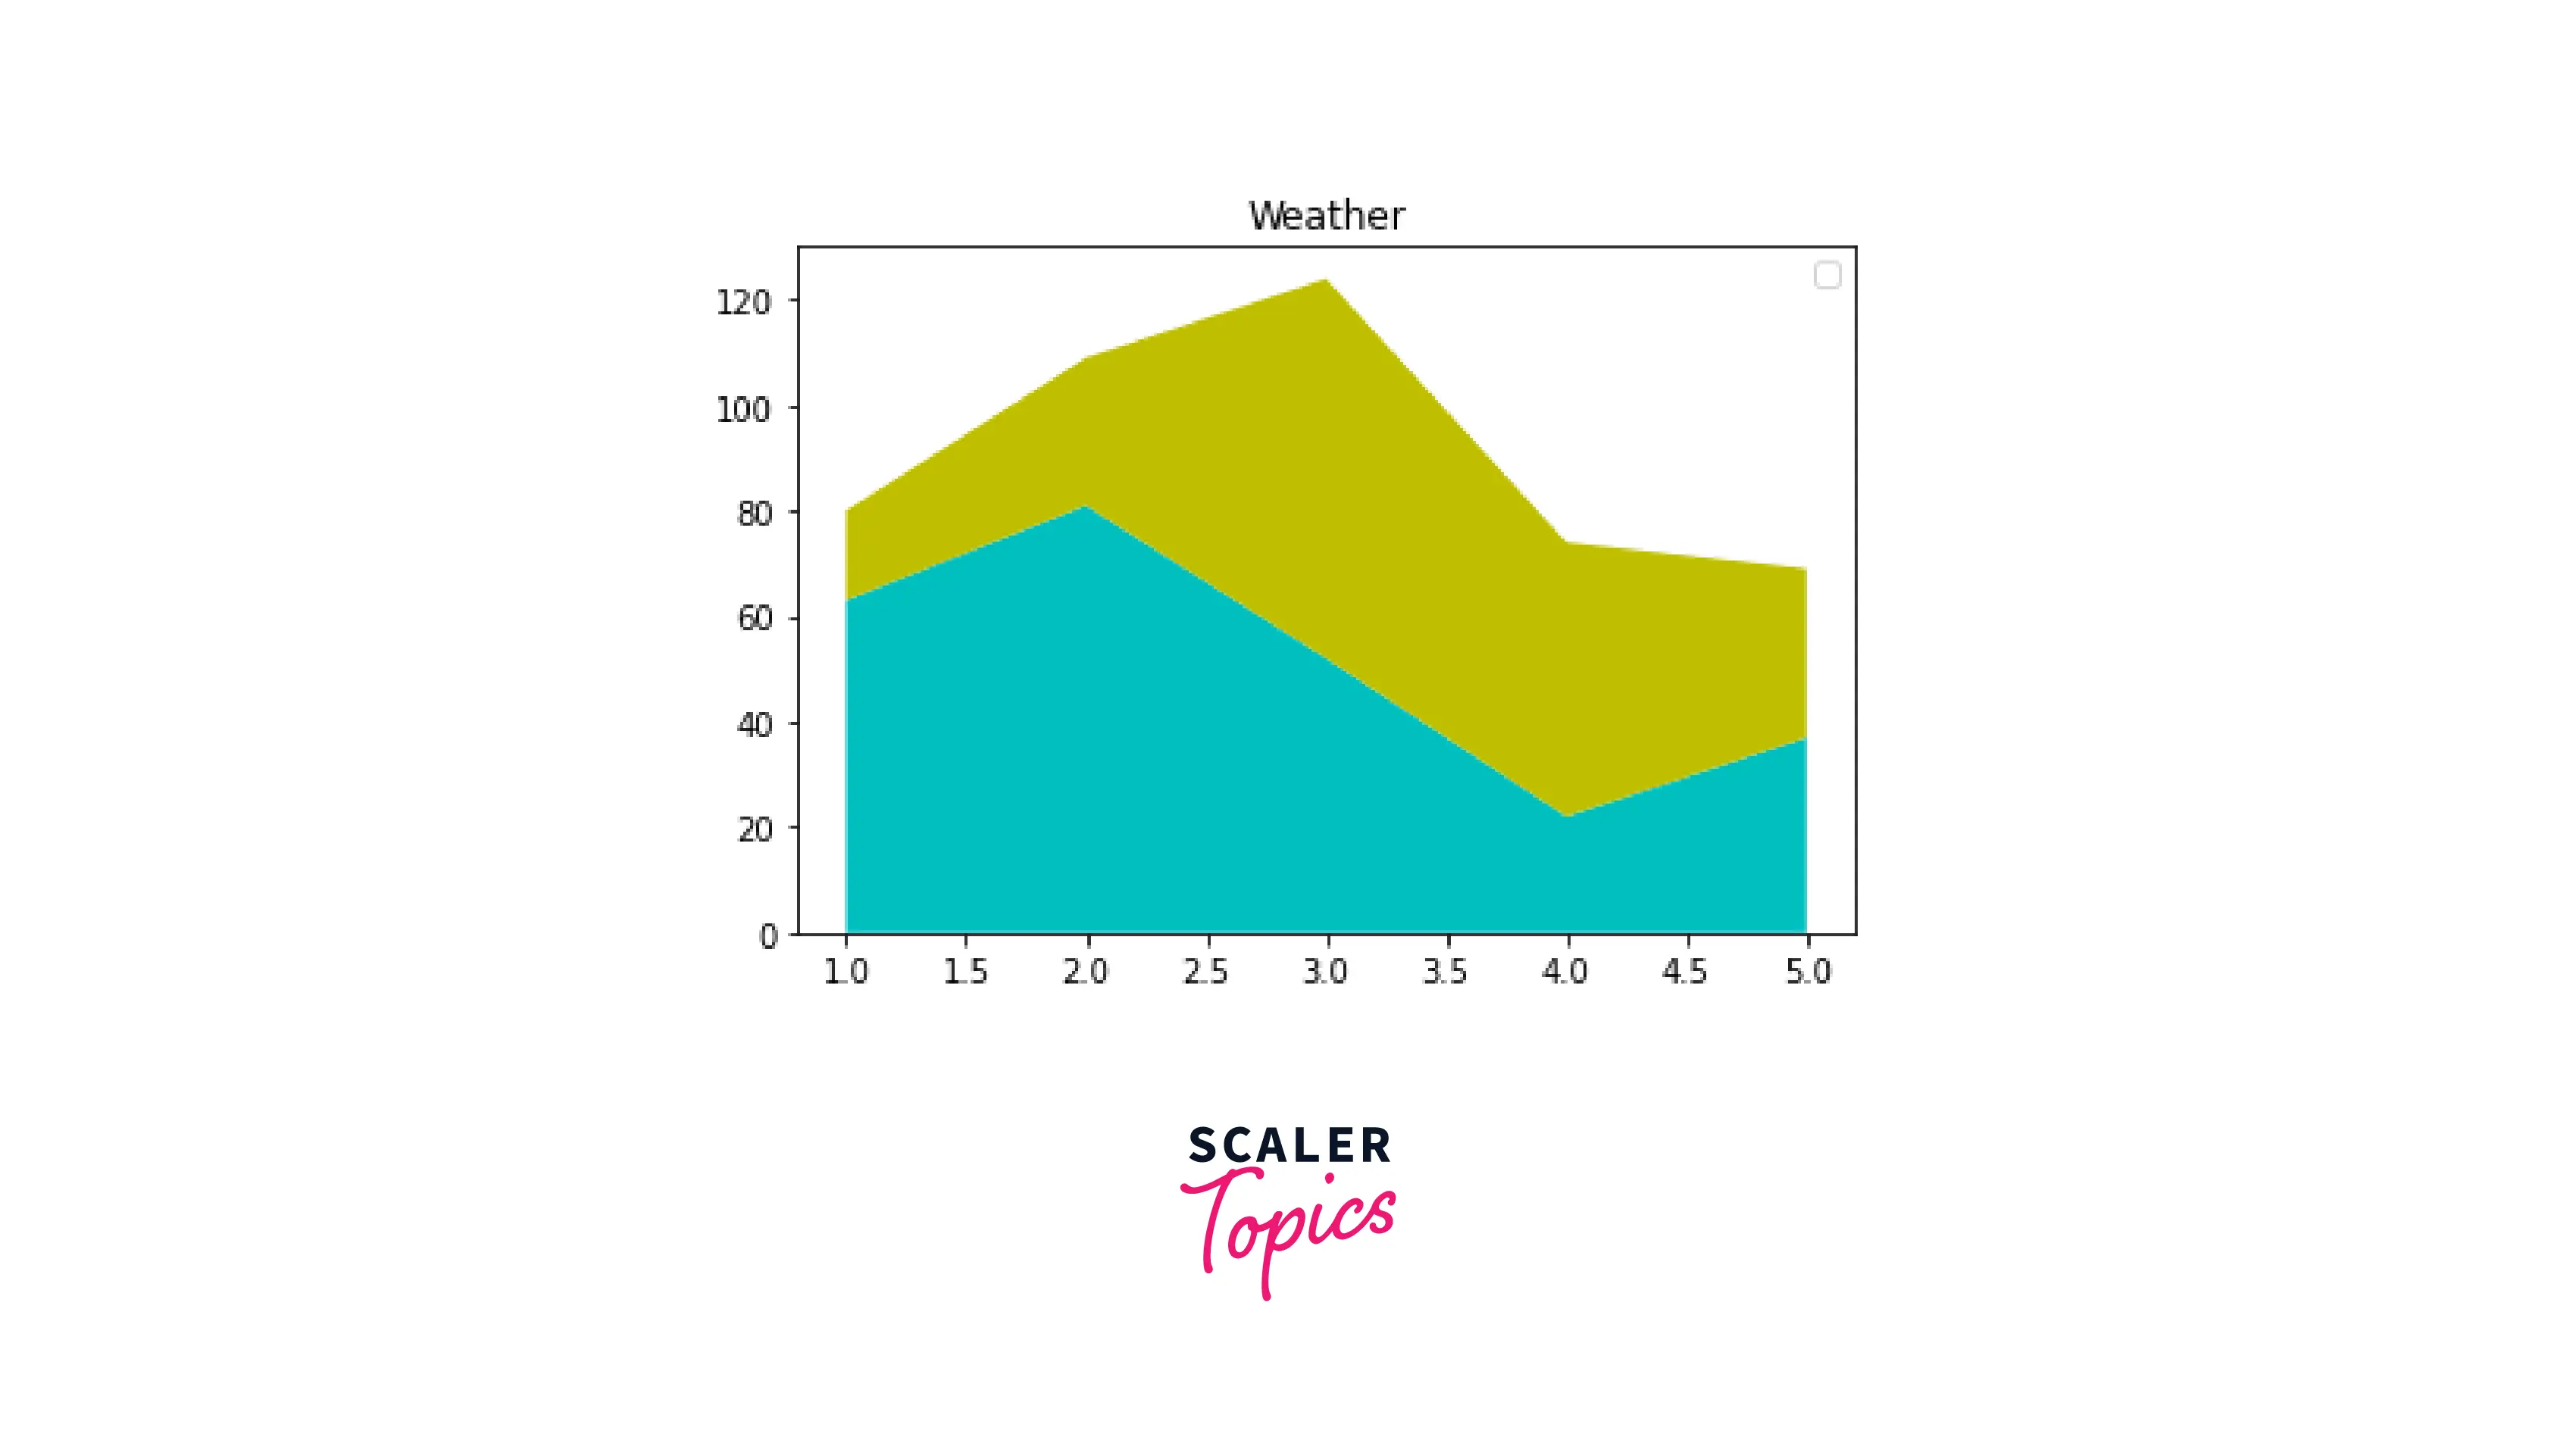
Area chart
Why Should You Learn Matplotlib?
- Matplotlib will function irrespective of the operating system, because it supports a wide range of backends and output types.
- Matplotlib is one of the most widely used Python libraries for data analysis. You can discover a tonne of information online to help you learn how to use this tool.
- Its popularity is also attributed to how simple it is to get started.
- According to research, there exists a huge demand for people who are skilled at data visualization.
How Long Does It Take to Learn Matplotlib?
Assuming that you are already familiar with Python, learning Matplotlib will take two to three weeks at a pace of two to three hours each day. Once you have a firm understanding of Matplotlib's fundamentals, you can familiarise yourself with the additional libraries that are developed on top of it. Learning the fundamentals of Python typically takes two to six months.You have to consistently practice your skills if you want to work as a data analyst or data scientist.
Is It Hard to Learn Matplotlib?
If you are already familiar with Python, learning how to use Matplotlib is not difficult. There are many resources available to learn Matplotlib.The more Python you know, the more advanced visuals you can create. This is especially true if you are familiar with other tools like Pandas and Jupyter.
How to Learn Matplotlib: Step-by-Step
Getting started with Matplotlib is simple once you have a basic understanding of Python.
Here are some tips you can use to learn Matplotlib:
- Identify your motivation for wanting to learn Matplotlib. Understanding your learning objectives will help you identify the exact skills you need to acquire.
- Learn how to use your code editor and gain a fundamental knowledge of Python and libraries.
- Possibly the best way to learn something is to start doing it. Practice while you learn.
- Become a member of a programming community. You can increase your knowledge and to talk to people about their experiences with Matplotlib.
- After completing a few simple exercises, expand your knowledge. Test your abilities with a real challenge.
What will you Learn in This Matplotlib Tutorial?
The goal of this Python matplotlib tutorial is to provide all the knowledge required to start using the Matplot library.
- It starts with an introduction to matplotlib and basic plotting methods.
- The course then covers various plots such as curves, line plots, scatter plots, bar diagrams, pie charts, histograms, error bars, triangulations as well as box and violin plots.
- We will learn to customize the plots by adding titles, labels, ticks, markers, annotations, various styling to the layout and many more.
- We will then move on to working with annotations, file outputs, figures, maps, and 3D figures in Matplotlib.
- The matplotlib tutorial also covers 3D plotting in detail.
