Boxplot in Matplotlib
Overview
In this tutorial, we will cover box plots and the creation of box plots in the matplotlib library using the boxplot() function. This article demonstrates how to use the matplotlib package to create a variety of various types of boxplots. In addition, we'll discuss why some parameters in matplotlib's boxplot function are essential.
What is boxplot in matplotlib?
Matplotlib's boxplot mainly provides a graphical summary of a data set with features such as minimum, first quartile, median, third quartile, and maximum.
Note: A quartile is a statistical phrase for dividing observations into four predetermined intervals based on data values.
- The "Whisker Plot" is another name for the "Box Plot."
- The whiskers are the two lines that run from the minimum to the lower quartile (the box's beginning) and then from the higher quartile (the box's end) to the maximum.
- In the box plot, the box is drawn from the first to third quartiles, with a vertical line running through it at the median.
- The x-axis of a box plot represents the data to be plotted, while the y-axis represents the frequency distribution.
- Box plots are useful for visualizing the distribution of numerical values in a field. They come in handy for making comparisons across categorical variables and spotting outliers, if any exist in a dataset.
Parameters of Matplotlib boxplot
| Attribute | Value |
|---|---|
| data | A plottable array or sequence of arrays |
| notch | This parameter is optional and accepts boolean values. |
| vert | For horizontal and vertical graphs, this optional parameter accepts boolean values of false and true |
| bootstrap | Intervals around notched box plot is an optional parameter that accepts int. |
| used medians | An optional parameter that accepts an array or a sequence of array dimensions compatible with the data. |
| positions | The optional argument sets the position of boxes by accepting an array. |
| widths | An optional parameter accepts an array and specifies the box width. |
| patch_artist | Boolean values are available as an optional parameter. |
| labels | Each dataset is given a label using a string sequence. |
| meanline | Attempt to render the meanline as the entire width of the box having a boolean value as an option. |
| order | An optional parameter determines the boxplot's order. |
How to Create a Boxplot in Matplotlib?
The boxplot() method in the matplotlib library is usually used to produce a box plot.
-
The numpy.random.normal() function generates random data in the Box Plot. Its arguments are the mean, standard deviation, and the desired number of values.
-
A Numpy array, a Python list, or a tuple of arrays can be used as data values for the ax.boxplot() method.
The boxplot() method requires the following syntax:
How to Customize Matplotlib Boxplot?
The matplotlib.pyplot.boxplot() function allows for unlimited modification of the box plot. patch_artist = True fills the box plot with colors, and notch = True generates the notch format for the box plot. Distinct colors can be assigned to different boxes. A horizontal box plot is created with the vert = 0 parameter. The dimensions of the labels are the same as the dimensions of the number of data sets.
Matplotlib Boxplot Examples
Example 1: Simple Matplotlib Boxplot
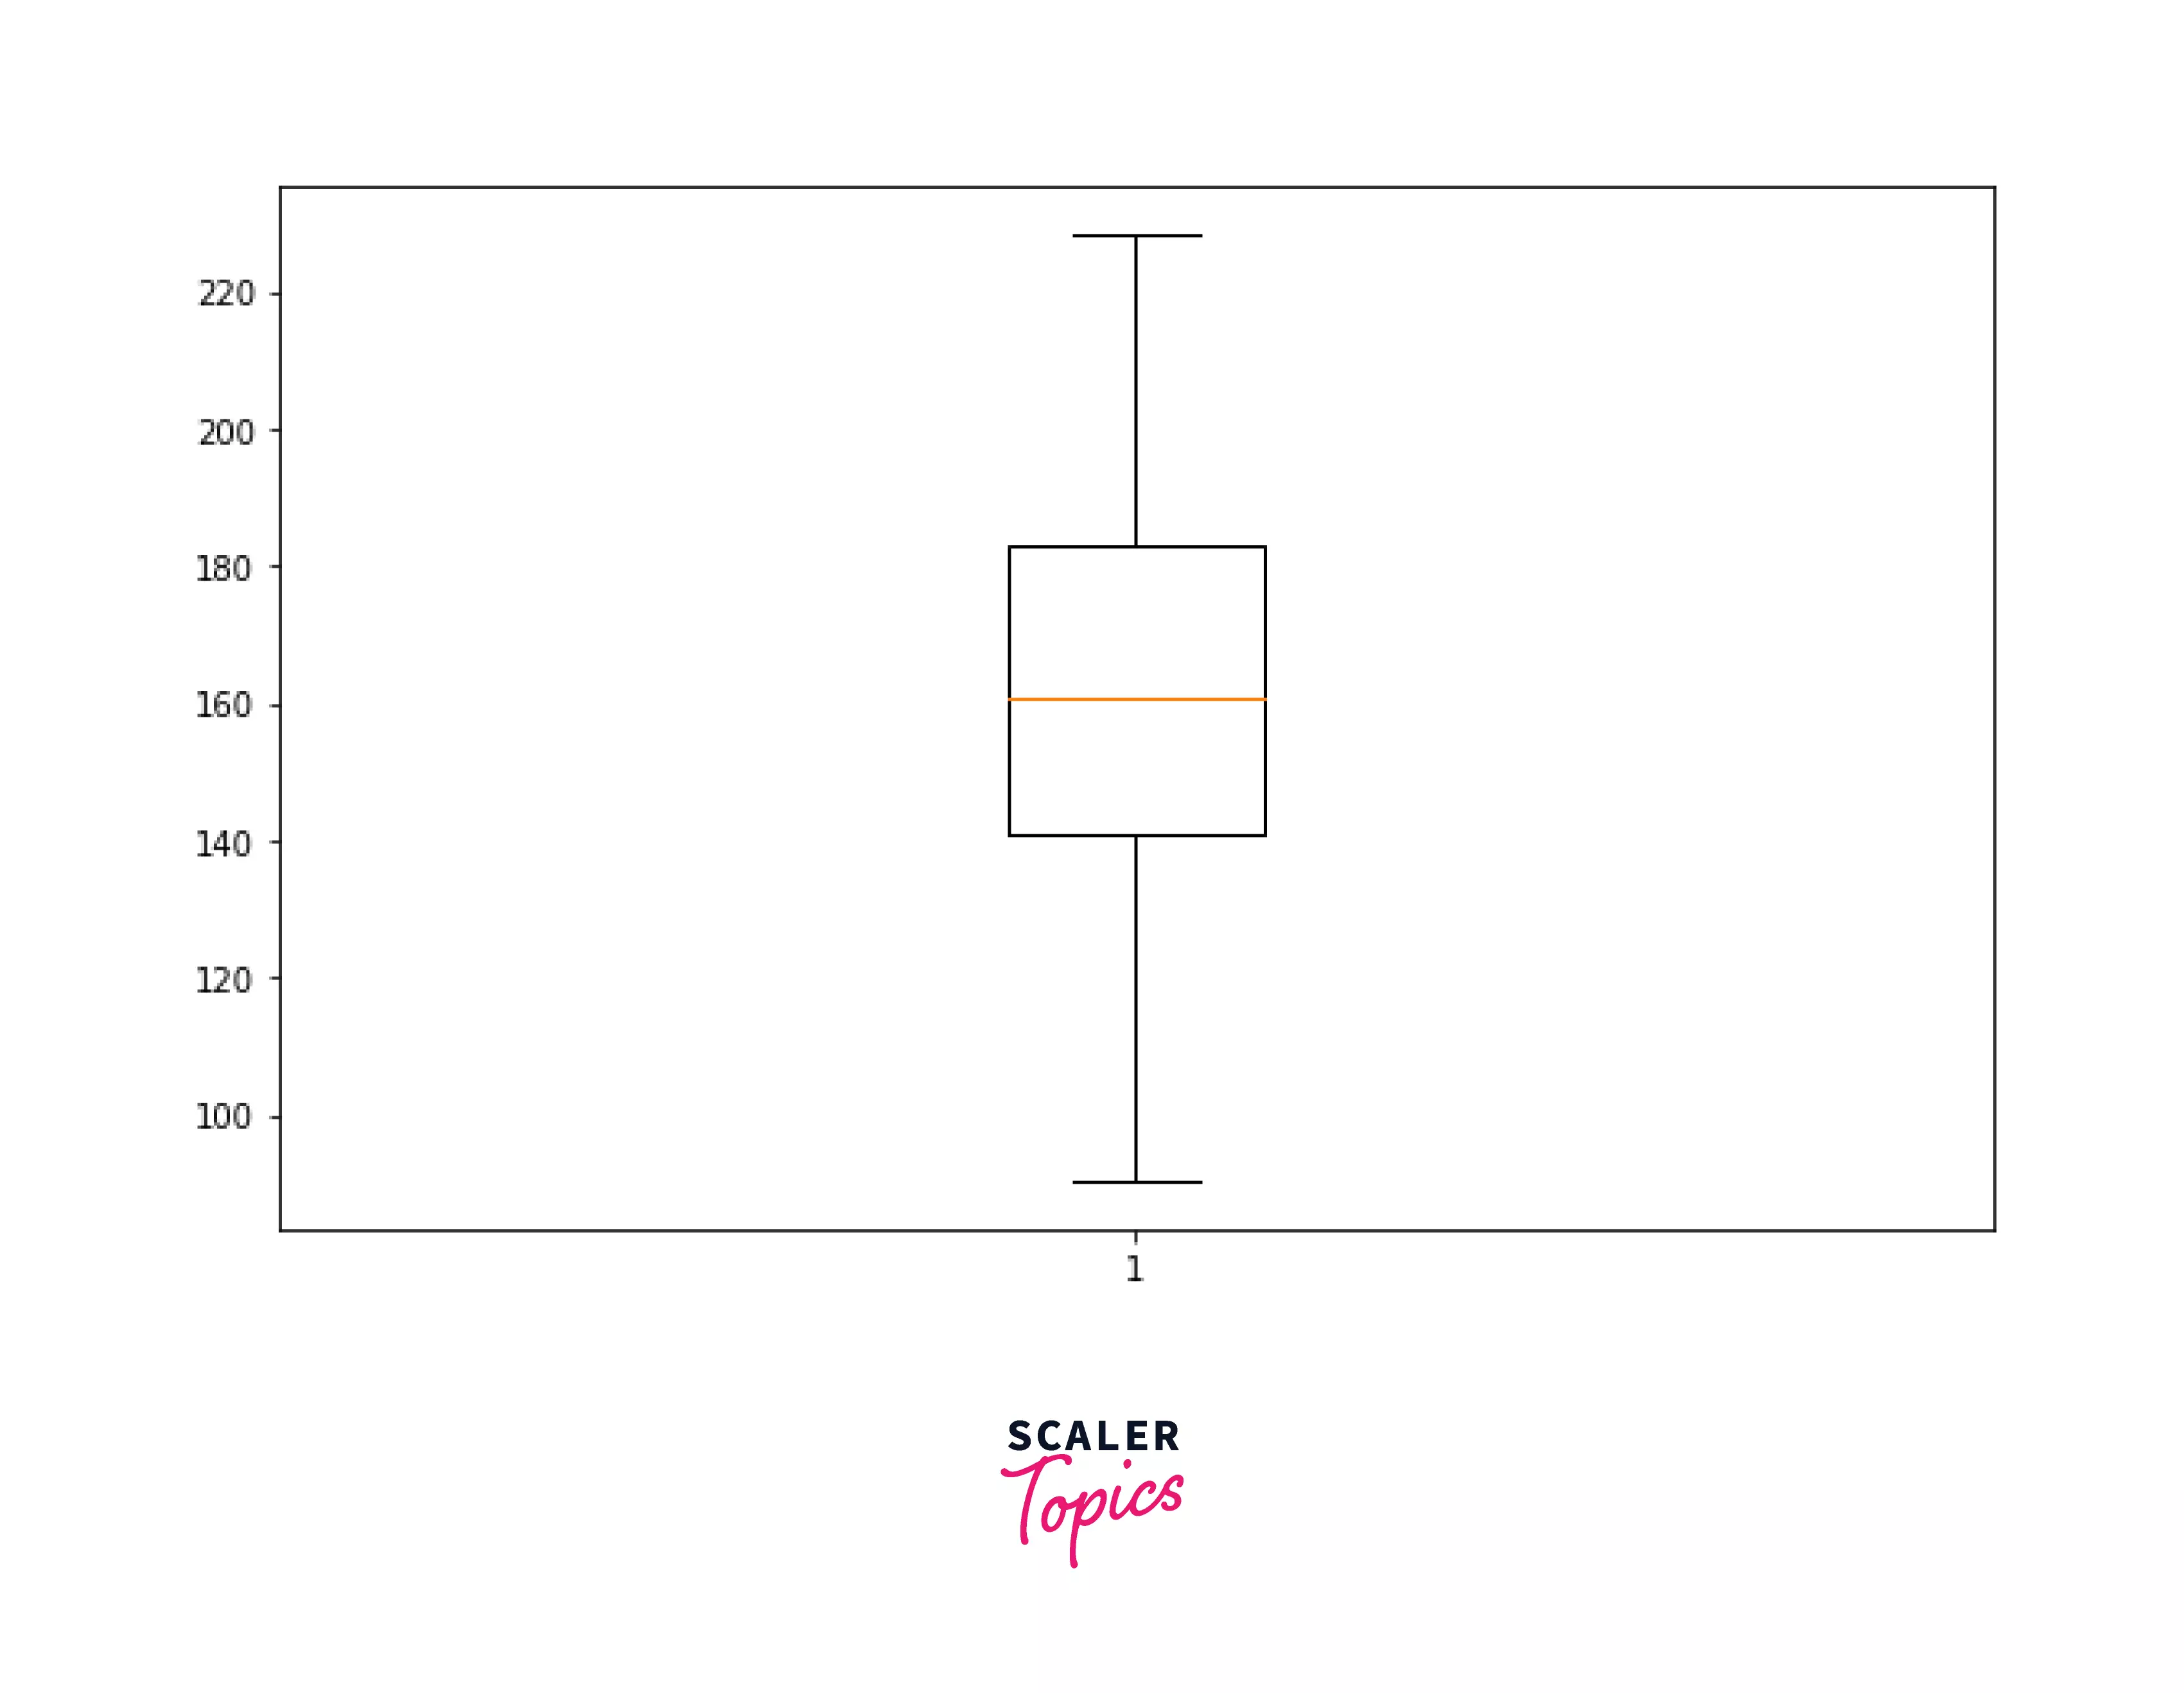
In this example, we will look at how to use the matplotlib boxplot function. We will start by using the numpy library to generate random data, which will then be put into the matplotlib boxplot function. Remember that we are using the Numpy normal function to generate a random sample of data from normally distributed data.
The boxplot created has a box that displays the data's major distribution, while the whiskers at both ends, i.e., the top and bottom, depict the data's outliers.
Output:
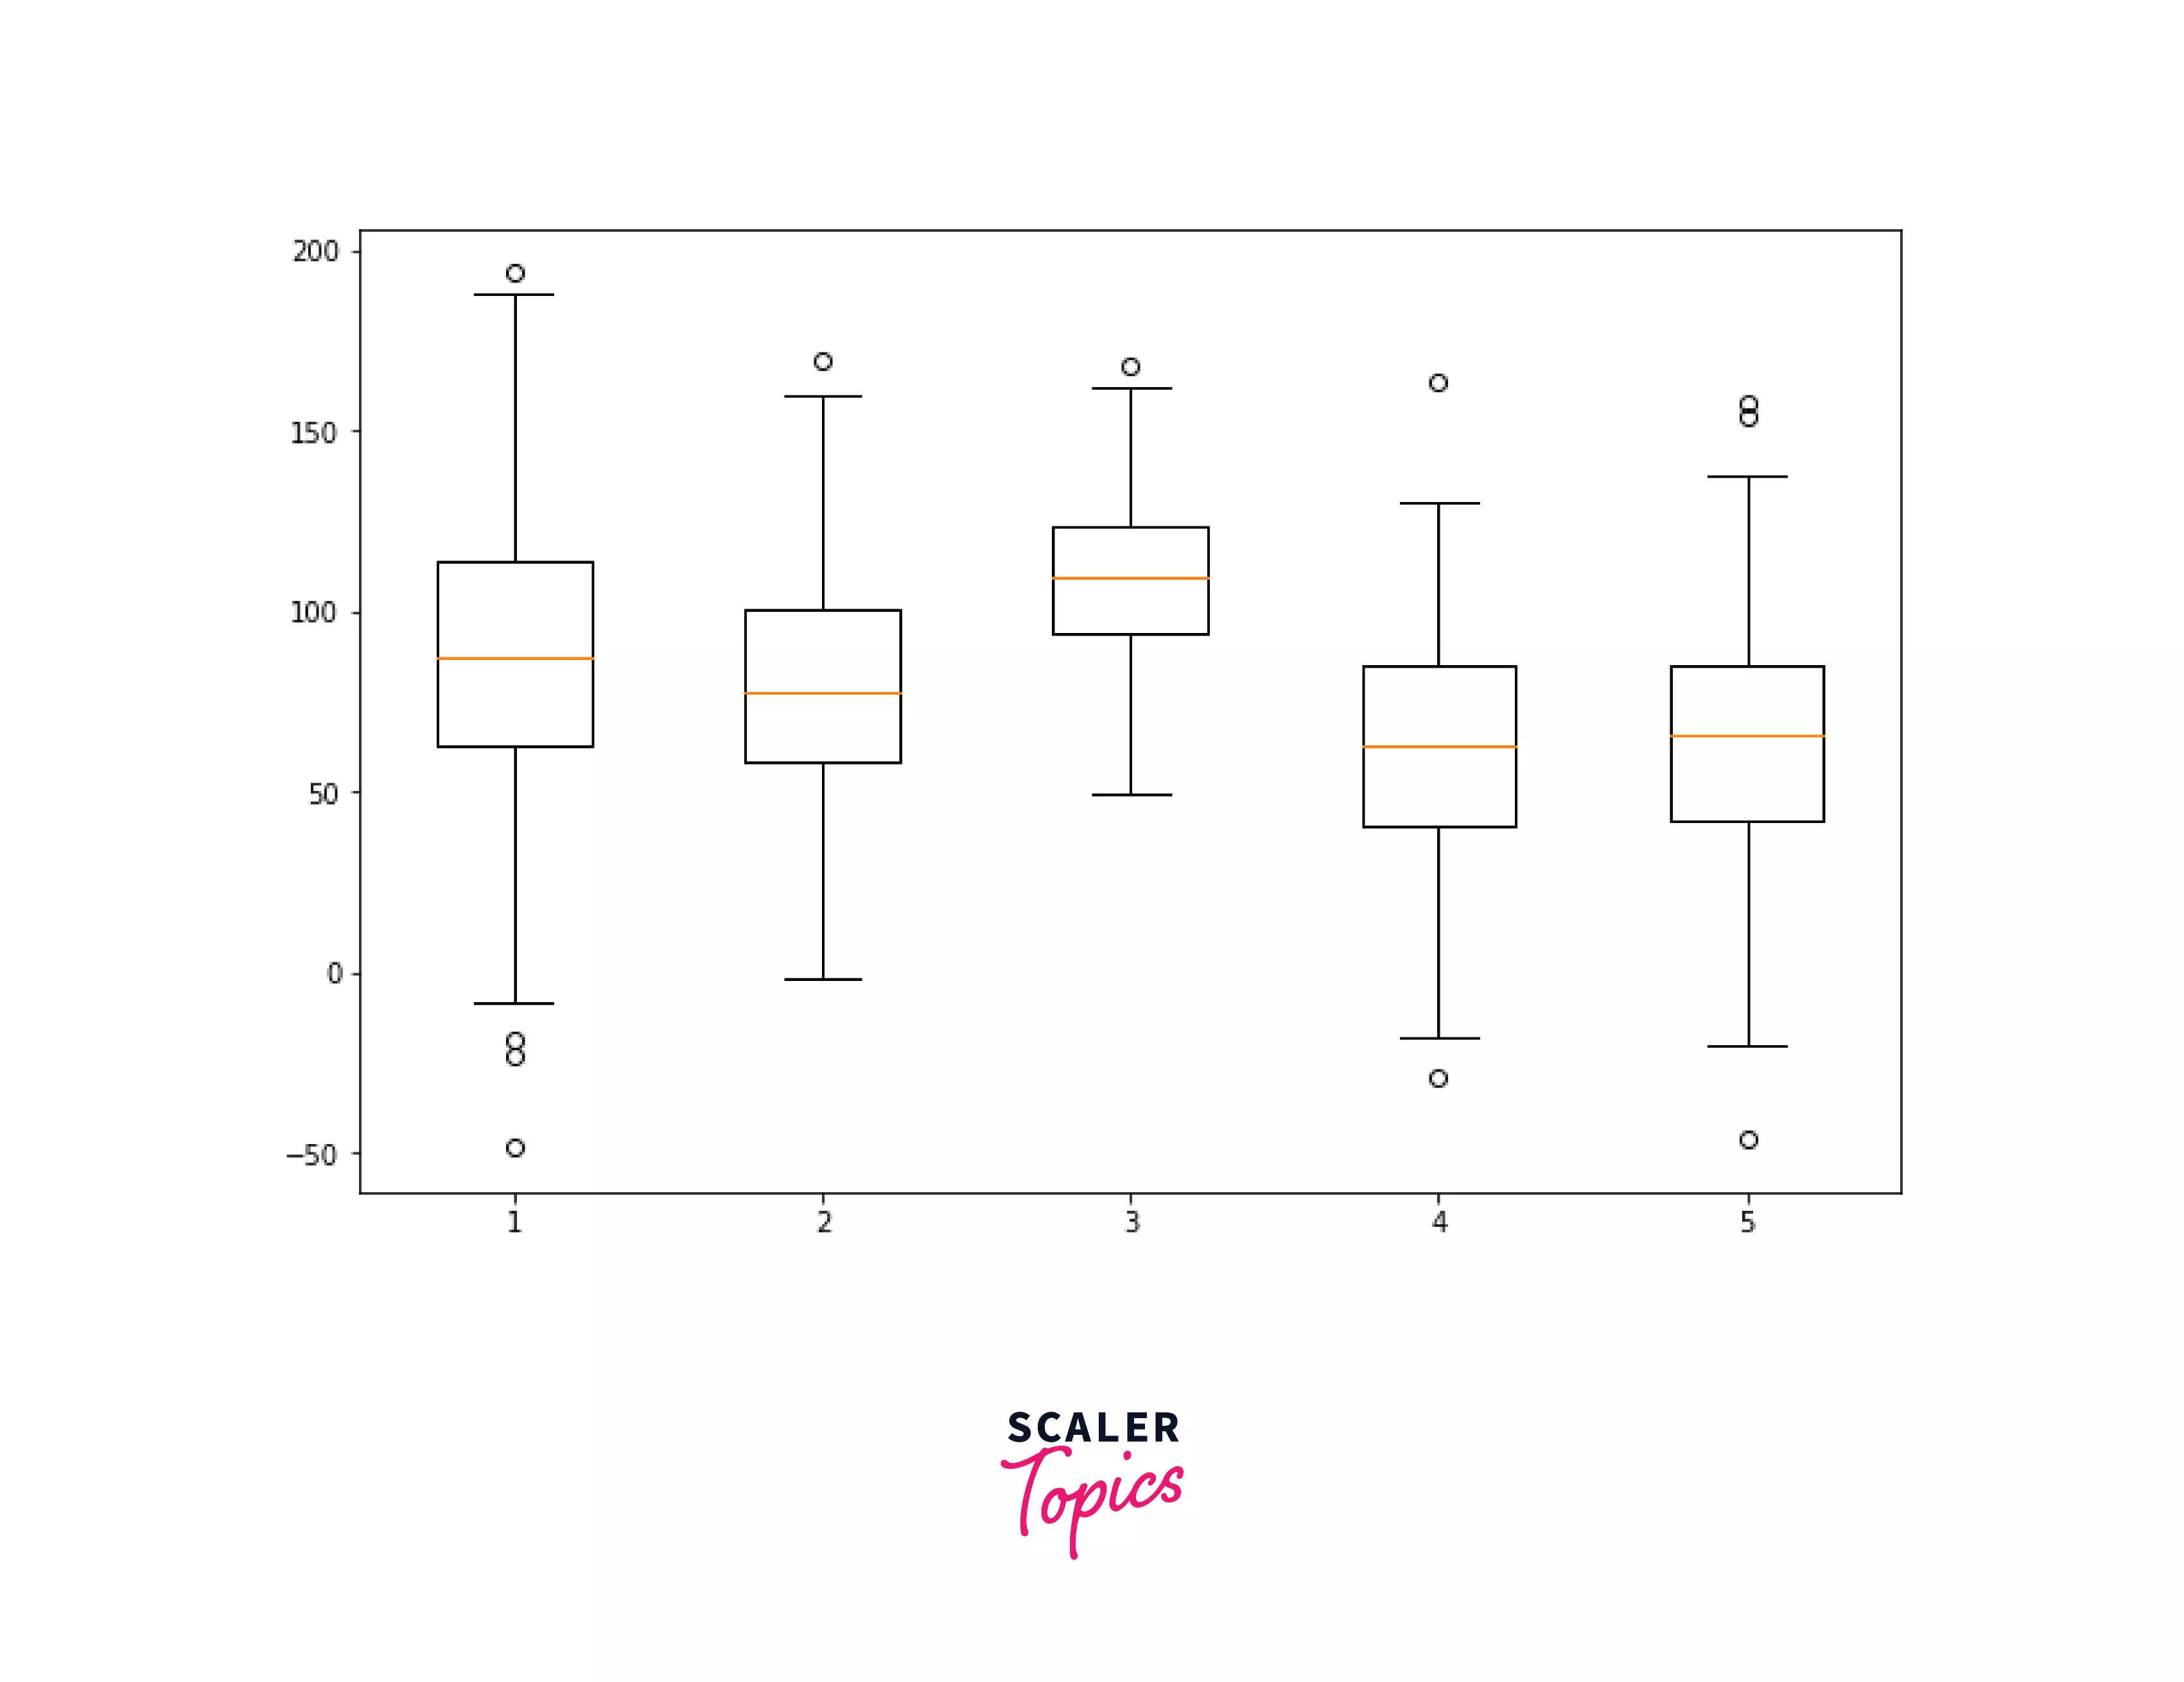
Example 2: Multiple Box Plots in Matplotlib We can also create additional box plots to aid in comparing data from various groups. In this example, we produce normally distributed data for various boxes and feed it to the boxplot function.
Output:
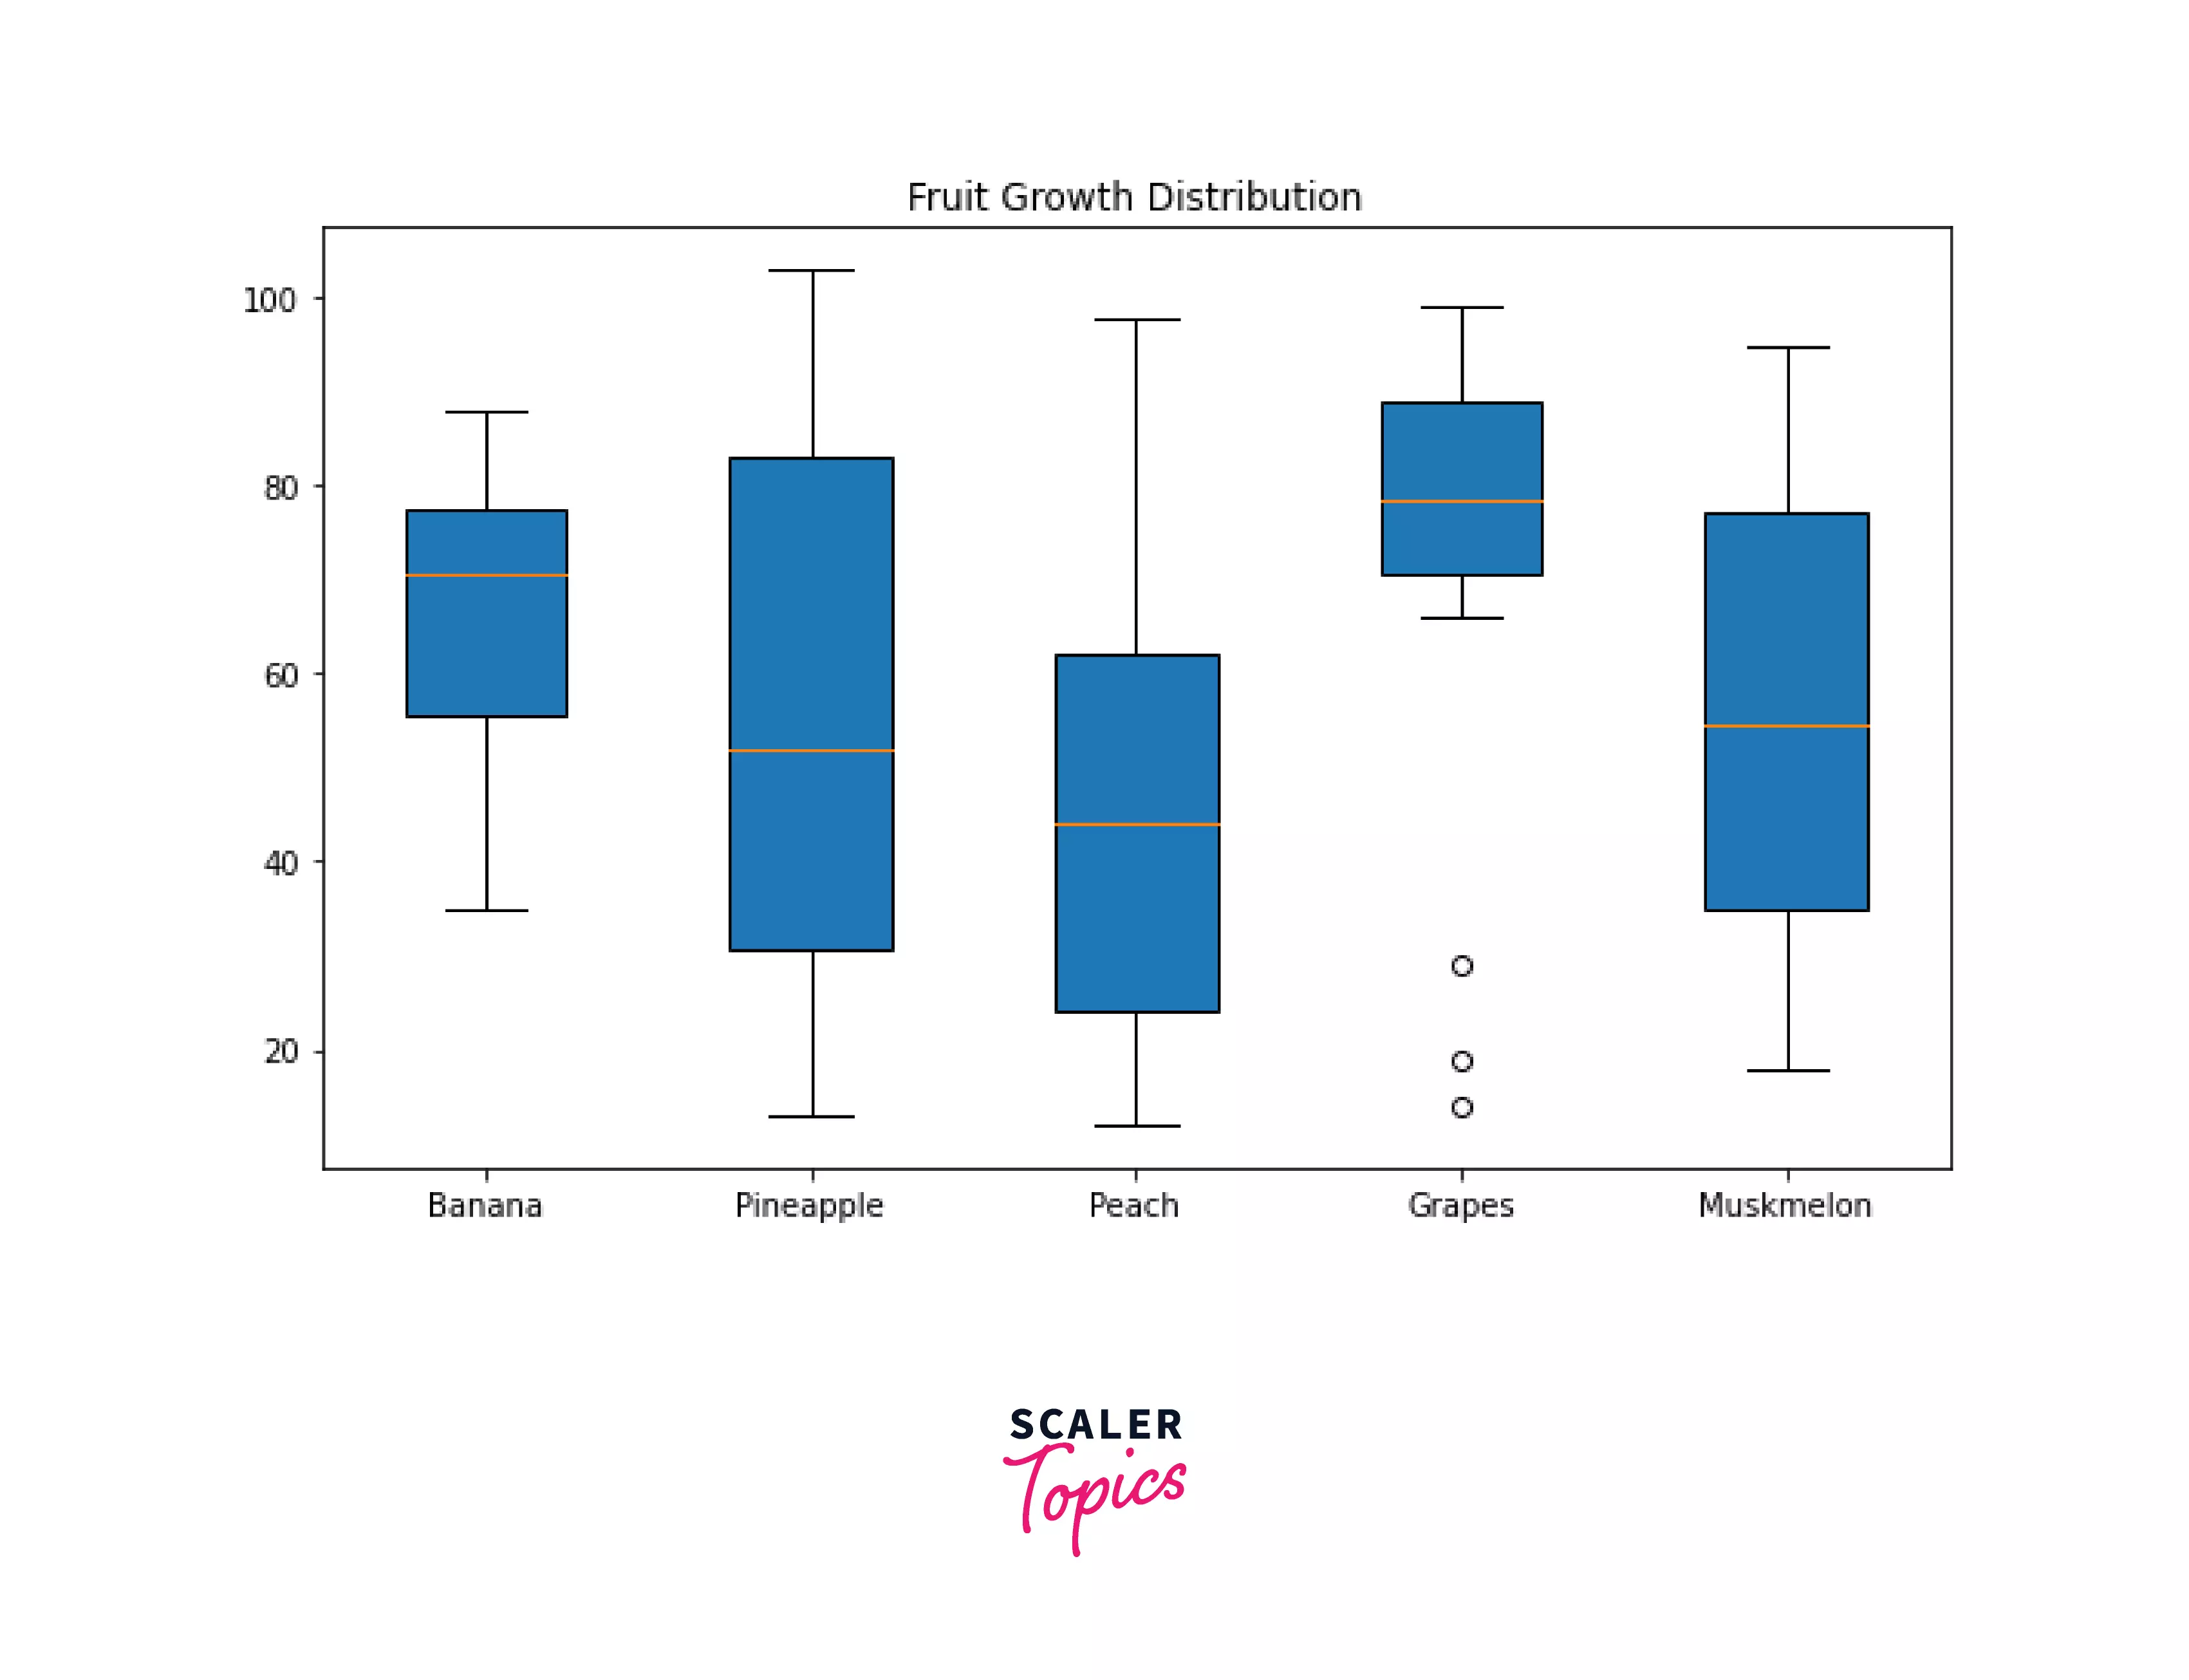
Example 3: Matplotlib boxplot Color Customization The patch_artist argument of the matplotlib boxplot function for color modification, with the help of the Line2d artist, this parameter will aid in displaying the boxplot. In contrast to the preceding example, empty boxes were present, this signifies that the boxes will be filled with colour.
Output:
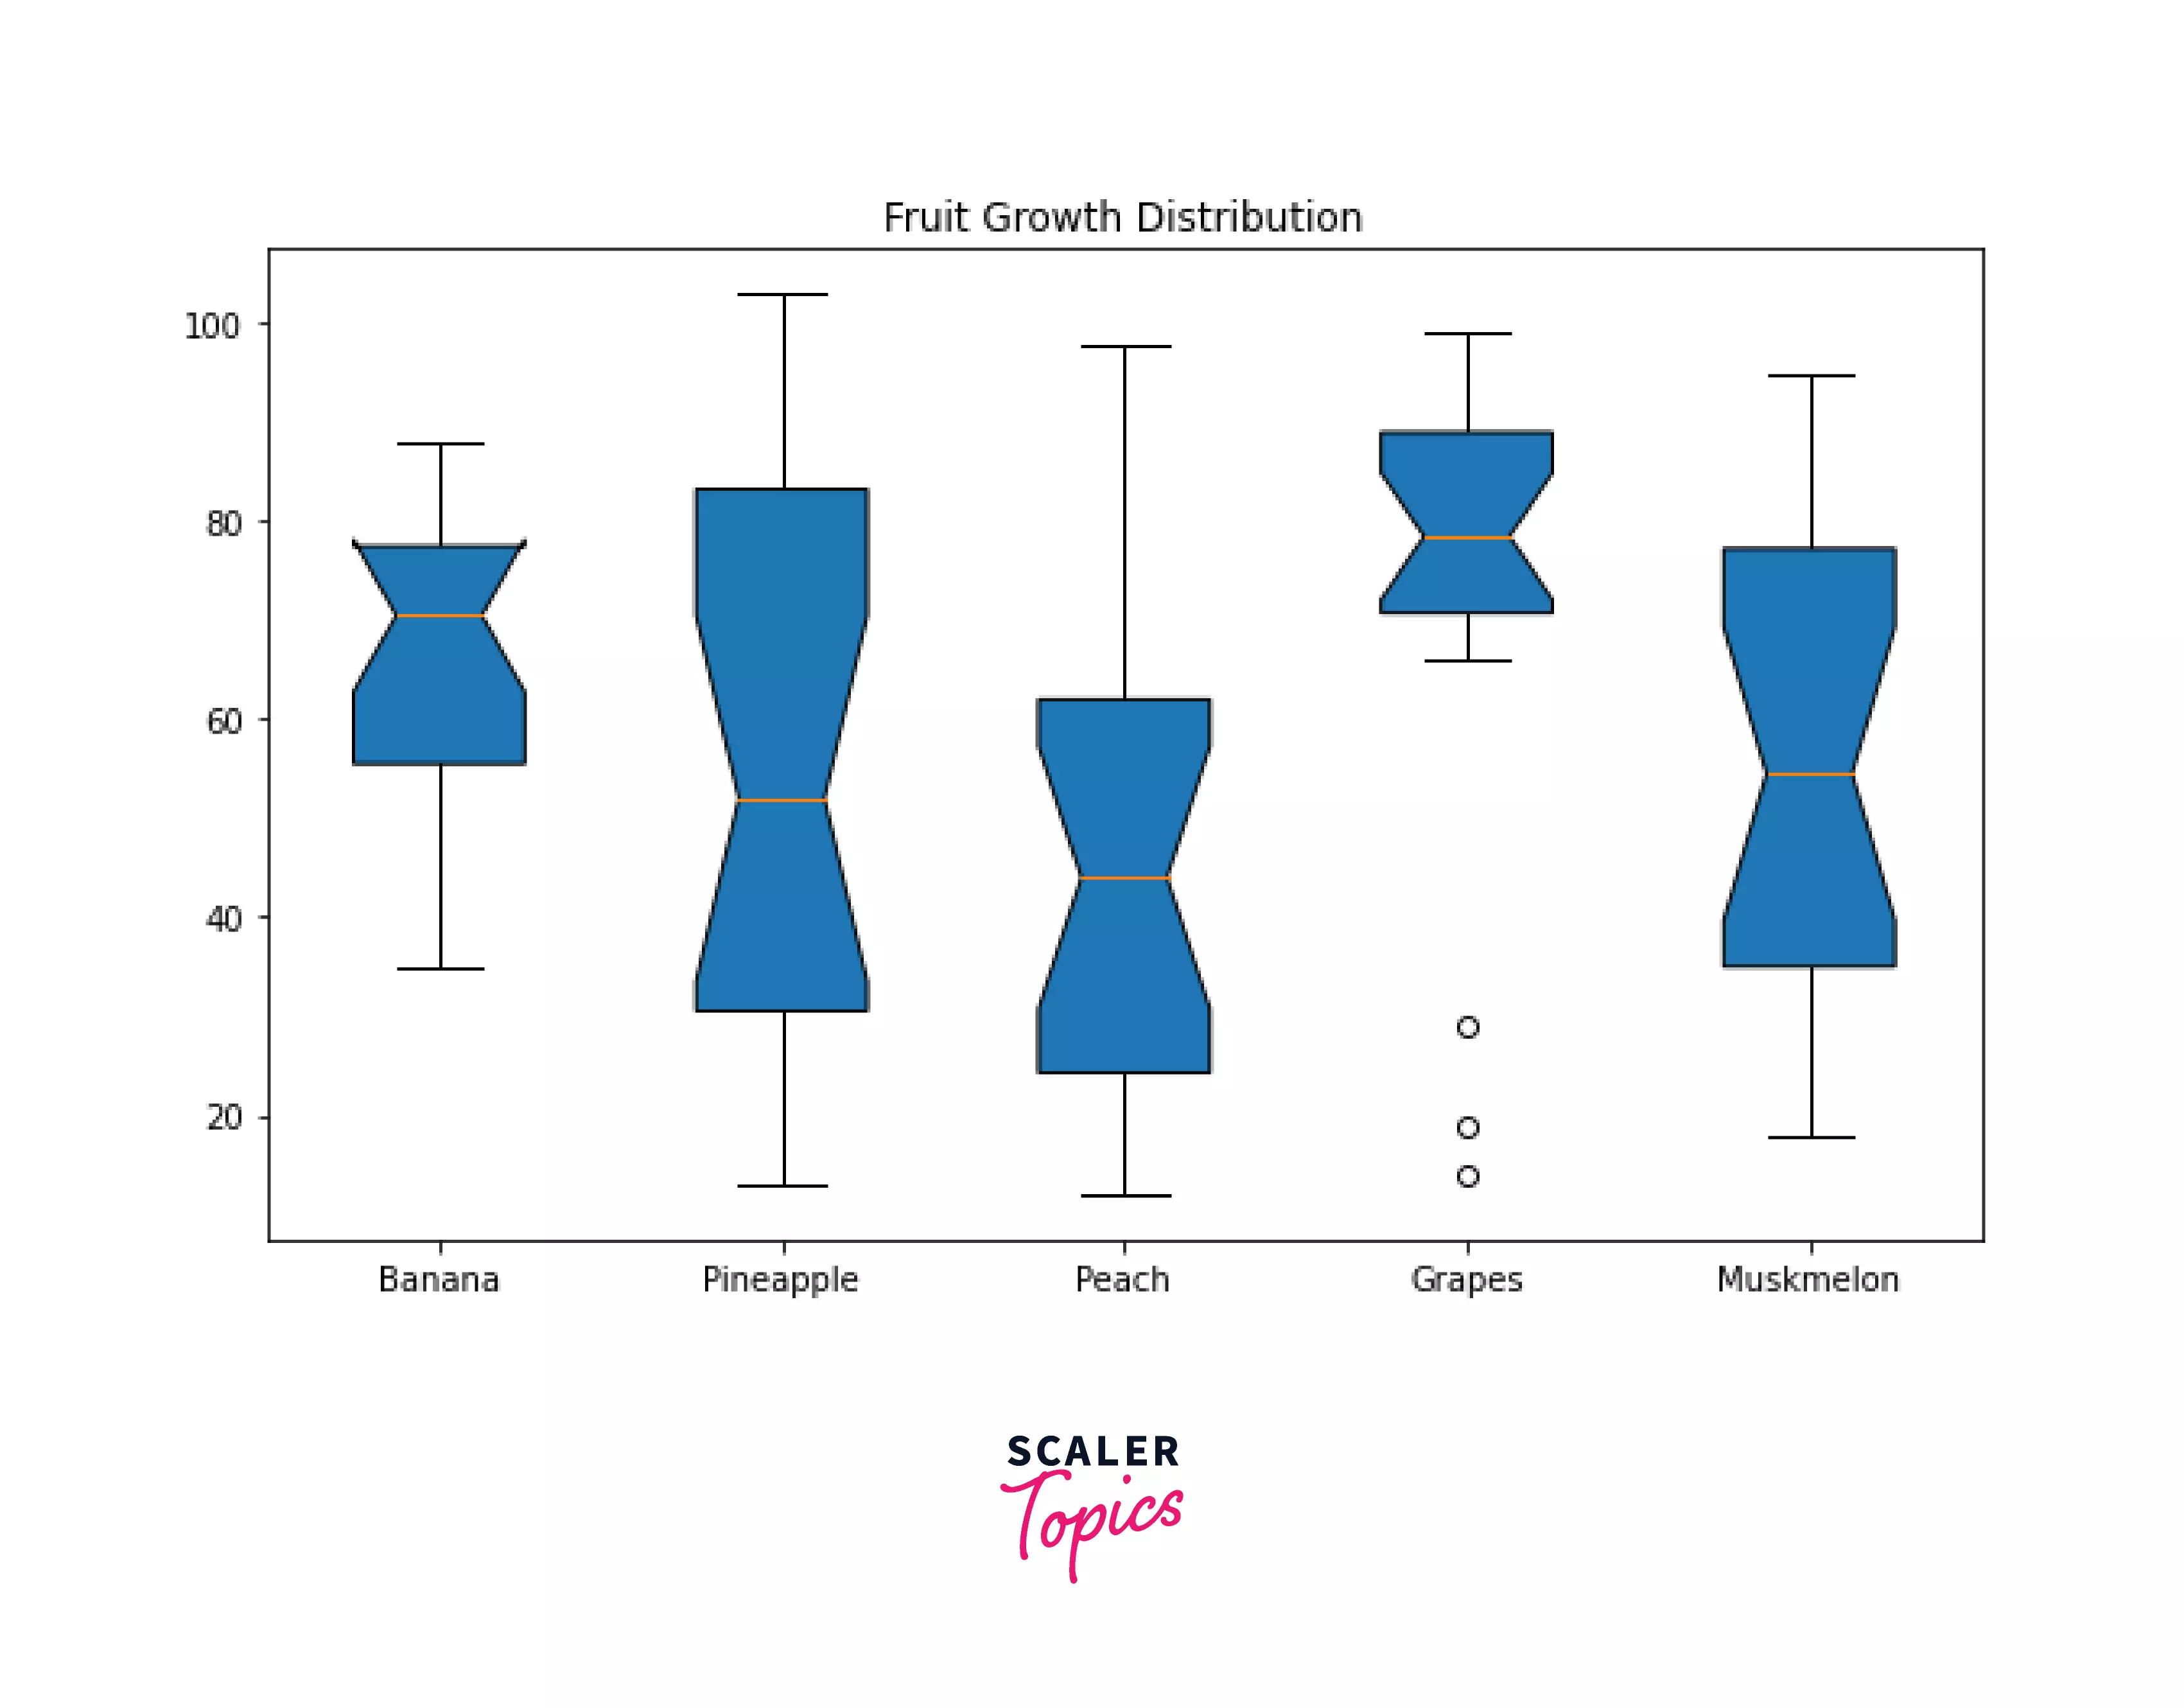
Example 4: Box Plot with Notches This example will explore how to add notches to our box plots. The notches transmit useful information regarding the significance of two separate box plots' differential medians.
Again, we can use the boxplot method with the notch argument set to True to create a boxplot with notches. We can produce random data first, then make notches in this manner.
Output:
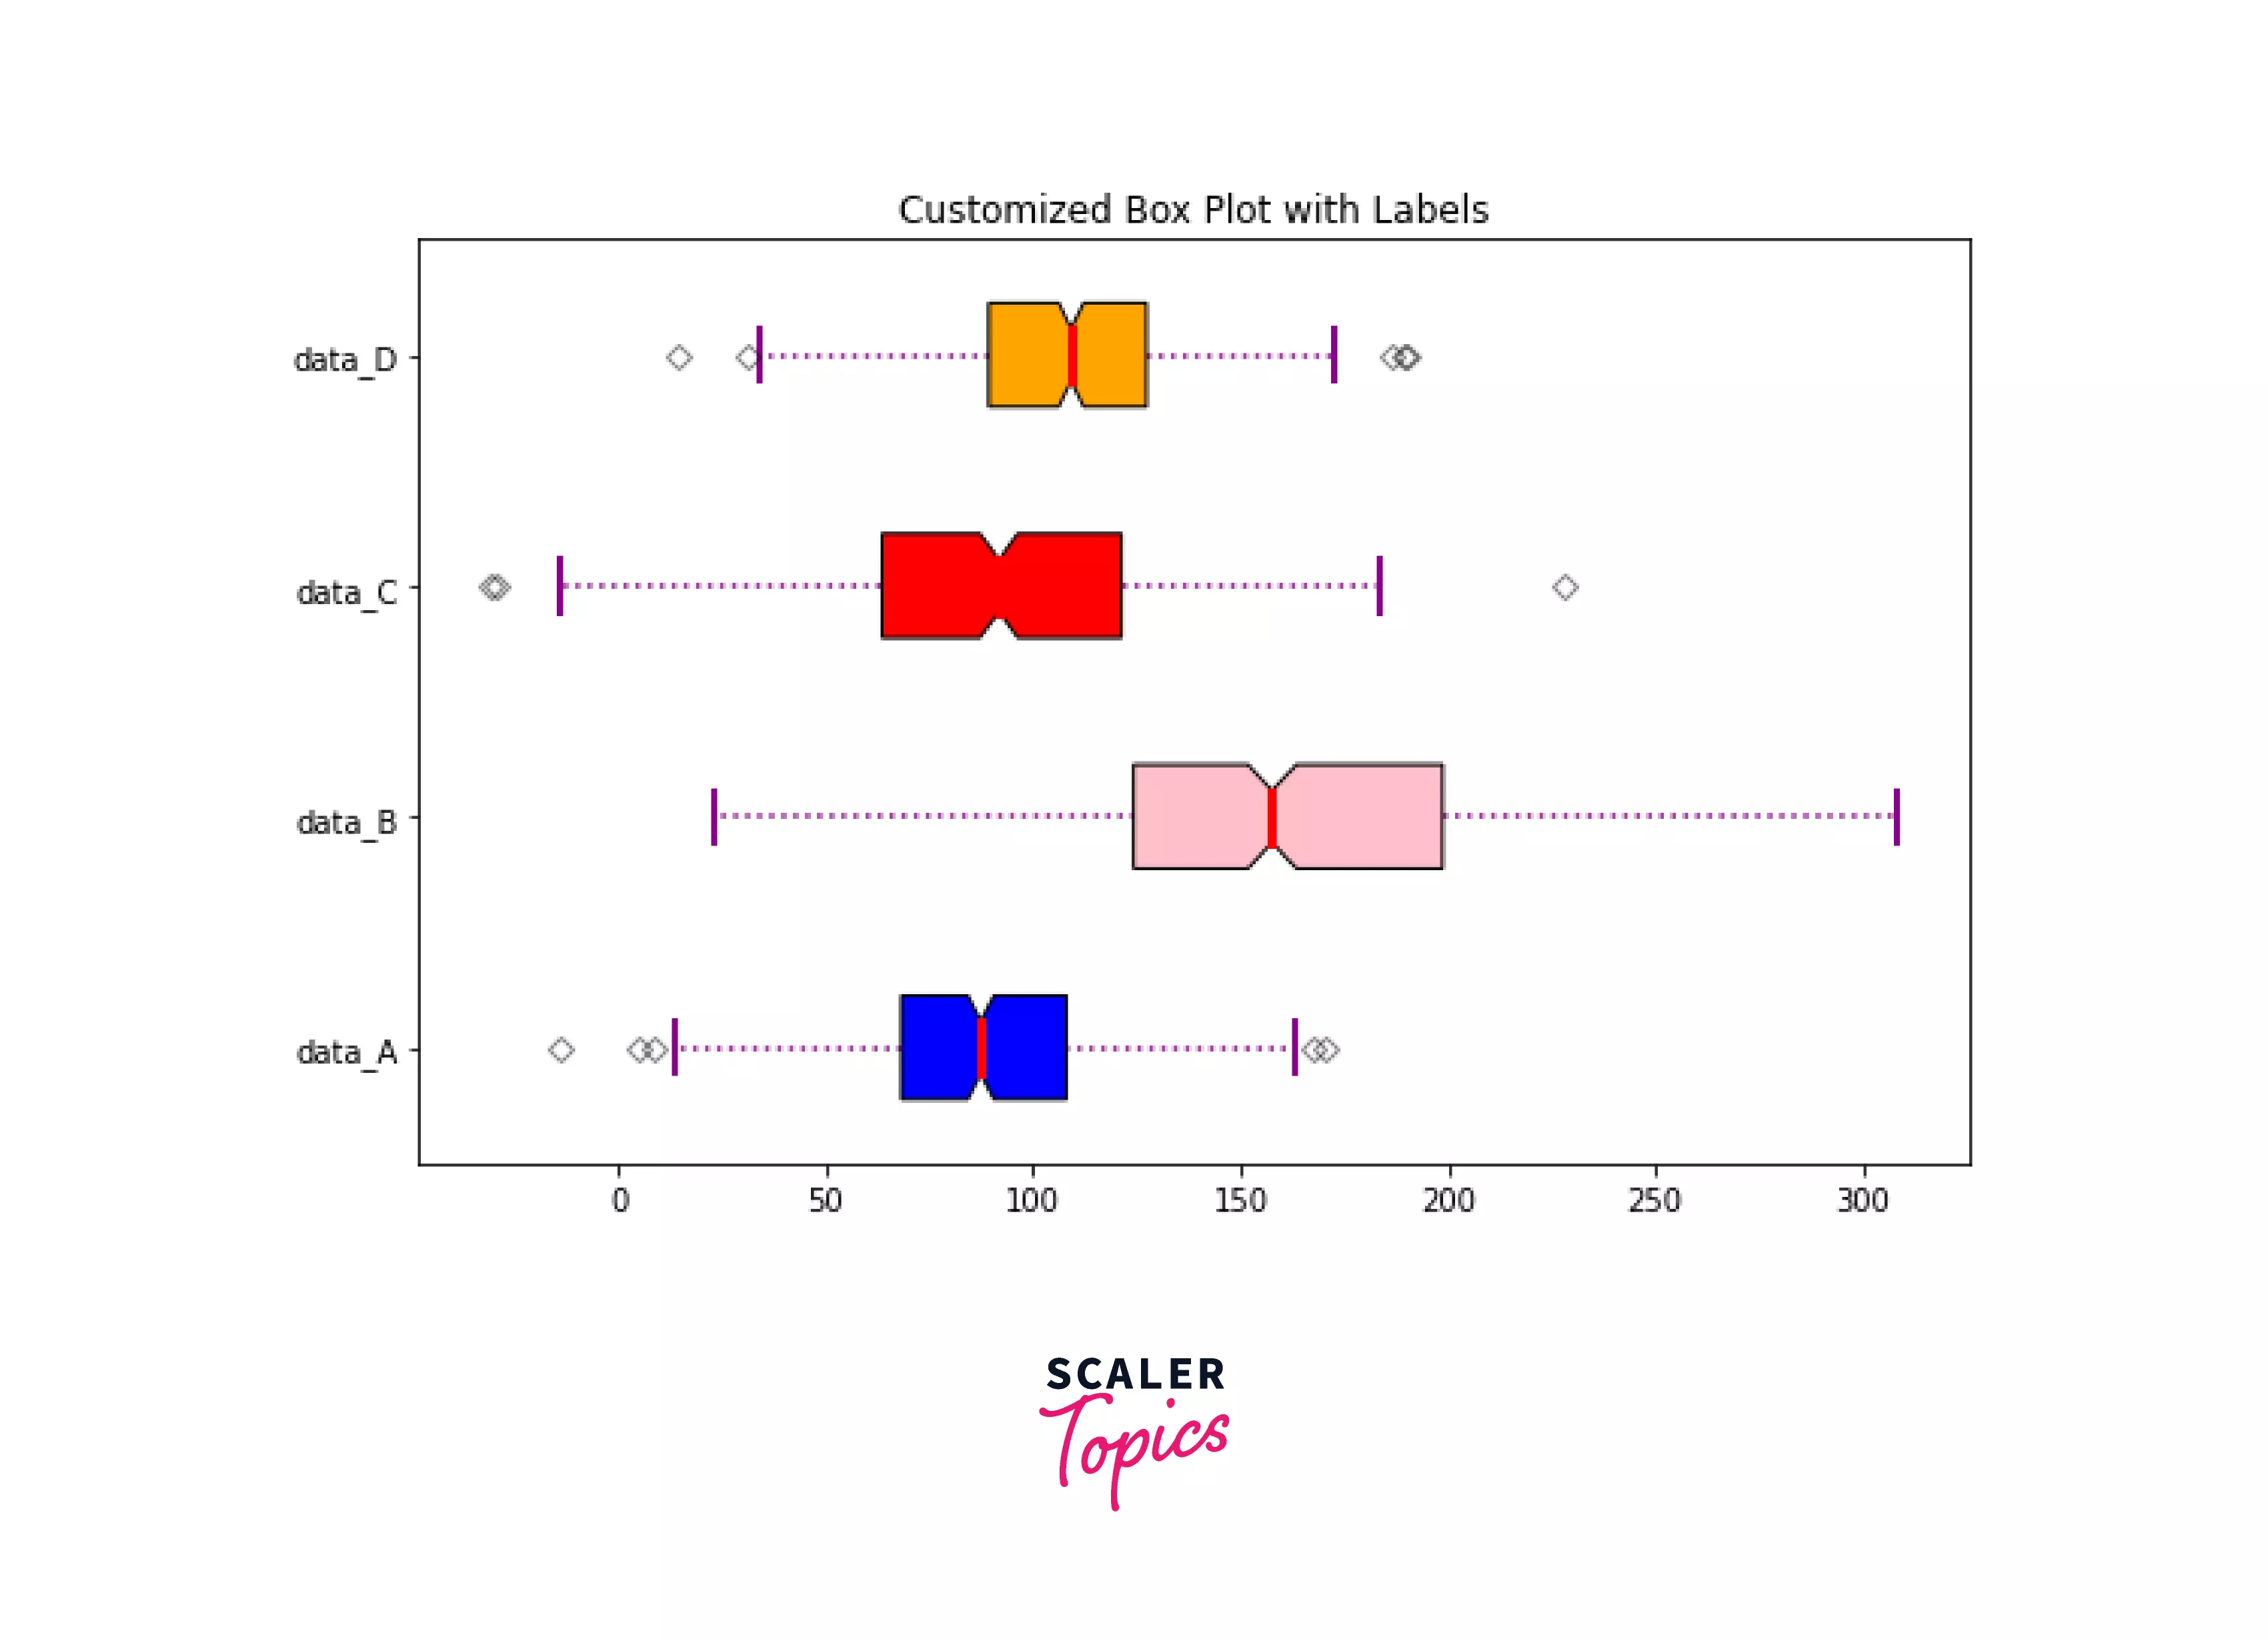
Example 5: Horizontal Box Plots with Whiskers of Various Lengths and Colors
The final example in this matplotlib box plot tutorial will show us how to create horizontal boxplots; the previous examples all focused on vertical boxplots. We use the subplot function to plot this graph once we've created random data. We will get horizontal boxplots if we set the vert option to 0 for horizontal boxplots. Using a loop, we can modify the appearance and linewidth of whiskers, caps, medians, and fliers.
Output:
Explore the Hands-on Applications of These Concepts in Our Data Science Courses. Enroll Now and Turn Theoretical Knowledge into Practical Mastery.
Conclusion:
- This matplotlib boxplot tutorial offered a comprehensive overview of how to use matplotlib to create a variety of boxplots.
- We learned how to use the boxplot function's various arguments. This tutorial also demonstrated how to make vertical and horizontal boxplots.
- We can create several boxplots on the same axes by defining as many data sets as needed.
- In addition, the Matlotlib boxplot allows for several customization options. Different examples of customization have also been considered.
