Combine Multiple Subplots in Matplotlib
Overview
The depiction of data through the use of typical graphics, such as infographics, charts, and animations, is known as data visualization. In-demand jobs like Data Analysts, and Data Scientists have their most important requirements in Data Visualization. Hence, the demand for learning data visualization is high for CS graduates.
The matplotlib package in Python helps us to achieve data visualization effortlessly. Just a few lines of code, and we'd have a beautiful and meaningful representation of our data.
Matplotlib comes with a lot of packages to make life easy for us, though the most notable feature of matplotlib is subplots. Subplots help us to create various plots on a single canvas. This gives us a lot of analytics and insights into our visualizations.
This article will address what subplots are, how they are created, and how to combine multiple subplots in matplotlib.
What is a Subplot in Matplotlib?
- Subplot in matplotlib is one of the multiple plots we can fit in our canvas.
- Subplots visualize the data more analytically, and we can generate better inferences from it.
- Further in this article, we will learn how to create subplots and much more.
How to Create Subplots in Matplotlib?
The syntax for subplots() is :
where the parameter is:
-
n : Number of subplots needed
-
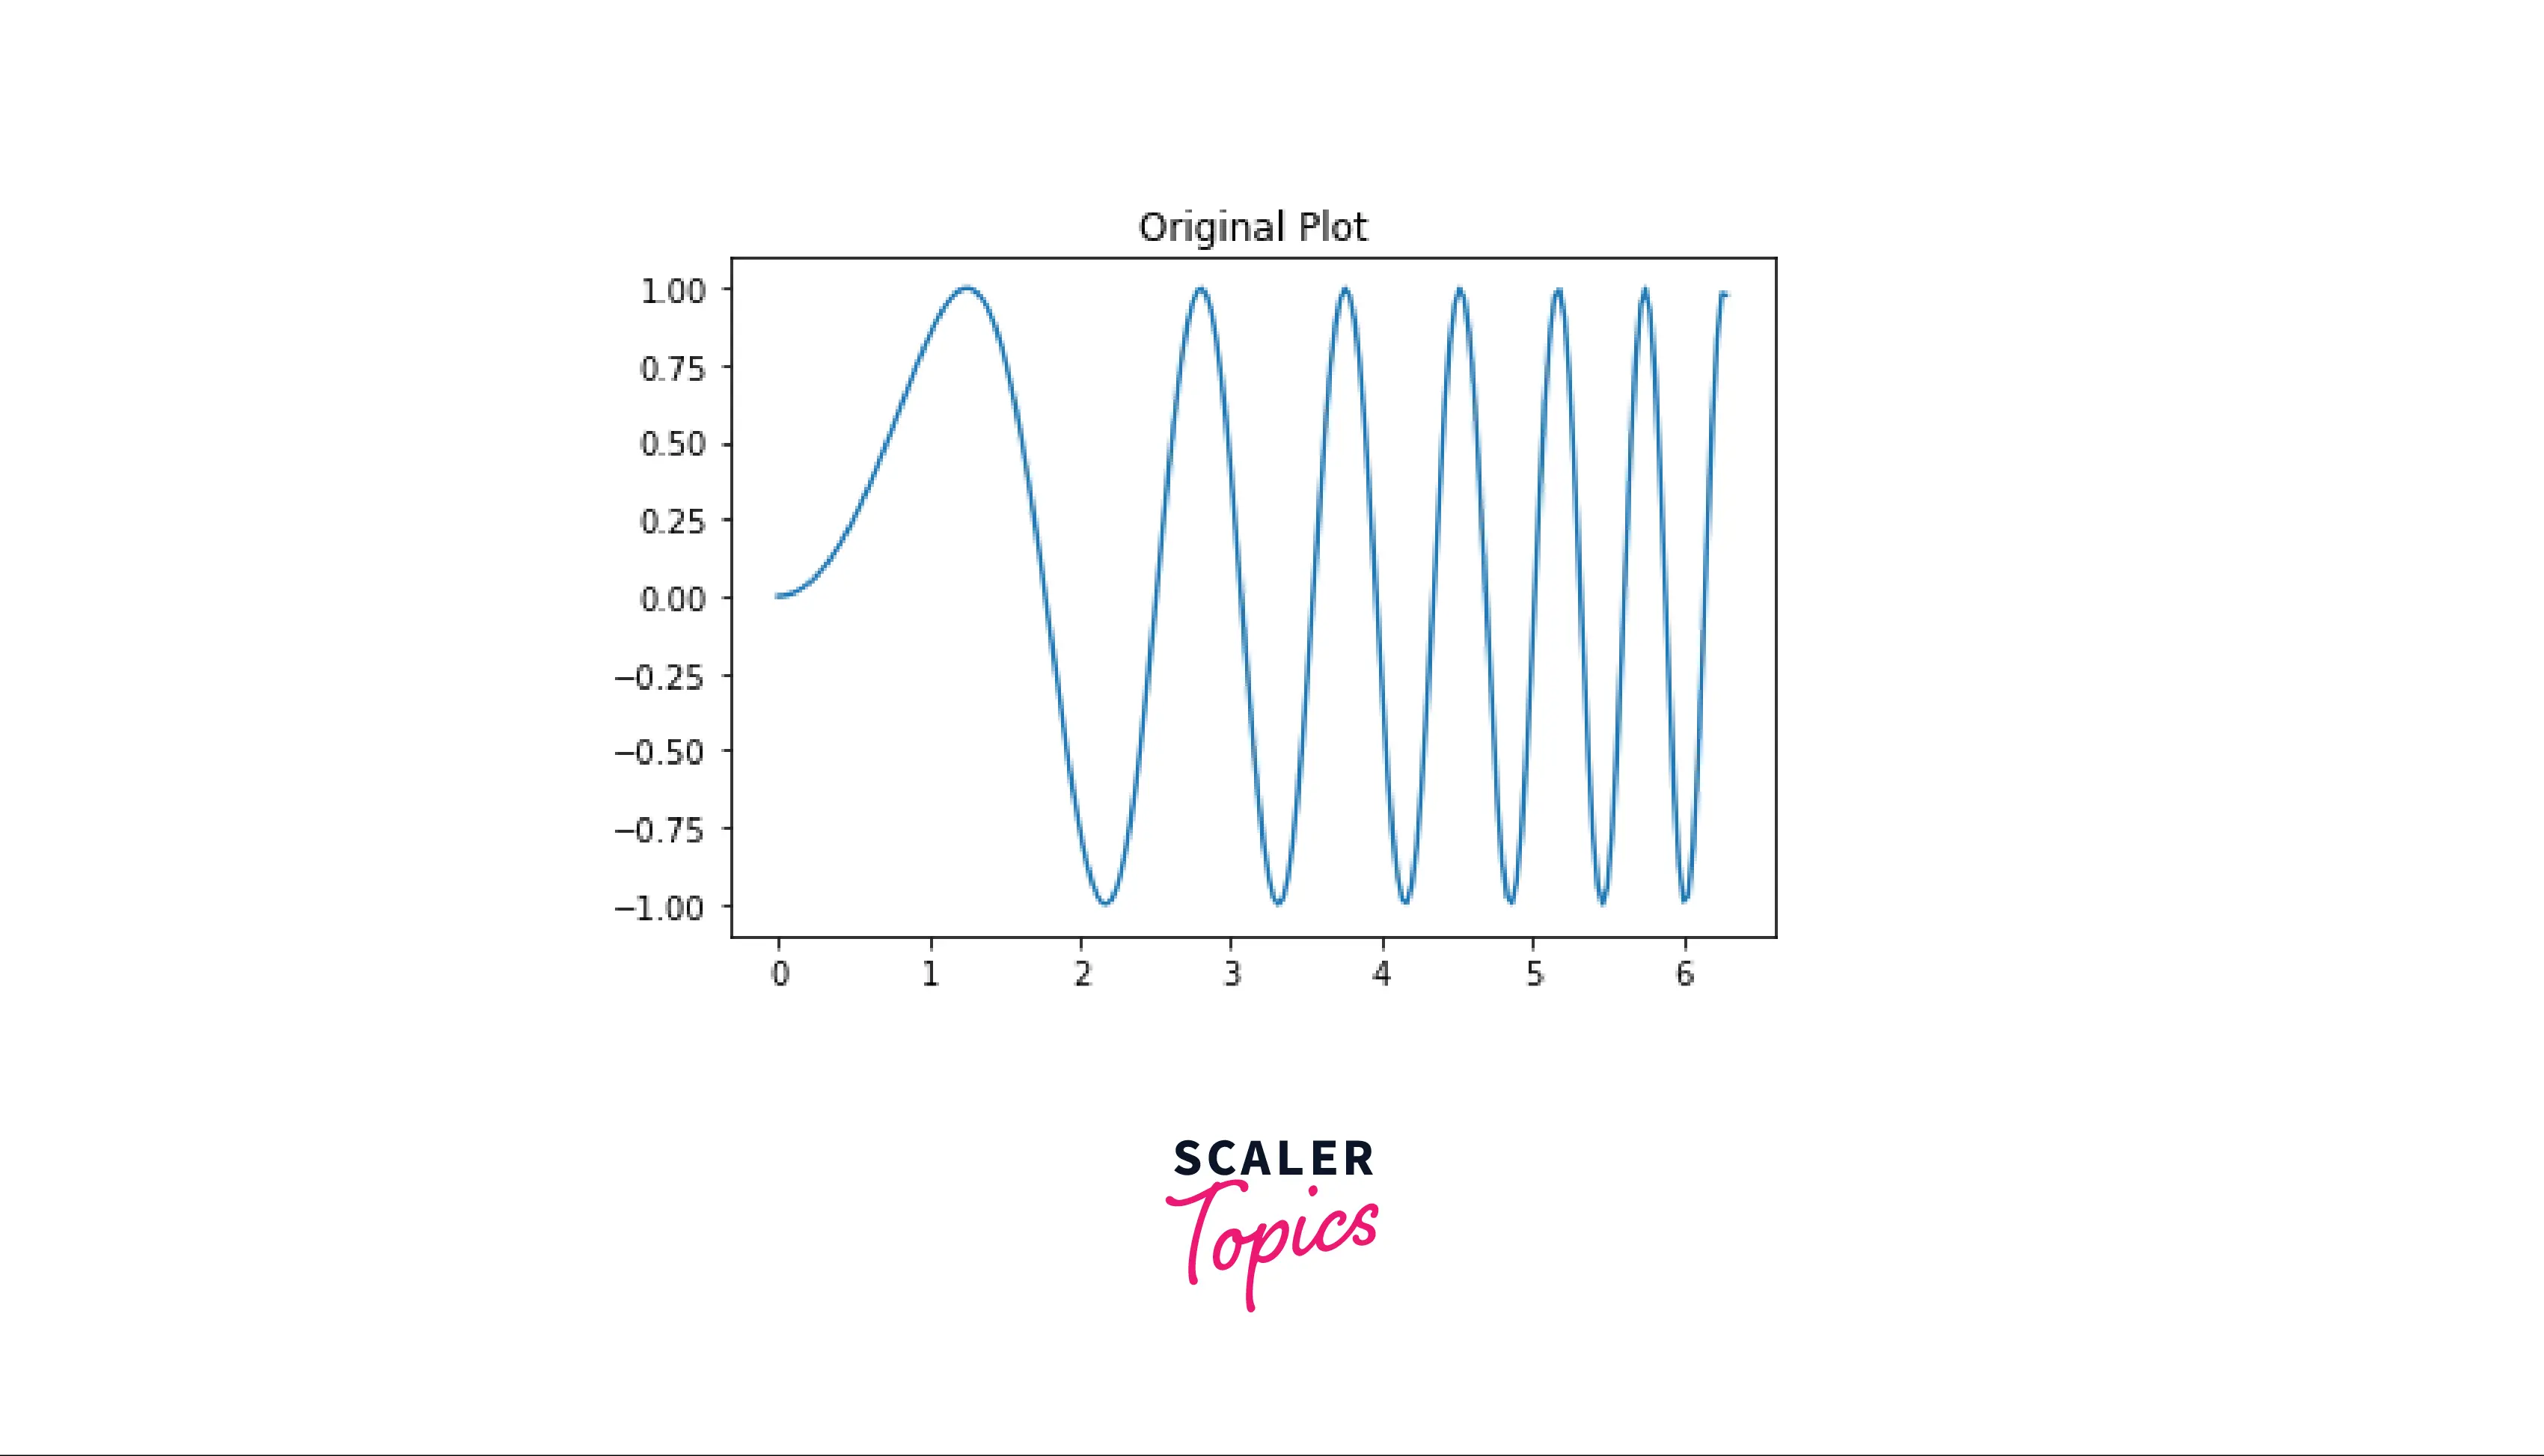
If we don't put any value for n, we will get only one plot.
Output:
-
Since the value of n was not specified, the code returned a single plot.
Note:
As you can see on line 8, plt.subplots() returns two values, a figure, and an axes. The figure acts as the canvas, and the axes act as our plot.
How to Stack a Subplot in Matplotlib?
-
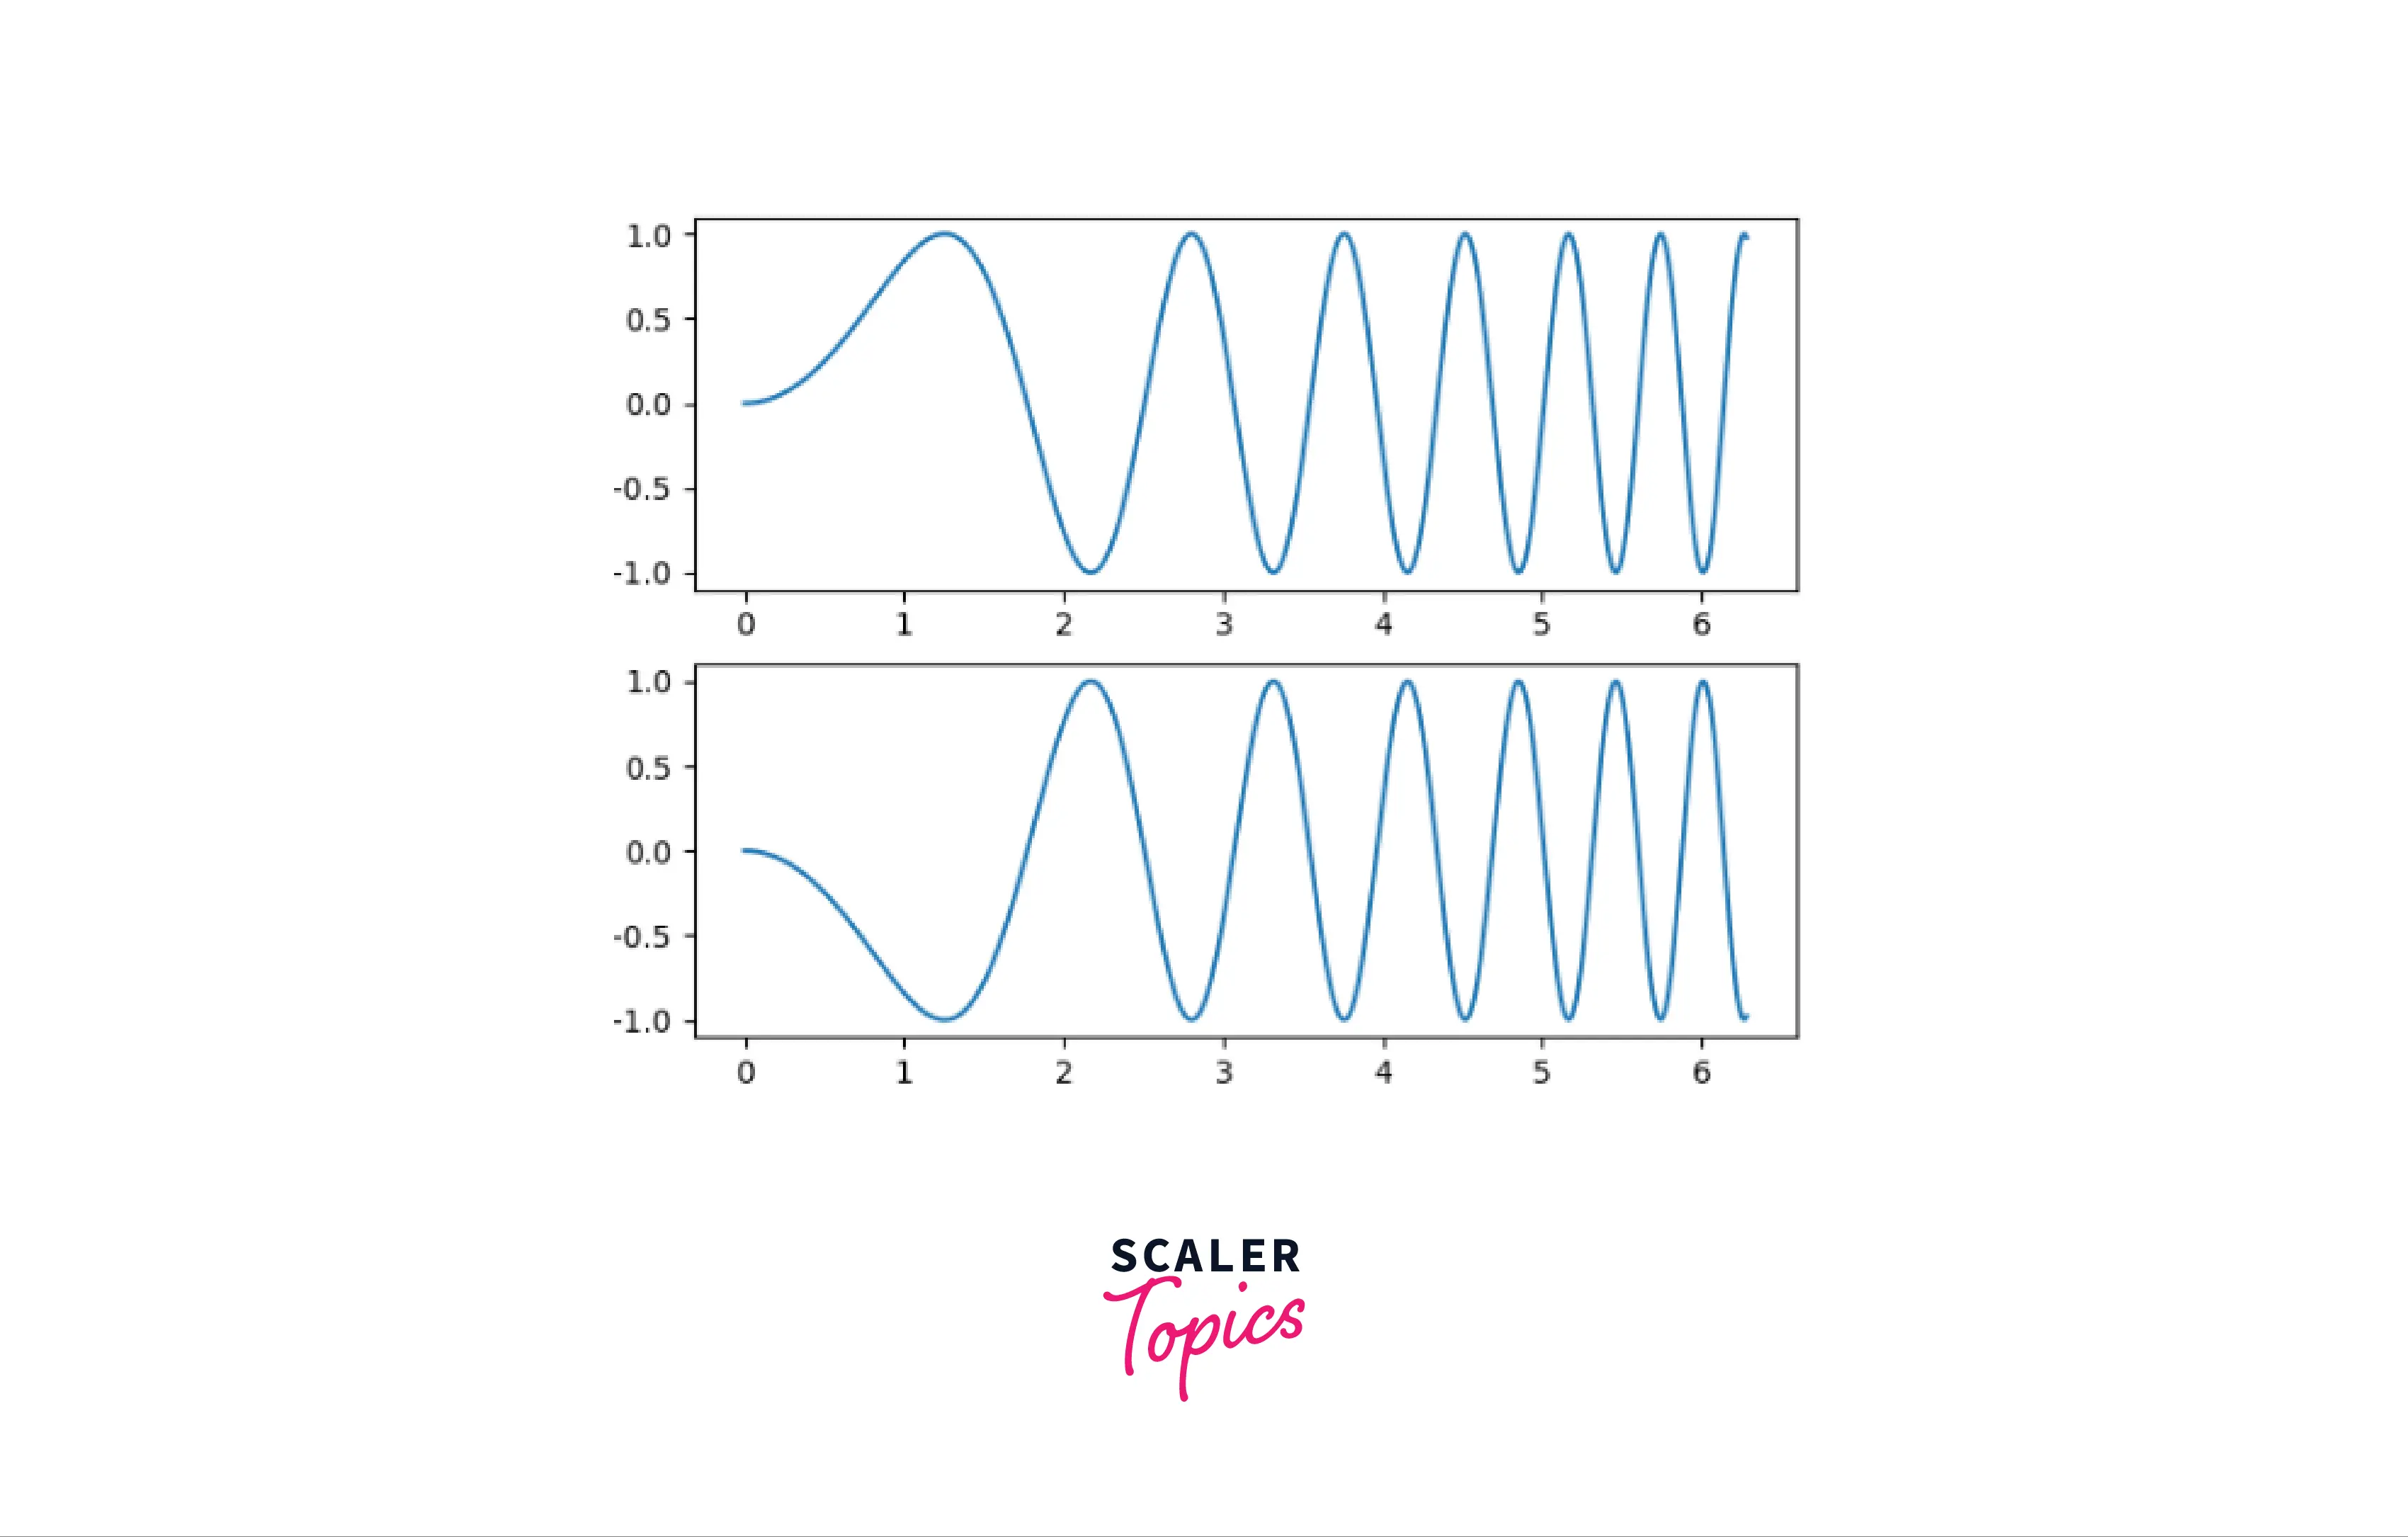
There are two ways to stack multiple plots in matplotlib, Horizontal and Vertical stacking.
-
In vertical stacking, we divide the plot vertically (which means that we divide the plot into its vertical components, like vectors).
-
To get vertical stacks, we need to put the value of subplots() as 2.
Output:
-
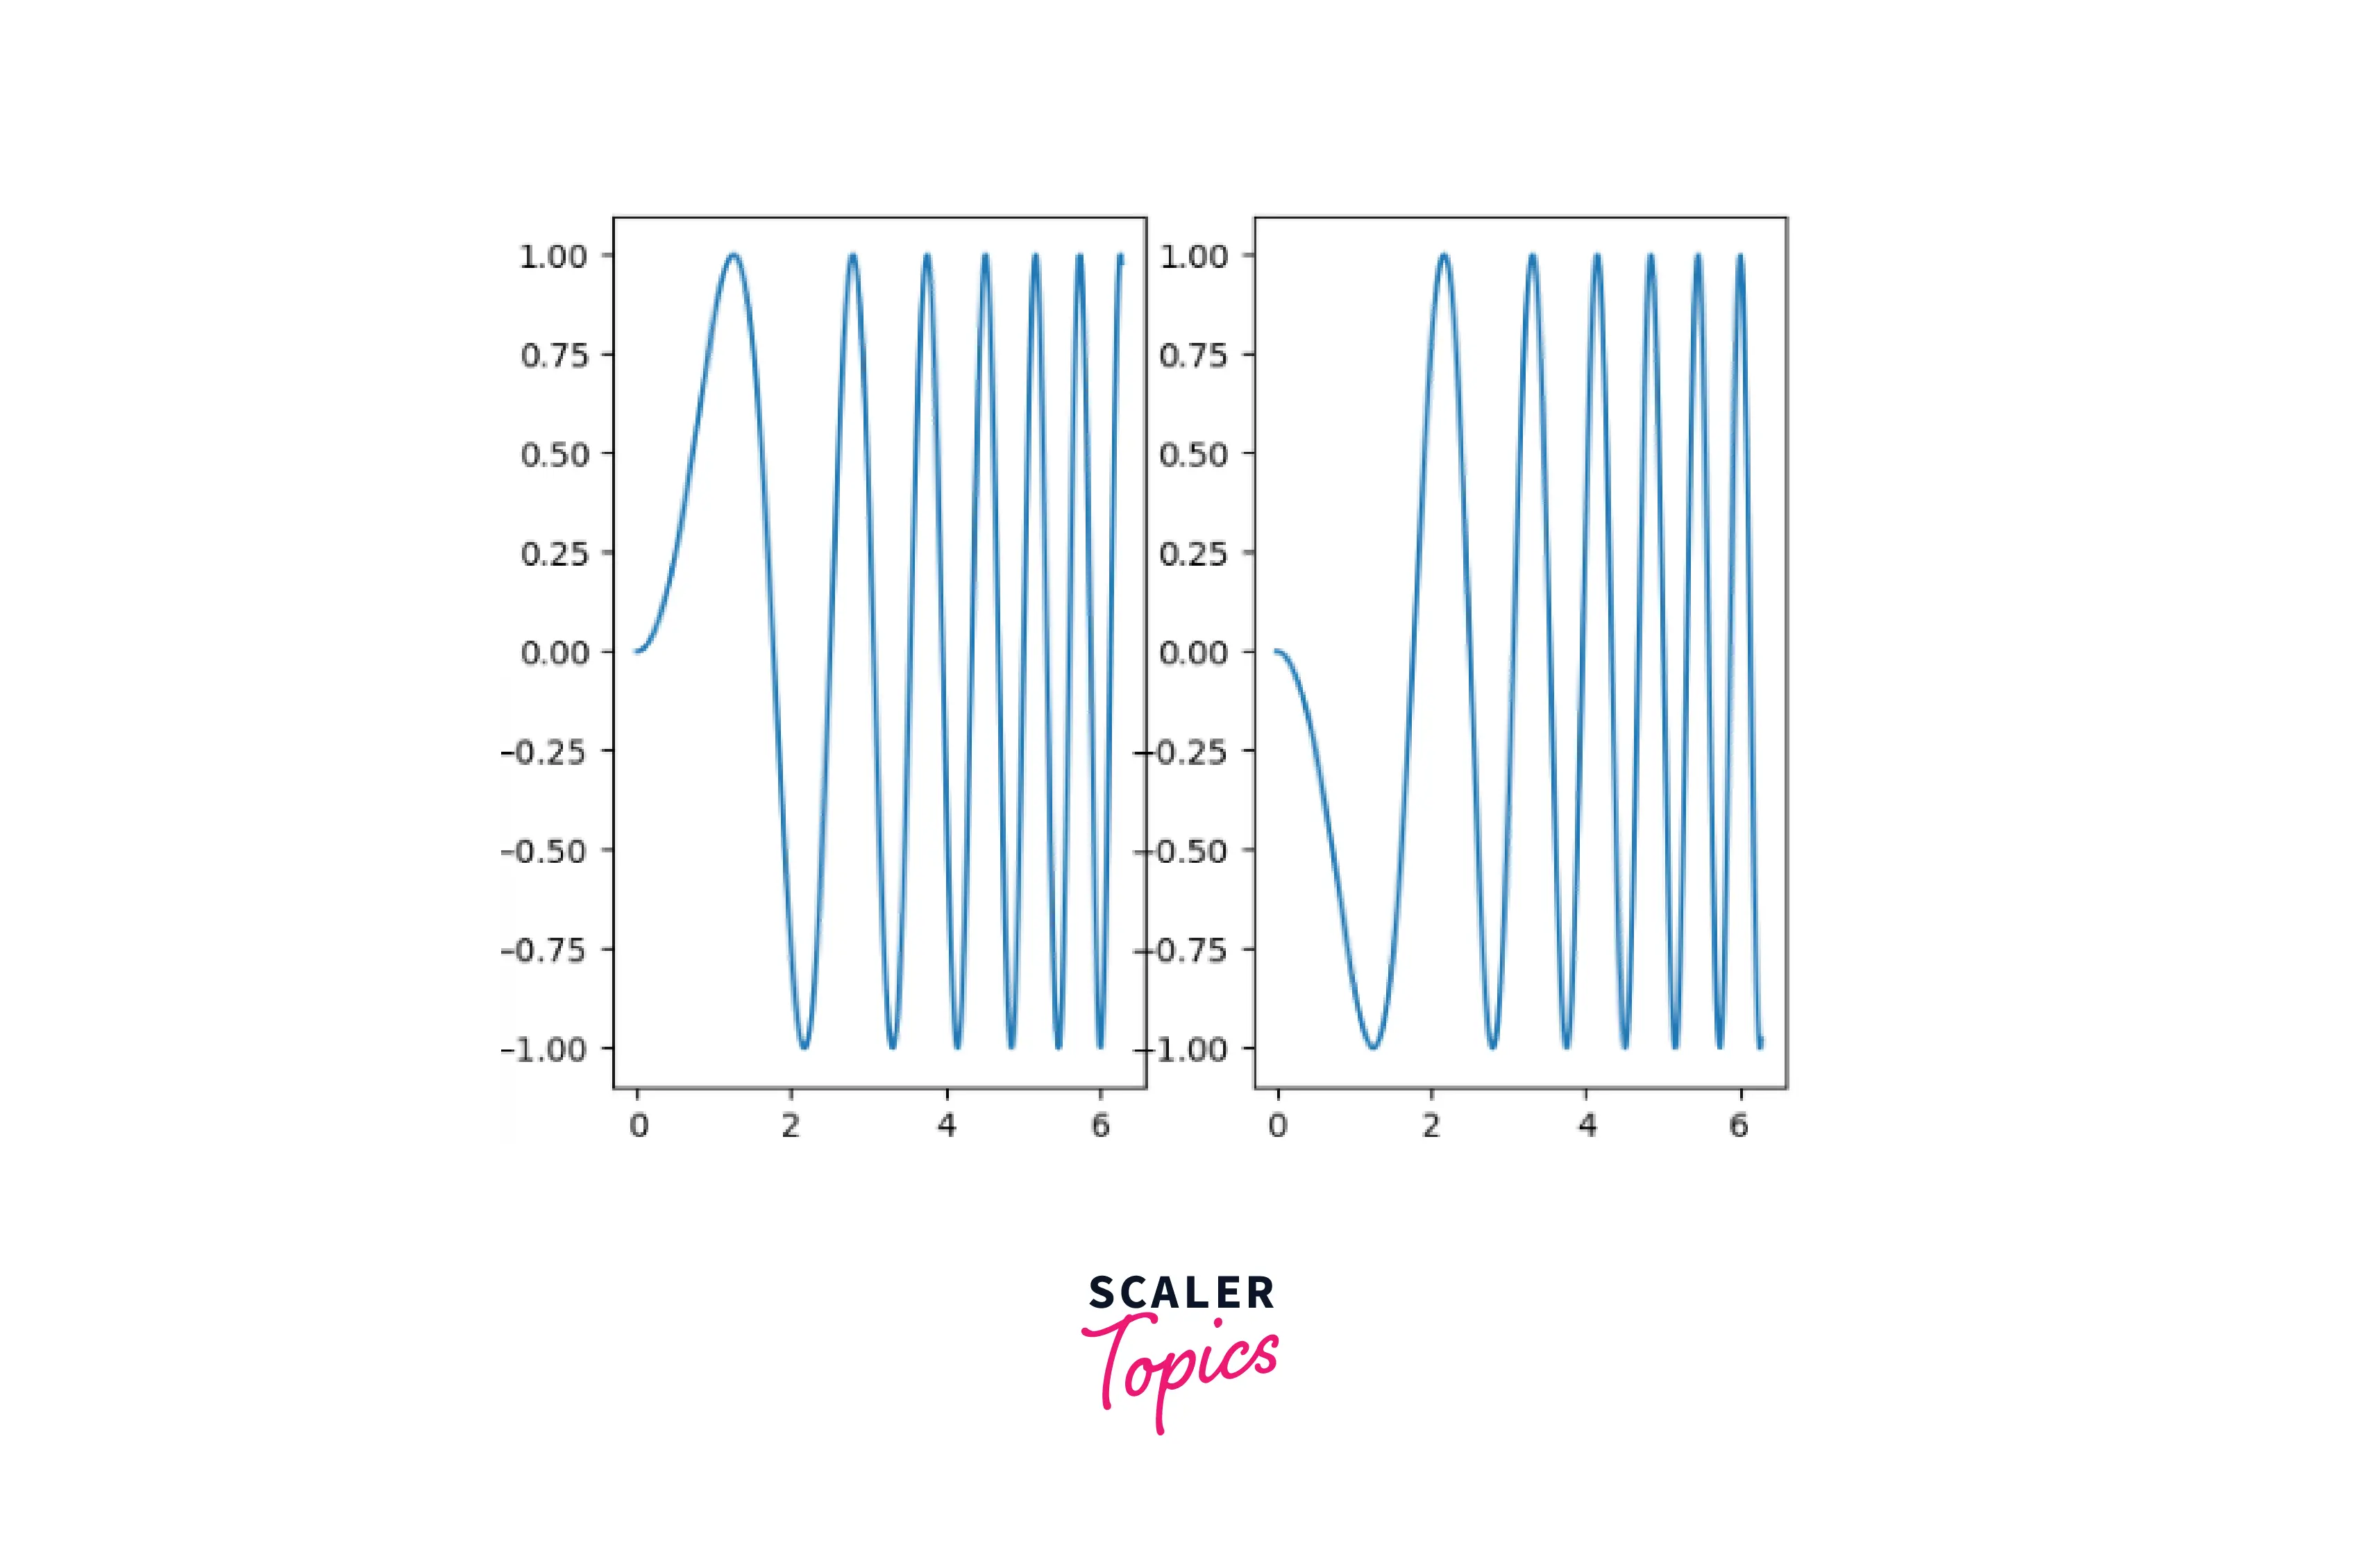
In horizontal stacking, we divide the plot horizontally (which means that we divide the plot into its horizontal components, like vectors).
-
To get horizontal stacks, we need to put the value of subplots() as 1, and 2 (for one row and two columns).
Output:
Sharing Axes in Matplotlib
- Sharing axes in matplotlib helps us to minimize the number of subplots that we use for visualization.
- Subplots make our visualizations better, but a lot of subplots aren't always good. We can always combine plots. However, the axes of both plots won't be the same.
- How to work around this problem? matplotlib has got you covered! We can use the sharex and sharey parameters in plt.subplots() function to tell our compiler that we want our x-axes to be shared.
Note:
This method will not work if the ranges of both axes are different.
-
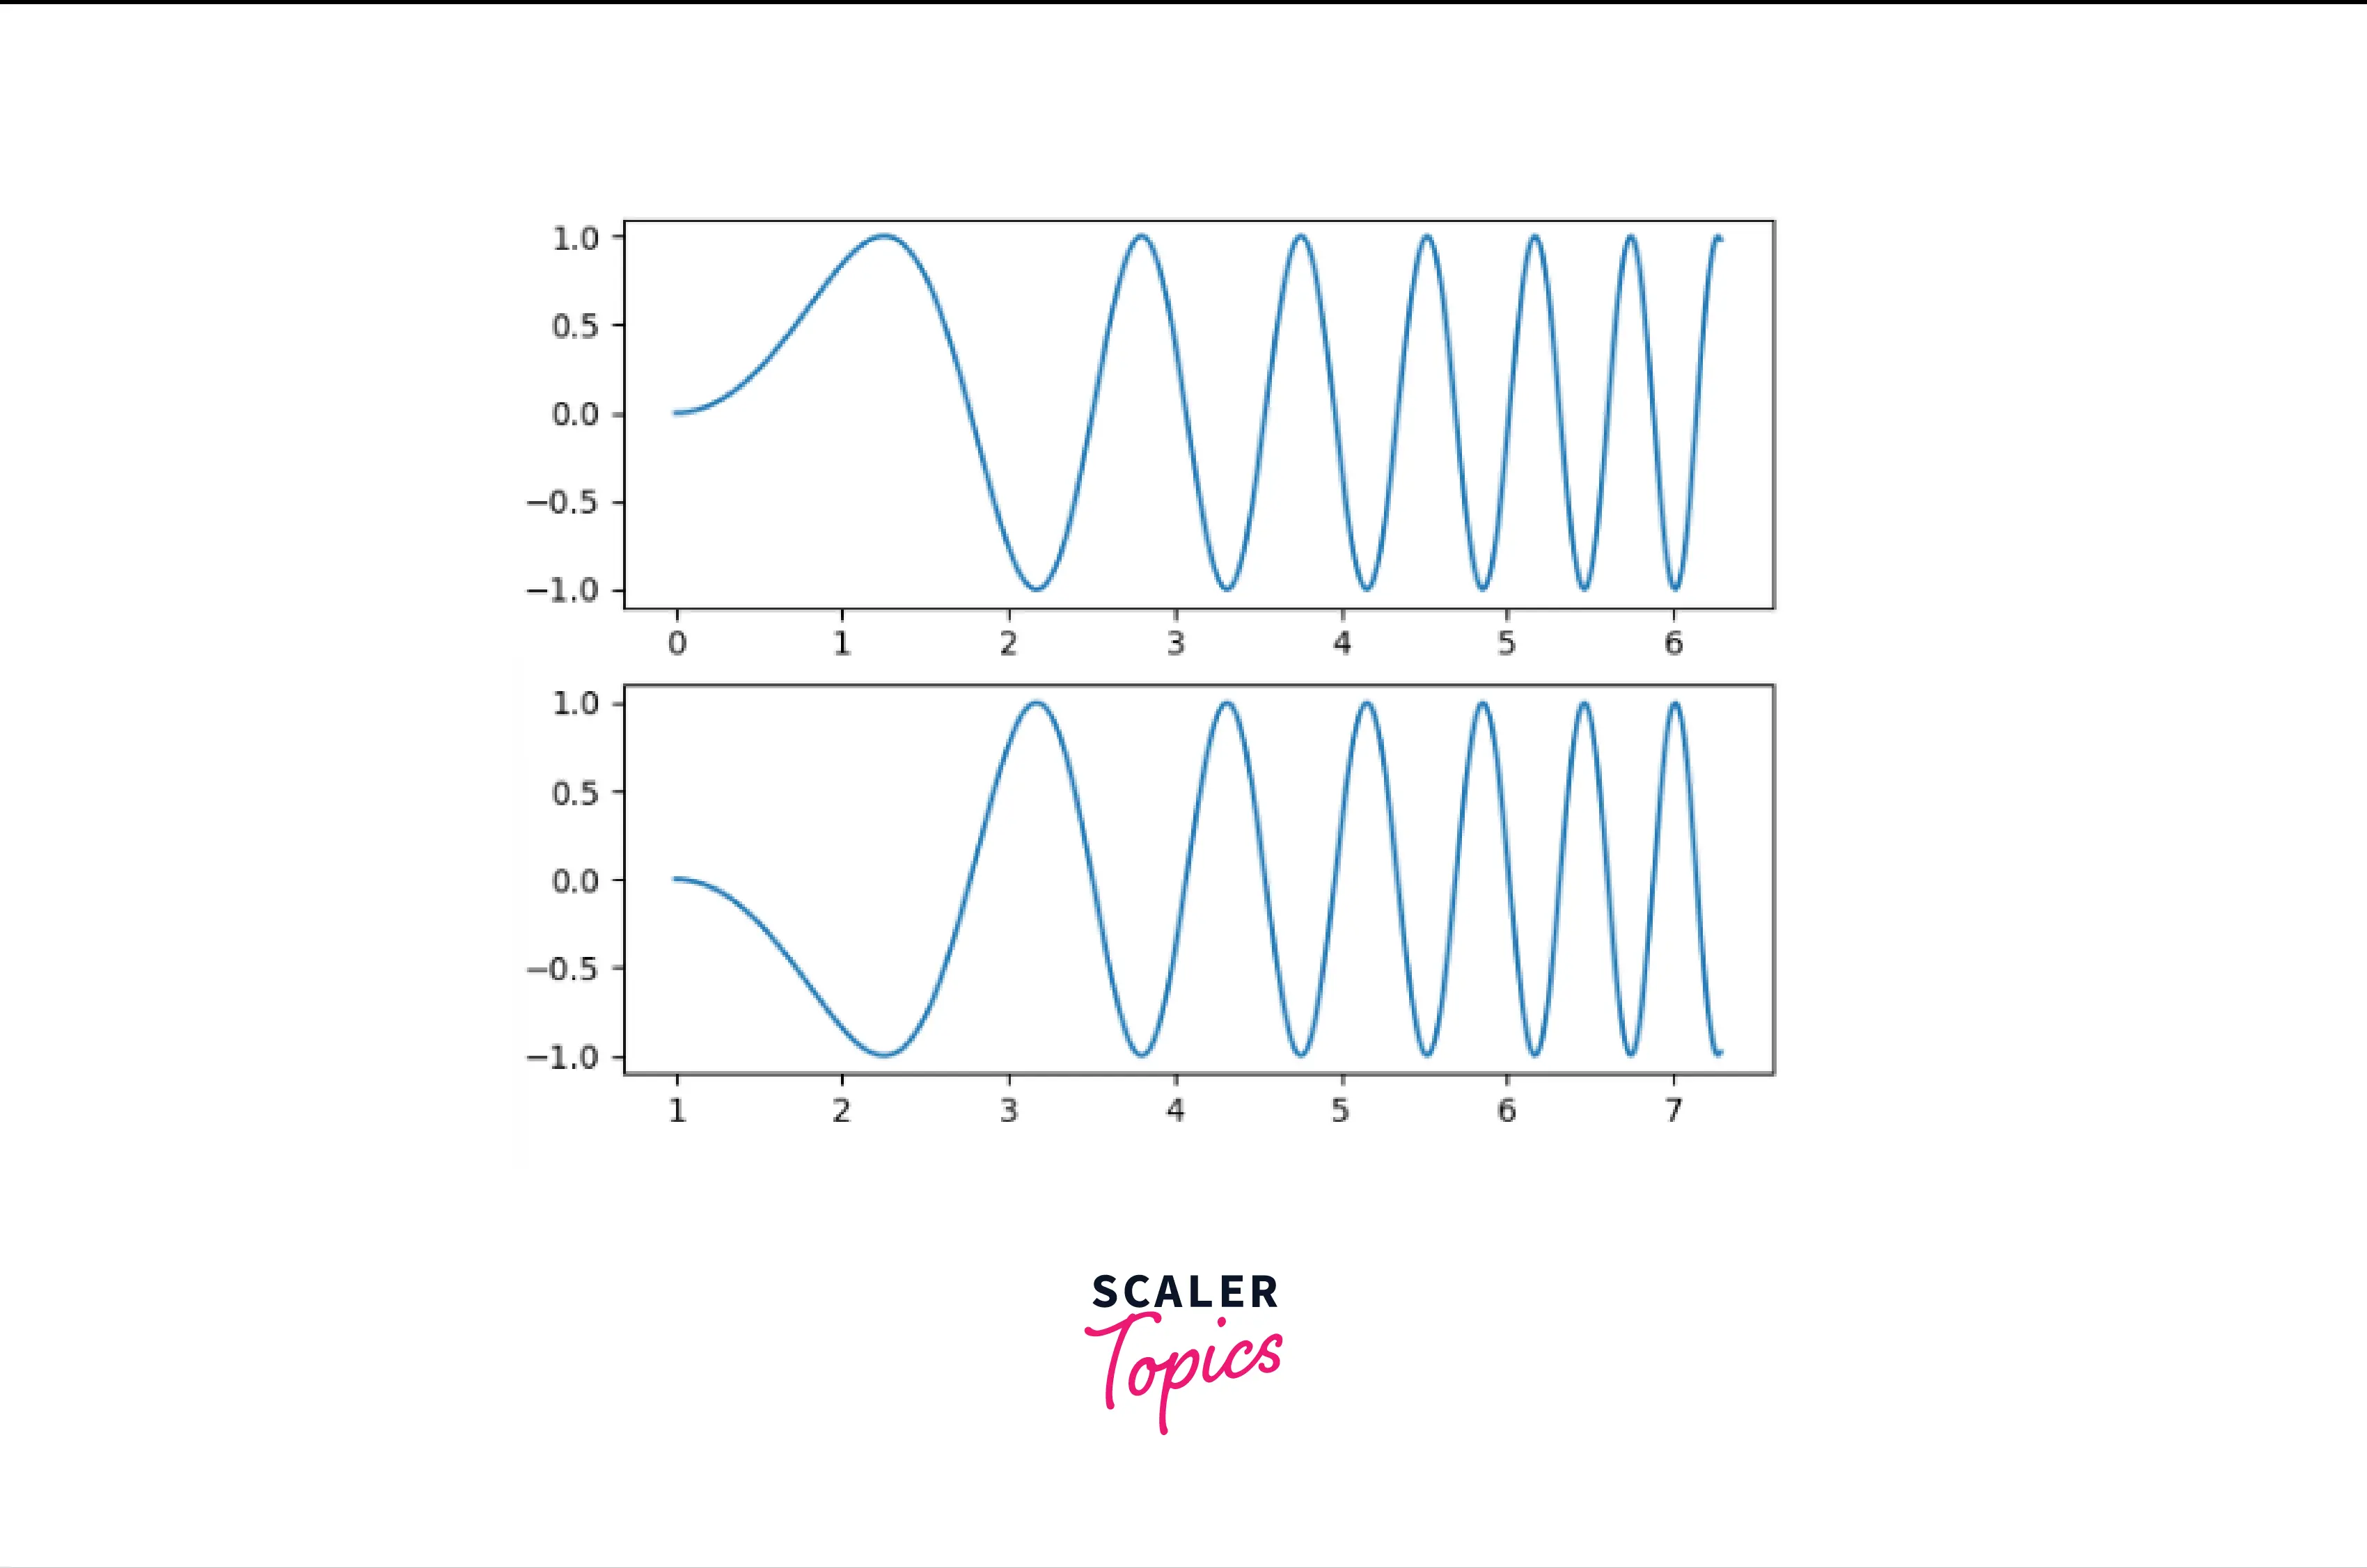
In this example, we will scale the axes individually:
Output:
-
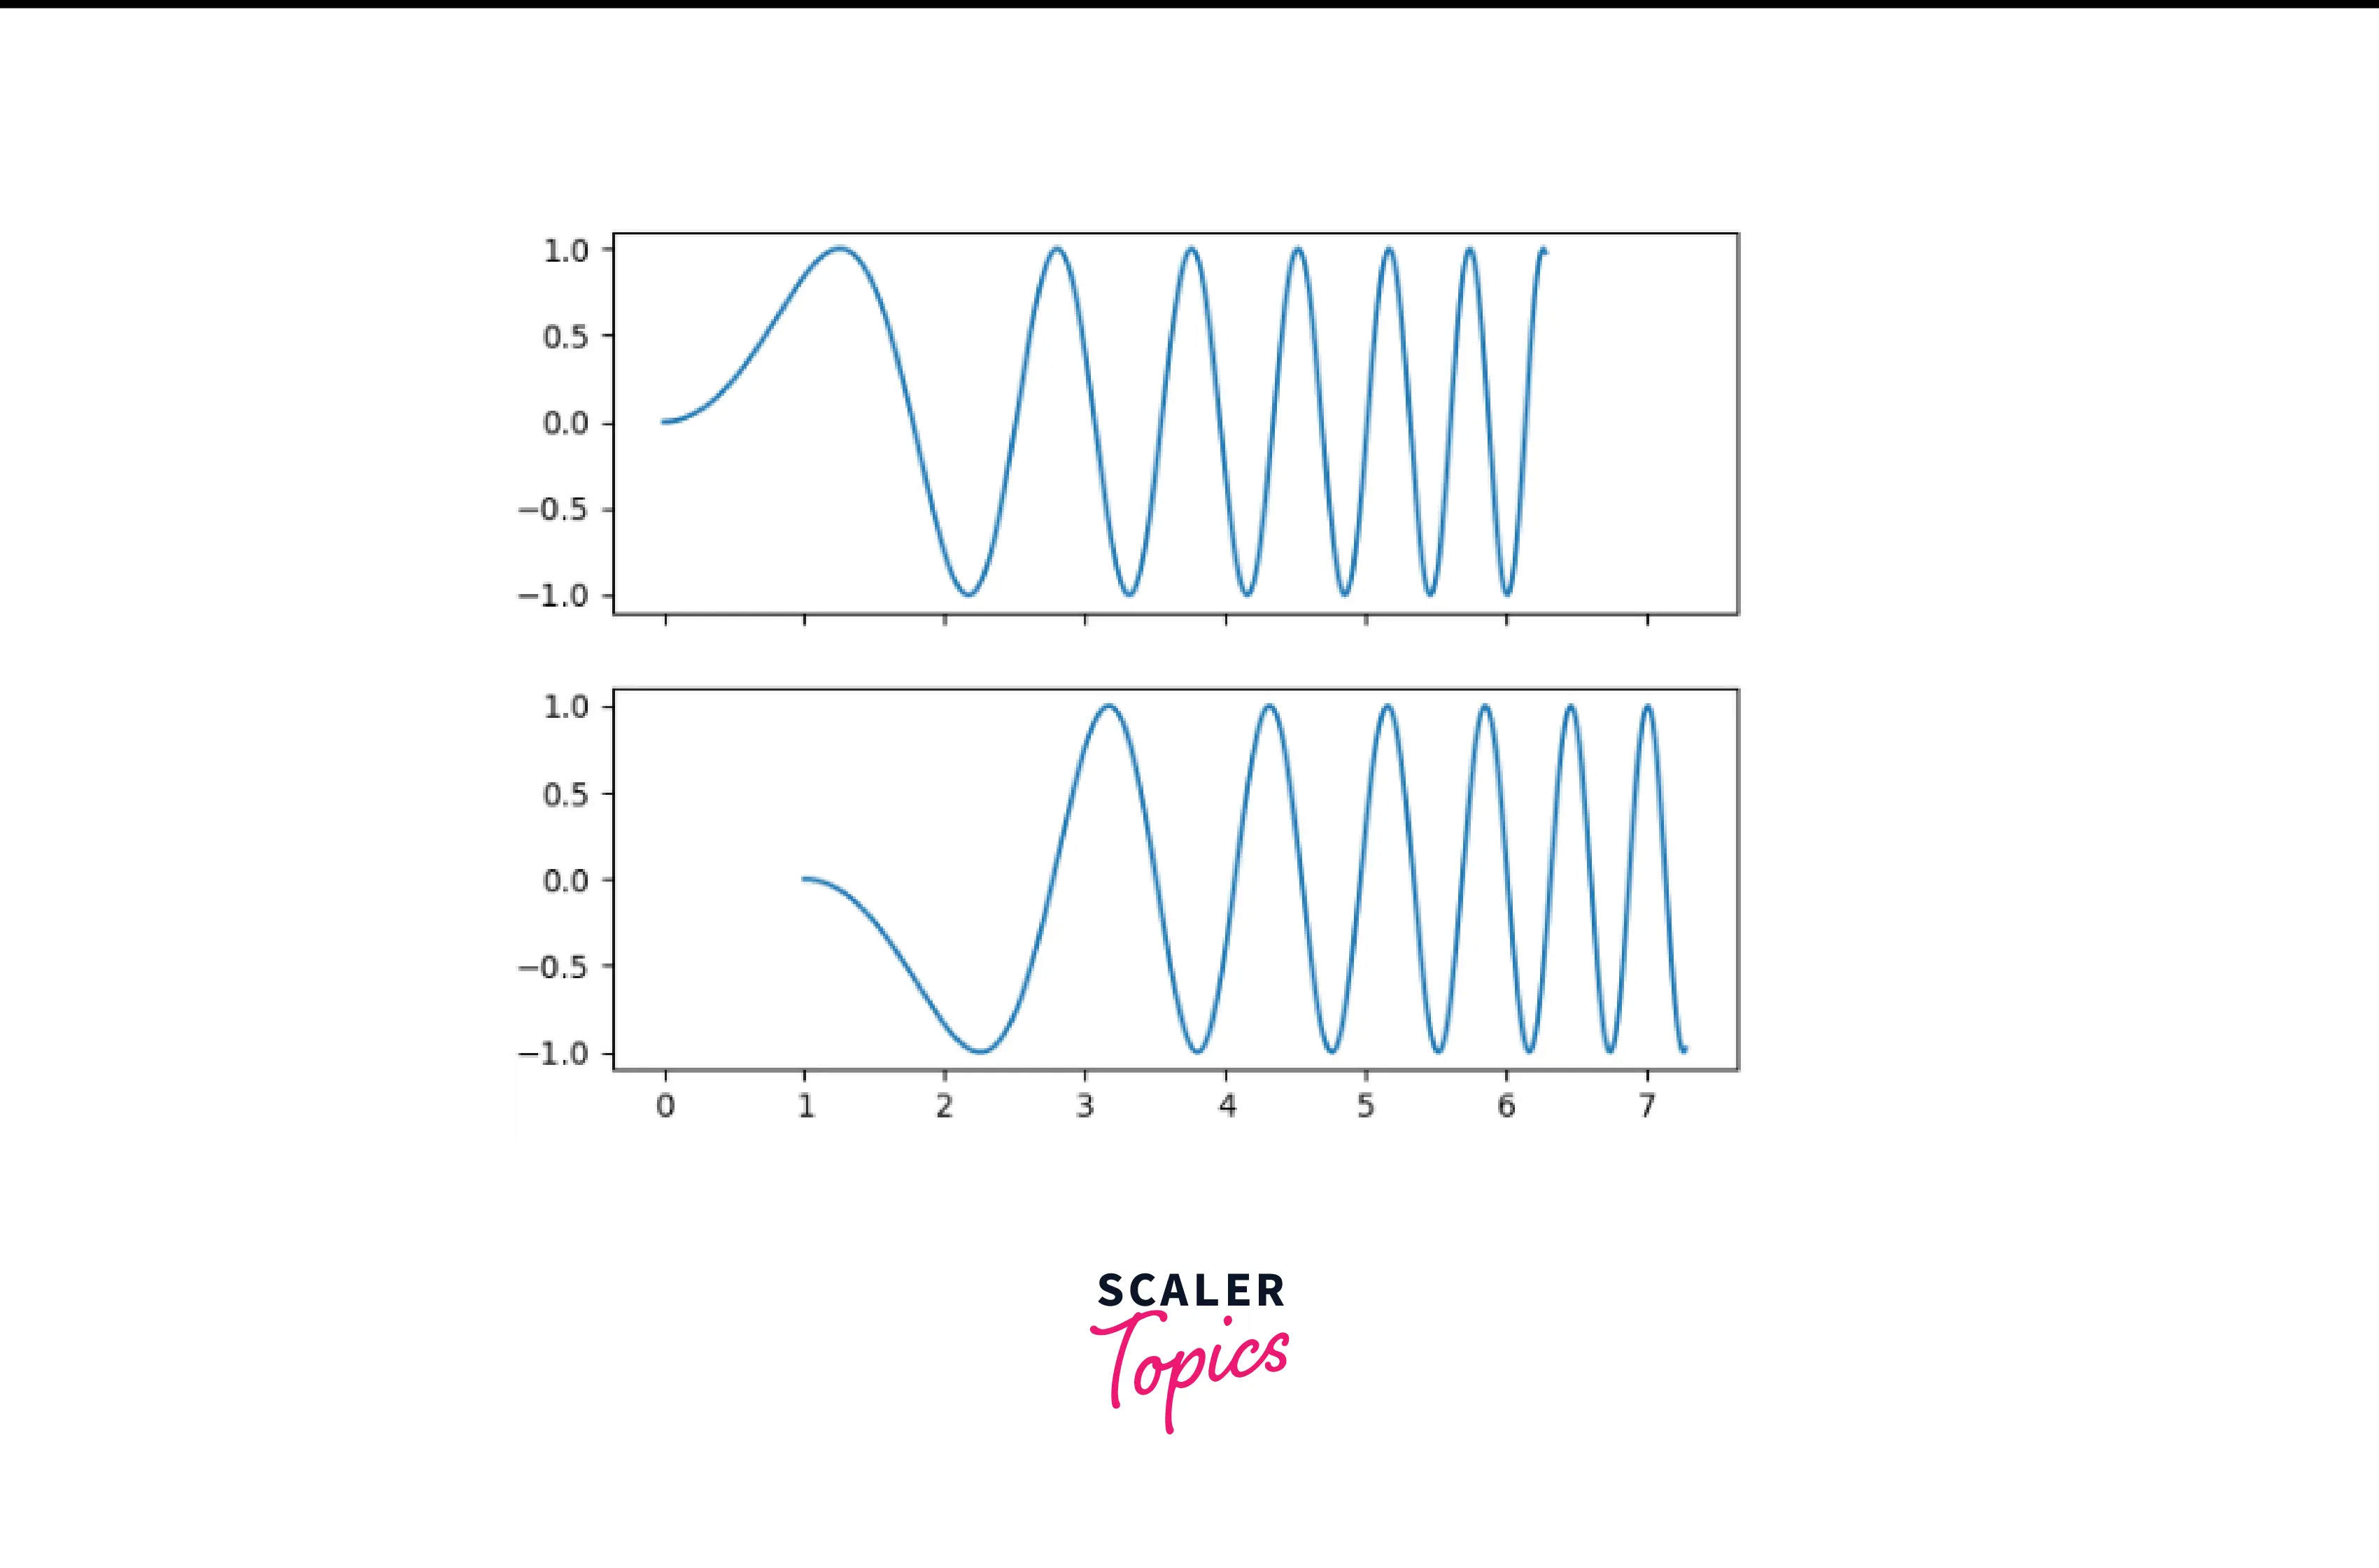
Now, we will use the sharex parameter in plt.subplots() function.
Output:
-
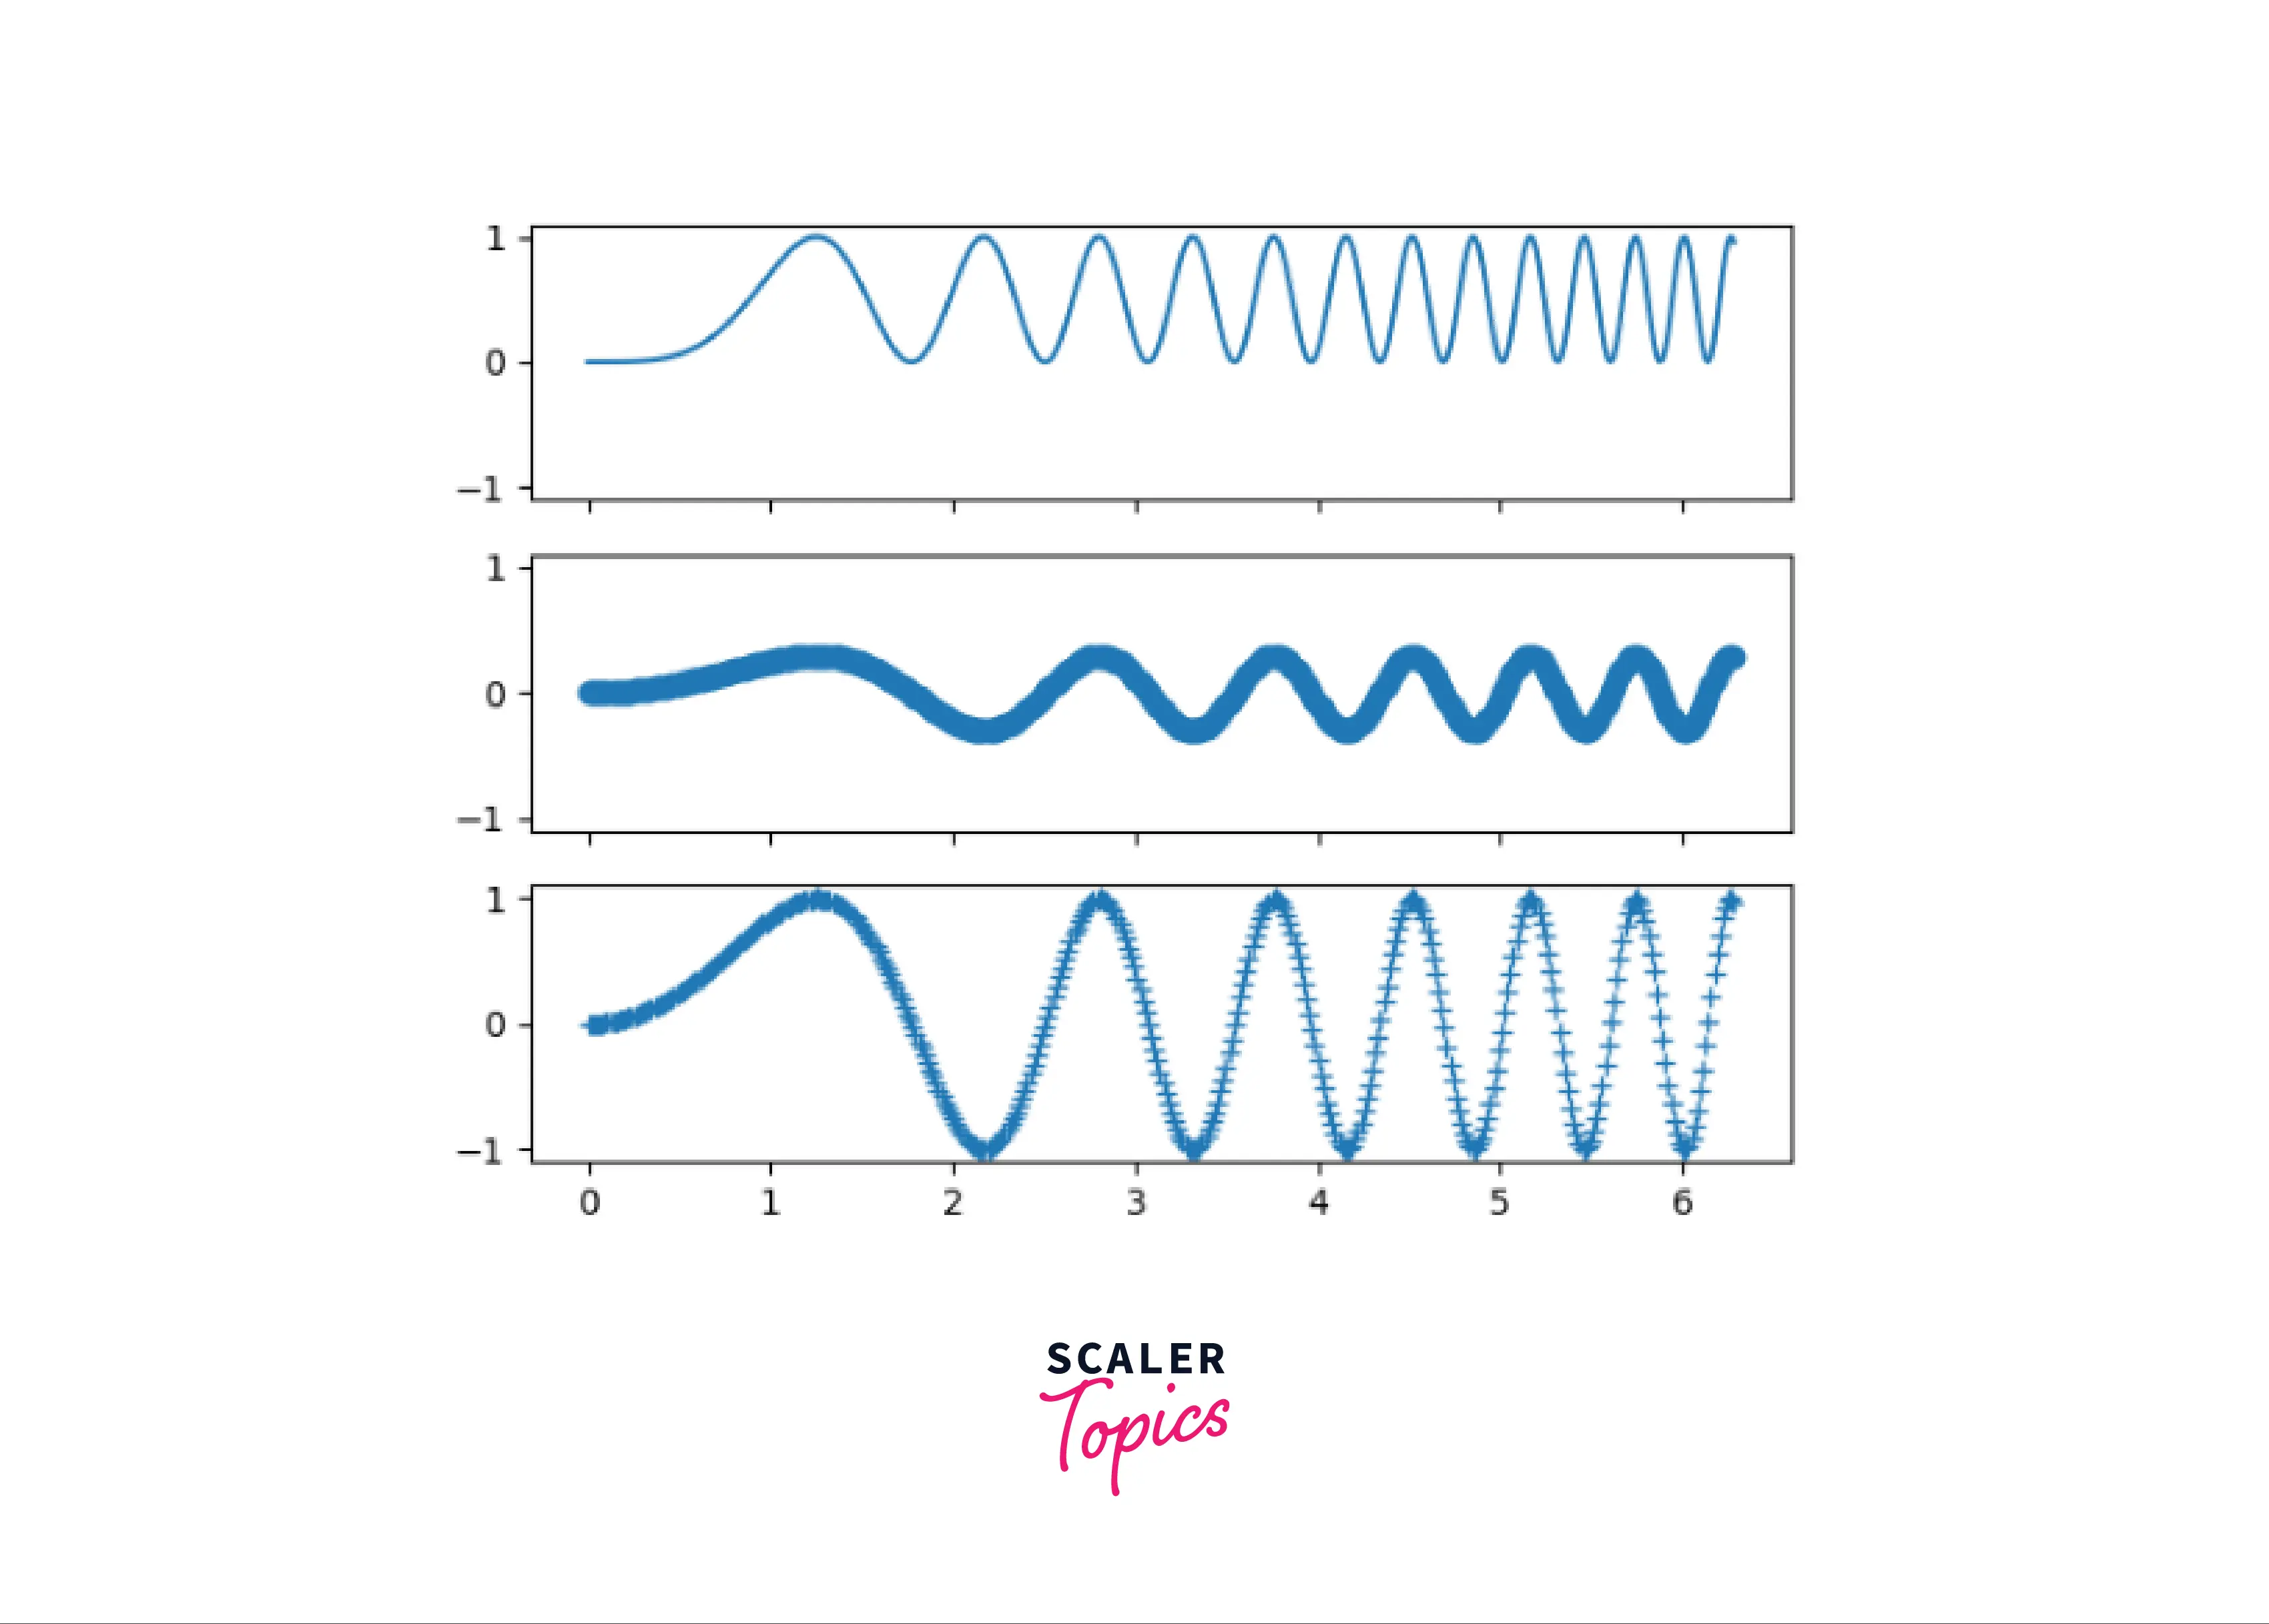
When we use the sharex and sharey parameters together, we share our axes across the plot :
Output:
Polar Axes in Matplotlib
-
Before diving into polar axes in matplotlib, we should first understand what polar coordinates in geometry are.
-
The polar coordinates (represented by r), in terms of cartesian coordinates, are defined by :
-
We can re-create polar coordinates in our axes using the plt.polar() function.
-
The syntax of plt.polar() is :
Parameters:
- Theta: The angle for our curve.
- r : radius.
-
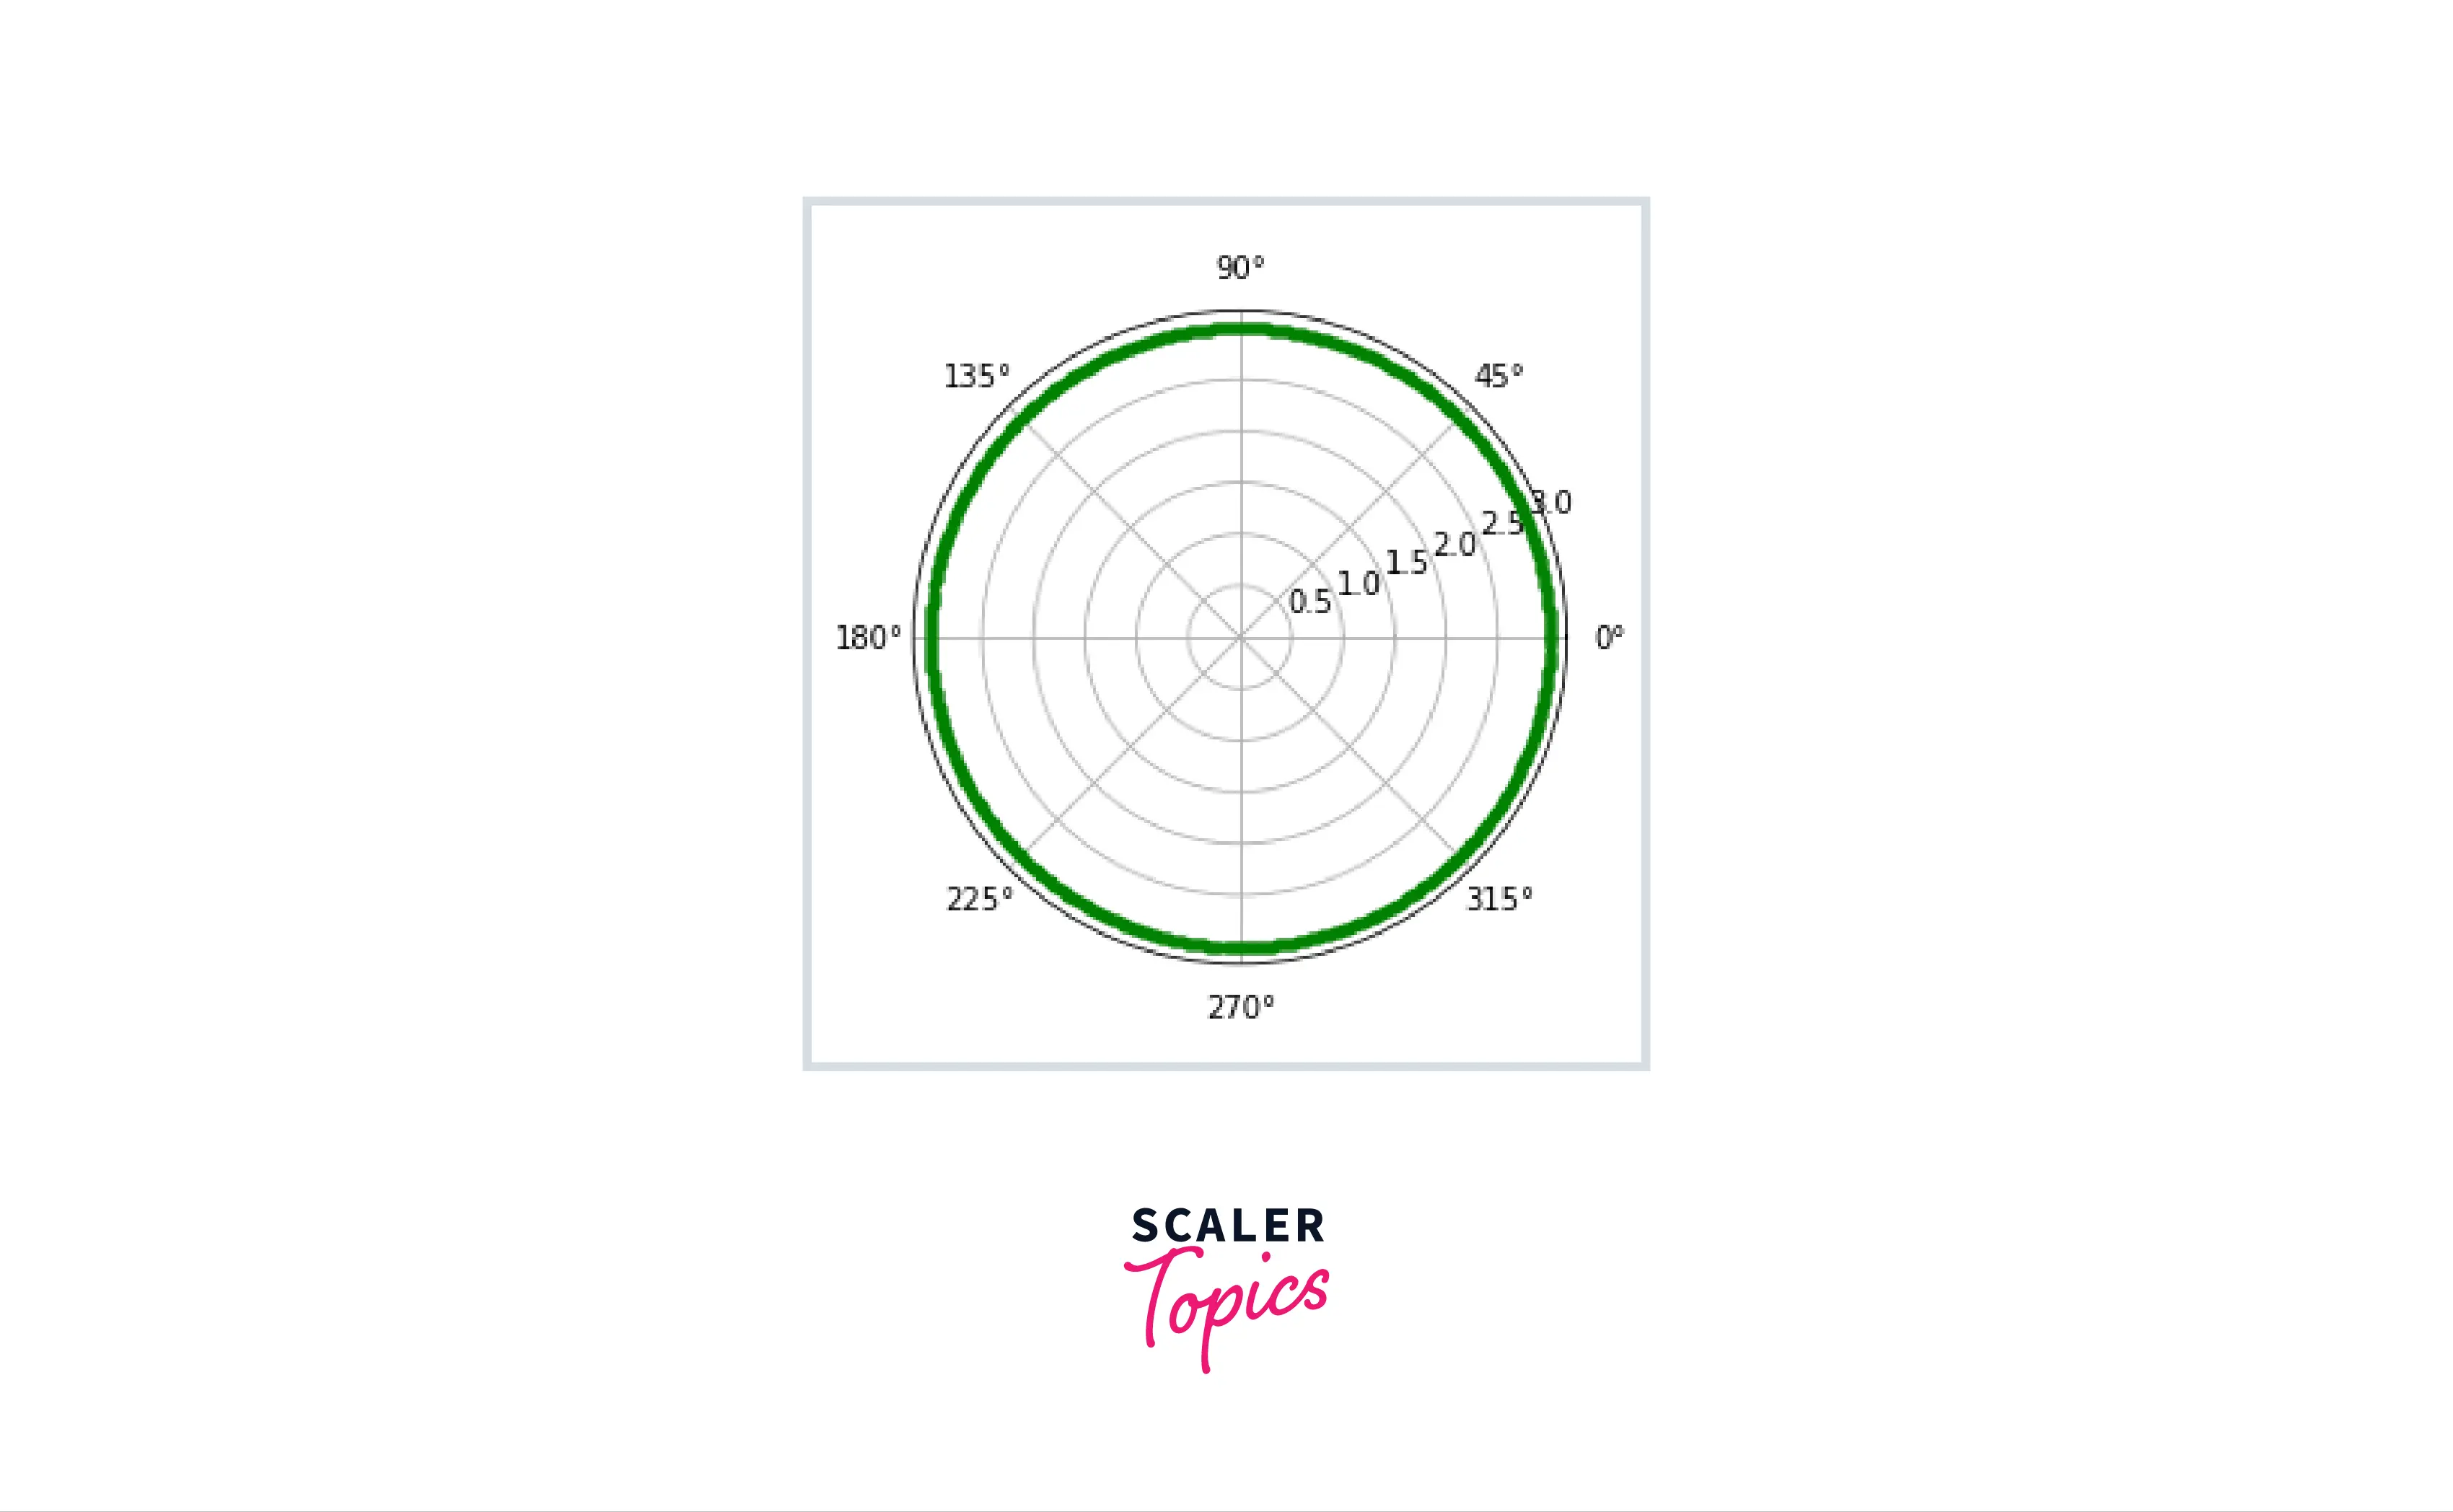
We will try to plot a circle using plt.polar() function :
Output:
-
Using polar axes, we can create plots like an ellipse, cardoid, etc.
How to Combine Multiple Subplots in Matplotlib?
-
Using subplots(), we can combine multiple subplots and make our visualizations look more intuitive!
-
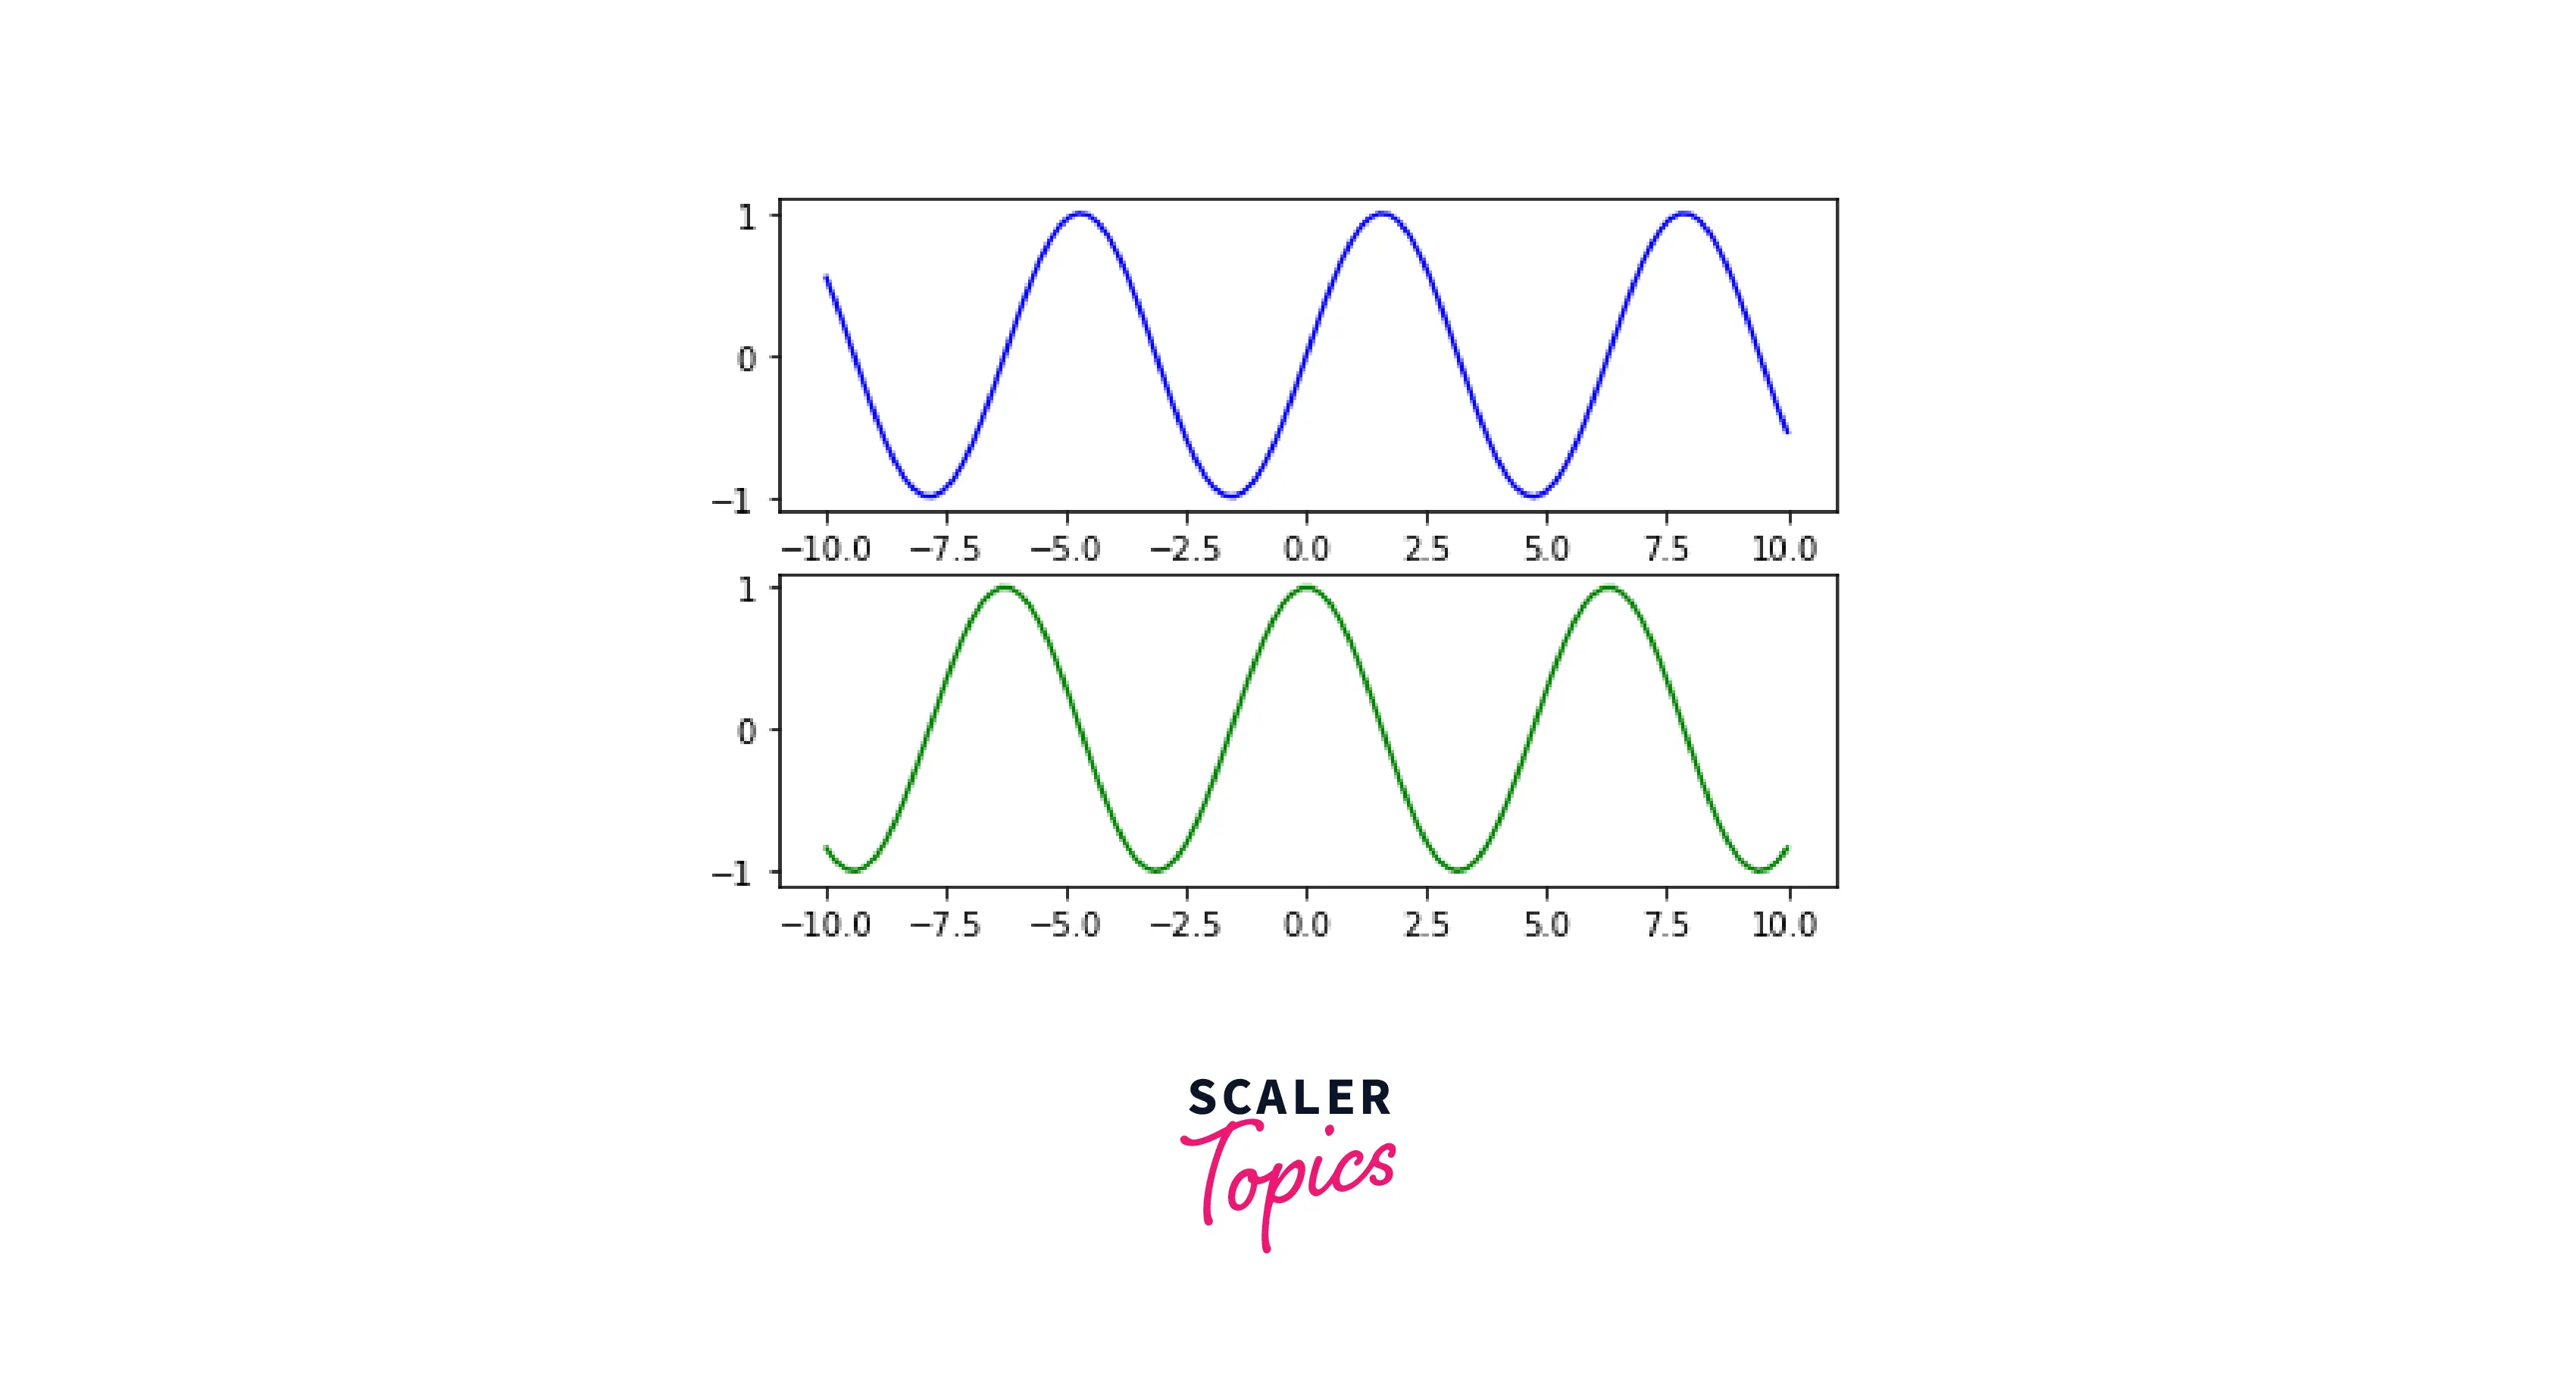
In this example, we will create two separate plots. A sine wave and a cosine wave. We will use the subplots() method to combine them.
Output:
Conclusion
- In this article, we covered what subplots are in matplotlib.
- We went through the process of creating a single subplot, and a stack of subplots.
- Apart from that, we also covered the different features related to subplots like stacking, polar axes, and sharing axes.
- We also covered a few ways to combine multiple subplots in matplotlib.
