Matplotlib Logarithmic Scale
Overview
Matplotlib provides the modules and function to add a logarithmic scale on a figure, and there are two ways to do it. The first method is set_xscale() and set_yscale(). These functions are used when we are in an object-oriented interface. The second method is x_scale() and y_scale(). These functions are used when we are in the pyplot interface. The logarithmic scale is a non-linear scale that shows very large or small values on the graph. It has various applications in fields like geology, forensic science, mathematics, etc.
Introduction
Before going to the logarithmic scale, we must first understand what we mean by logarithm. Log is an alternative way of representing exponential quantities, for example, , which can also be expressed as .
The logarithm scale is a non-linear scale that analyzes an extensive range of values. Instead of equal increments, each interval is increased by a factor of the base of the logarithm. On a linear scale, integers are represented on the axes, increasing as we move ahead. If we plot coordinates with some value like 1, 2, or maybe 100, that can be easily represented on a linear scale. What about if we plot the population of all countries on a graph or may be dealing with some exponential equation? In that case, a linear scale would be impractical. Instead, we have to use a logarithmic scale in which one axis represents a consistent integer increment and another, the logarithmic scale, represents an increment in the power of 10.
What are Logarithms in Matplotlib?
Logarithms in matplotlib are used to scale the axes according to the given data. When we plot large or small numbers without scaling the axes, data may squeeze too closely or not be covered in a graph. For visualization of these types of data, we use logarithmic scale in matplotlib to scale the axes according to the data.
When Would You Use a Logarithmic Scale?
The logarithmic scale is used when we plot large values on a graph. Such data cannot be plotted on a plane having axes of equal increment (linear scale).
A logarithmic scale in which one axis has the value in a regular interval, and the other axis has values incrementing at the power of 10 is used to plot larger values in mathematics.
When we deal with the exponential function, we use the logarithmic scale, also in forensic science when we study exponential decay, and in geology to measure the seismic activity of earthquakes on the Richter scale.
Syntax of Logarithmic Scale in Matplotlib in Different Interface
Logarithmic Scale on Pyplot Interface
In the pyplot interface, we can use the functions xscale() and yscale() to add a logarithmic scale on the axes. But, first, we will discuss the syntax and parameters of these functions.
Syntax of xscale() method
xscale() method is used to scale the x-axis like linear, log, symlog, logit, etc
matplotlib.pyplot.xscale(value, **kwargs)
Parameters:
-
Value: it is used to set the scale {linear,log,symlog,logit, ...}
-
kwargs: Different keyword arguments are accepted, depending on the scale (matplotlib.scale.LinearScale, LogScale, SymmetricalLogScale, LogitScale)
Syntax of yscale method
yscale() method is used to scale the y-axis like linear, log, symlog, logit, etc
matplotlib.pyplot.yscale(value, **kwargs)
Parameters:
-
Value: it is used to set the scale {linear,log,symlog,logit, ...}
-
kwargs: Different keyword arguments are accepted, depending on the scale (matplotlib.scale.LinearScale, LogScale, SymmetricalLogScale, LogitScale)
Logarithmic Scale on Object-Oriented Interface in Matplotlib
If we use the object-oriented interface in matplotlib, like for plotting the data, we create a figure and then add subplots to it, then we should use the functions set_xscale() and set_yscale() to change the scale of the axes to logarithmic. We will discuss the syntax and parameters of these parameters.
Syntax of set_xscale() method matplotlib.axes.Axes.set_xscale(value, **kwargs)
Parameters:
-
Value: it is used to set the scale {linear,log,symlog,logit, ...}
-
kwargs: Different keyword arguments are accepted, depending on the scale (matplotlib.scale.LinearScale, LogScale, SymmetricalLogScale, LogitScale)
Syntax of set_yscale() method matplotlib.axes.Axes.set_yscale(value, **kwargs)
-
value: it is used to set the scale {linear,log,symlog,logit, ...}
-
kwargs: Different keyword arguments are accepted, depending on the scale (matplotlib.scale.LinearScale, LogScale, SymmetricalLogScale, LogitScale)
How to Plot Logarithmic Axes in Matplotlib?
In the pyplot interface, by using the functions xscale() and yscale(), we can change the scale of the X and Y axis to logarithmic.
Example: Logarithmic axes in matplotlib
Output:

Examples
Example 1: Setting log scale on x-axis
In this example, we will understand how we can change the scale of the axis from scaler to linear on the x-axis.
Output:

Example 2: Setting log scale on the y-axis
In this example, we will understand how we can change the scale of the axis from scaler to linear on the y-axis.
Output:

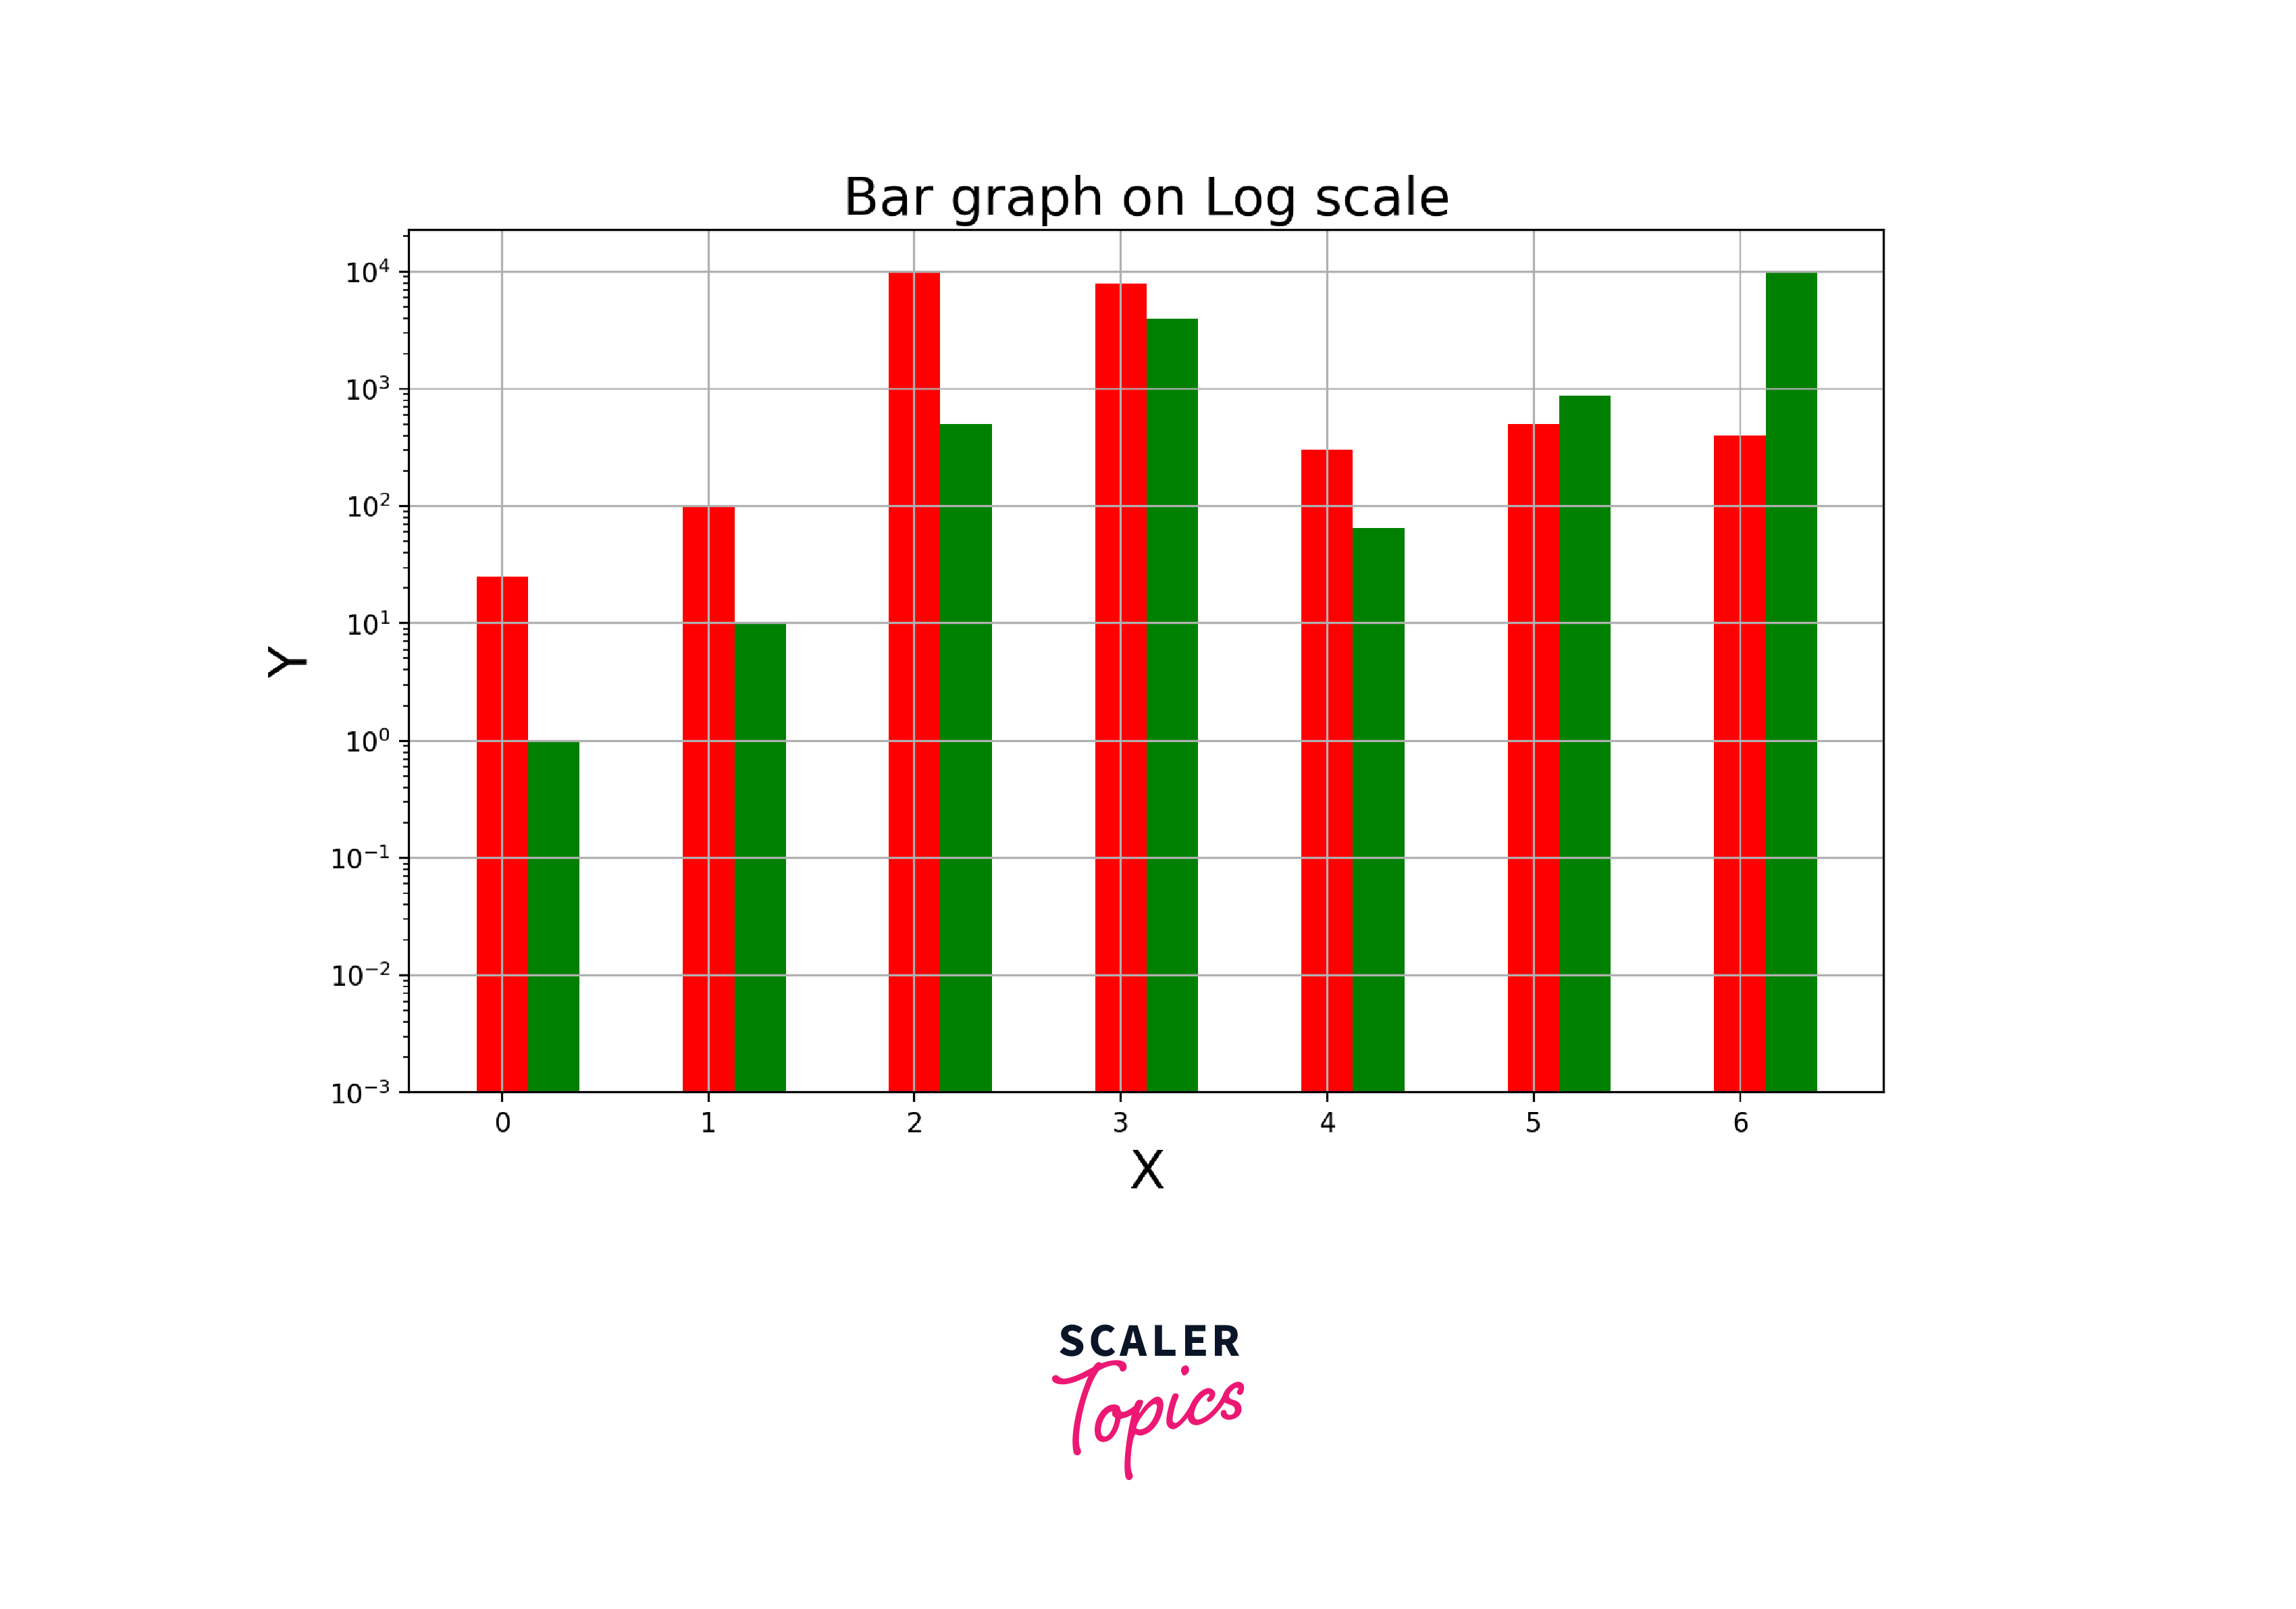
Example 3: Bar graph on logarithmic scale
This example will explain implementing a bar graph on a logarithmic scale.
Output:

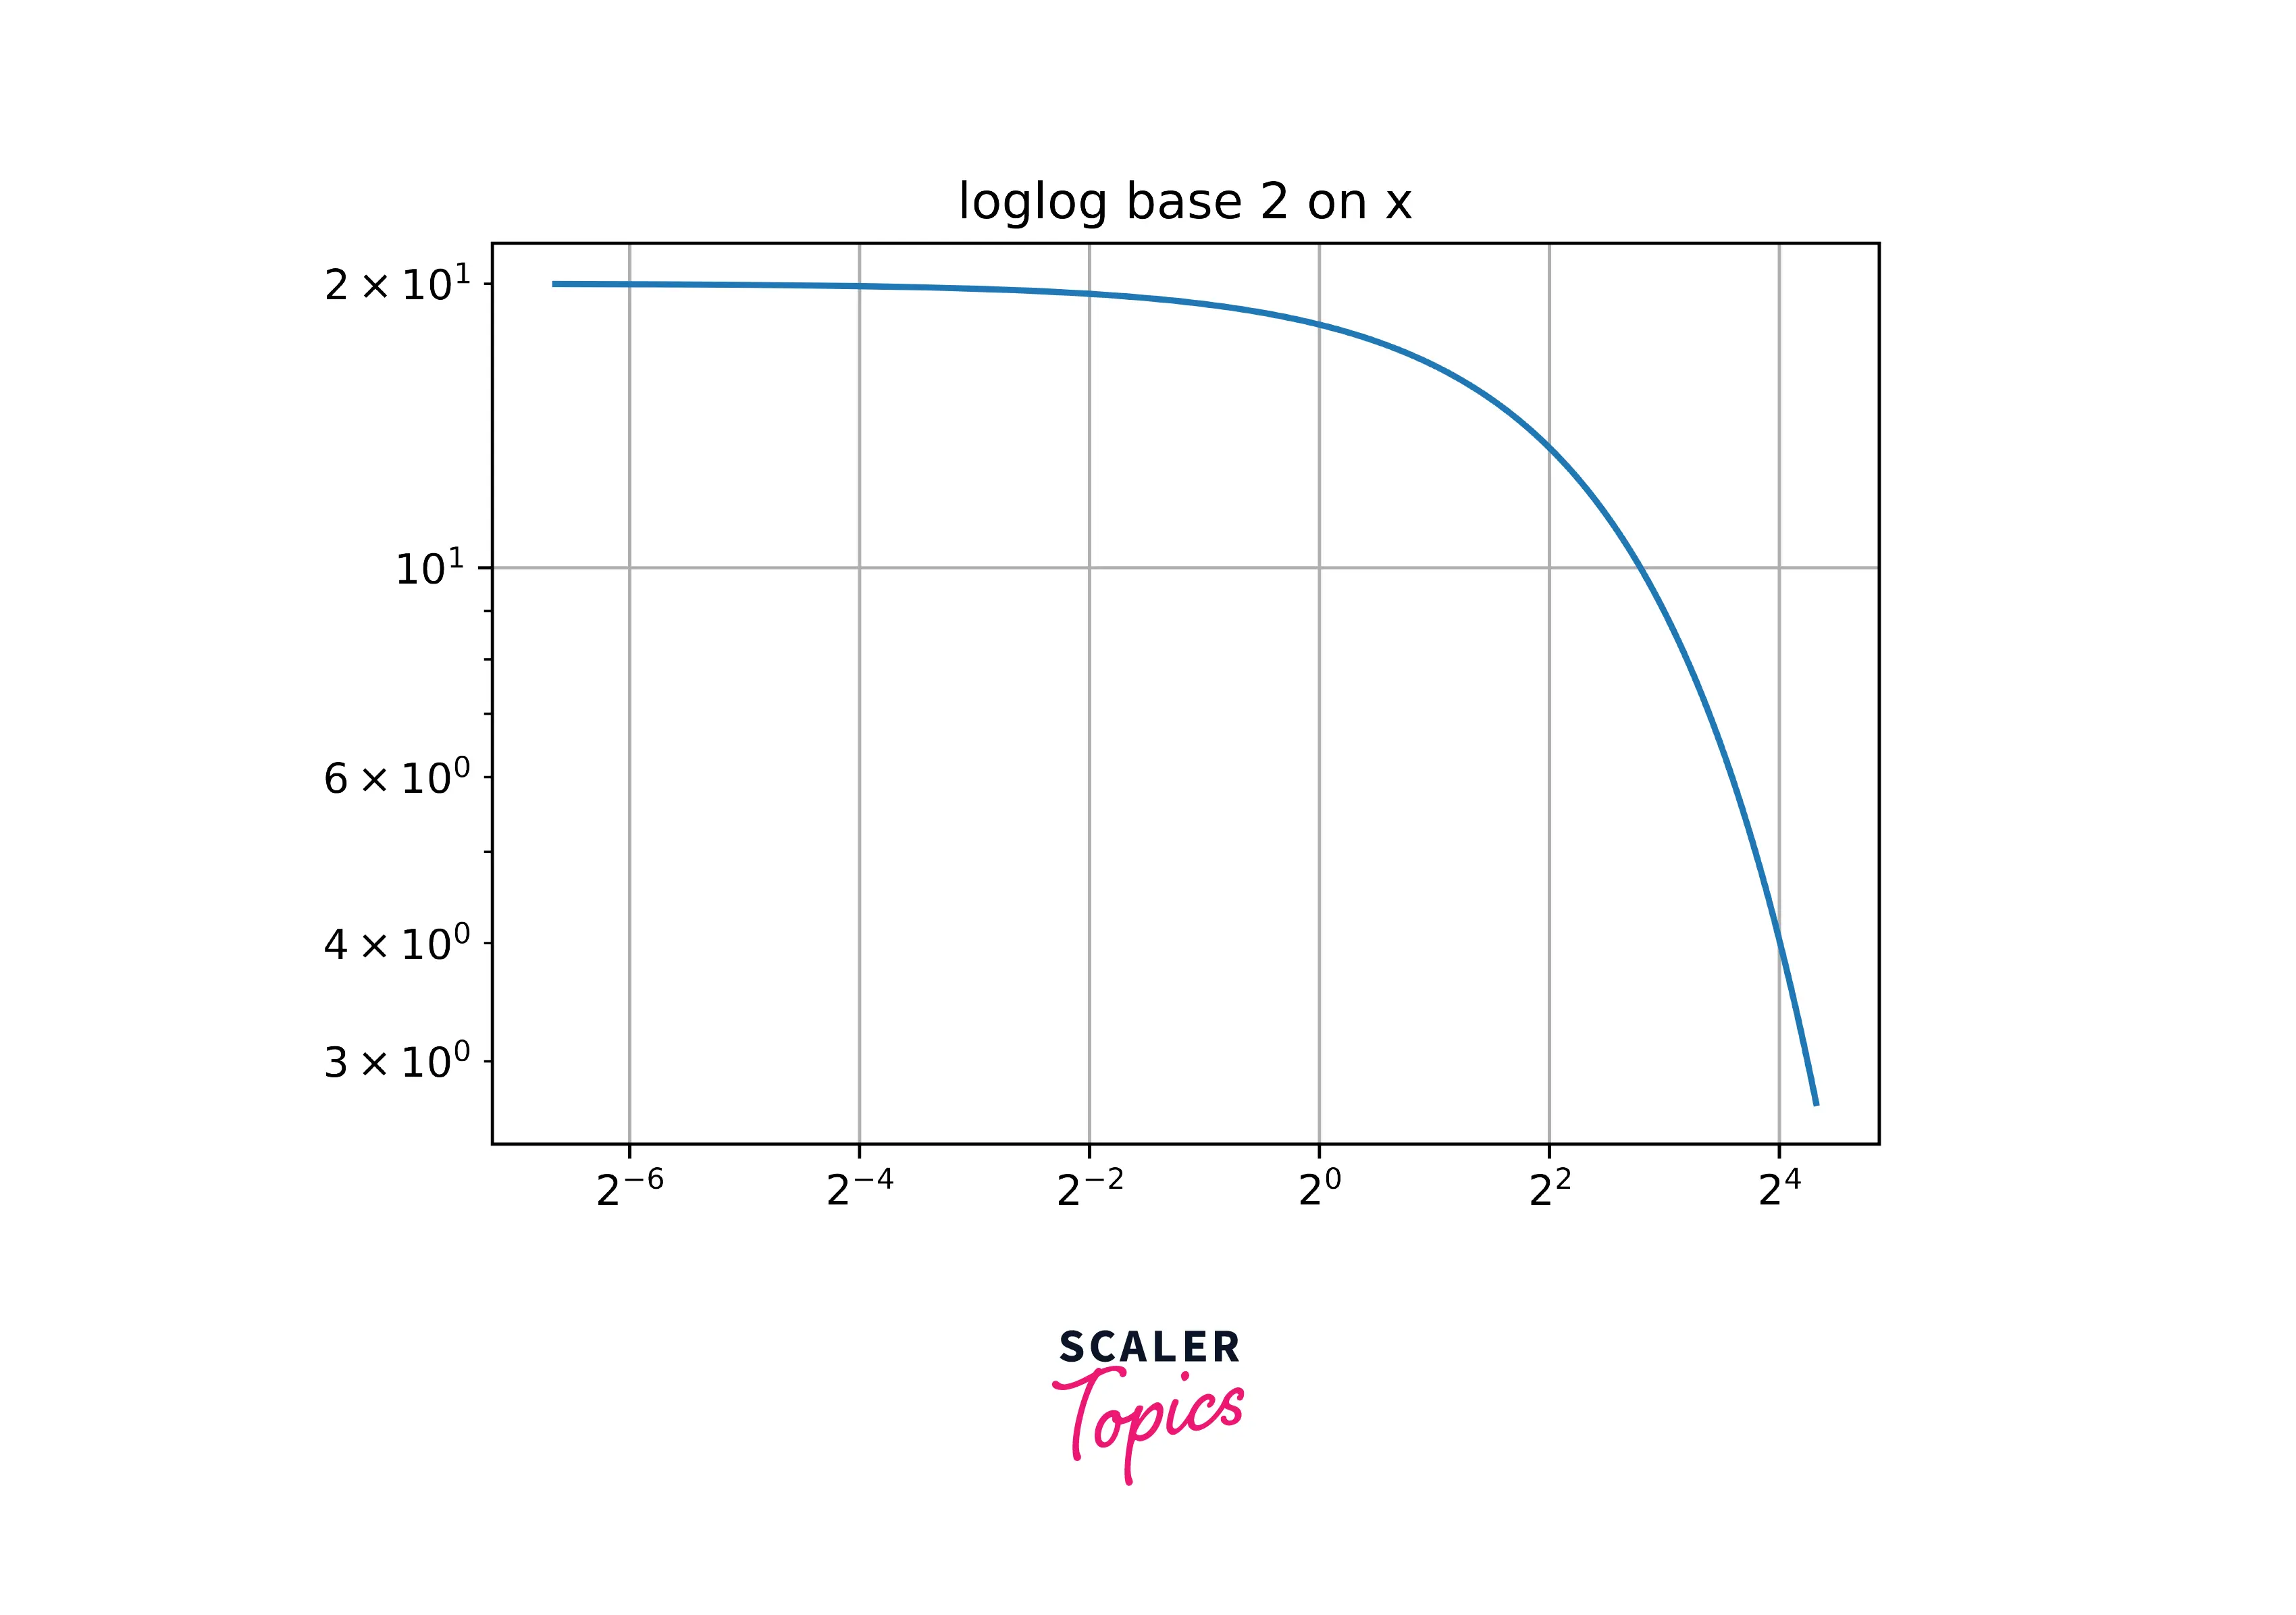
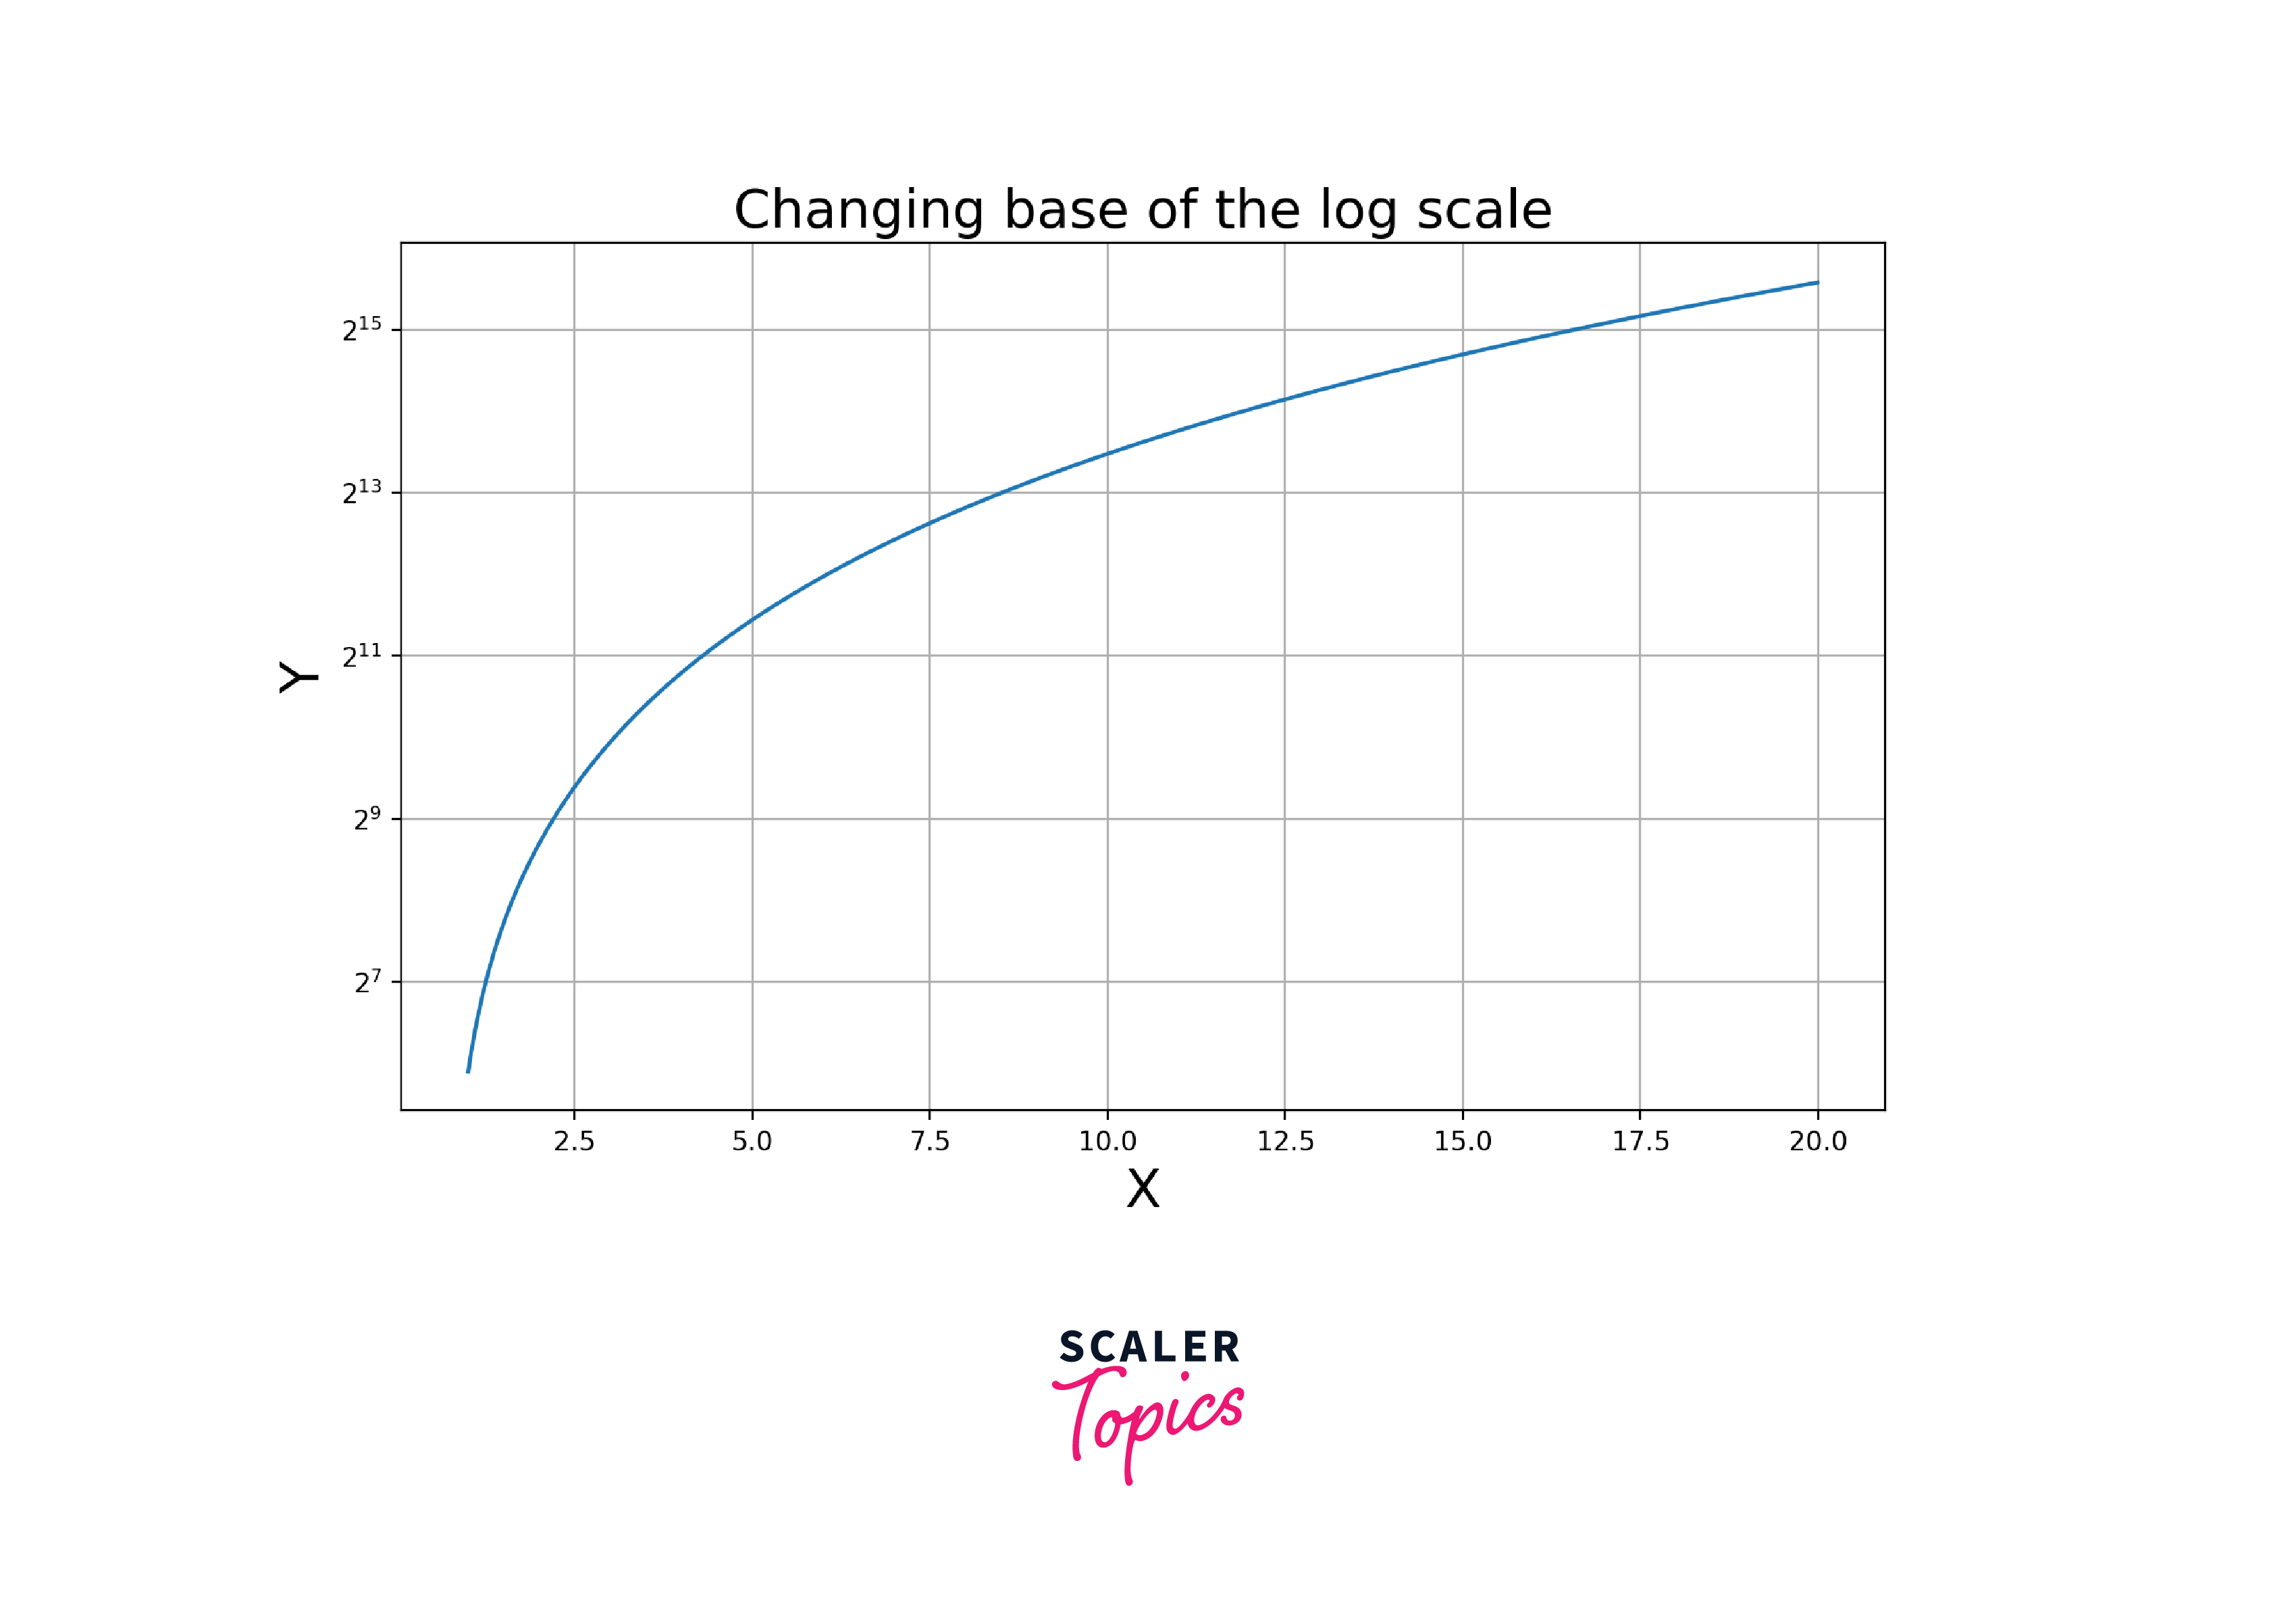
Example 4: Changing the base of the logarithmic scale
When dealing with the logarithms, setting the ticks to the base 10 is not important. However, for accuracy and a better understanding of the plot, we can change the base of the logarithm. Below is how we can change the base of the logarithmic scale.
Output:

Conclusion
-
Logarithmic scale efficiently visualizes a graph's very large or small values.
-
Logarithmic scale is non-linear.
-
It is used to visualize the exponential function on a graph.
-
xscale() and yscale() are the methods for changing the scaling of the axes in matplotlib.
