How to Add Lines on a Figure in Matplotlib?
Overview
Matplotlib provides the libraries and function to plot lines on a figure, and there are two ways to do it. First, use the module matplotlib.pyplot and matplotlib.lines. We need a list of x and y data points in both methods to graph a matplotlib line plot. We can also change the property of the plotted line, like color, line style, line width, marker, marker size, marker edge, etc. We will also discuss horizontal and vertical lines in matplotlib which can be plotted using the functions matplotlib.pyplot.axhline() and matplotlib.pyplot.axvline(), respectively.
How to Add Lines on a Figure in Matplotlib?
In Matplotlib, we can plot different graphs like matplotlib line plots, scatter plots, bar plots, histogram and contour plots, etc. But How do we add a line on a figure in matplotlib, like adding a line generated from a linear equation of two variables or a line plotted using two coordinates (x1,y1) and (x2,y2)? Well, there are two methods that we are going to discuss to add lines on a figure first, by using line plot in matplotlib and second, using the module matplotlib.lines.
Adding Lines on a Figure Using pyplot in Matplotlib
Matplotlib line plot displays the sequenced data points called markers connected by straight line segments. For plotting a line plot in matplotlib, we need pyplot module. matplotlib.pyplot.plot() function is used to graph line plots and lines in matplotlib.
Syntax of matplotlib.pyplot.plot()
Example1: matplotlib line plot
Output:

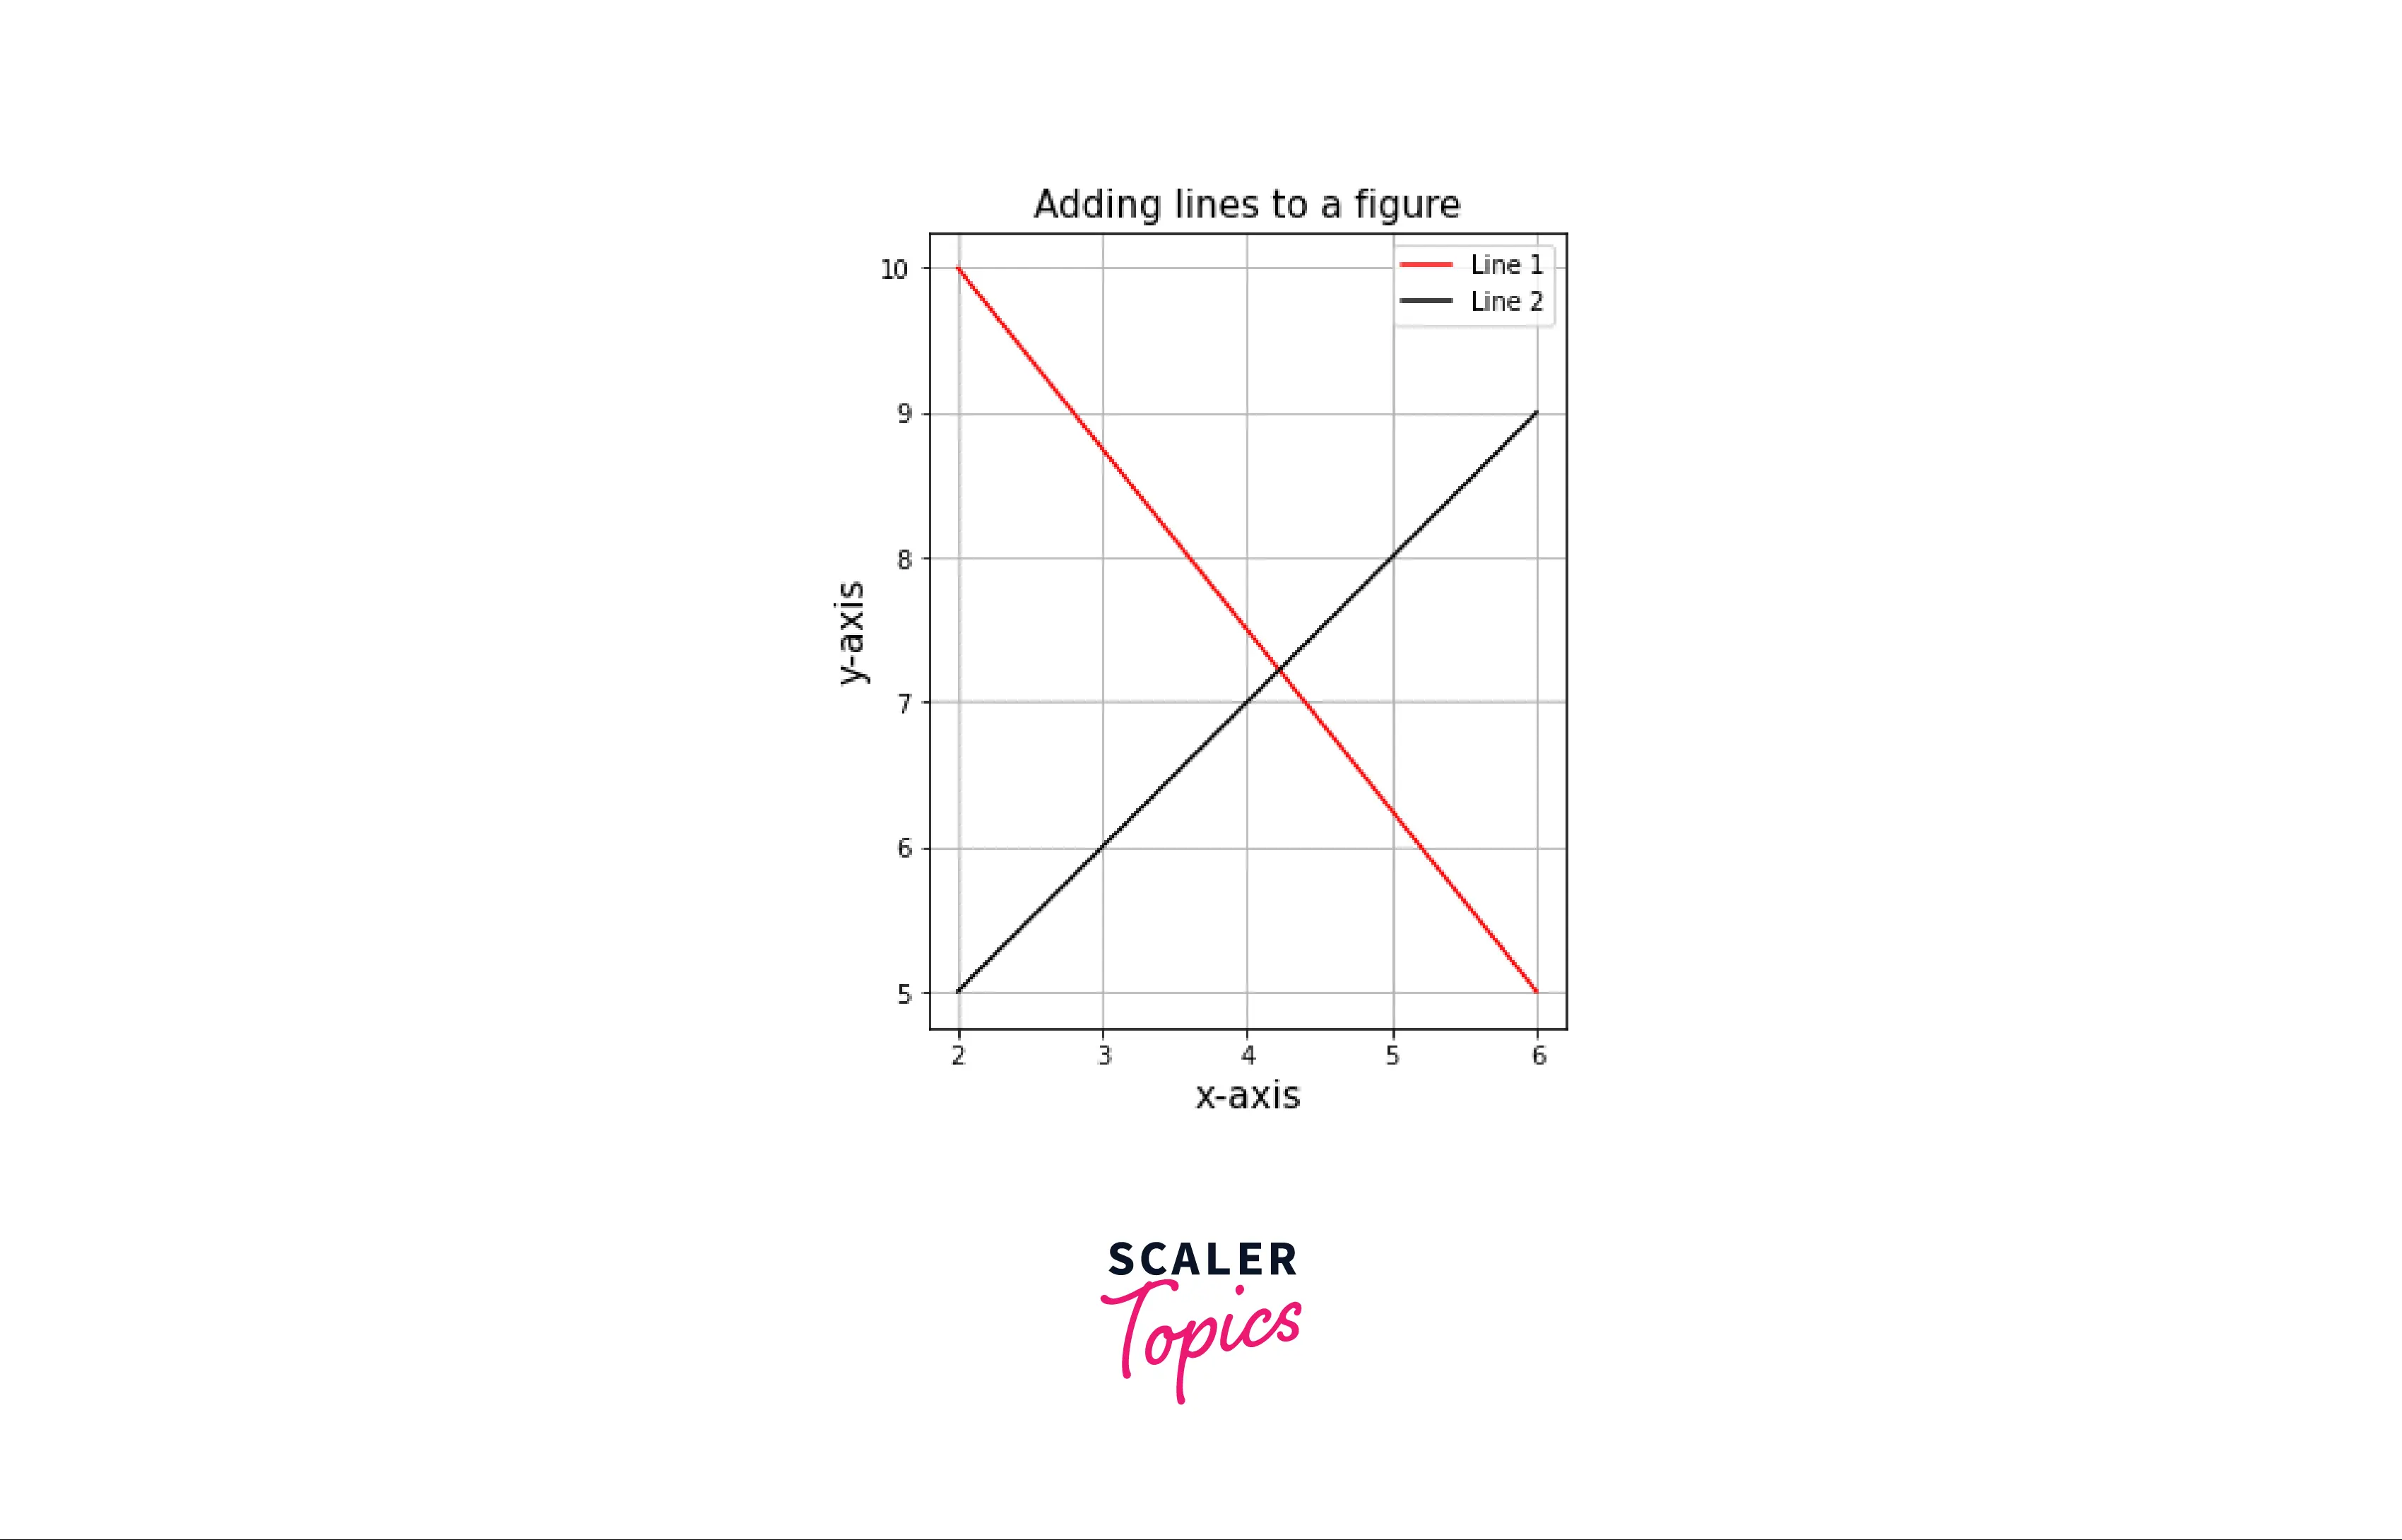
Example2: Adding the line to a figure using matplotlib line plot
Drawing a line requires two coordinates that can be plotted using the pyplot library. We need lists x1 and y1 to plot line 1 and x2 and y2 to plot line 2.
Output:

Example3: Adding multiple lines in a plot
Output:
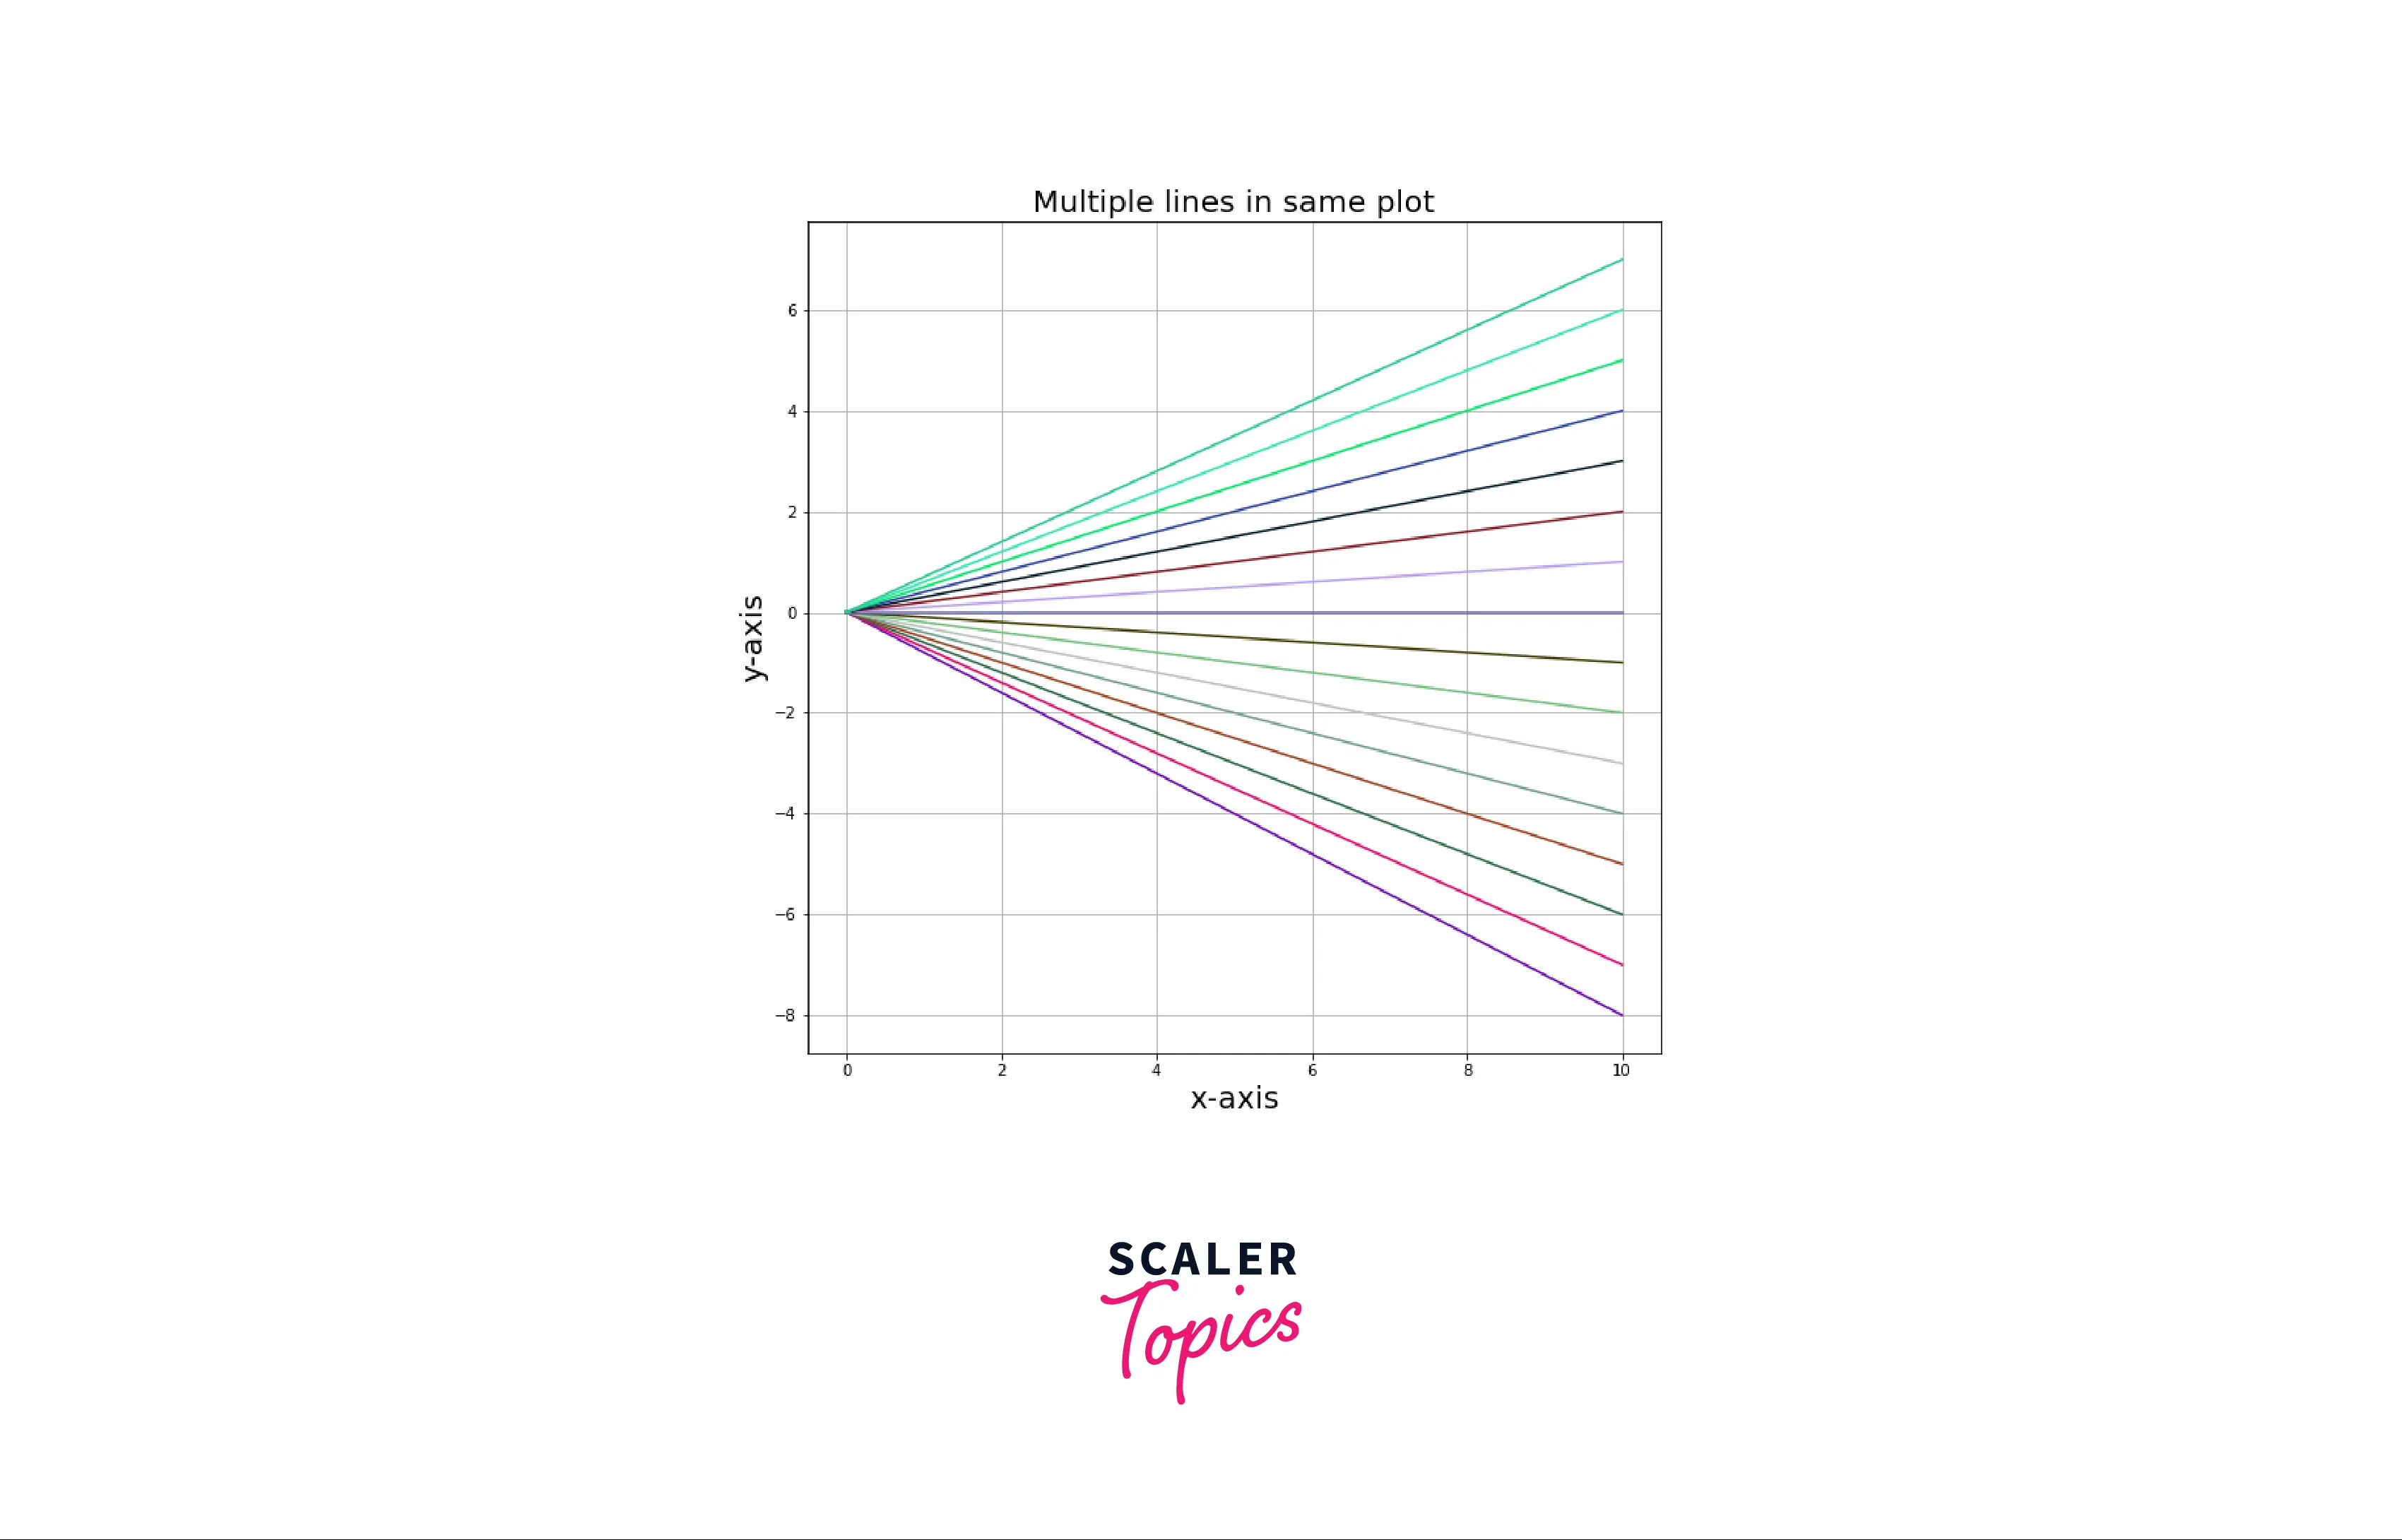
Code explanation:
- Importing the required module.
- For clarity setting up the figure size to (10,6) using the function matplotlib.pyplot.rcParams[]
- Setting up the lists x and y.
- matplotlib.pyplot.plot() is used to plot the line, but by calling it multiple times using the for loop, we can plot multiple lines.
- numpy.random.rand() passed as a parameter in matplotlib.pyplot.plot() to plot line with random color.
- For adding details to the figure we use matplotlib.pyplot.title(), matplotlib.pyplot.xlabel() and matplotlib.ylabel().
- Then, for displaying the plot, we use matplotlib.pyplot.show().
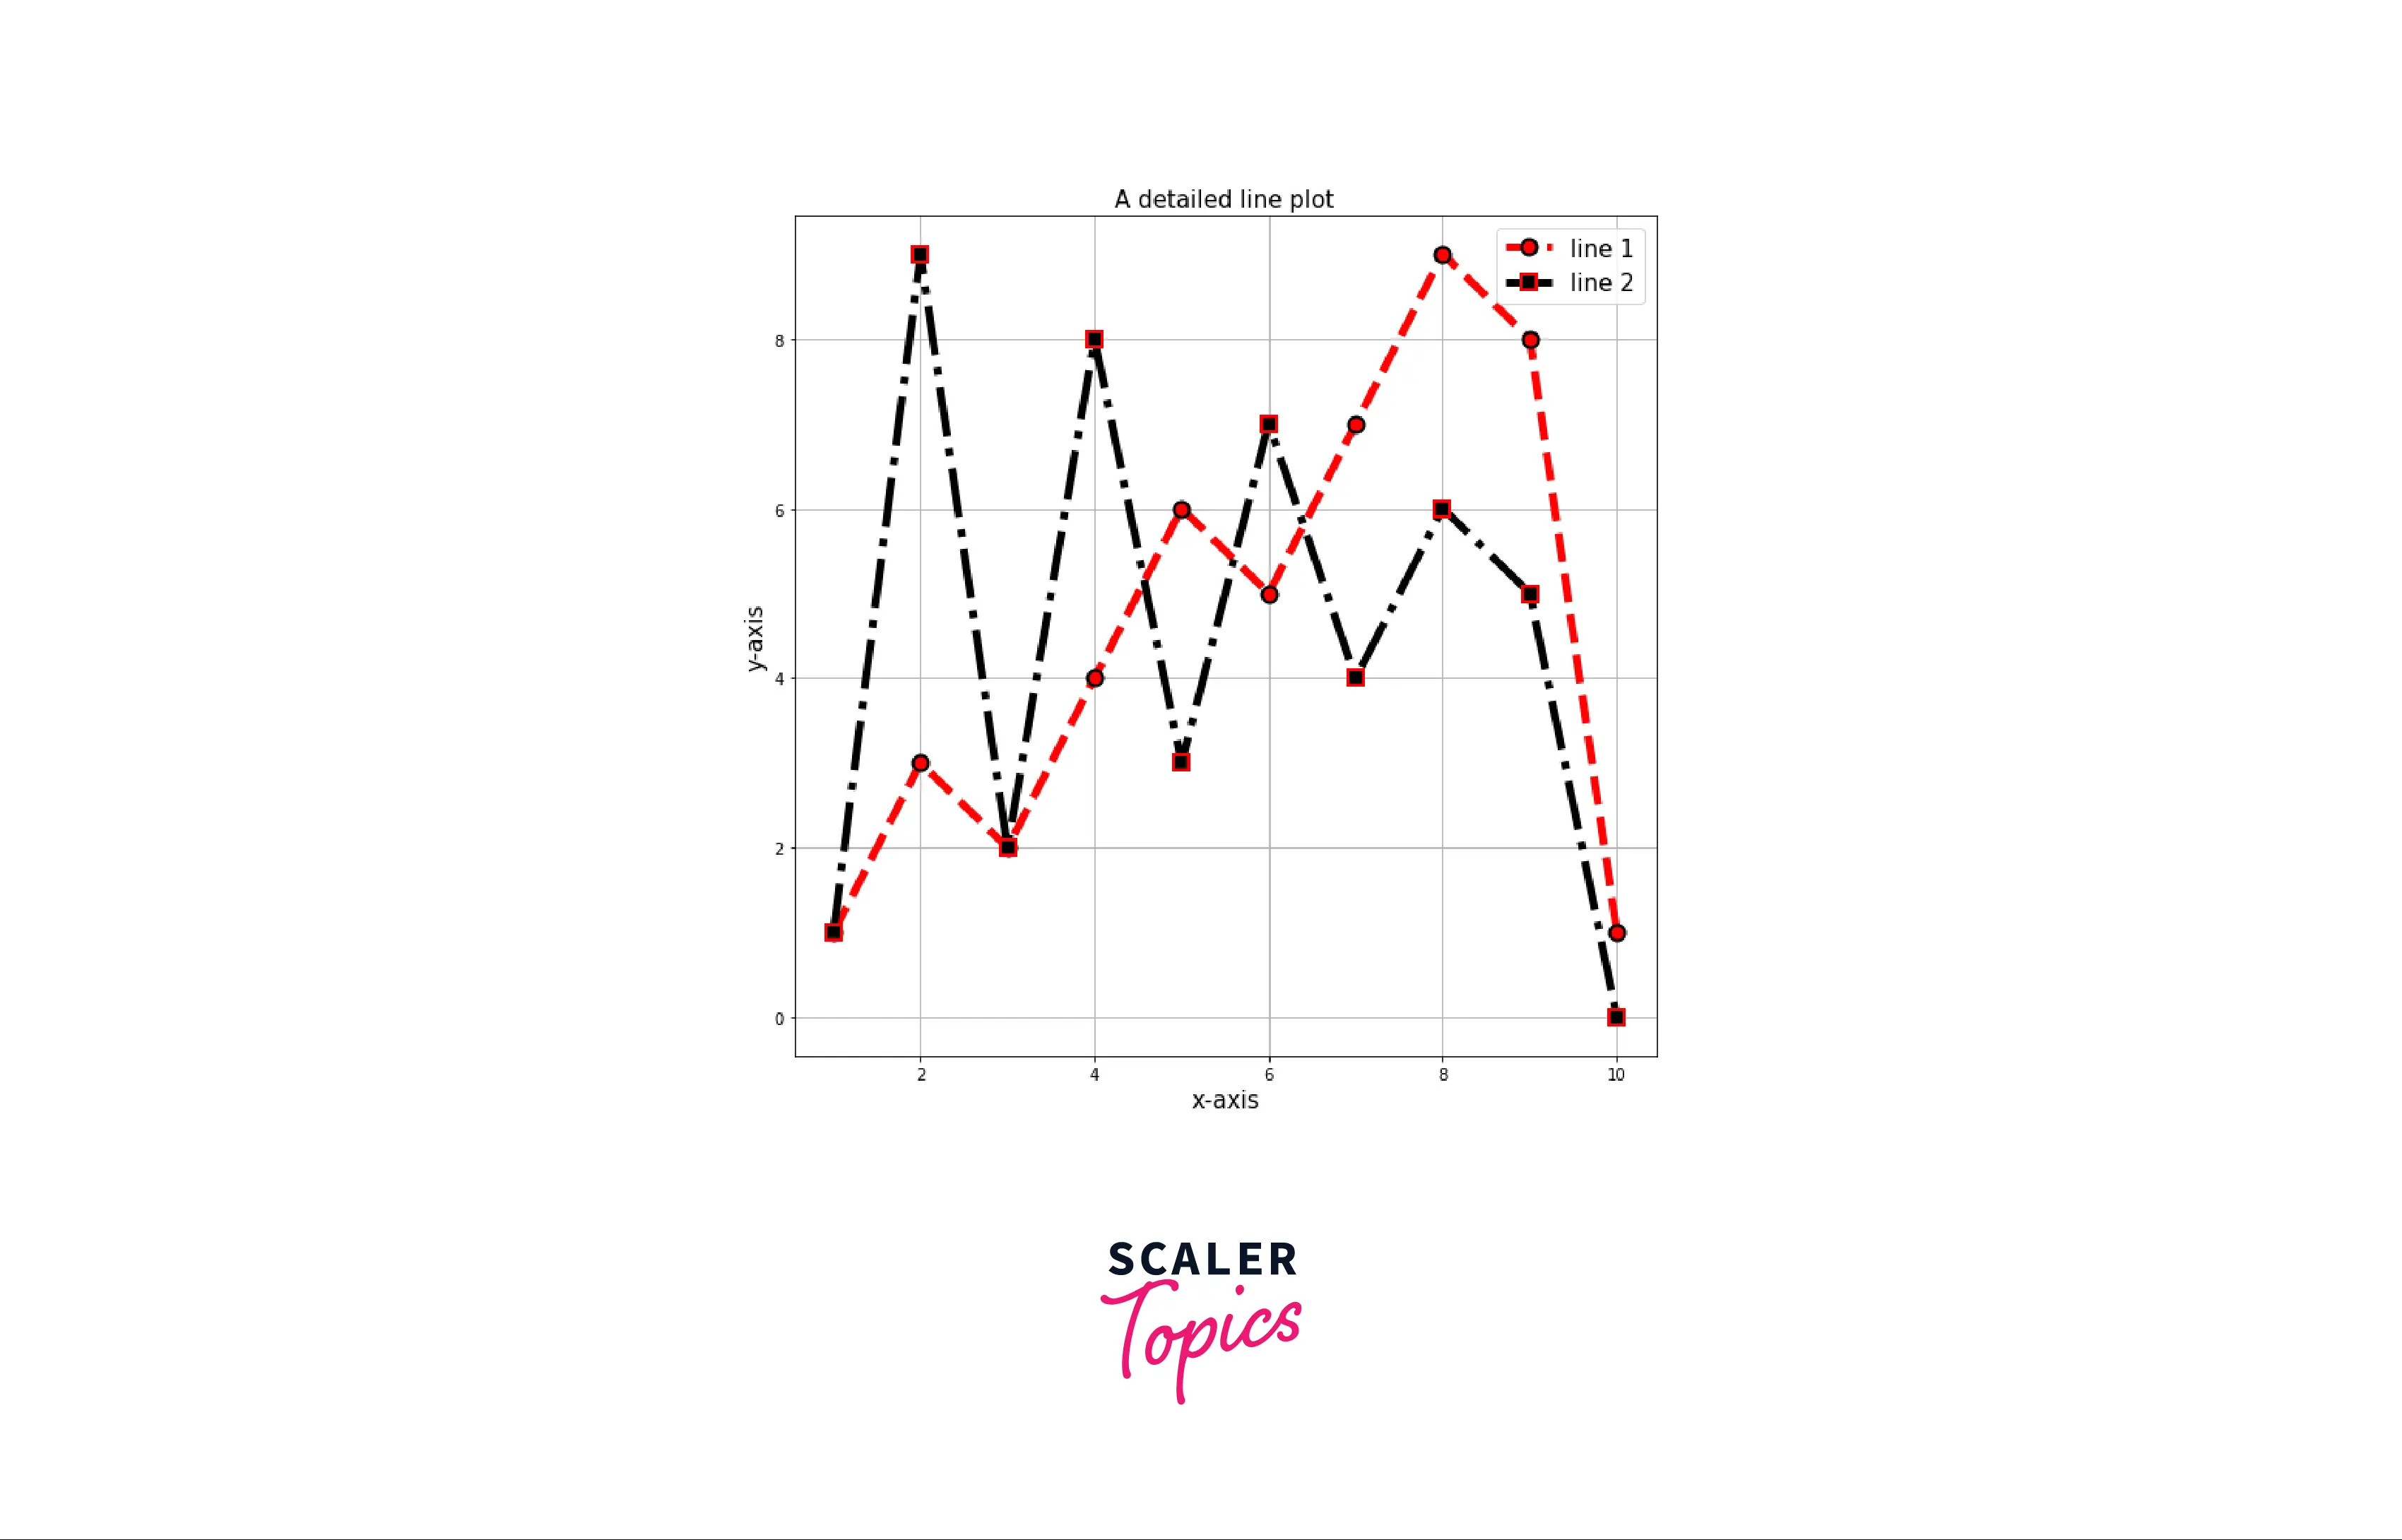
Example4: A detailed line plot
Output:
Adding Lines on a Figure Using matplotlib.lines
Plotting a line on a graph requires at least two coordinates. In matplotlib, one more library can be used to add lines on a figure matplotlib.lines from which we can import function Line2D, which takes at least two parameters xdata and ydata to plot a line.
Syntax of matplotlib.lines.Line2D()
Example 5: Plotting lines on a figure using matplotlib.lines
Output:
Example7: Adding multiple lines in the same plot An Interactive figure with multiple lines in the same plot is generated using the matplotlib.lines.Line2D() function and for loop to better understand the concept.
Output:
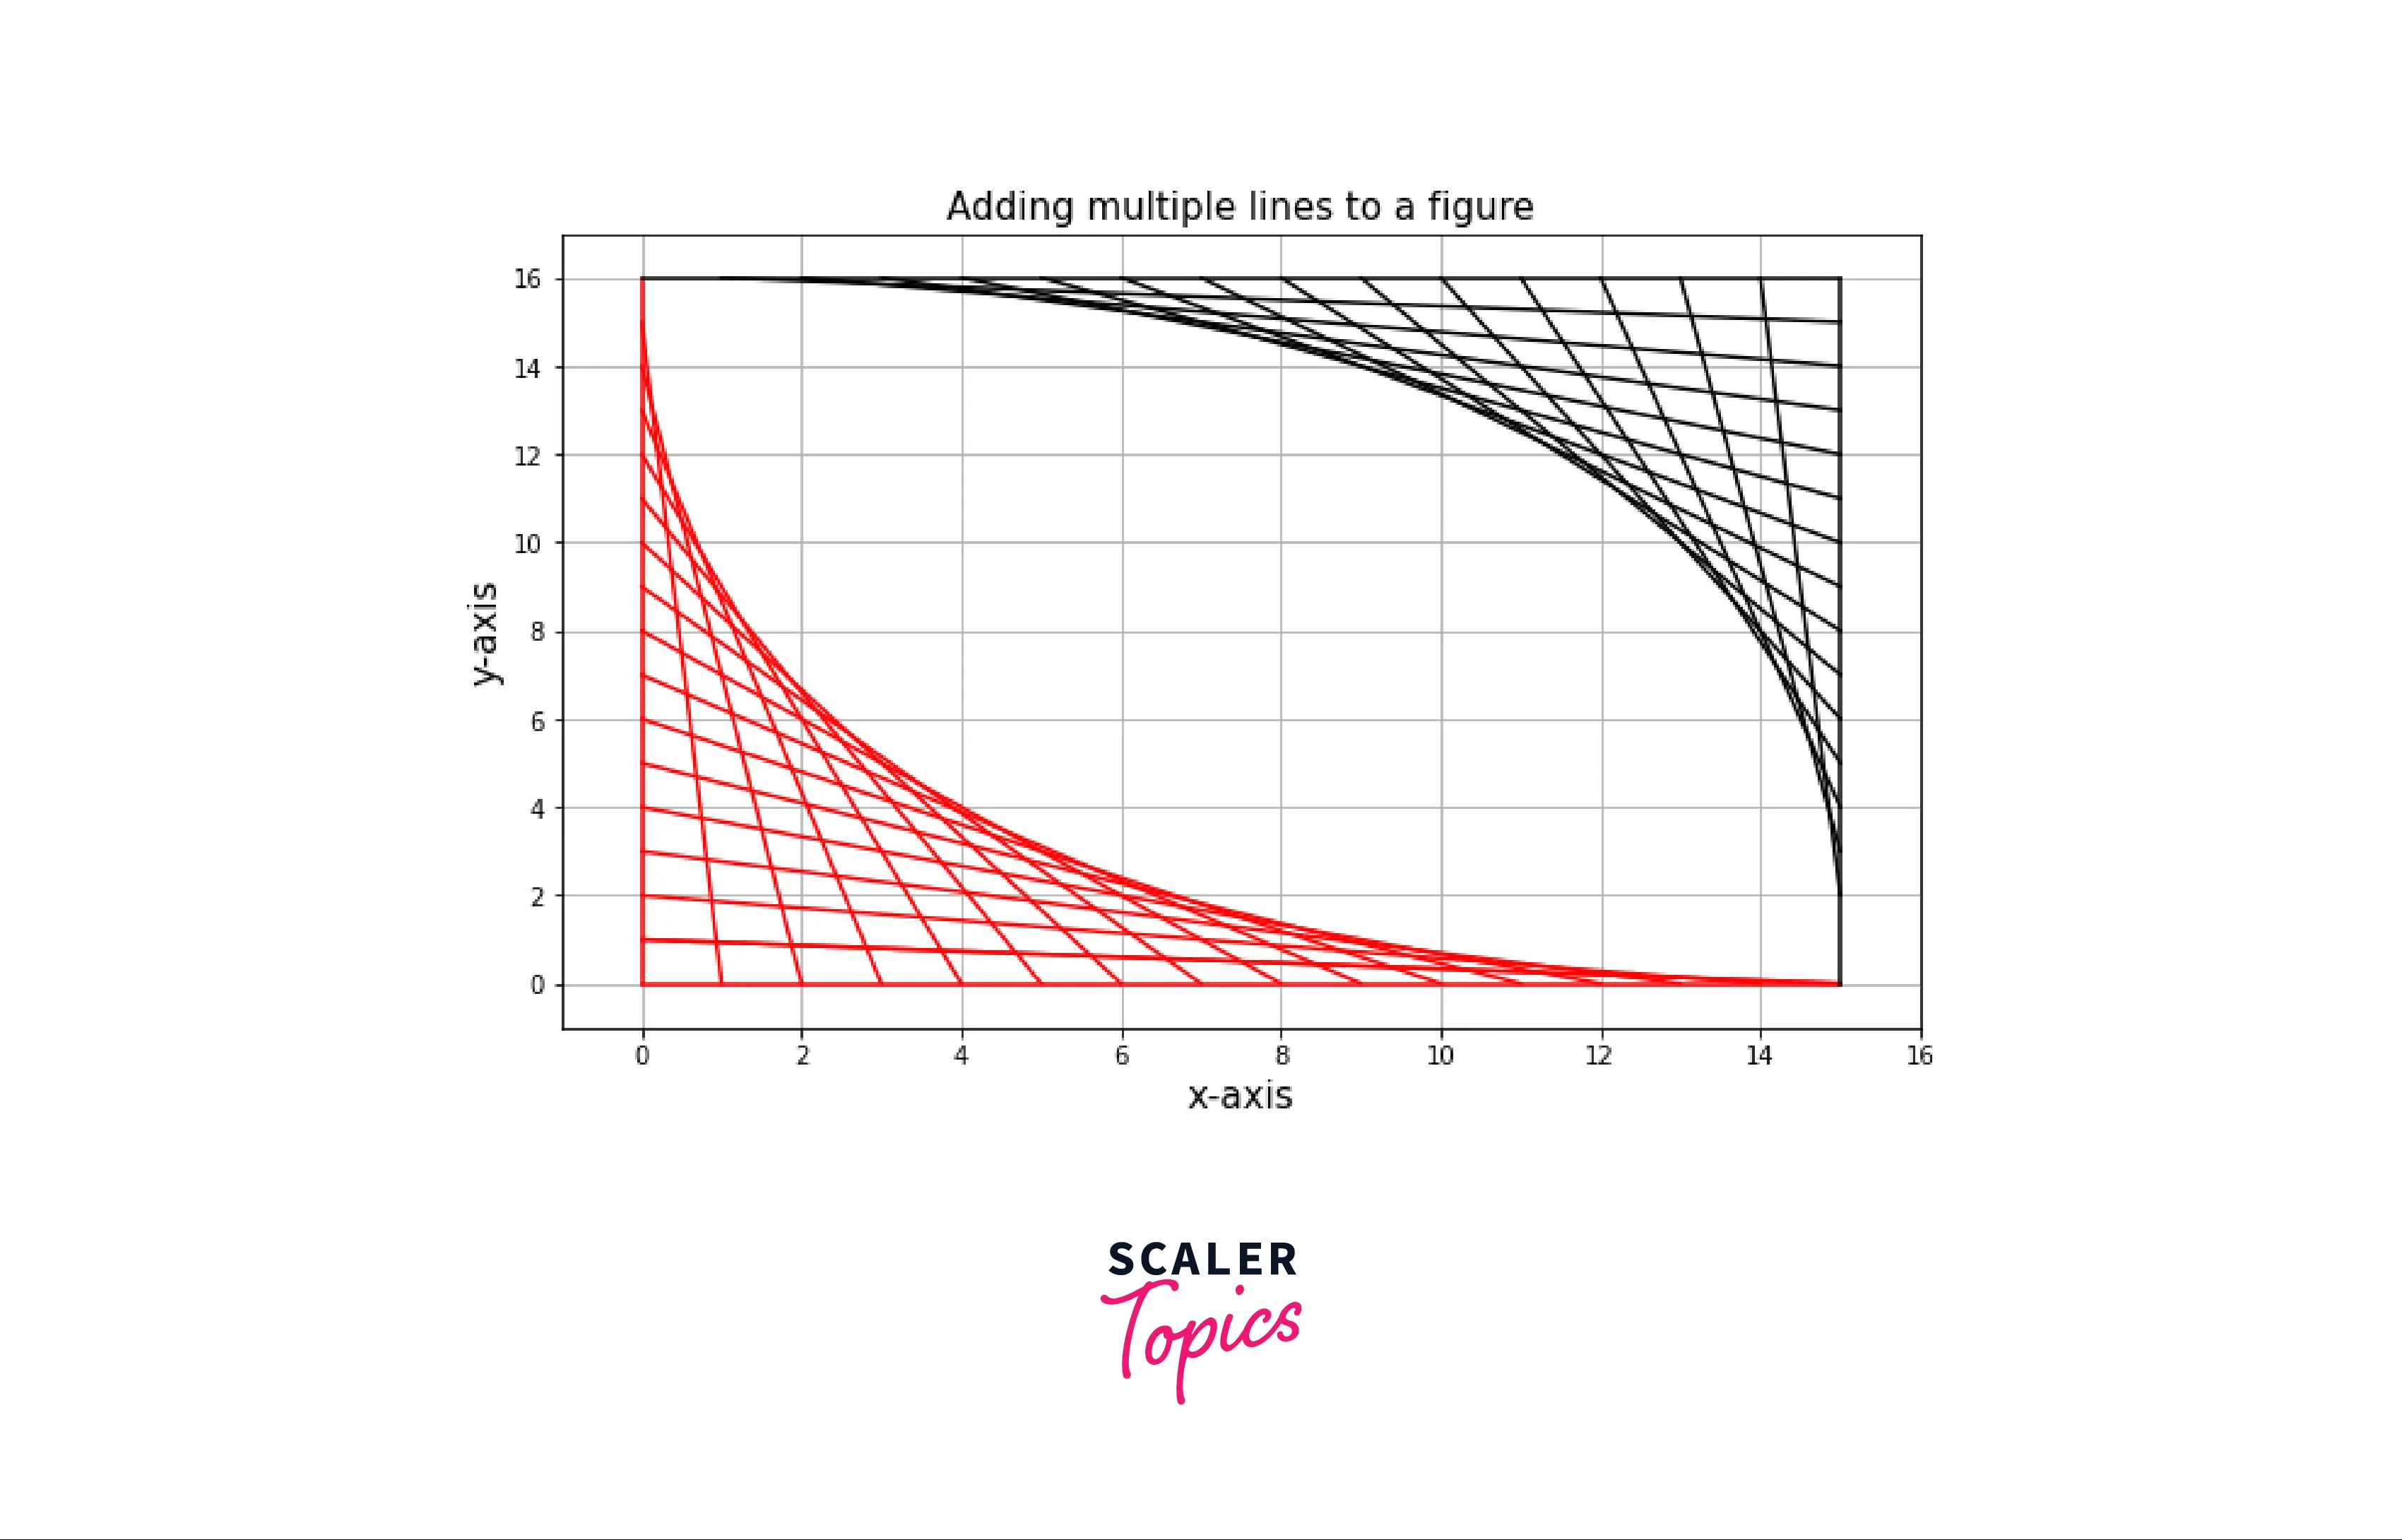
Code explanation:
- Importing the required module.
- First, creating a new figure using matplotlib.pyplot.figure() then adding subplot using matplotlib.pyplot.figure().add_subplot()
- For plotting multiple lines in the same plot, we need to store those lines in a list.
- The for loop generates multiple lines and stores them in the list.
- For adding details to the plot we use matplotlib.pyplot.title(), matplotlib.pyplot.xlabel() and matplotlib.pyplot.ylabel().
- To better view the plot, we scale the x-axis and y-axis using the functions set_xlim() and set_ylim().
- To display the plot we use matplotlib.pyplot.plot().
Example8: Generating a line plot using matplotlib.lines
We can also graph line plots using matplotlib.lines library. We need two lists of x and y data points to graph a line plot.
Output:

Example9: A detailed line plot generated using matplotlib.lines
Output
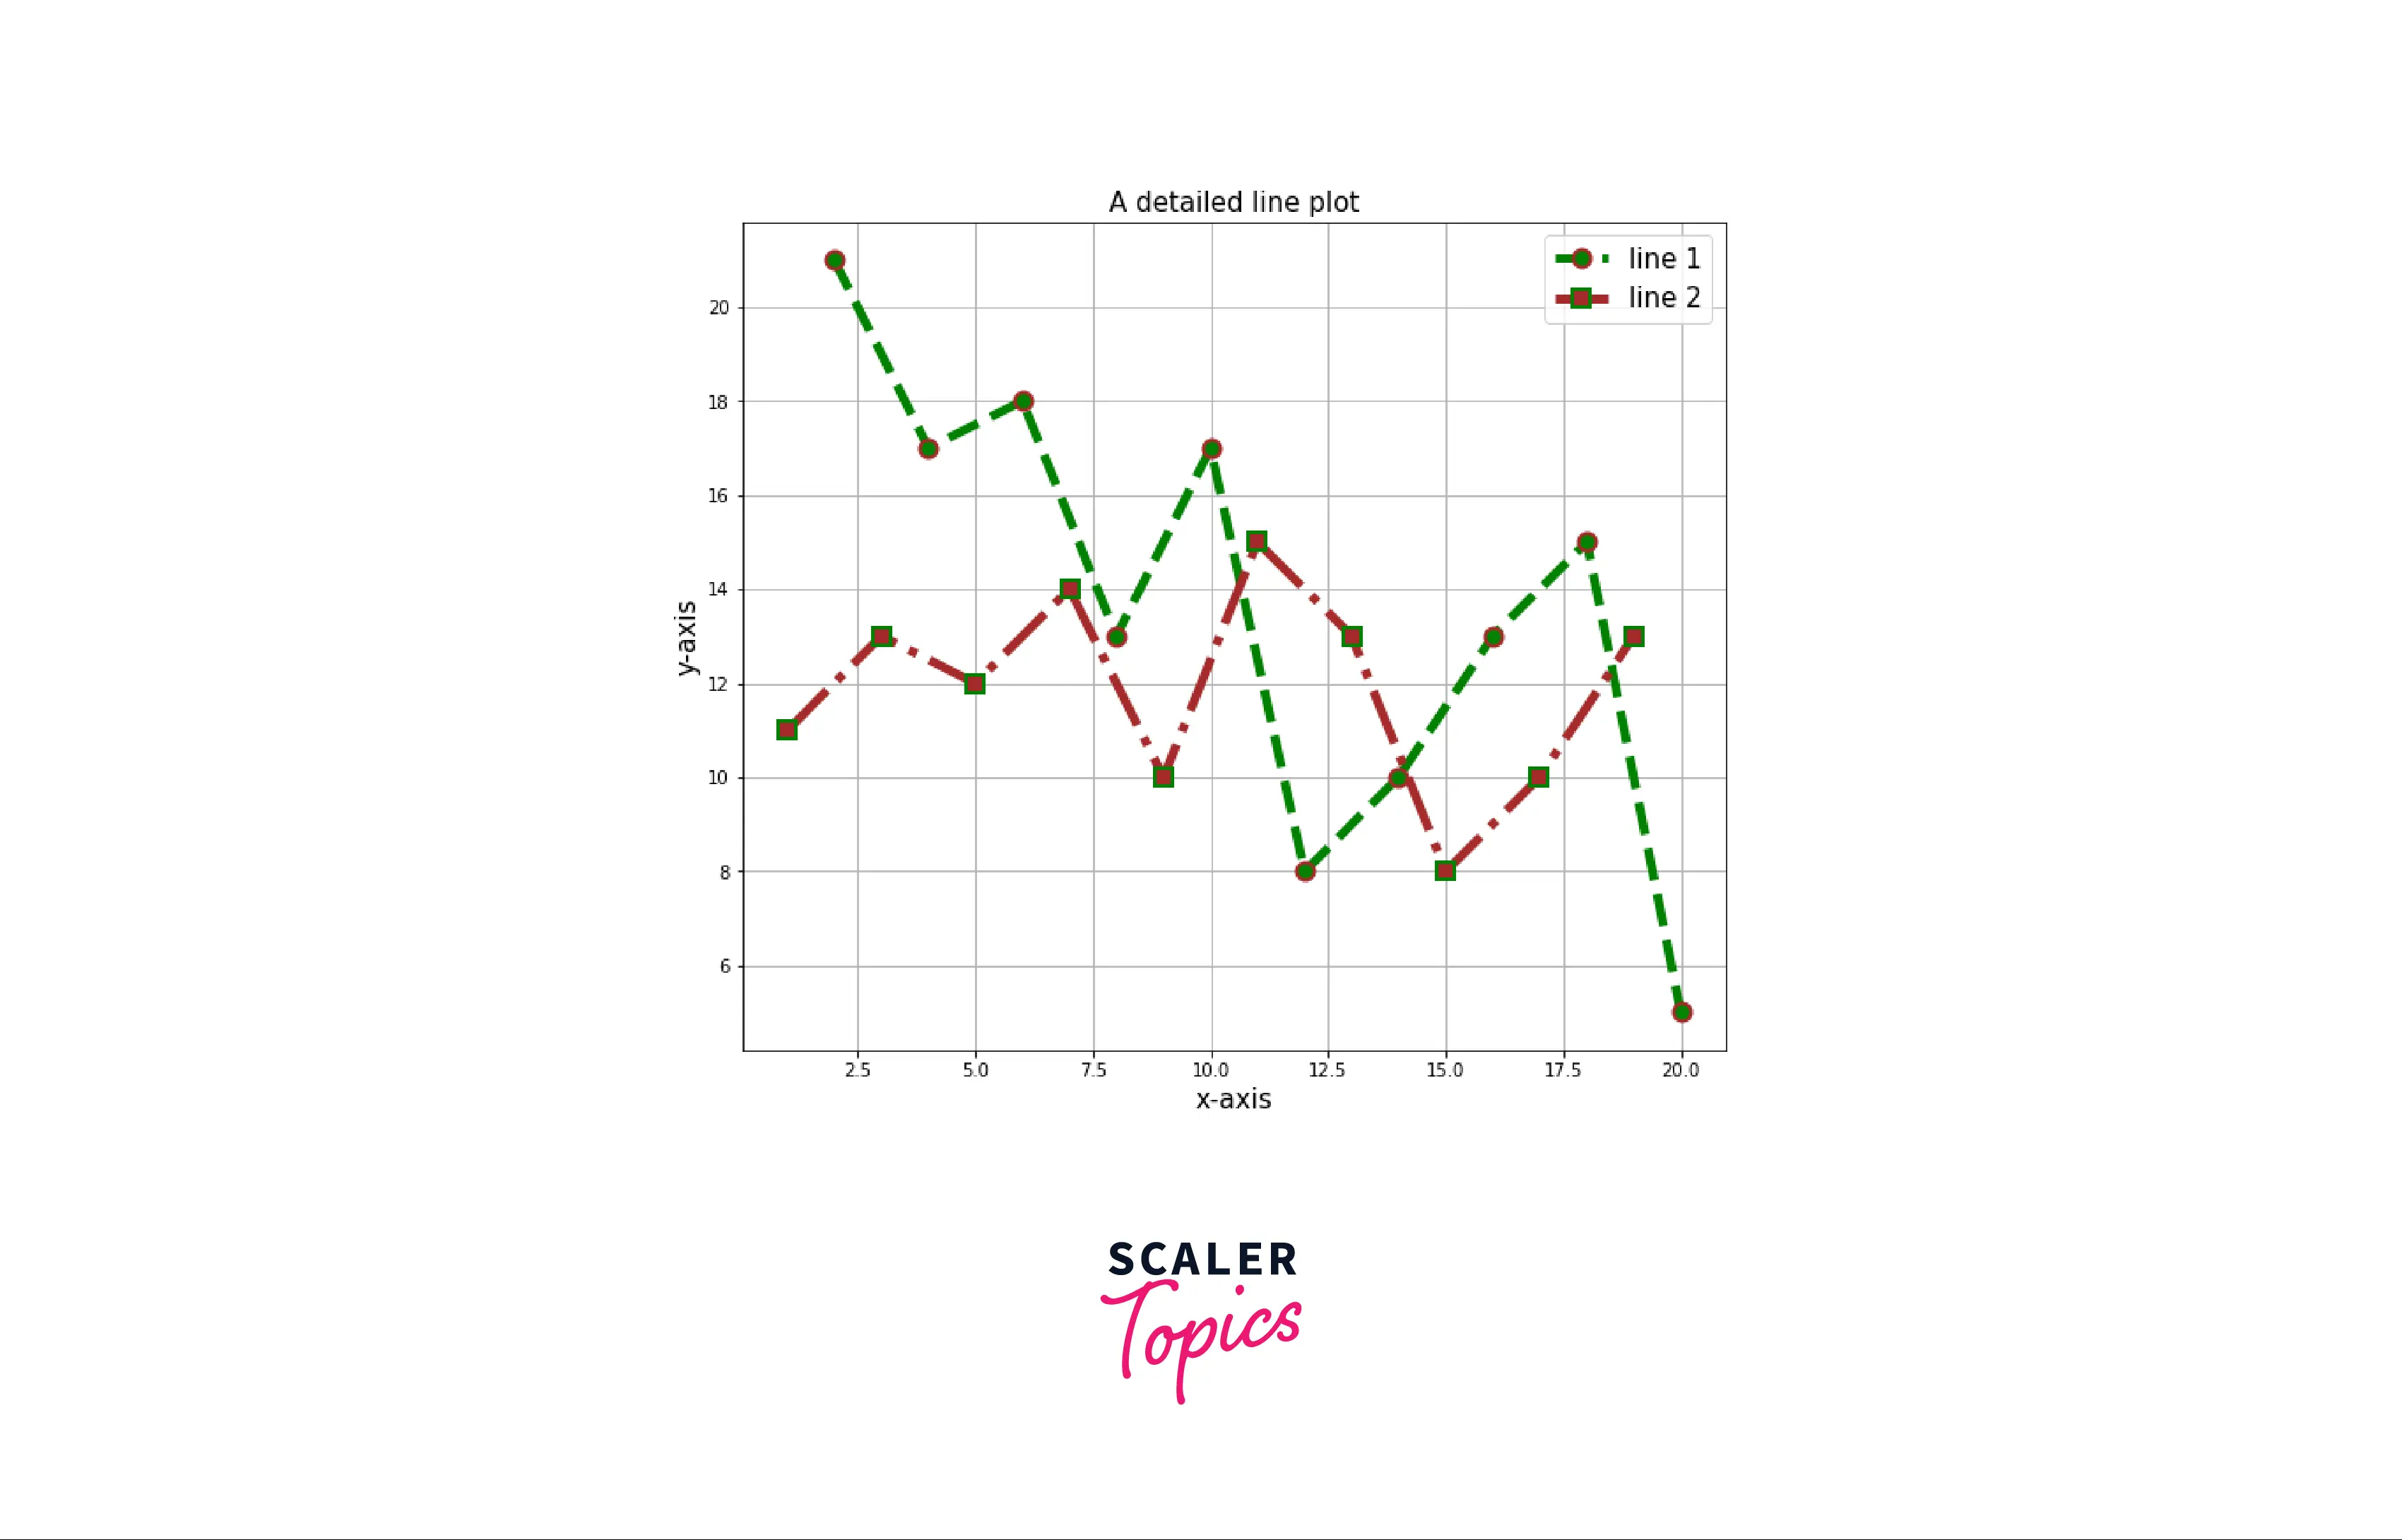
Code explanation:
- Importing the required modules.
- First, create the figure using the function matplotlib.pyplot.figure(). Then add the subplot to the figure.
- Setting up the x and y data points in the list for plotting it.
- matplotlib.lines.Line2D() plots the lines on the figure.
- Properties of the first line, color is green, the line width is 5, the marker is a circle, the marker size is 10, the marker edge color is brown, the marker edge width is 2, the line style is dashed style, and the label is line 1.
- Properties of the second line, color is brown, the line width is 5, the marker is square, the marker size is 10, the marker edge color is green, the marker edge width is 2, the line style is dash-dot, and the label is line 2.
- We must add lines to the figure using the **add_line()**function.
- To add plot details, we set the title, xlabel and ylabel, grid, and legend.
- For displaying the plot, we use the function matplotlib.pyplot.show()
How to Insert a Matplotlib Horizontal Line?
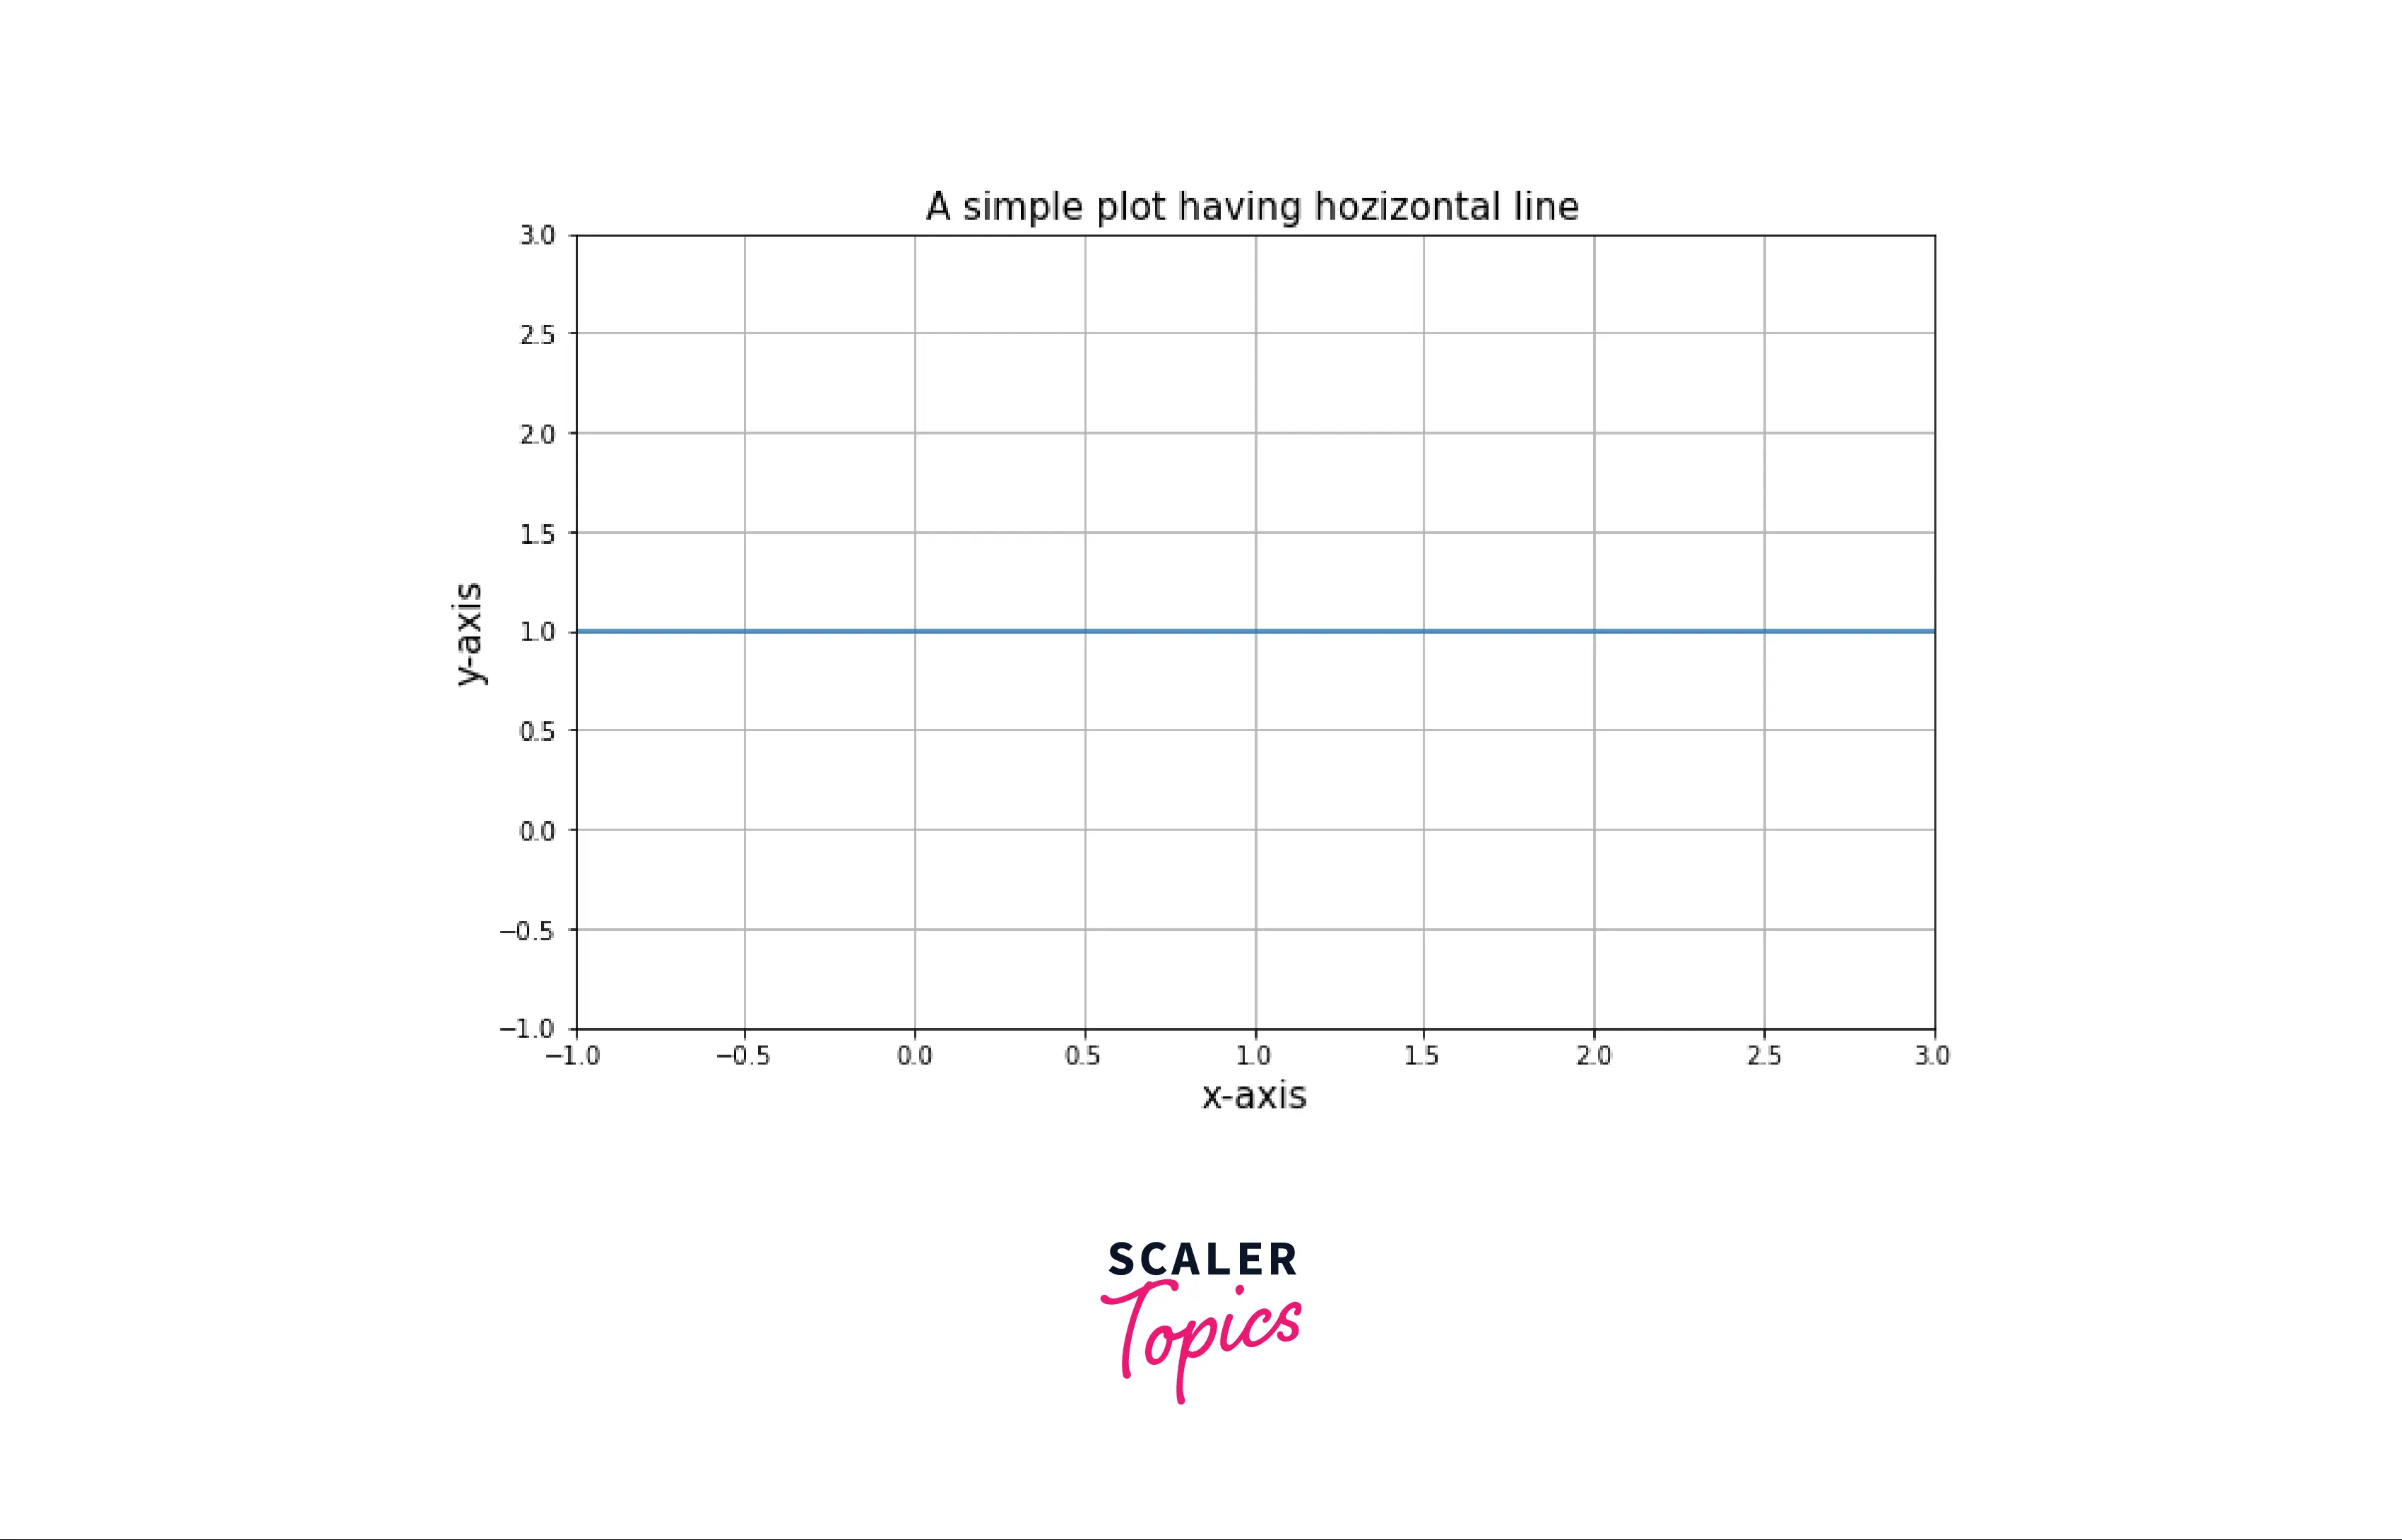
The horizontal line is a straight line parallel to X-axis. For plotting horizontal lines in the graph, there is a function in pyplot module of the matplotlib library, which is used to add horizontal lines across the axis.
Syntax:
Parameters:
- y: Position of the horizontal line.
- xmin and xmax (optional parameter): Plot the horizontal line in the given range from 0 to 1.
- color (optional parameter): changes the color of the horizontal line.
- linestyle (optional parameter): changes the linestyle. eg '--','-.',':', etc.
- linewidth (optional parameter): changes the linewidth of the horizontal line.
Example10: A simple plot having matplotlib horizontal line
Output:
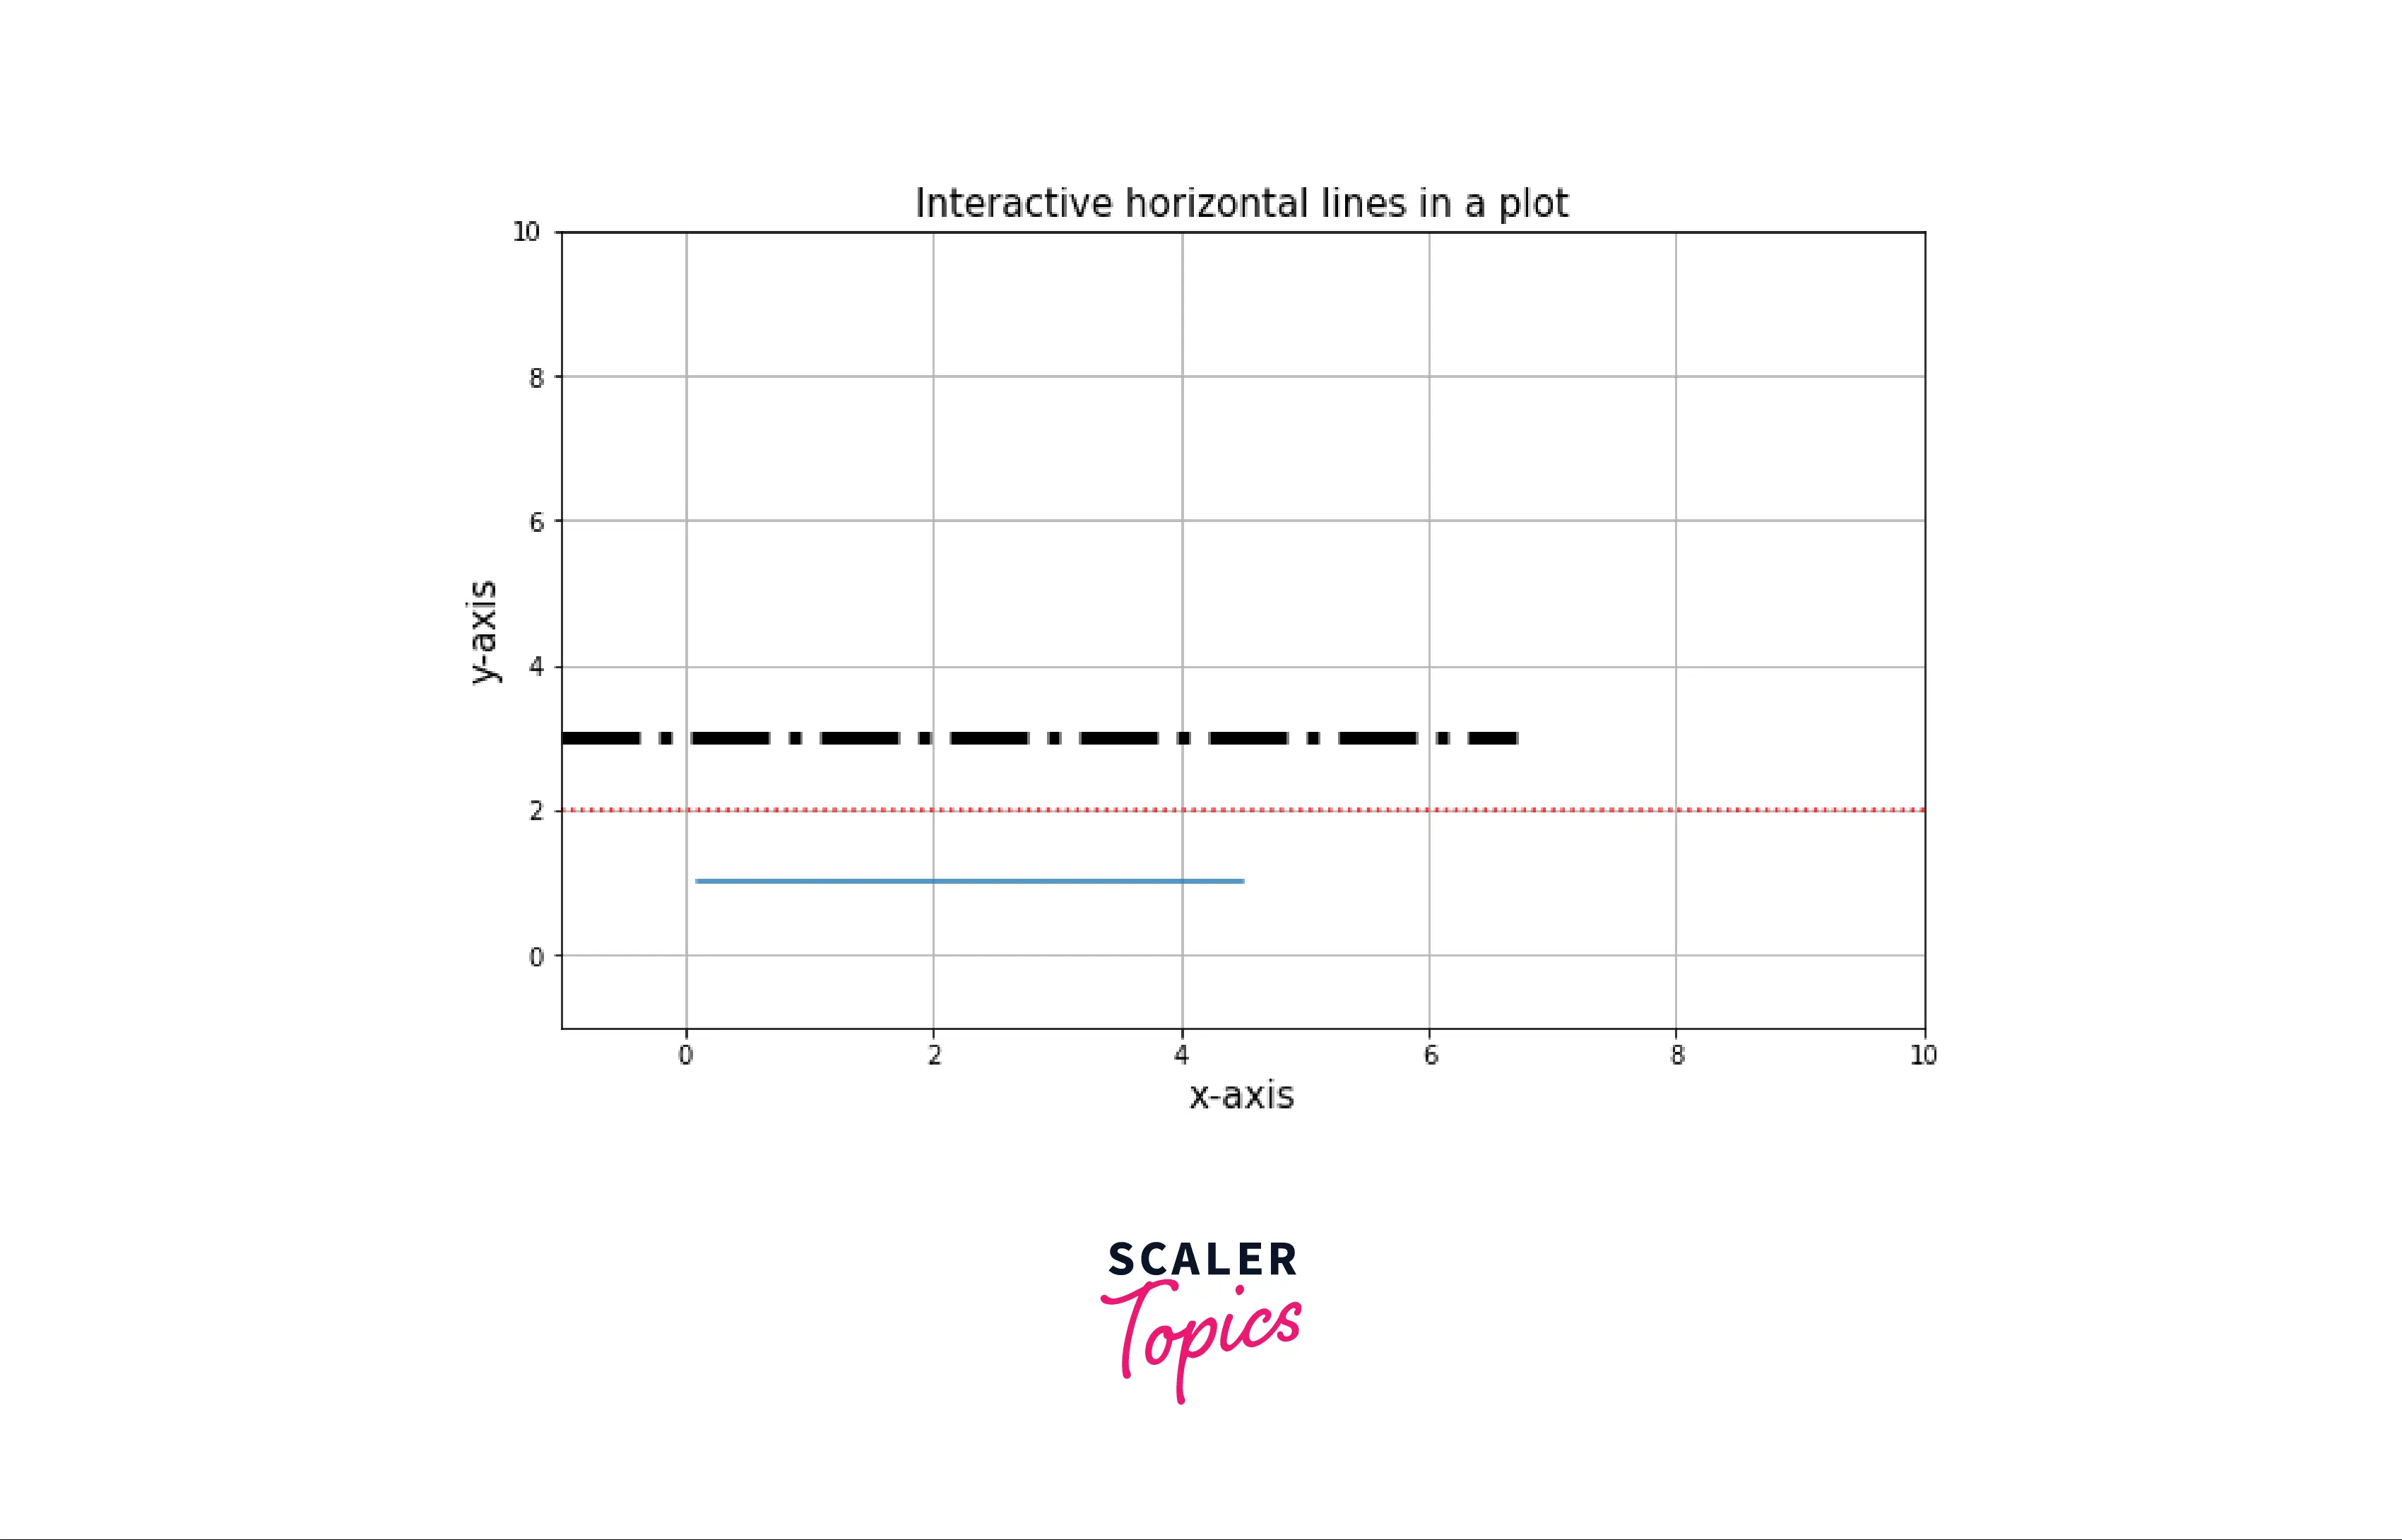
Example11: Interactive horizontal lines in a plot
Output:
How to Insert a Vertical Line in Matplotlib?
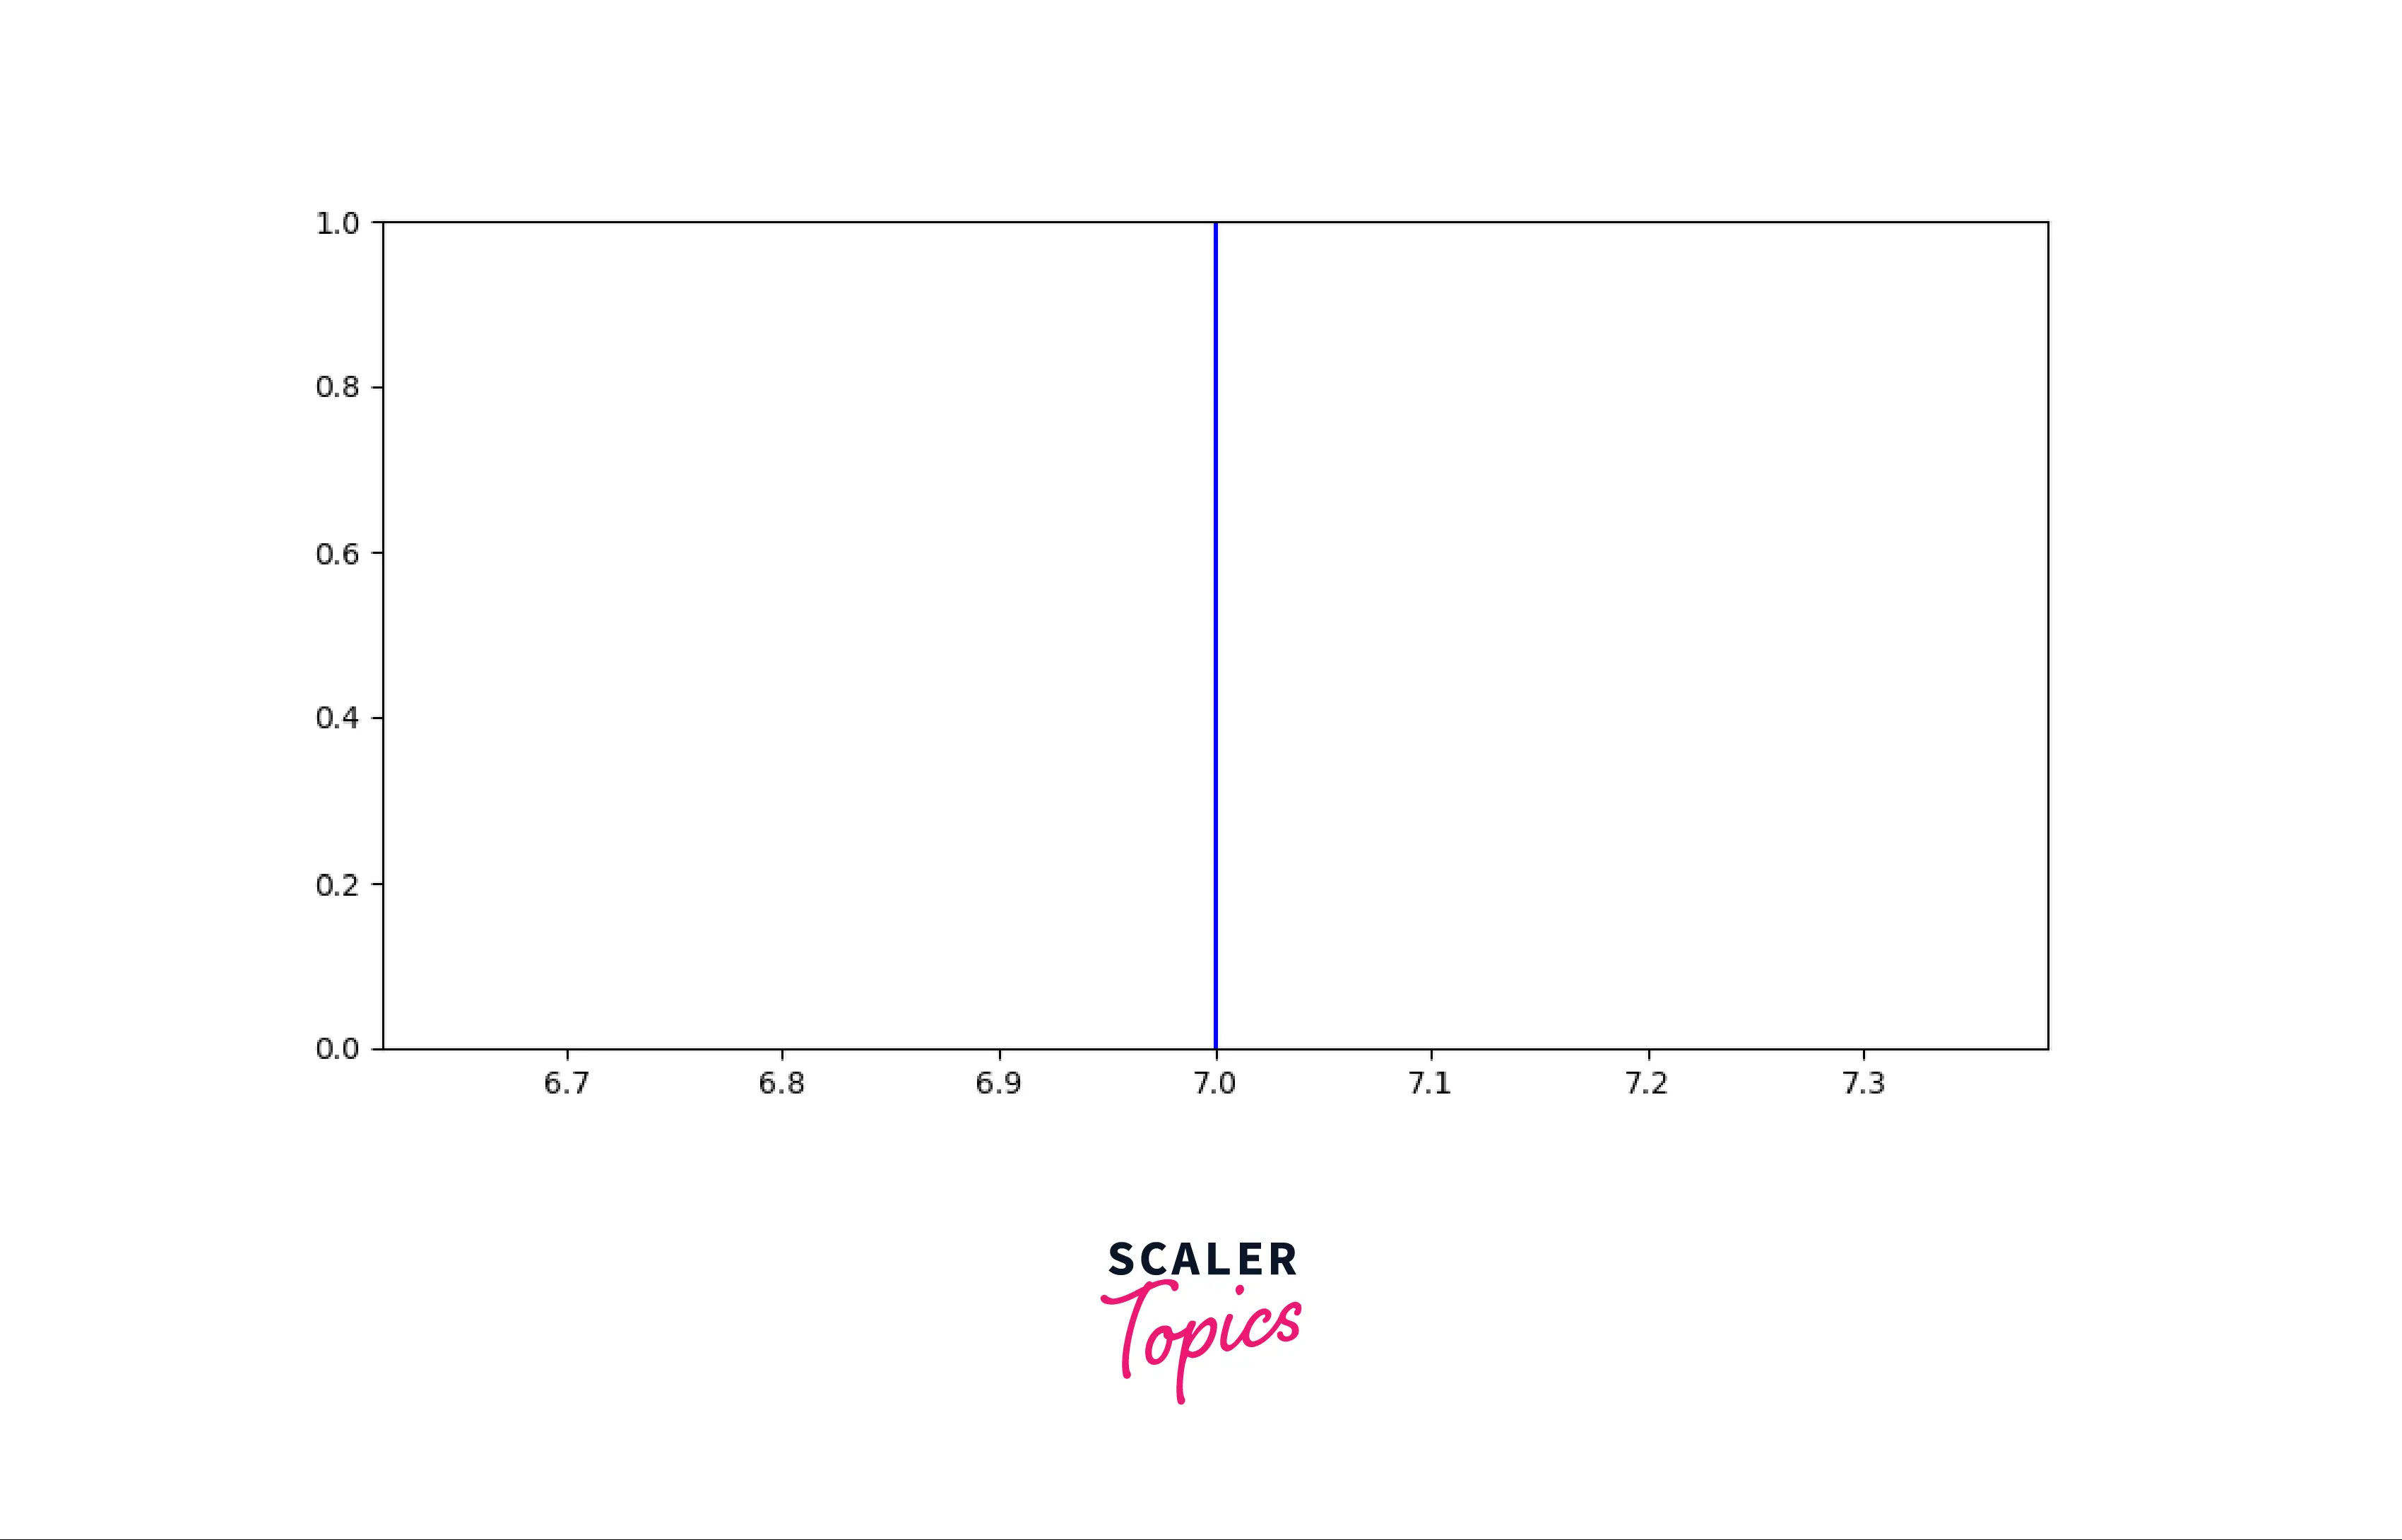
Vertical lines are a set of straight lines which run parallel to the Y-axis. To plot vertical lines, we will use the axvline() function provided by matplotlib.
Syntax
Parameters
- x: Position on the X-Axis. Accepts integers only.
- color: Color of the line.
- xmin, xmax: Plots the line in the given range.
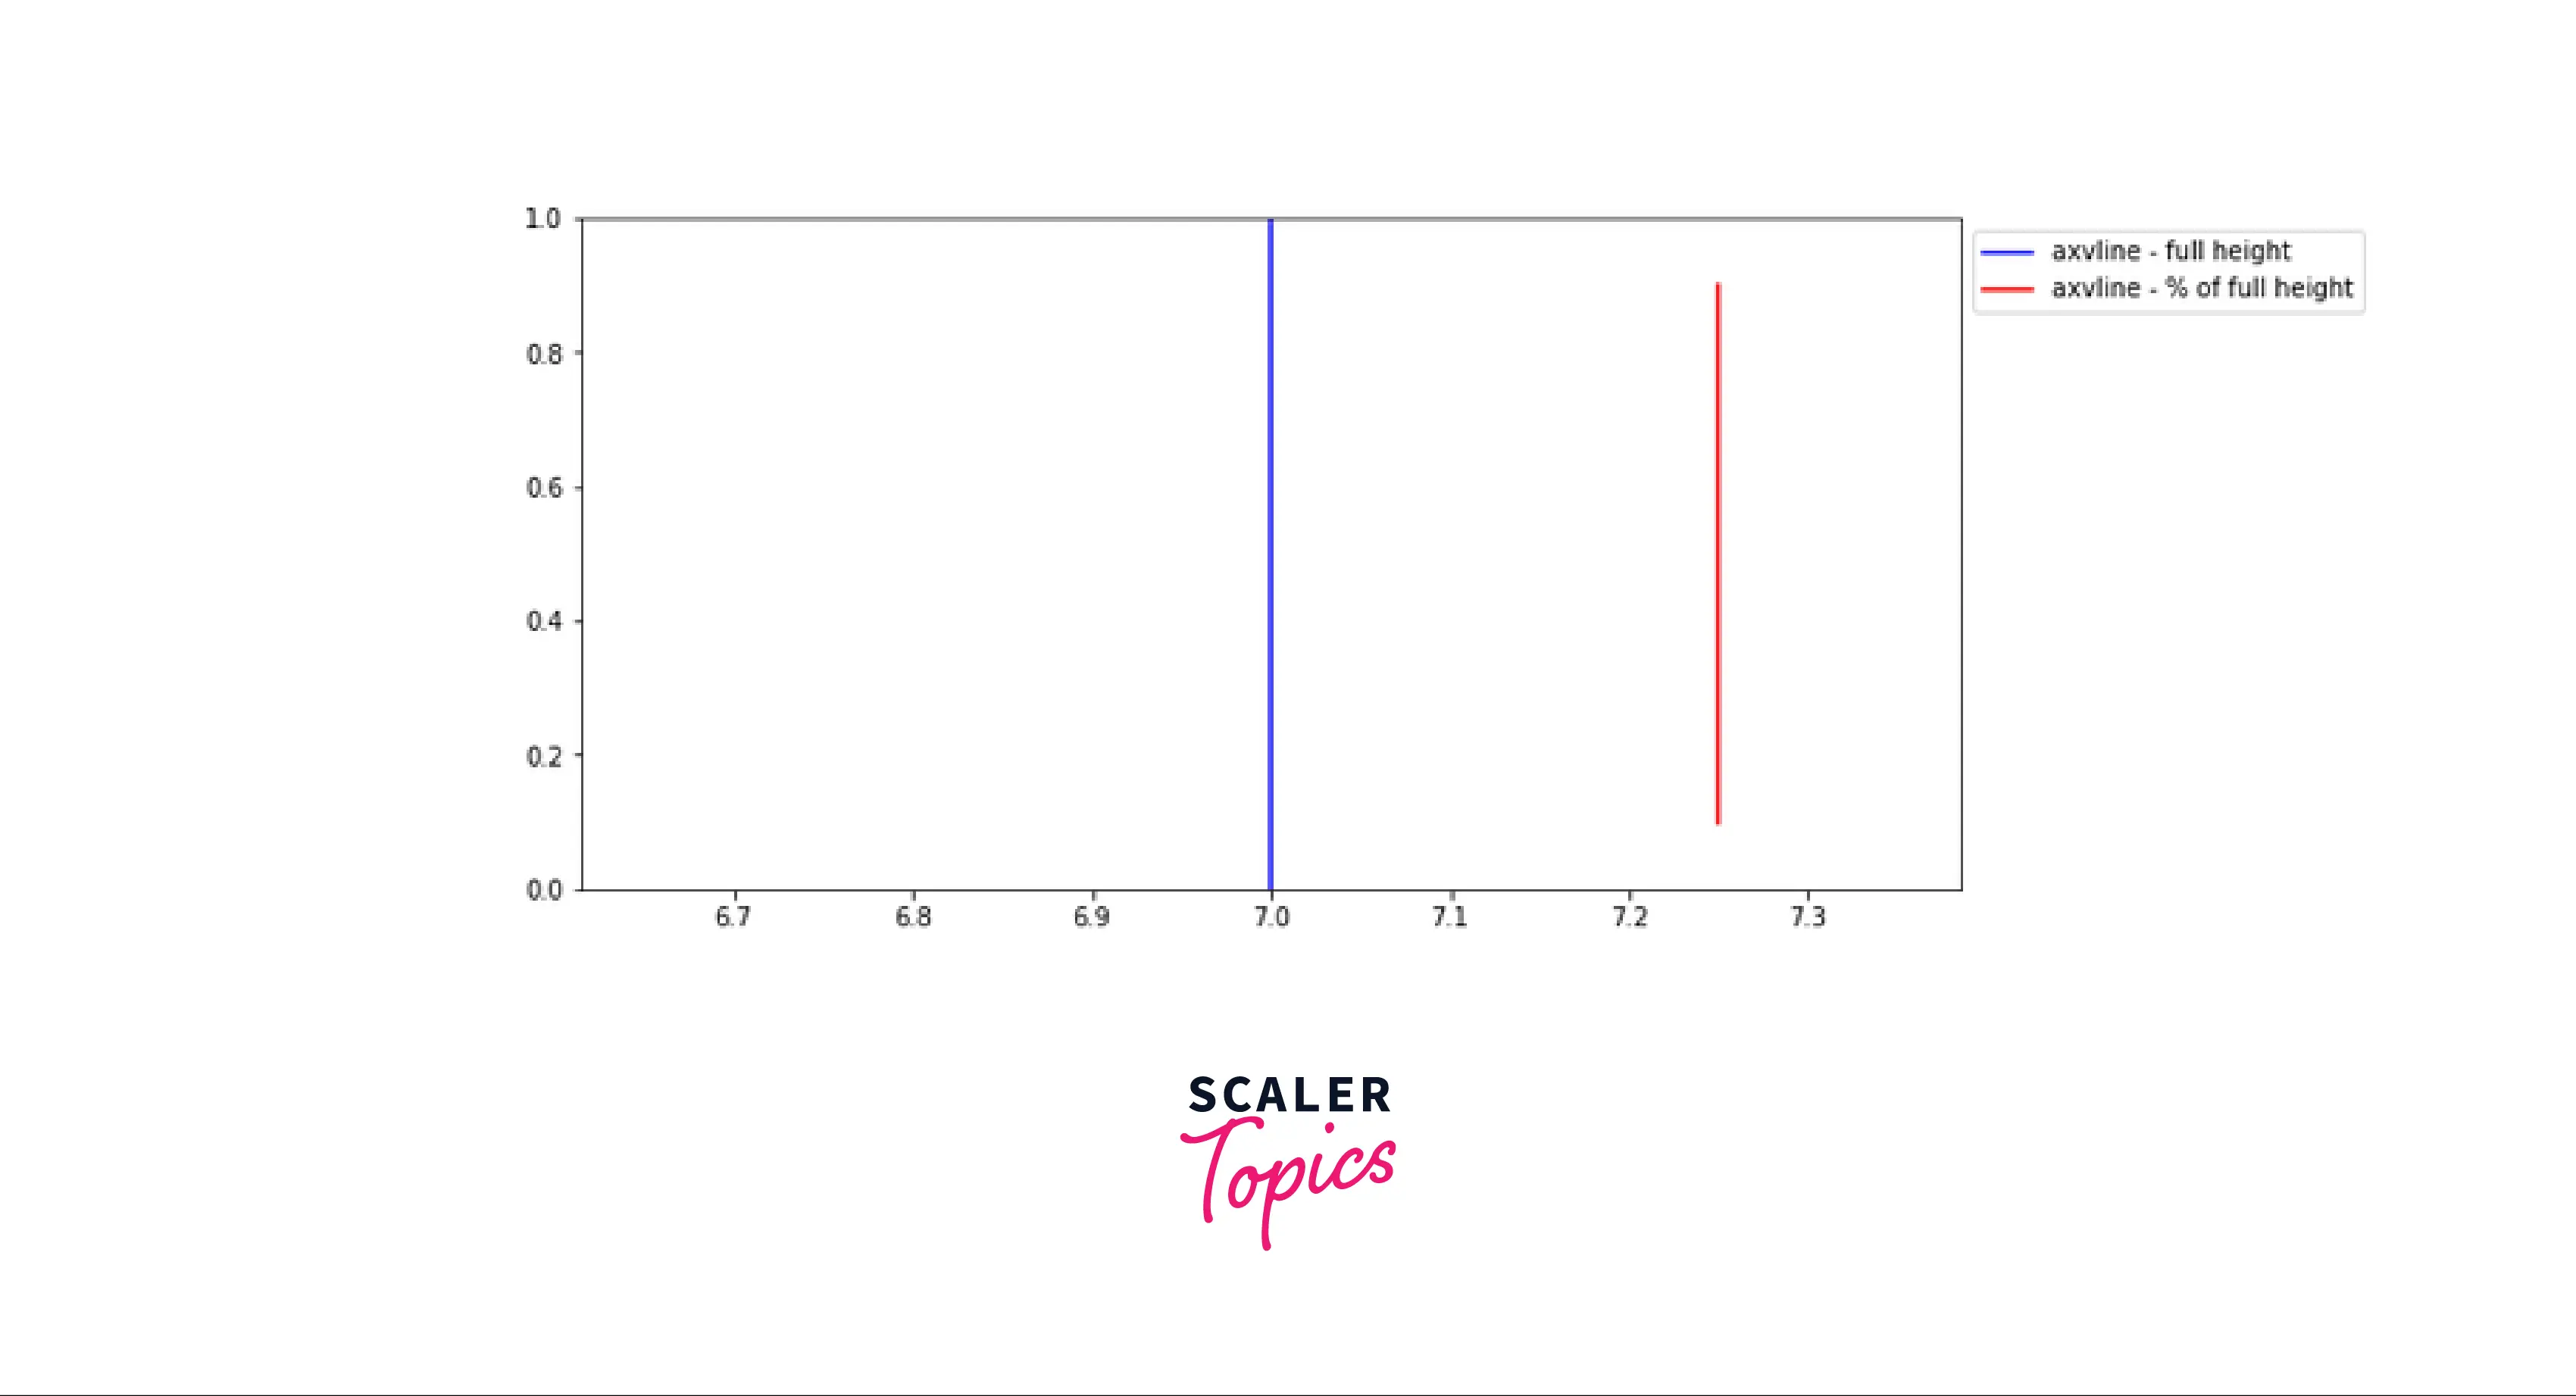
Example12: Inserting a matplotlib vertical line using axvline()
Output:
Example13: Inserting multiple matplotlib vertical line using axvline()
Output:
How to Create a Matplotlib Vertical and Matplotlib Horizontal Line in Matplotlib?
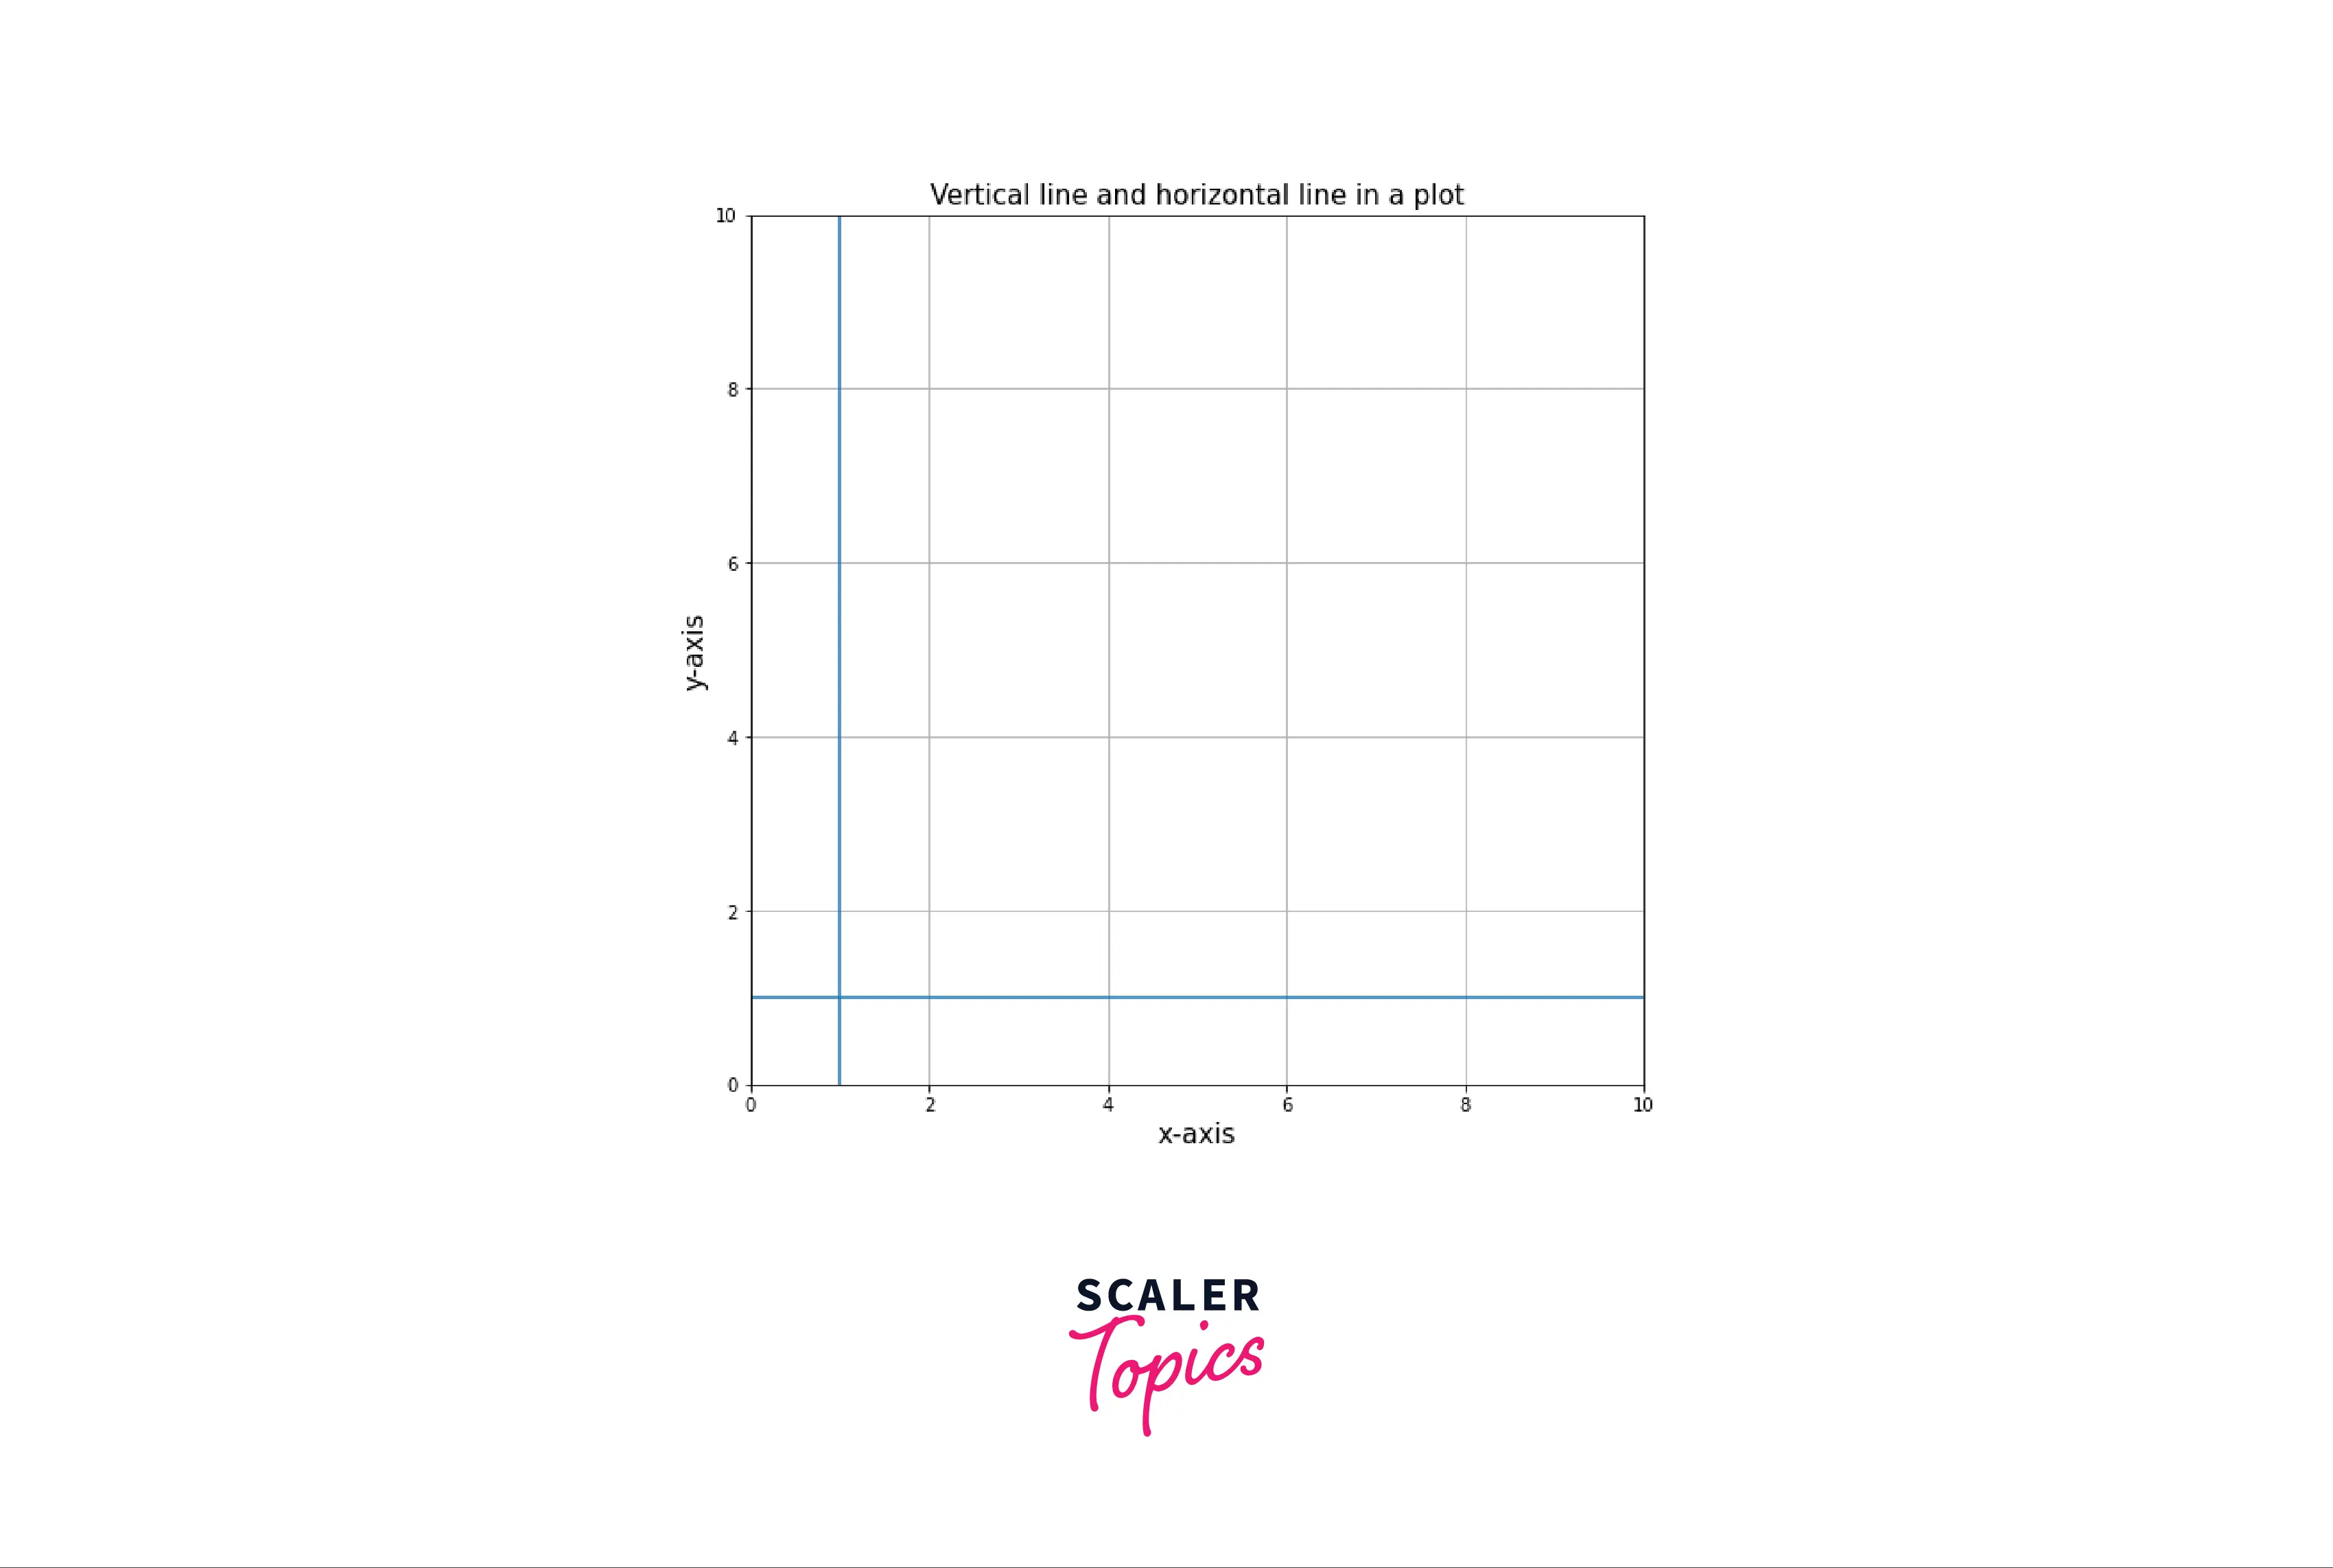
We can also plot the vertical line in a plot along with the horizontal line using the axvline() function.
Example14: Matplotlib vertical line and matplotlib horizontal line in a plot
Output:
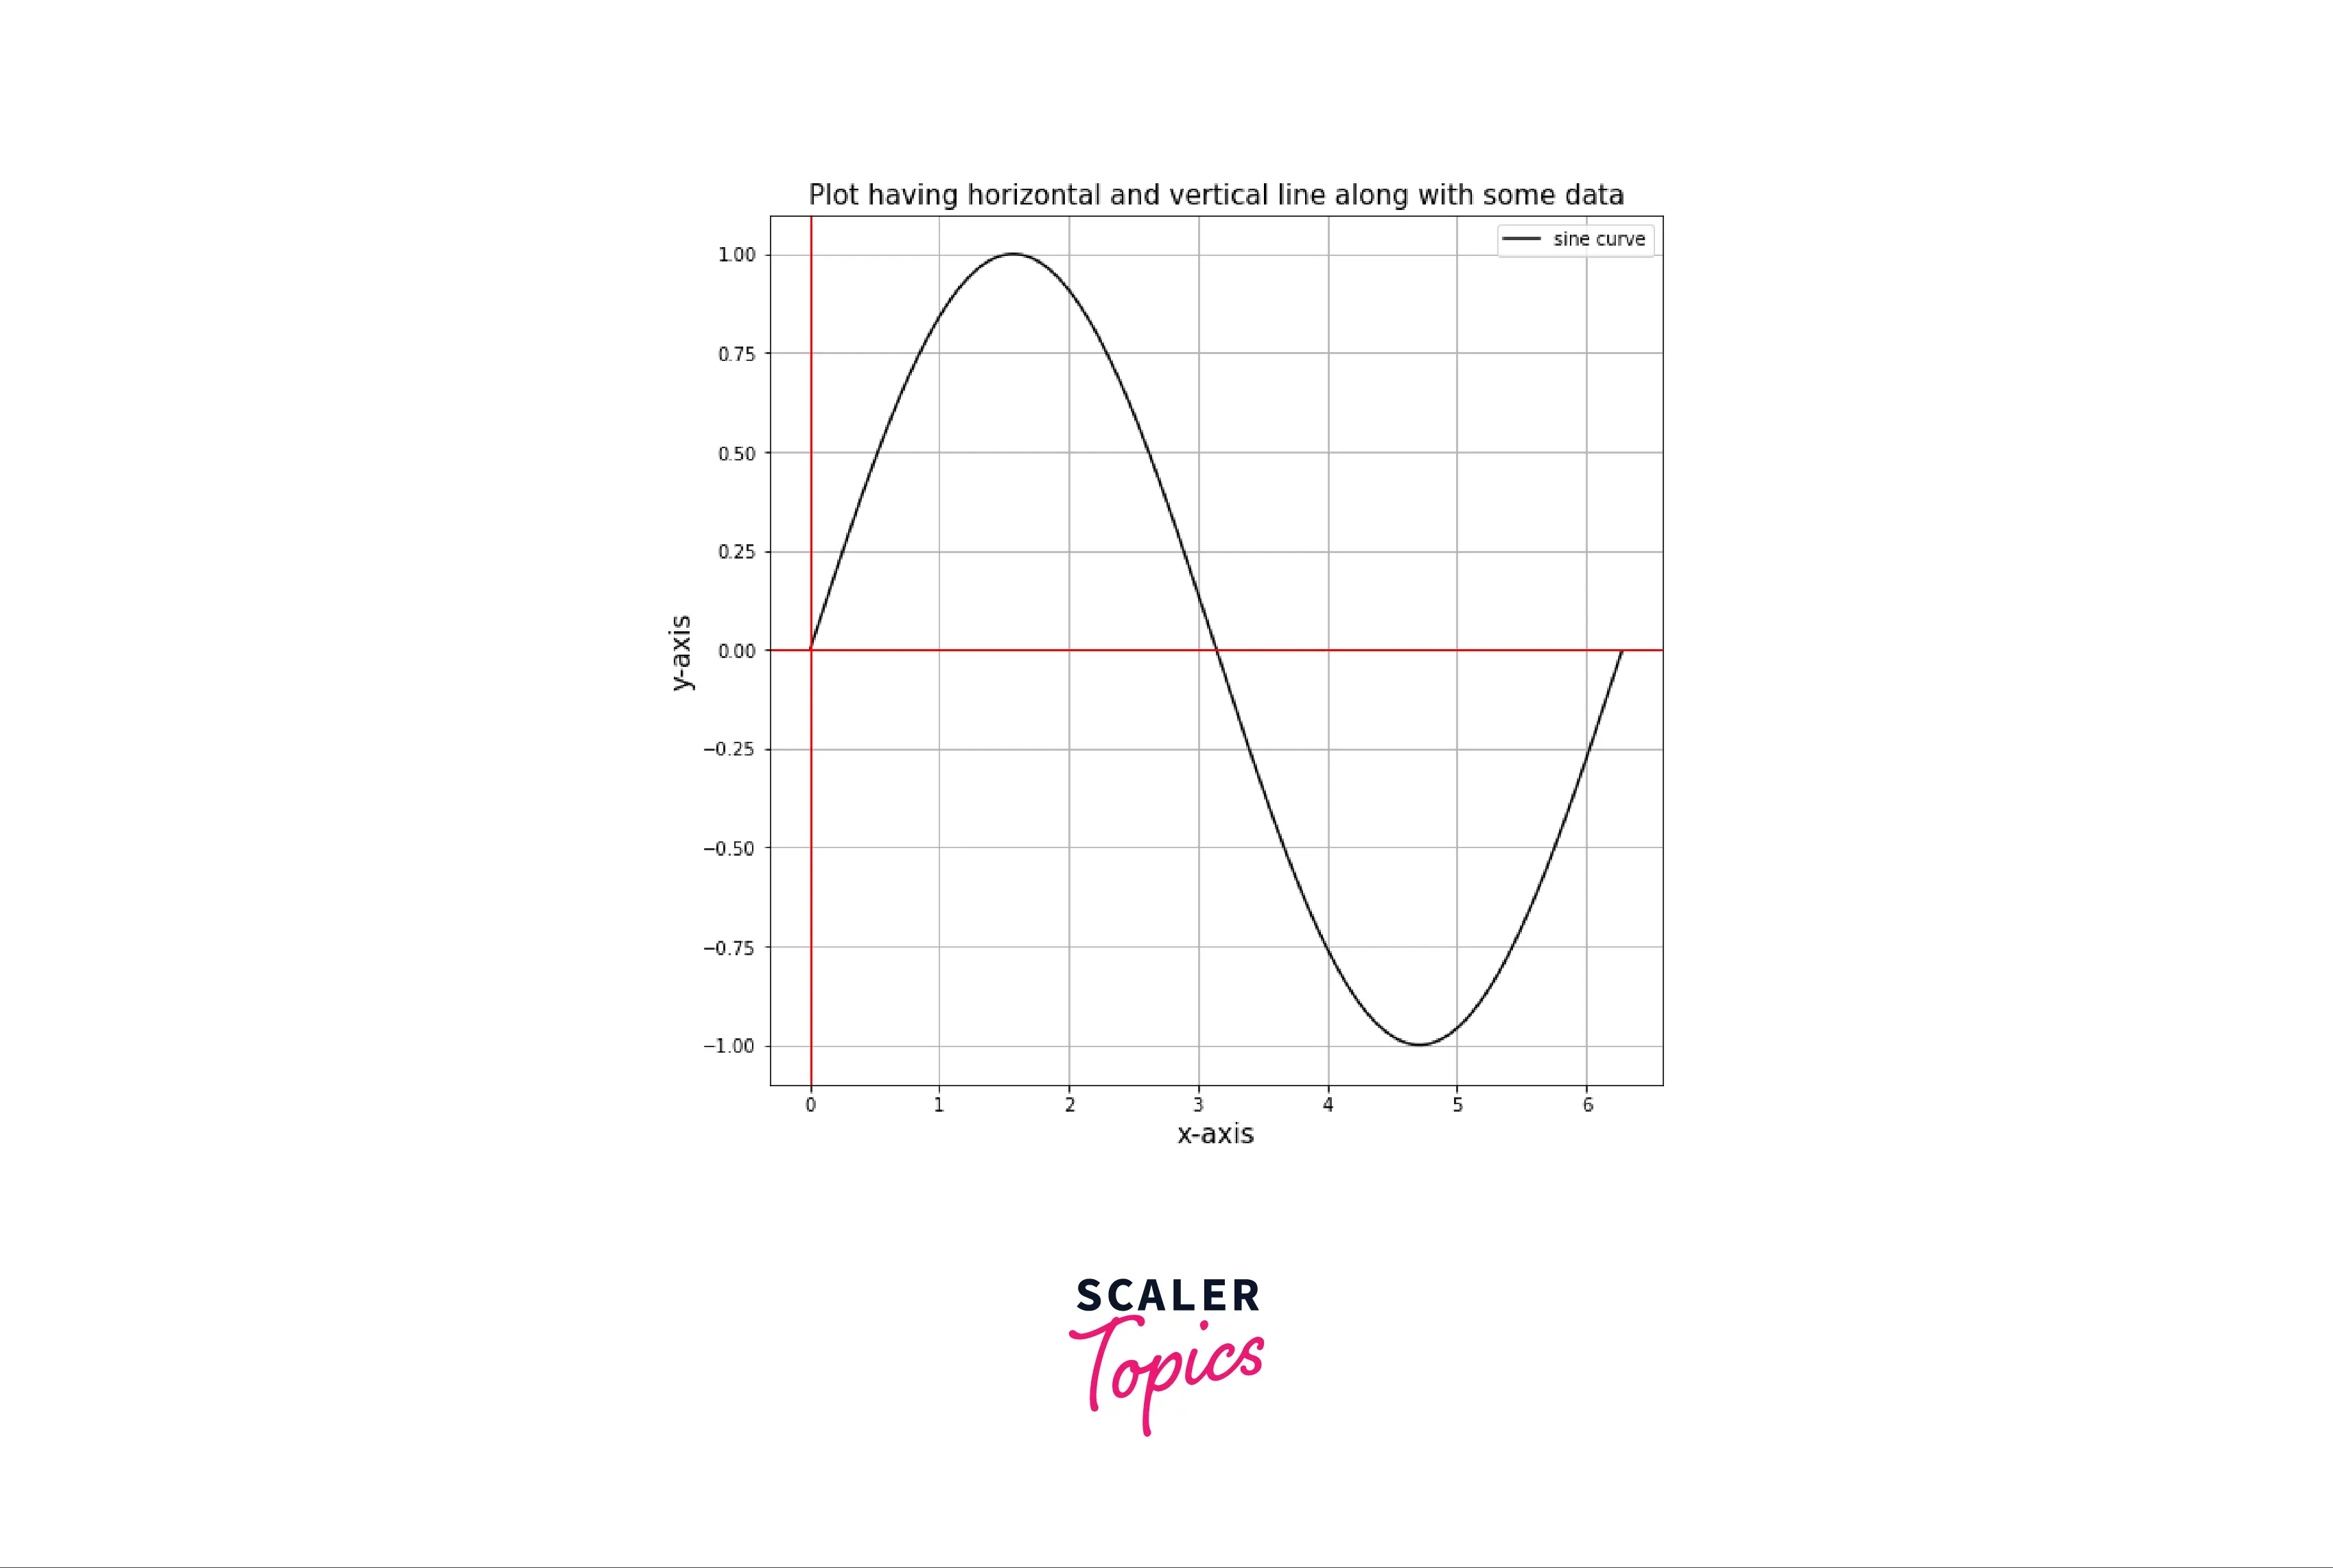
Example15: Plot having matplotlib horizontal and vertical lines along with some data
Accelerate Your Data Science Career with Our Industry-Expert-Led Data Science Online Course. Enroll Now and Earn Your Certification!
Conclusion
- Plotting a line on a figure requires two coordinates but plotting a line plot involves a set of coordinates that can be stored in a list.
- Multiple lines can be plotted on the same figure.
- We can also change the properties of a line like color, line style, line width, marker, marker size, markeredge, etc.
- matplotlib.pyplot.plot() and matplotlib.lines.Line2D() are the two functions used to add lines on a figure in matplotlib.
- matplotlib.pyplot.axhline() and matplotlib.pyplot.axvline() are used to add matplotlib horizontal and matplotlib vertical lines in a figure.
