How To Calculate Normal Distribution in Excel?
The normal distribution, also known as the Gaussian distribution or bell curve, is a fundamental statistical concept widely used in data analysis. Excel provides several functions to work with normal distributions, allowing users to calculate probabilities, generate random numbers, and perform various statistical analyses.
In Excel, the normal distribution is characterized by its mean (μ) and standard deviation (σ). The mean represents the central value around which the data is distributed, while the standard deviation measures the spread or dispersion of the data points.
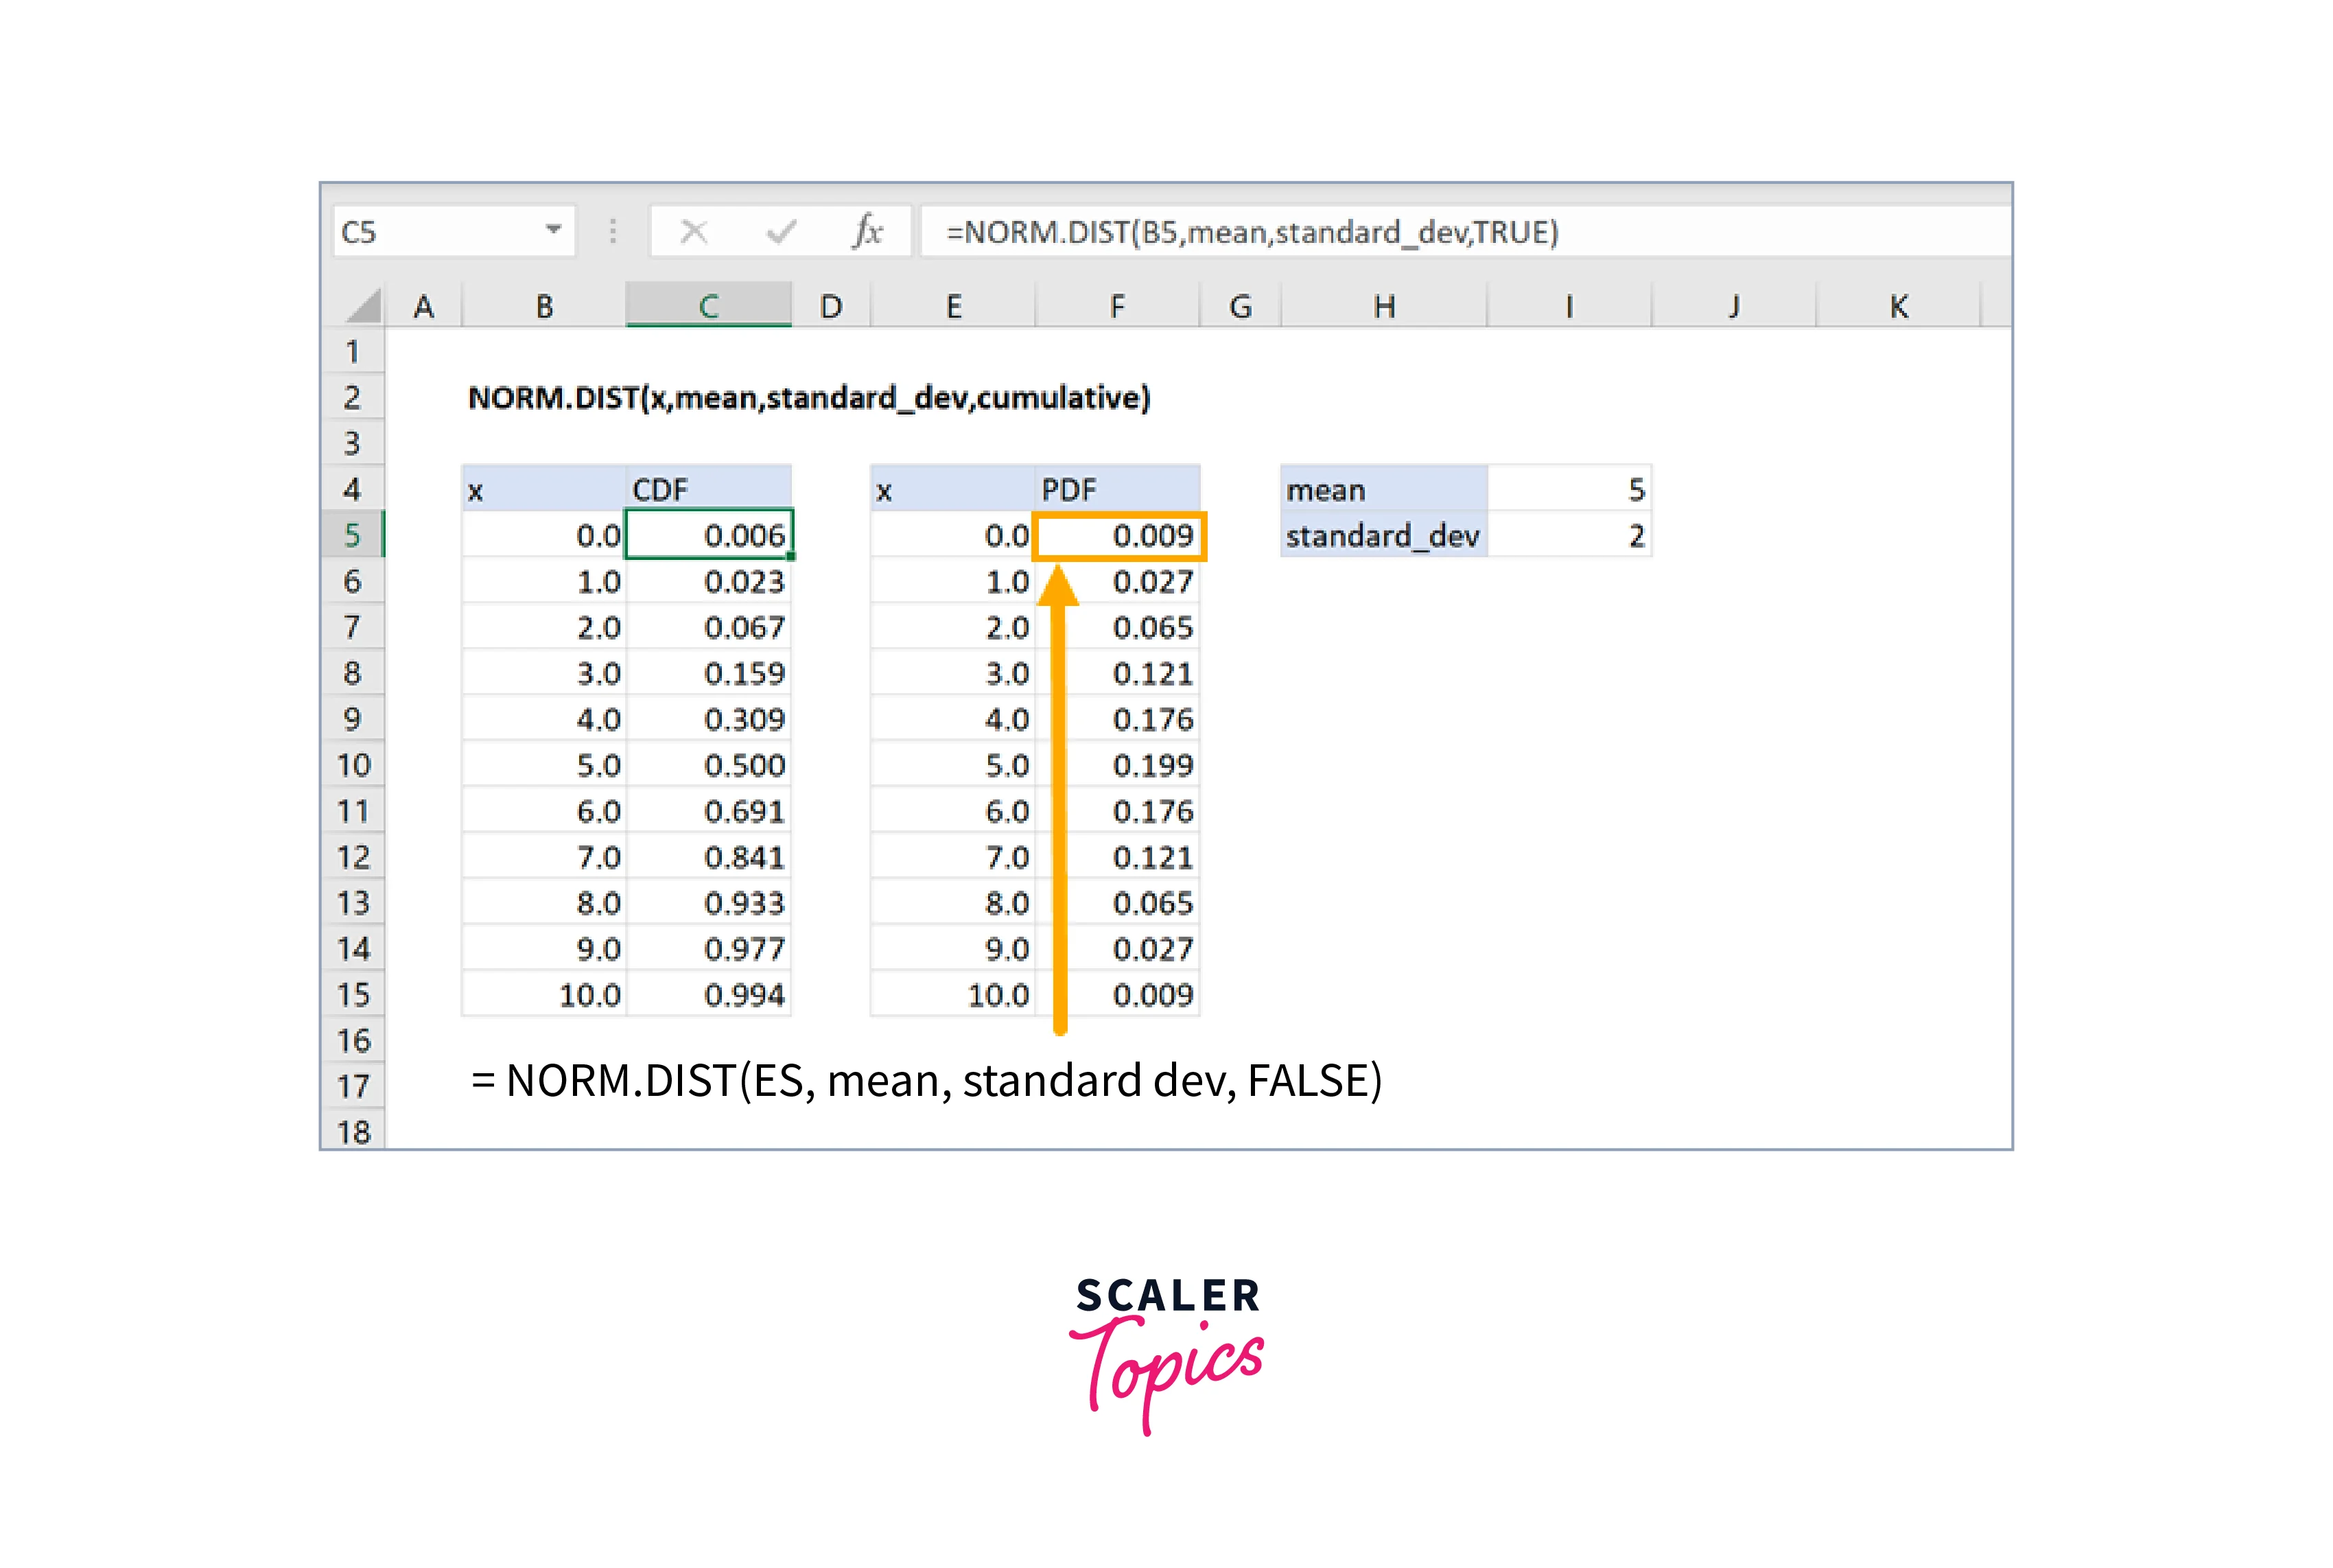
To calculate probabilities associated with the normal distribution, Excel provides the NORM.DIST function. This function takes input arguments such as the x-value (the data point of interest), the mean, the standard deviation, and whether the result should be cumulative or not. By using this function, you can determine the probability of a given value occurring within a certain range in a normally distributed dataset.
For example, suppose you have a dataset with a mean of 50 and a standard deviation of 10. You want to know the probability of a data point being less than or equal to 60. You can use the NORM.DIST function in Excel as follows: "=NORM.DIST(60, 50, 10, TRUE)". The result will be the cumulative probability associated with the value 60 in the given normal distribution.
In addition to calculating probabilities, Excel allows you to generate random numbers that follow a normal distribution. The NORM.INV function is used for this purpose. Given a probability value (between 0 and 1), the mean, and the standard deviation, this function generates a random value that corresponds to that probability within the specified normal distribution.
Arguments of the NORM.DIST Function
The NORM.DIST function in Excel is used to calculate the probability of a value occurring in a normal distribution. It takes several arguments that specify the inputs necessary for the calculation. Here are the arguments of the NORM.DIST function explained in detail:
- X (required): This argument represents the value for which you want to calculate the probability in the normal distribution. It can be a number or a reference to a cell containing a number.
- Mean (required): The mean argument specifies the average or central value of the distribution. It represents the location of the peak of the bell curve. It can be a number or a reference to a cell containing a number.
- Standard_dev (required): The standard_dev argument represents the standard deviation of the distribution. It measures the spread or dispersion of the data points around the mean. It can be a number or a reference to a cell containing a number.
- Cumulative (optional): This argument determines whether the function returns a cumulative probability or not. If it is set to TRUE or omitted, the function calculates the cumulative probability. If set to FALSE, the function returns the probability density function (PDF) value. The cumulative argument can be either TRUE, FALSE, 1, or 0.
How to calculate Normal Distribution in Excel?
Calculating the normal distribution in Excel involves using the NORM.DIST function. This function allows you to calculate the probability density or cumulative distribution of a random variable following a normal distribution. Here's a step-by-step guide on how to perform normal distribution calculations in Excel:
-
Step 1: Understand the NORM.DIST Function Syntax The syntax of the NORM.DIST function in Excel is as follows:
- x: The value for which you want to calculate the probability density or cumulative distribution.
- mean: The mean or average value of the normal distribution.
- standard_dev: The standard deviation of the normal distribution.
- **cumulative:**A logical value (TRUE/FALSE) that determines whether you want to calculate the cumulative distribution (TRUE) or the probability density (FALSE).
-
Step 2: Enter the Data Set up your Excel spreadsheet by entering the necessary data. In this case, you need the x value, mean, standard_dev, and cumulative values. Assign these values to specific cells in the spreadsheet for ease of calculation.
-
Step 3: Apply the NORM.DIST Function To calculate the normal distribution, use the NORM.DIST function and provide the appropriate arguments. Here are two common scenarios:
- Calculating Probability Density: If you want to calculate the probability density, set the cumulative argument to FALSE. In this case, the NORM.DIST function will return the probability of the exact x value occurring. For example, to calculate the probability density of an x value of 2 with a mean of 0 and standard deviation of 1, use the following formula:
This will give you the probability density of x = 2 in the specified normal distribution.
- Calculating Cumulative Distribution: If you want to calculate the cumulative distribution, set the cumulative argument to TRUE. In this case, the NORM.DIST function will return the probability that a value is less than or equal to the given x value. For example, to calculate the cumulative distribution up to an x value of 2 with a mean of 0 and standard deviation of 1, use the following formula:
This will give you the cumulative probability up to x = 2 in the specified normal distribution.
- Step 4: Interpret the Results After applying the NORM.DIST function, Excel will calculate and display the result based on the specified arguments. The output will be a probability value between 0 and 1, representing the probability density or cumulative probability.
- Step 5: Optional Formatting If desired, you can format the result to display it as a percentage or use decimal places to represent the probability value more appropriately.
- Step 6: Perform Additional Calculations You can repeat the process by applying the NORM.DIST function with different values for x, mean, standard_dev, and cumulative to calculate probabilities or cumulative probabilities at different points within the normal distribution.
How to Use NORMDIST in Excel?
To use the NORMDIST function in Excel, which calculates the probability density of a random variable following a normal distribution, follow these steps:
-
Step 1: Understand the NORMDIST Function Syntax The syntax of the NORMDIST function in Excel is as follows:
- x: The value for which you want to calculate the probability density or cumulative distribution.
- mean: The mean or average value of the normal distribution.
- standard_dev: The standard deviation of the normal distribution.
- cumulative: A logical value (TRUE/FALSE) that determines whether you want to calculate the cumulative distribution (TRUE) or the probability density (FALSE).
-
Step 2: Enter the Data Set up your Excel spreadsheet and enter the necessary data. Assign the values for x, mean, standard_dev, and cumulative to specific cells in the spreadsheet for ease of calculation.
-
Step 3: Apply the NORMDIST Function To calculate the normal distribution, use the NORMDIST function and provide the appropriate arguments based on your requirements. Here are two common scenarios:
- Calculating Probability Density: If you want to calculate the probability density, set the cumulative argument to FALSE. This will return the probability of the exact x value occurring. For example, to calculate the probability density of an x value of 2 with a mean of 0 and standard deviation of 1, use the following formula:
This will give you the probability density of x = 2 in the specified normal distribution.
- **Calculating Cumulative Distribution: **If you want to calculate the cumulative distribution, set the cumulative argument to TRUE. This will return the probability that a value is less than or equal to the given x value. For example, to calculate the cumulative distribution up to an x value of 2 with a mean of 0 and standard deviation of 1, use the following formula:
This will give you the cumulative probability up to x = 2 in the specified normal distribution. **
-
Step 4: Interpret the Results After applying the NORMDIST function, Excel will calculate and display the result based on the specified arguments. The output will be a probability value between 0 and 1, representing the probability density or cumulative probability.
-
Step 5: Optional Formatting If desired, you can format the result to display it as a percentage or use decimal places to represent the probability value more appropriately.
-
Step 6: Perform Additional Calculations You can repeat the process by applying the NORMDIST function with different values for x, mean, standard_dev, and cumulative to calculate probabilities or cumulative probabilities at different points within the normal distribution.
Characteristics of the Normal Distribution Function
The Normal Distribution Function in Excel, represented by the NORM.DIST function, has several characteristics that make it a versatile and powerful tool for working with normal distributions. Here are some key characteristics:
*** Probability Calculation:** The NORM.DIST function calculates the probability of a value occurring in a normal distribution. It allows you to determine the likelihood of a data point falling within a specific range of values. By providing the X value (the data point of interest), the function uses the mean and standard deviation to compute the probability associated with that value.
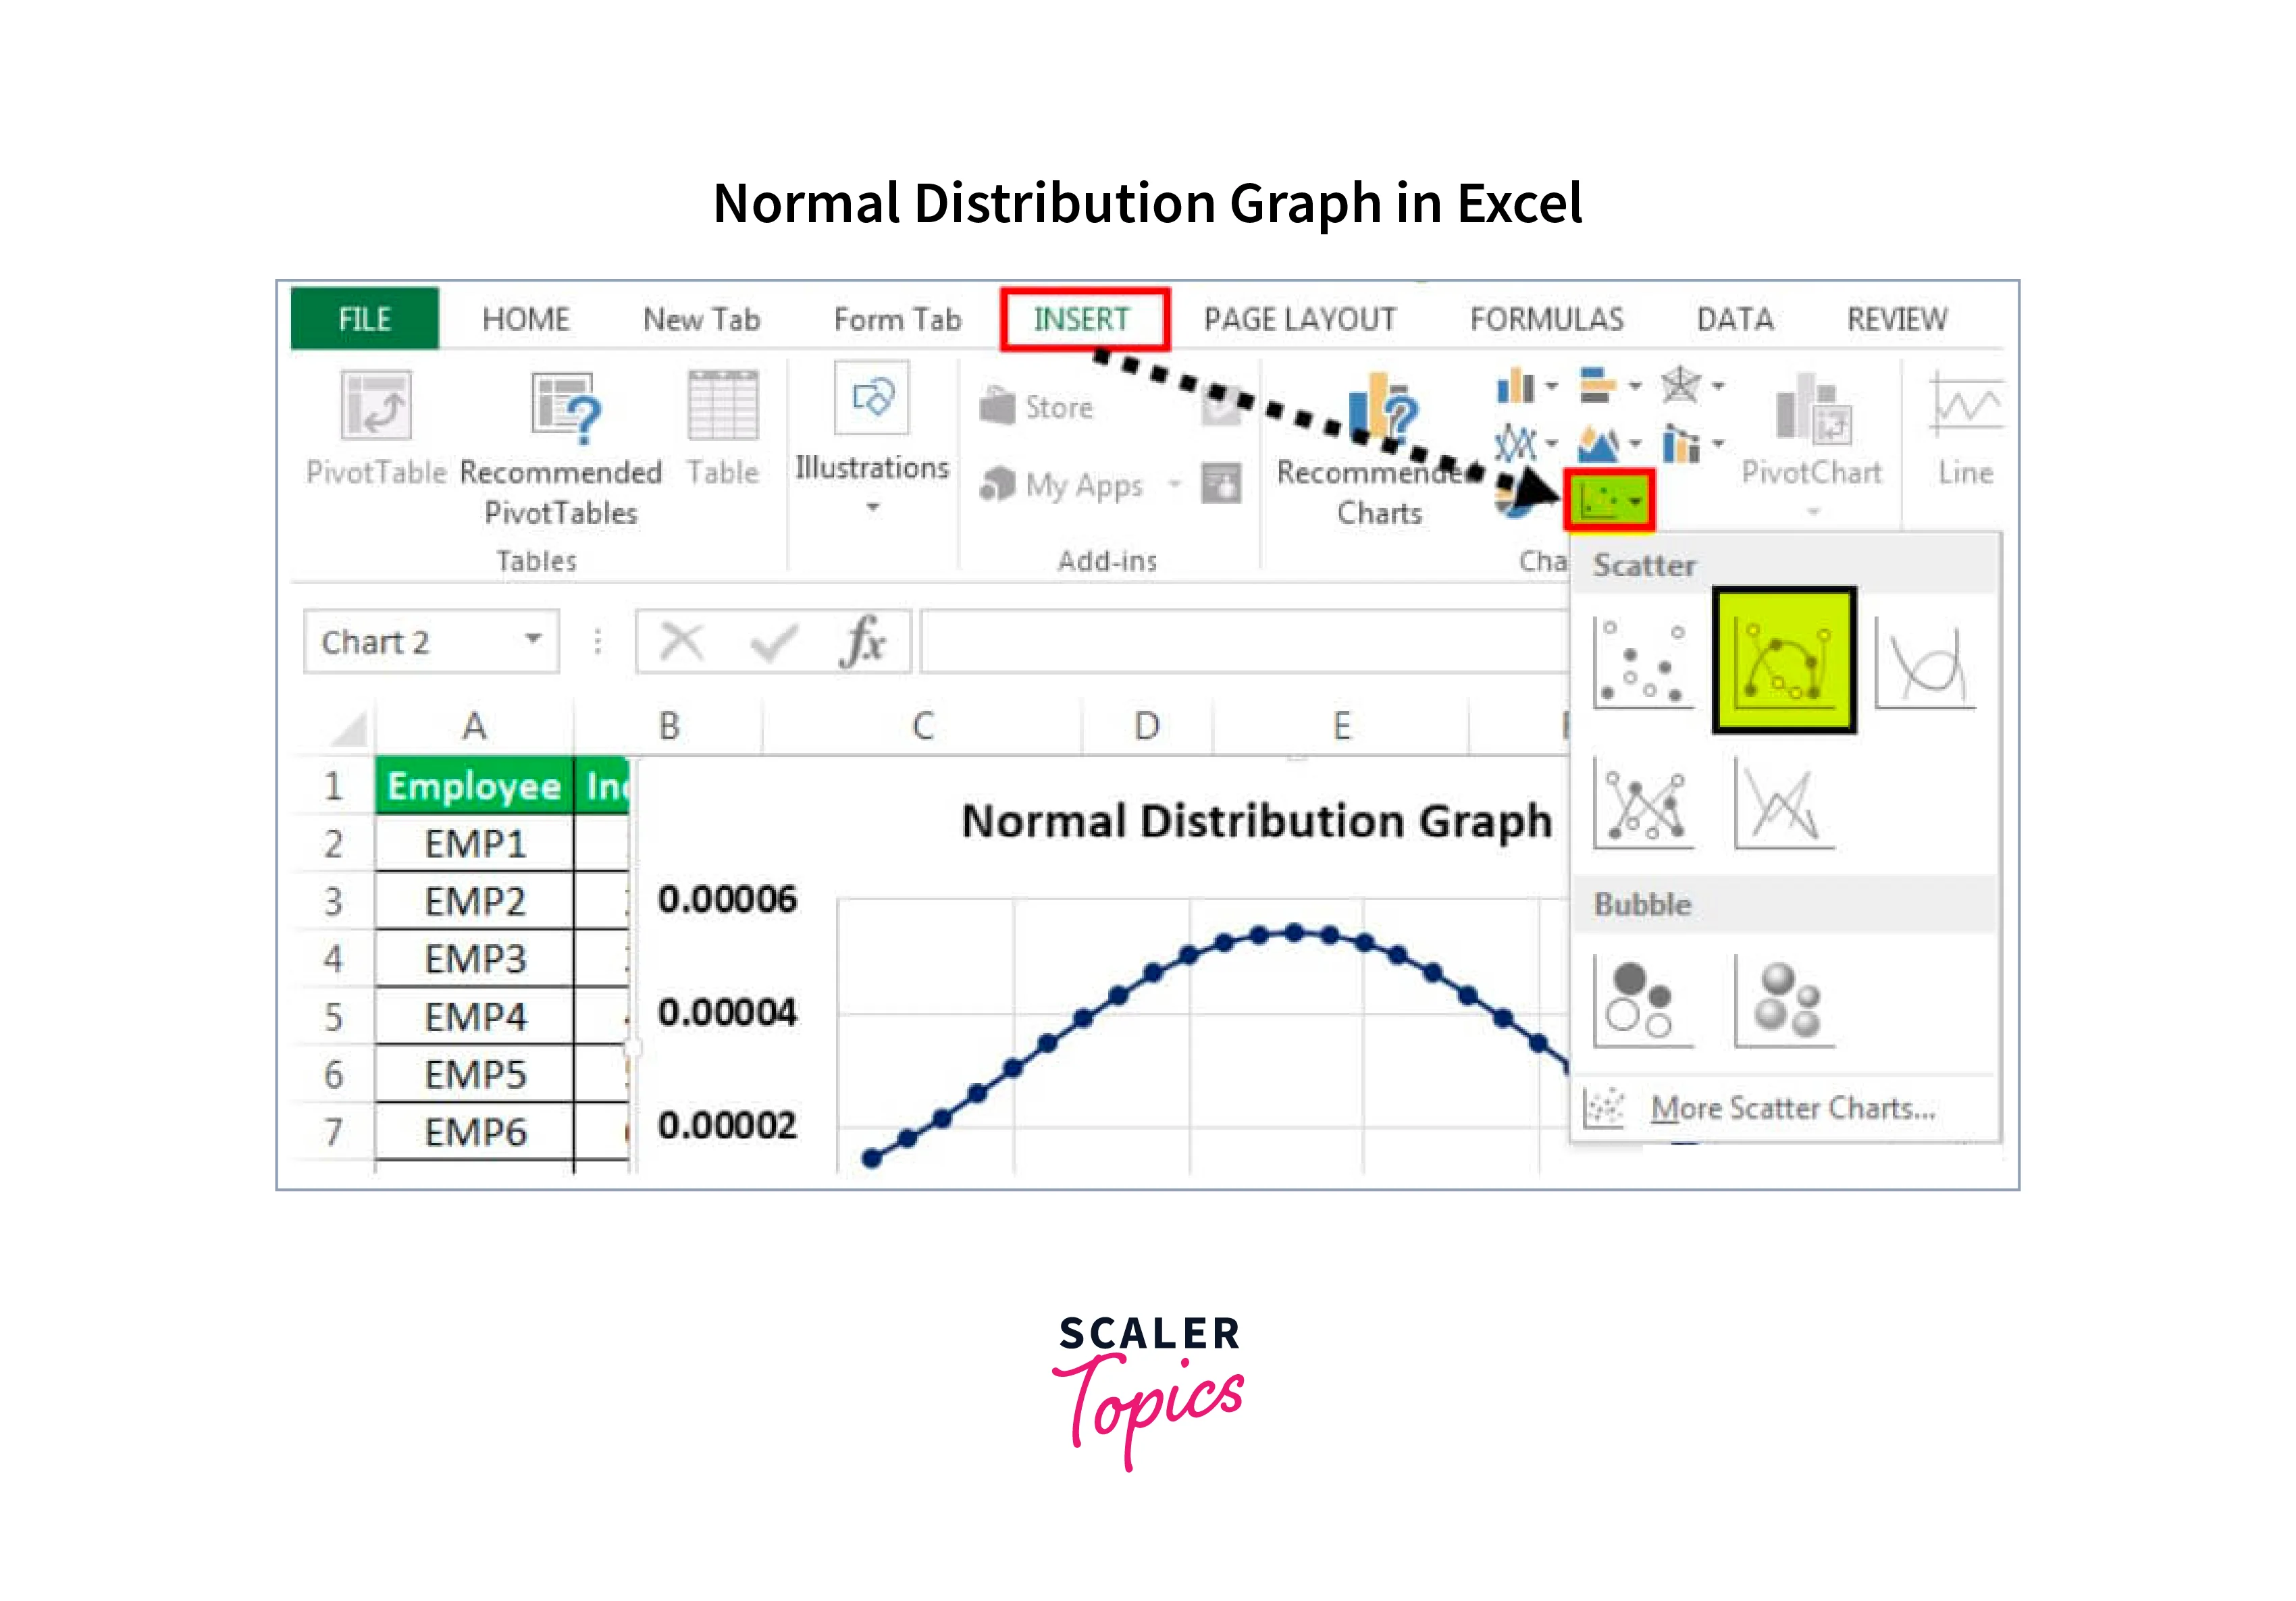
- Bell-shaped Curve: The normal distribution is characterized by its bell-shaped curve. The NORM.DIST function takes this shape into account, allowing you to model and analyze data that follow a symmetrical distribution. The function uses the mean to determine the center of the curve and the standard deviation to control the spread or dispersion of the data.
- Mean (μ): The mean, represented by the Mean argument in the NORM.DIST function, is the average or central value of the normal distribution. It defines the location of the peak of the bell curve. By adjusting the mean, you can shift the entire distribution along the x-axis.
- Standard Deviation (σ): The standard deviation, indicated by the Standard_dev argument, measures the spread or dispersion of the data points around the mean. It determines the width of the bell curve. A smaller standard deviation results in a narrower curve, while a larger standard deviation leads to a wider curve.
- Cumulative Probability: The NORM.DIST function allows you to calculate both cumulative probabilities and probability density function (PDF) values. By setting the Cumulative argument to TRUE (or omitting it), the function computes the cumulative probability. This provides the probability of a value being less than or equal to the given X value. Setting the Cumulative argument to FALSE returns the PDF value, which represents the probability density at the specific X value.
- Flexibility: Excel's NORM.DIST function is highly flexible. It enables you to input values directly or refer to cell references. This flexibility allows you to easily analyze and manipulate large datasets by using formulas that dynamically update based on changes in the data.
- Range Exclusion or Inclusion: The NORM.DIST function offers additional optional arguments for excluding or including specific values or ranges in the probability calculation. The Not_including argument allows you to exclude a certain value or range when calculating cumulative probabilities, while the Not_excluding argument includes a specific value or range when calculating PDF values.
- Random Number Generation: Excel's NORM.DIST function is not only used for probability calculations but also for generating random numbers that follow a normal distribution. By combining the NORM.DIST function with other Excel functions, such as NORM.INV or RAND, you can generate random values consistent with a specified normal distribution.
- Standardization: Excel's NORM.DIST function allows for standardizing values using z-scores. Standardization transforms data into a standard normal distribution with a mean of 0 and a standard deviation of 1. By subtracting the mean and dividing by the standard deviation, you can convert any value into a standardized z-score. This is useful for comparing values across different distributions or determining the relative position of a value within a distribution.
Conclusion
- The function allows you to calculate the probability density and cumulative distribution of a random variable following a normal distribution.
- The NORM.DIST function is highly flexible, allowing you to input different values for the random variable, mean, and standard deviation. This flexibility enables precise calculations tailored to specific datasets or scenarios.
- The Normal Distribution function is widely used in statistical analysis. It serves as a foundational tool for various statistical techniques, hypothesis testing, and confidence interval calculations.