What is Meshgrid function in NumPy?

The np.meshgrid function in NumPy (Python's popular scientific computing library), provides an easy way to do matrix computations. Meshgrid is a blend of two terms, "mesh" and "grid," both of which indicate a network-like architecture. The Meshgrid technique's primary goal is to create such structures. Data analysts might benefit from such array operations. For illustration, if we already possess a database of pricing for a group of items sorted by the amount and we wish to convert all values to a common currency, array multiplication will most certainly be the quickest option to alter the prices.
Let's take a step back and refresh our memory on Matrices in python before we get started. A matrix is a two-dimensional or multidimensional grid-like numerical arrangement. A matrix's numbers are grouped into rows and columns. Matrices provide operations like addition, multiplication, and elevating elements to power. Employing matrices enables us to execute linear algebra, which allows us to execute numerous operations on many numbers effectively.
Now that we've covered Matrices in NumPy, let's look at the syntax of the numpy.meshgrid() method, which is used to produce coordinate matrices from provided coordinate vectors.
Syntax
Parameter
The following parameters are sent to the numpy.meshgrid() function:
| Sr NO. | Parameter Name | Parameter Description |
|---|---|---|
| 1 | *xi or x1,x2,x3…xn | These are 1-dimensional vectors that also represent grid coordinates. |
| 2 | indexing | It is a purely optional argument. This argument specifies whether the output is cartesian ('xy', default) or matrix-indexed. |
| 3 | sparse | It is a purely optional argument. This function accepts a Boolean value. If True, the output coordinate array's form for dimension i is decreased from (y1,..., yi,..., yn) to (1, ..., 1, yi, 1, ..., 1). This argument's default value is False. |
| 4 | copy | It is an optional parameter. This function accepts a Boolean value. If the parameter is set to 'false,' the original array's view is returned to save memory. This argument's default value is False. |
Let's look at an example to better understand the numpy.meshgrid() function. Assume we wish to make a 5×3 cartesian grid with x values ranging from -2 to 2 and y values ranging from 0 to 2. That is, the ordered pairs of (x, y) coordinates will commence at (-2,0) and continue until (2,2). We must additionally save the x and y coordinates of each grid position individually.
Code :
Output:
We obtain two NumPy arrays of form 5×3 as output. The first array contains the x coordinates of every grid place, while the second has the matching y coordinates. If we select ordered pairs of the coordinates in the two arrays at the same places, we will receive the (x, y) coordinates of all points in our desired grid. For illustration, the values in the two arrays at position [0,0] reflect the position (-2,0). Position (-1,0) is represented by those at [1,0], and so on.
Applications of Meshgrid Function
numpy.meshgrid(), as seen in the preceding example, converts NumPy matrices into coordinate matrices, or grids of numbers. We can graphically display the two matrices from our previous example using the matplotlib package, a popular Python library for making plots and charts. The plot that results has a grid of numbers:
Code:
Output:
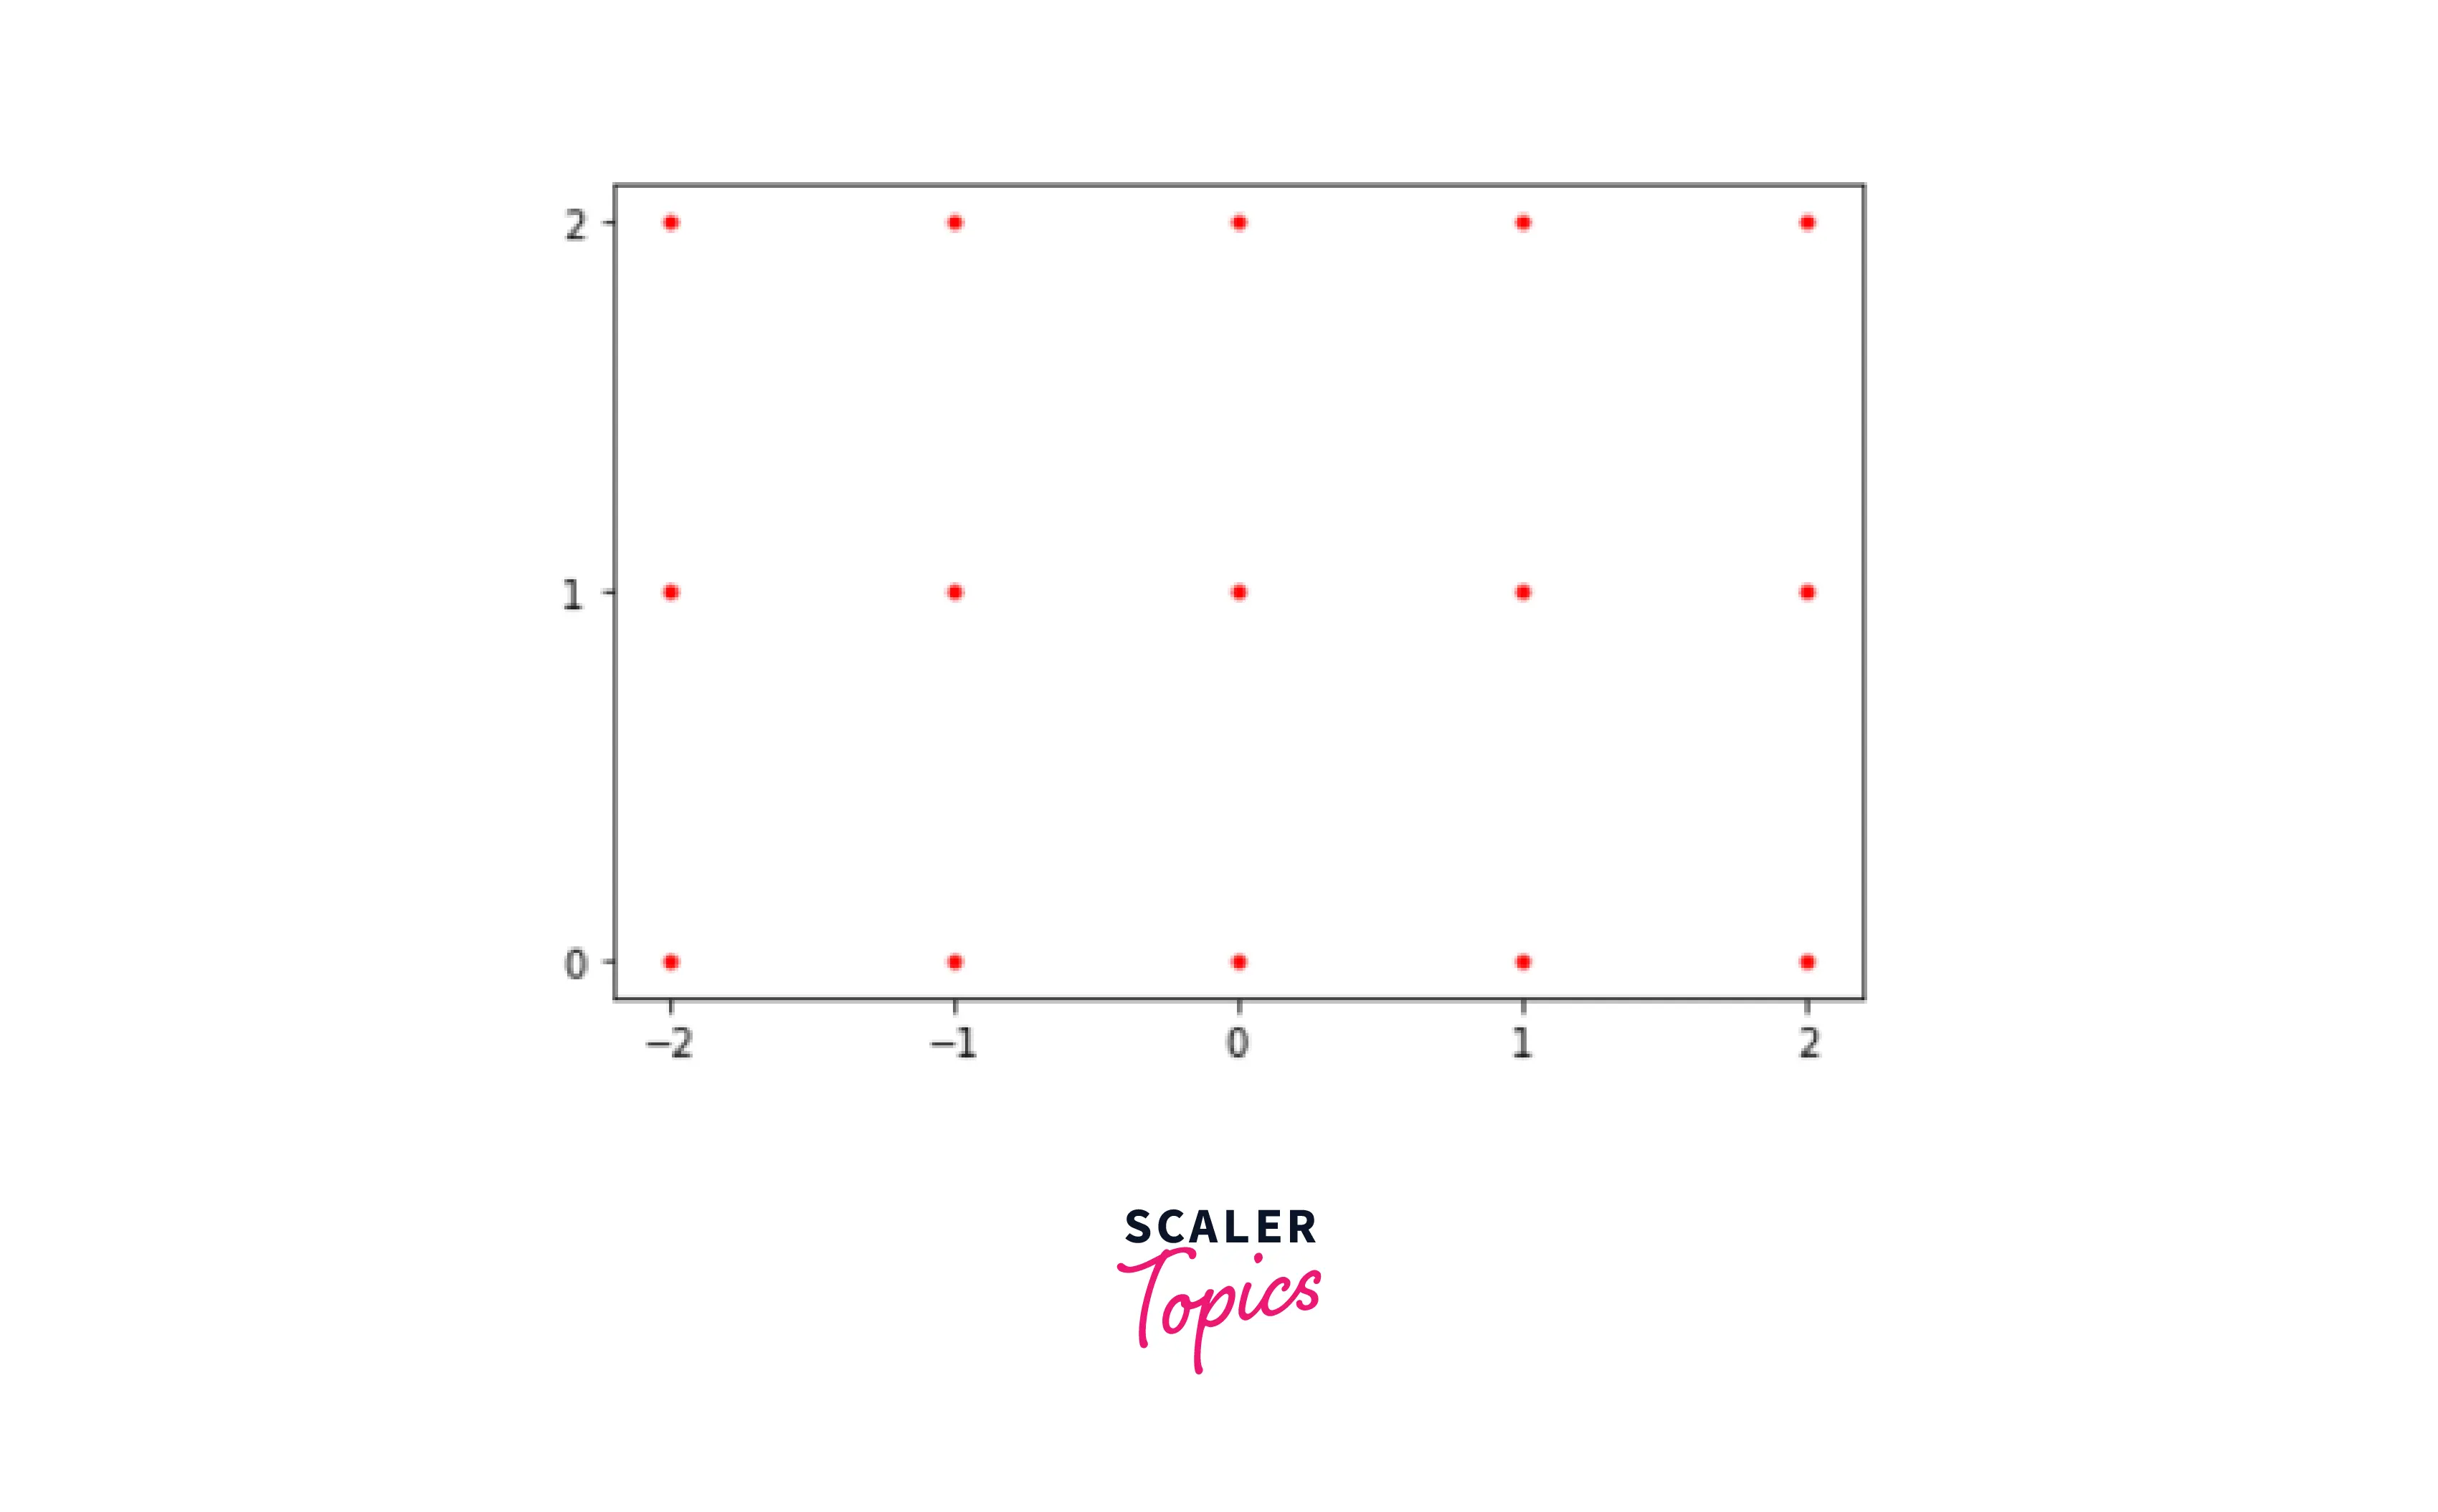
numpy.meshgrid(), as you have seen, may be effective in any situation in which we wish to create a well-defined two-dimensional or even multidimensional matrix or wish to be able to refer to any position in the matrix. However, data visualization is the most common use of meshgrids. Meshgrids play a vital role in visualizing patterns in data or plotting a function in a two-dimensional or three-dimensional environment by producing ordered pairings of dependent variables. Aside from that, if you've experimented with machine learning, you've most likely seen meshgrid in action. Meshgrid is frequently used to display a machine learning model's loss function and how the error margin of the outcomes predicted by the model diminishes as the model is trained and adjusts its parameters.
Let's look at how we can plot a function with a meshgrid
Plotting Two-Dimensional Functions
To plot a method, we'll need some extra code than we did in the previous part while displaying a basic matrix. To begin, we will define our function:
Code:
We'll run our function across the two arrays we generated before and save the output in the variable F:
Code:
Once it is completed, we will plot the output:
Code:
Output:
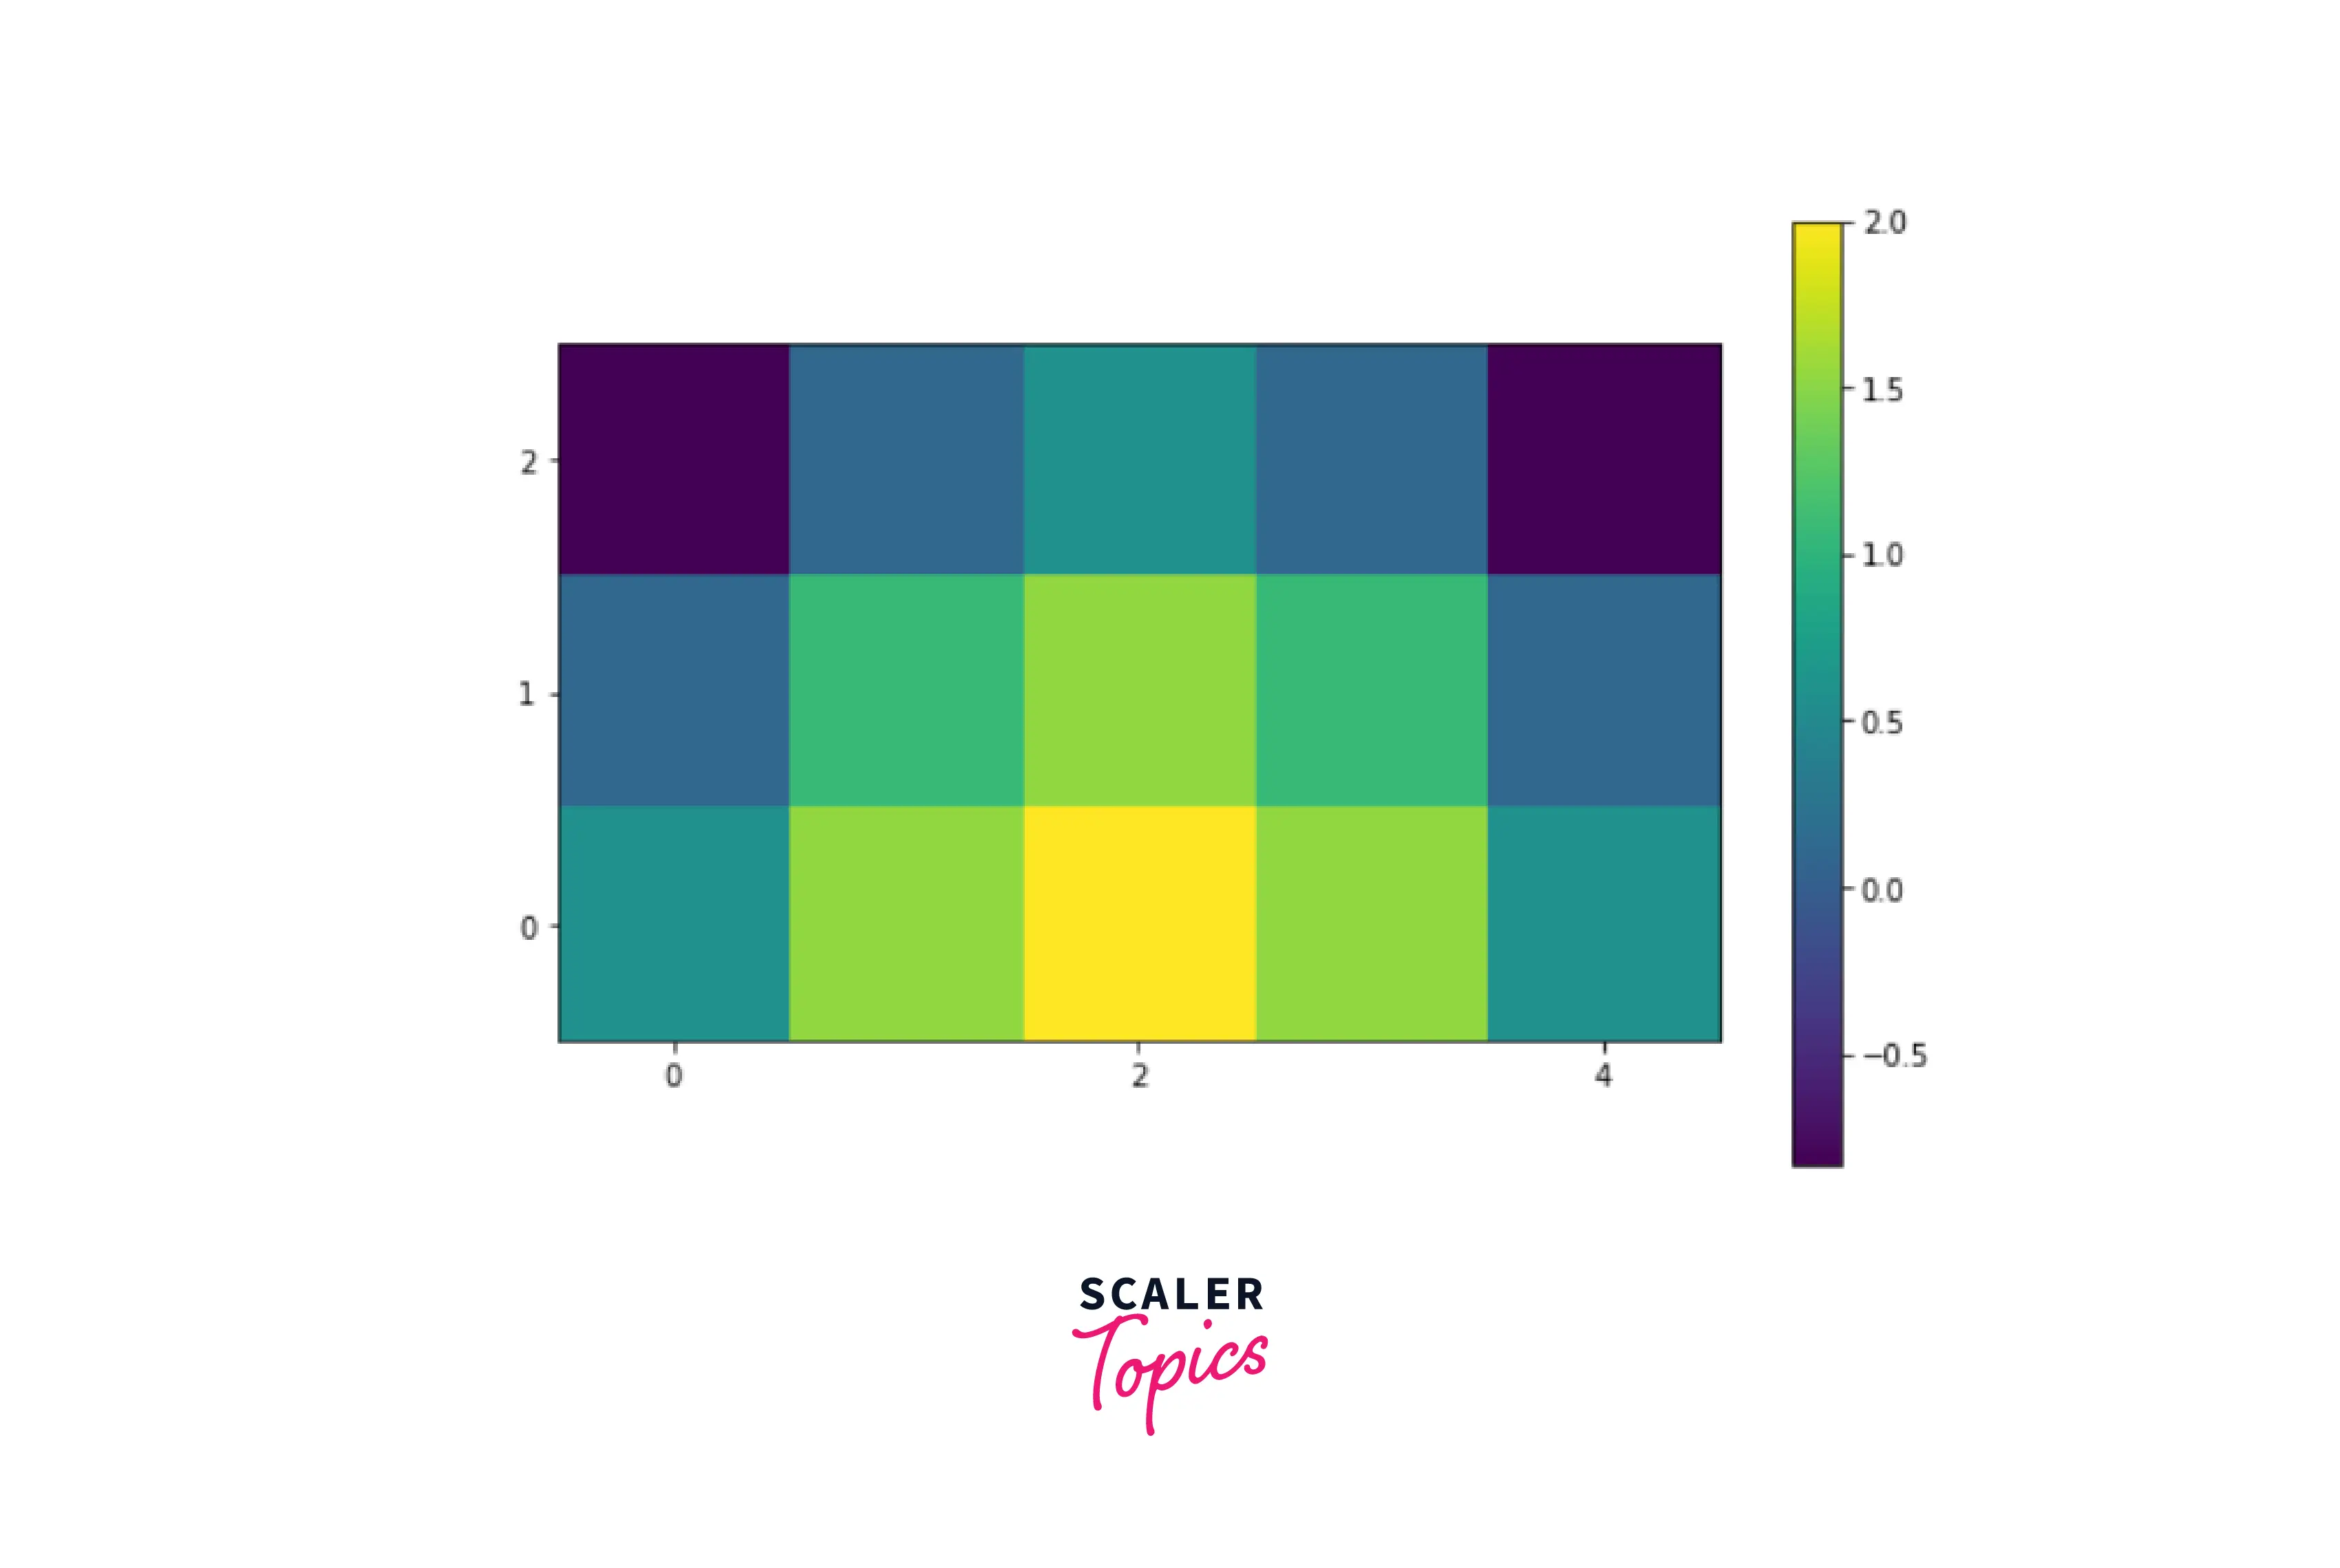
Unfortunately, because our 3x3 grid was too tiny to show the function's whole range of values, the resultant visualization lacks information that allows us to comprehend the behavior of our cosine function. Let's try it again with a bigger grid. We'll use NumPy's linspace function to generate two grids with 1000 linearly spaced values ranging from -5 to 5.
Code:
Output:
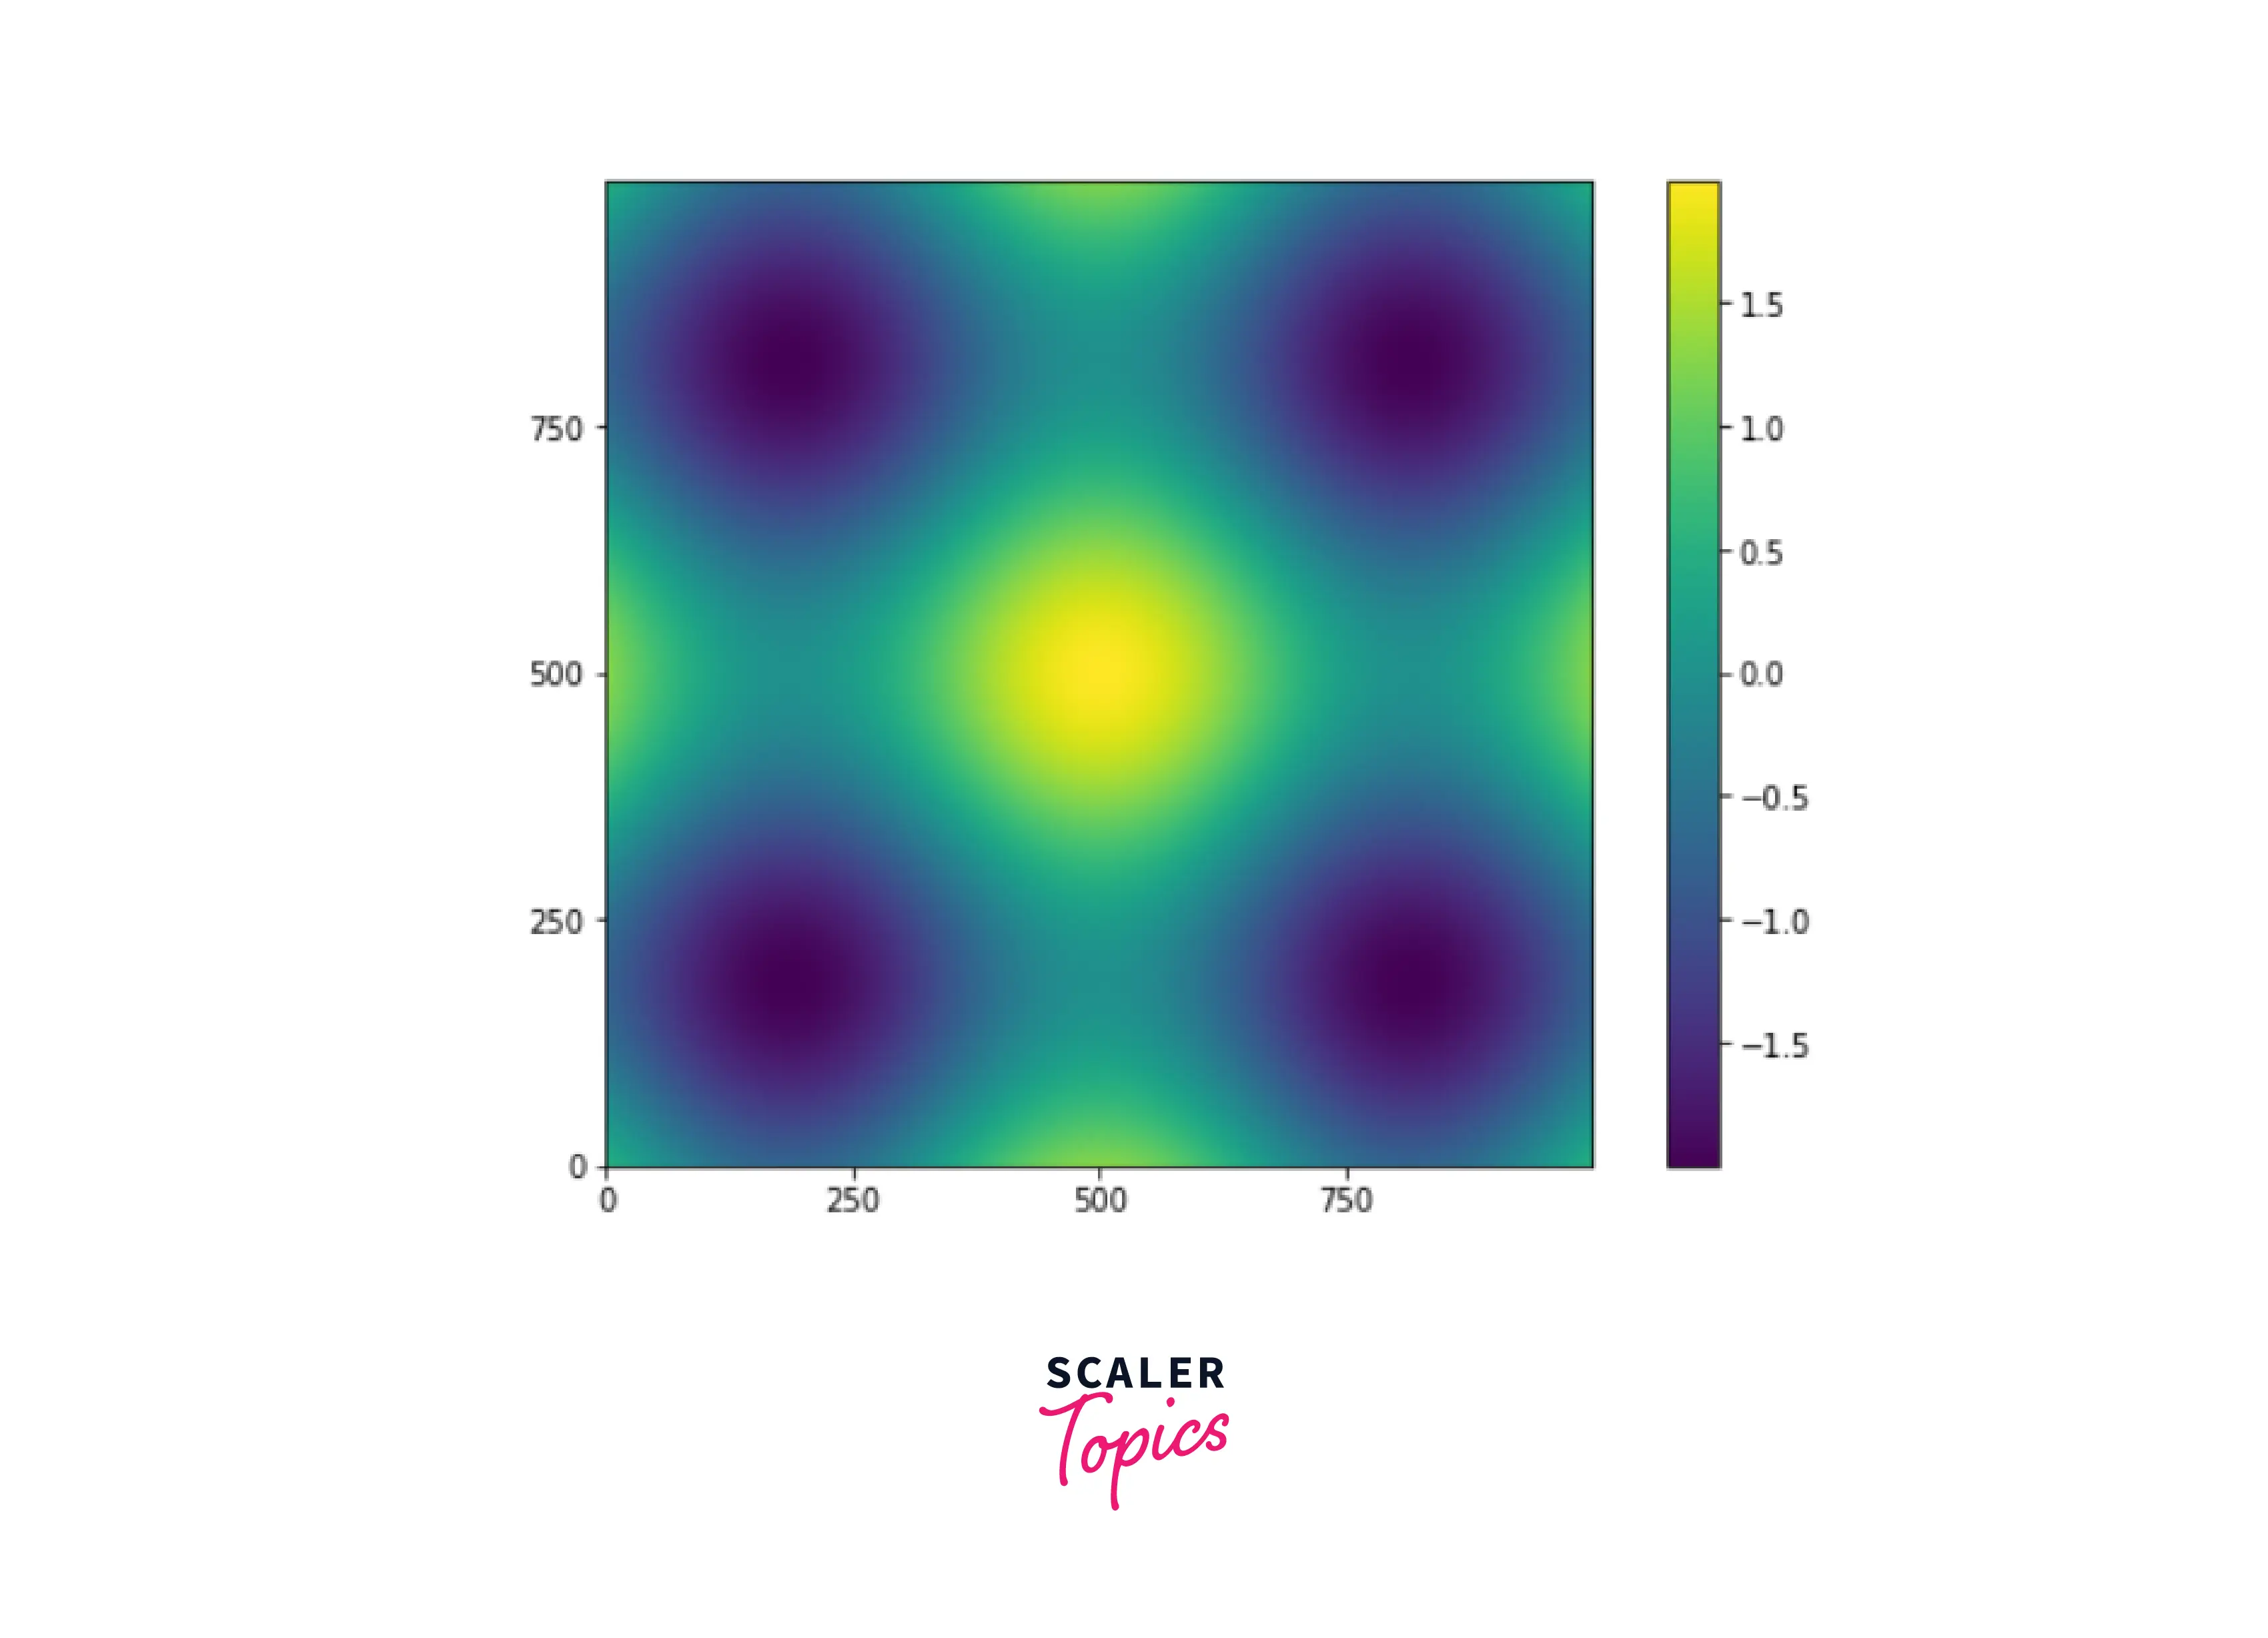
The new grid appears to be more detailed. We were able to observe the cosine function's unique periodicity by sampling the function on a bigger grid. Increasing the number of values makes the image smoother while lowering it makes it sharper.
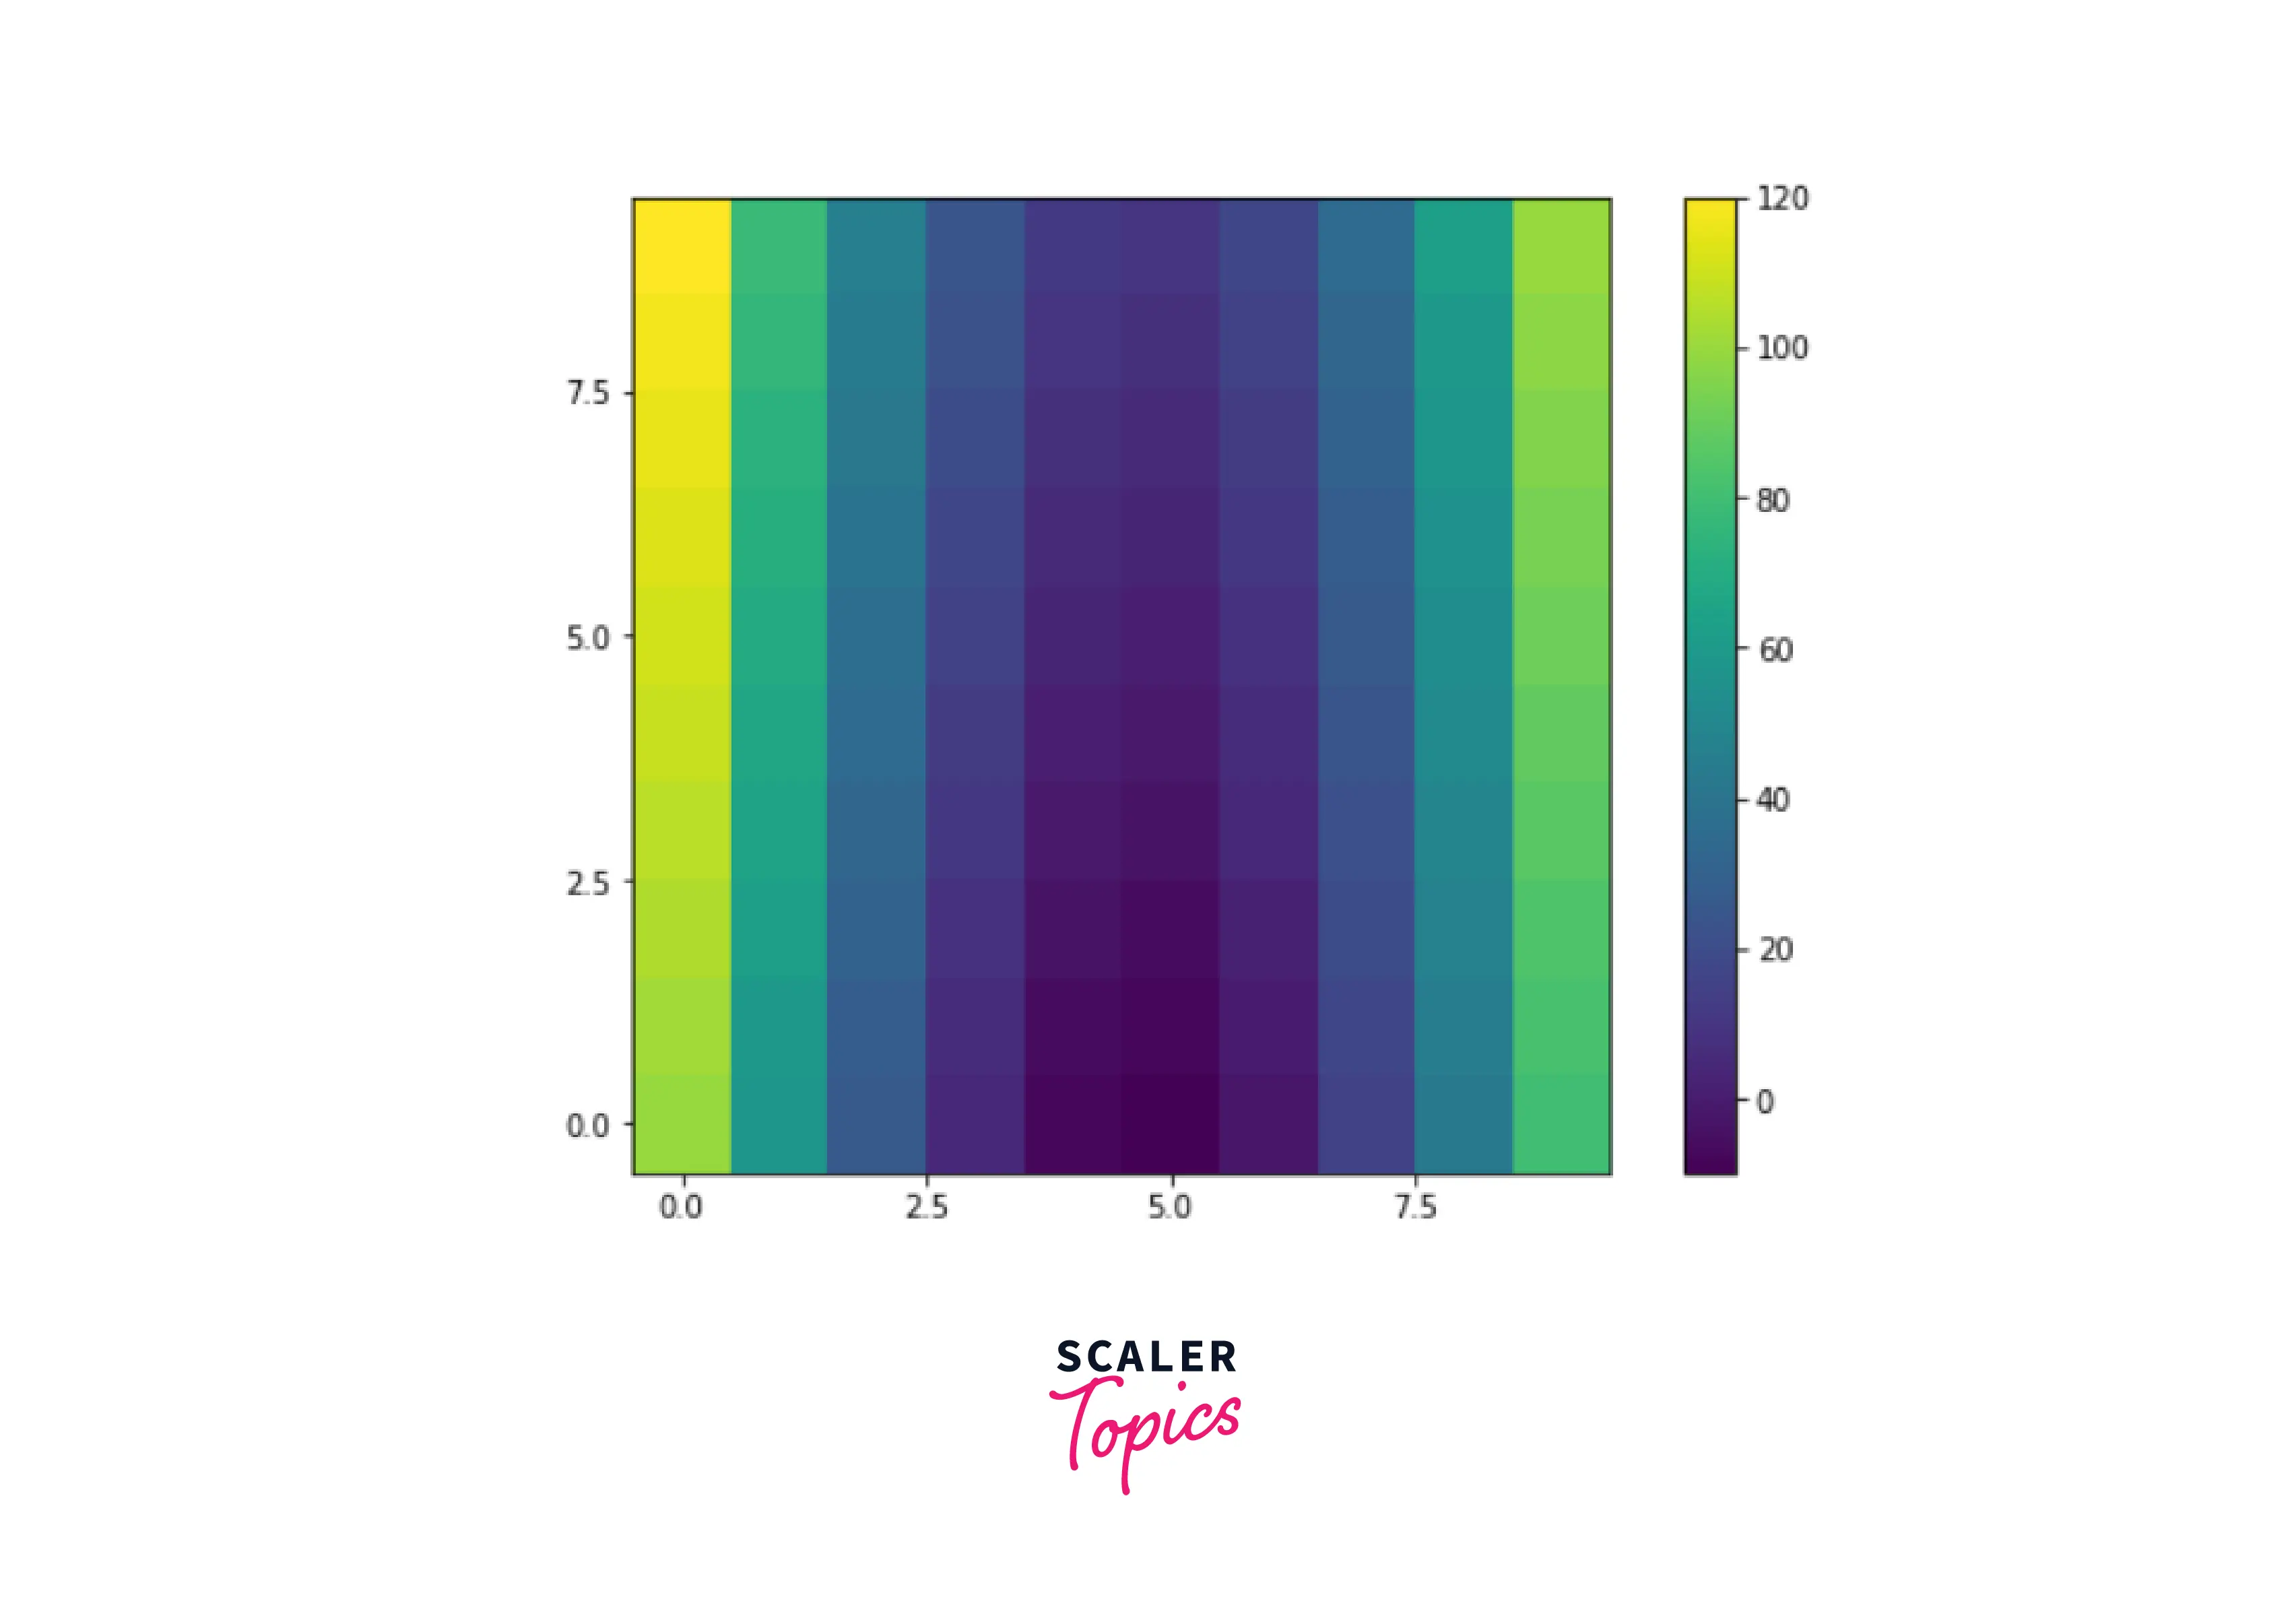
It is important to remember that any function may be plotted as long as it can be applied to the coordinates of the components in a matrix. Here's an additional illustration of a two-dimensional function:
Code:
Output:
Meshgrid may also be used to display polar coordinates. Let's see how it goes.
Creating a NumPy Polar Coordinates Meshgrid
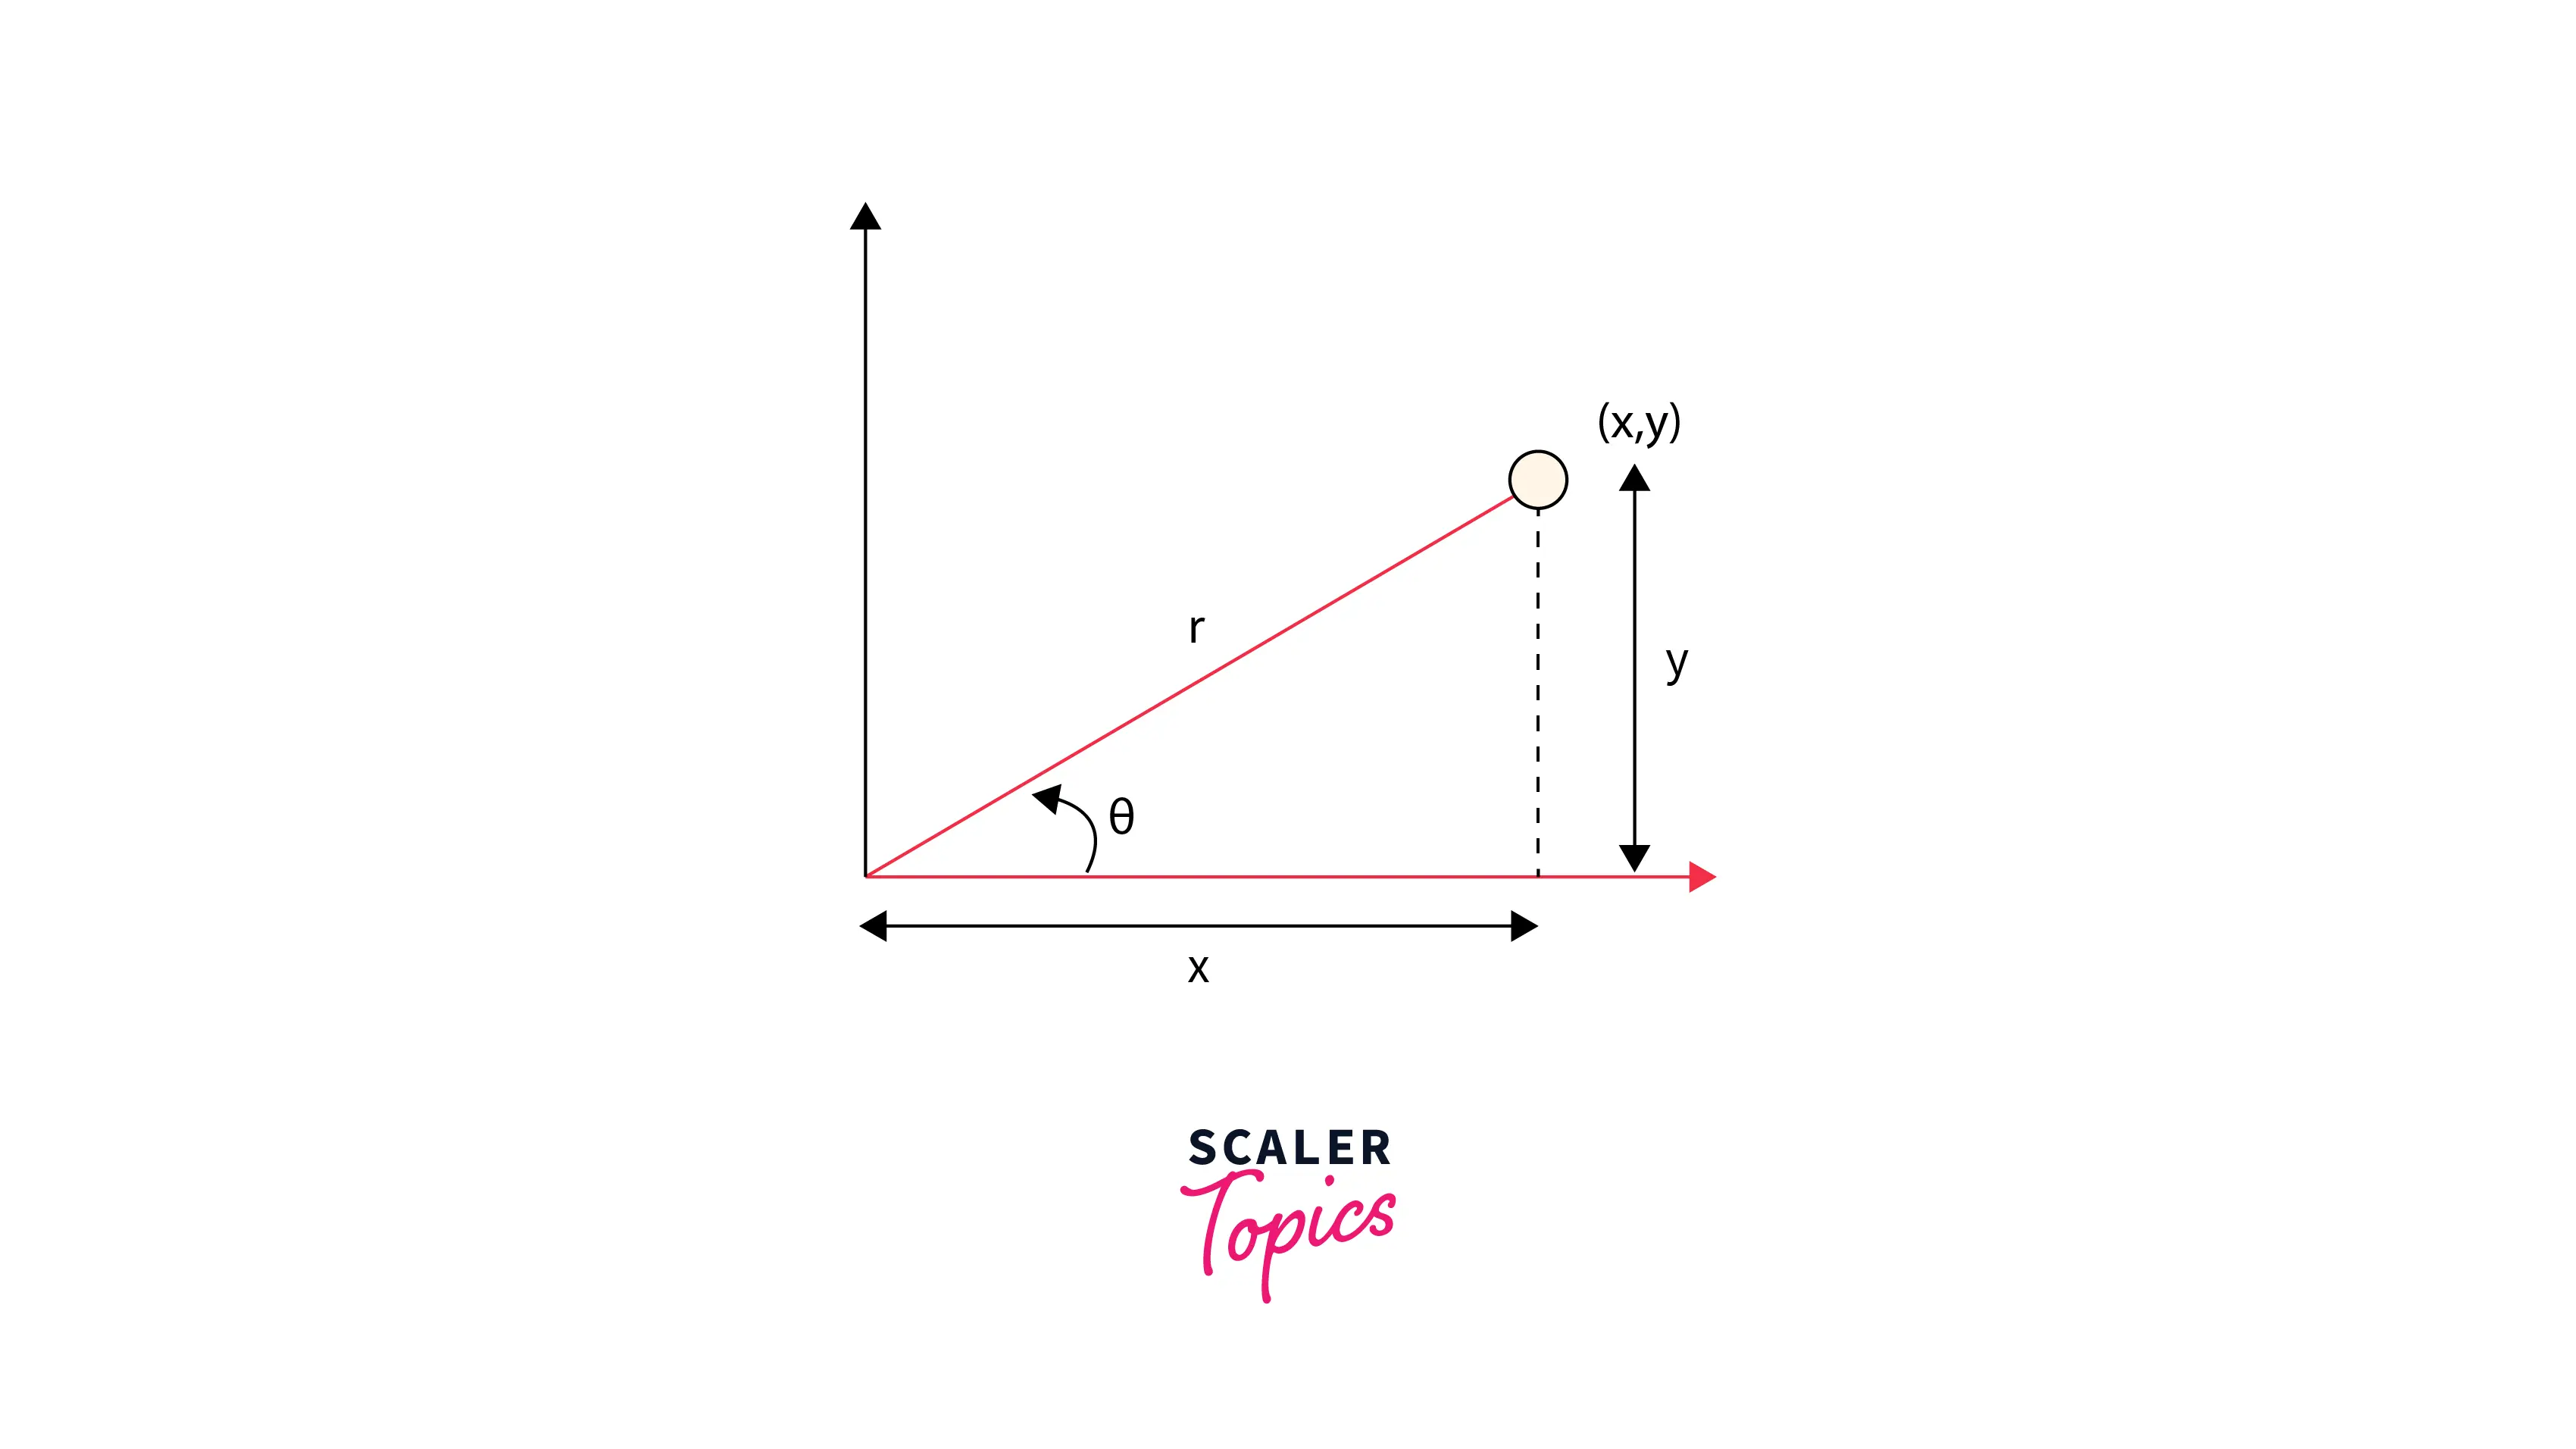
So far, we've seen how to build a coordinate grid in the Cartesian system of coordinates. However, there is also an alternative coordinate system known as the Polar coordinate system, which is as famous and widespread in different situations. In this system, points in a plane are denoted by a radius r (from the origin) and an angle O (with the horizontal). Using the following formulas, we may transform cartesian coordinates to polar coordinates and vice-versa.
,
,
The graphic below depicts the two coordinate systems on a single plane, which can help you grasp mutual relationships better.
We now comprehend the polar coordinate system and its link to the Cartesian system, and we have already generated a Cartesian coordinate meshgrid in the previous section. Let's construct a polar coordinate meshgrid.
Code:
Output:
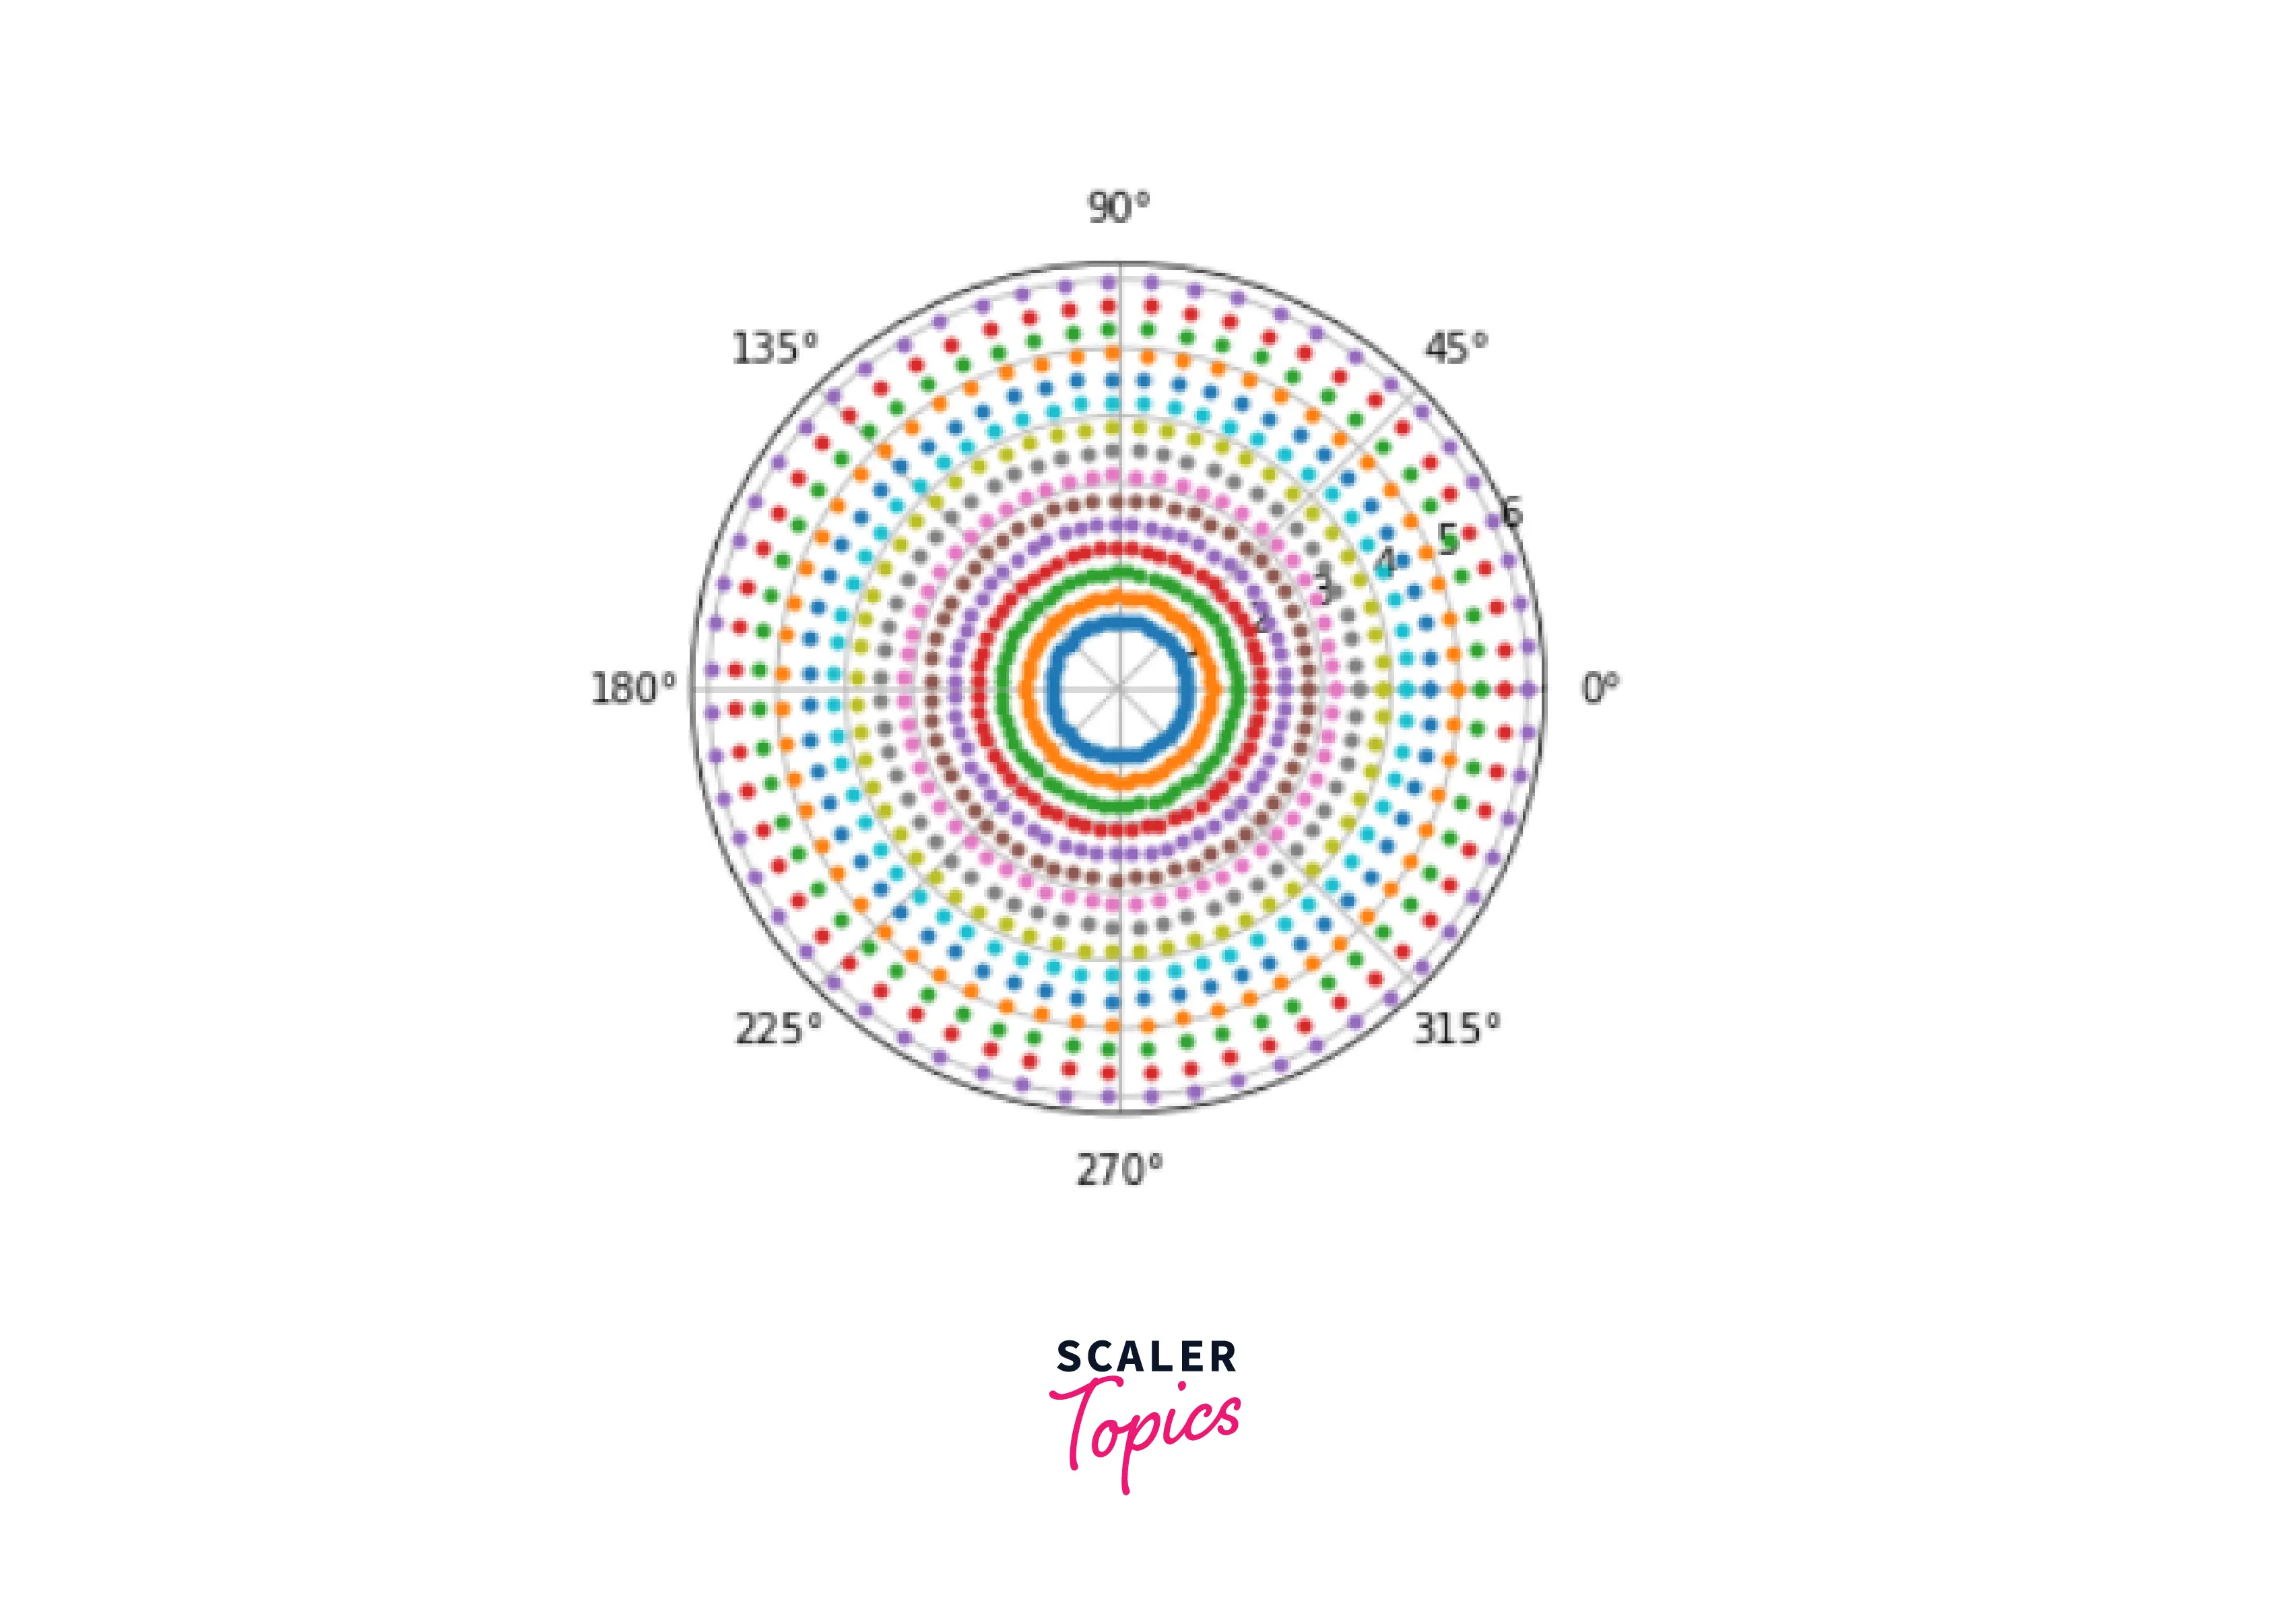
We started by defining the radius range. It has 15 evenly spaced values ranging from 1 to 6. Then we determined the angle range, which is from 0 to 2π, or between 0° to 360°. In this range, we are evaluating 60 distinct values. The meshgrid with these radii and thetas is then created. As a result, we have two matrices, one for the radii and one for the angles. The two matrices have the same form (60x15). Let us now use the pyplot function from the matplotlib package to see these produced points on a polar coordinate plane.
Code :
Output :
Meshgrid may also be used to depict three-dimensional functions. Let's see how it goes.
Plotting Three-Dimensional Functions
We'll need an extra import to plot a three-dimensional function:
Code:
So far, we've only seen meshgrids built in a two - dimensional surface. By providing the x and y coordinate arrays, we receive two output arrays, one for each of the x and y coordinates in a two-dimensional surface. Let us now examine how to construct a meshgrid in a three-dimensional space described by three coordinates.
Code:
Now we have three output arrays, one for each of the x, y, and z coordinates in three-dimensional space. Furthermore, each of the three arrays is three-dimensional. Let's map these coordinates in three dimensions.
Code:
Output:
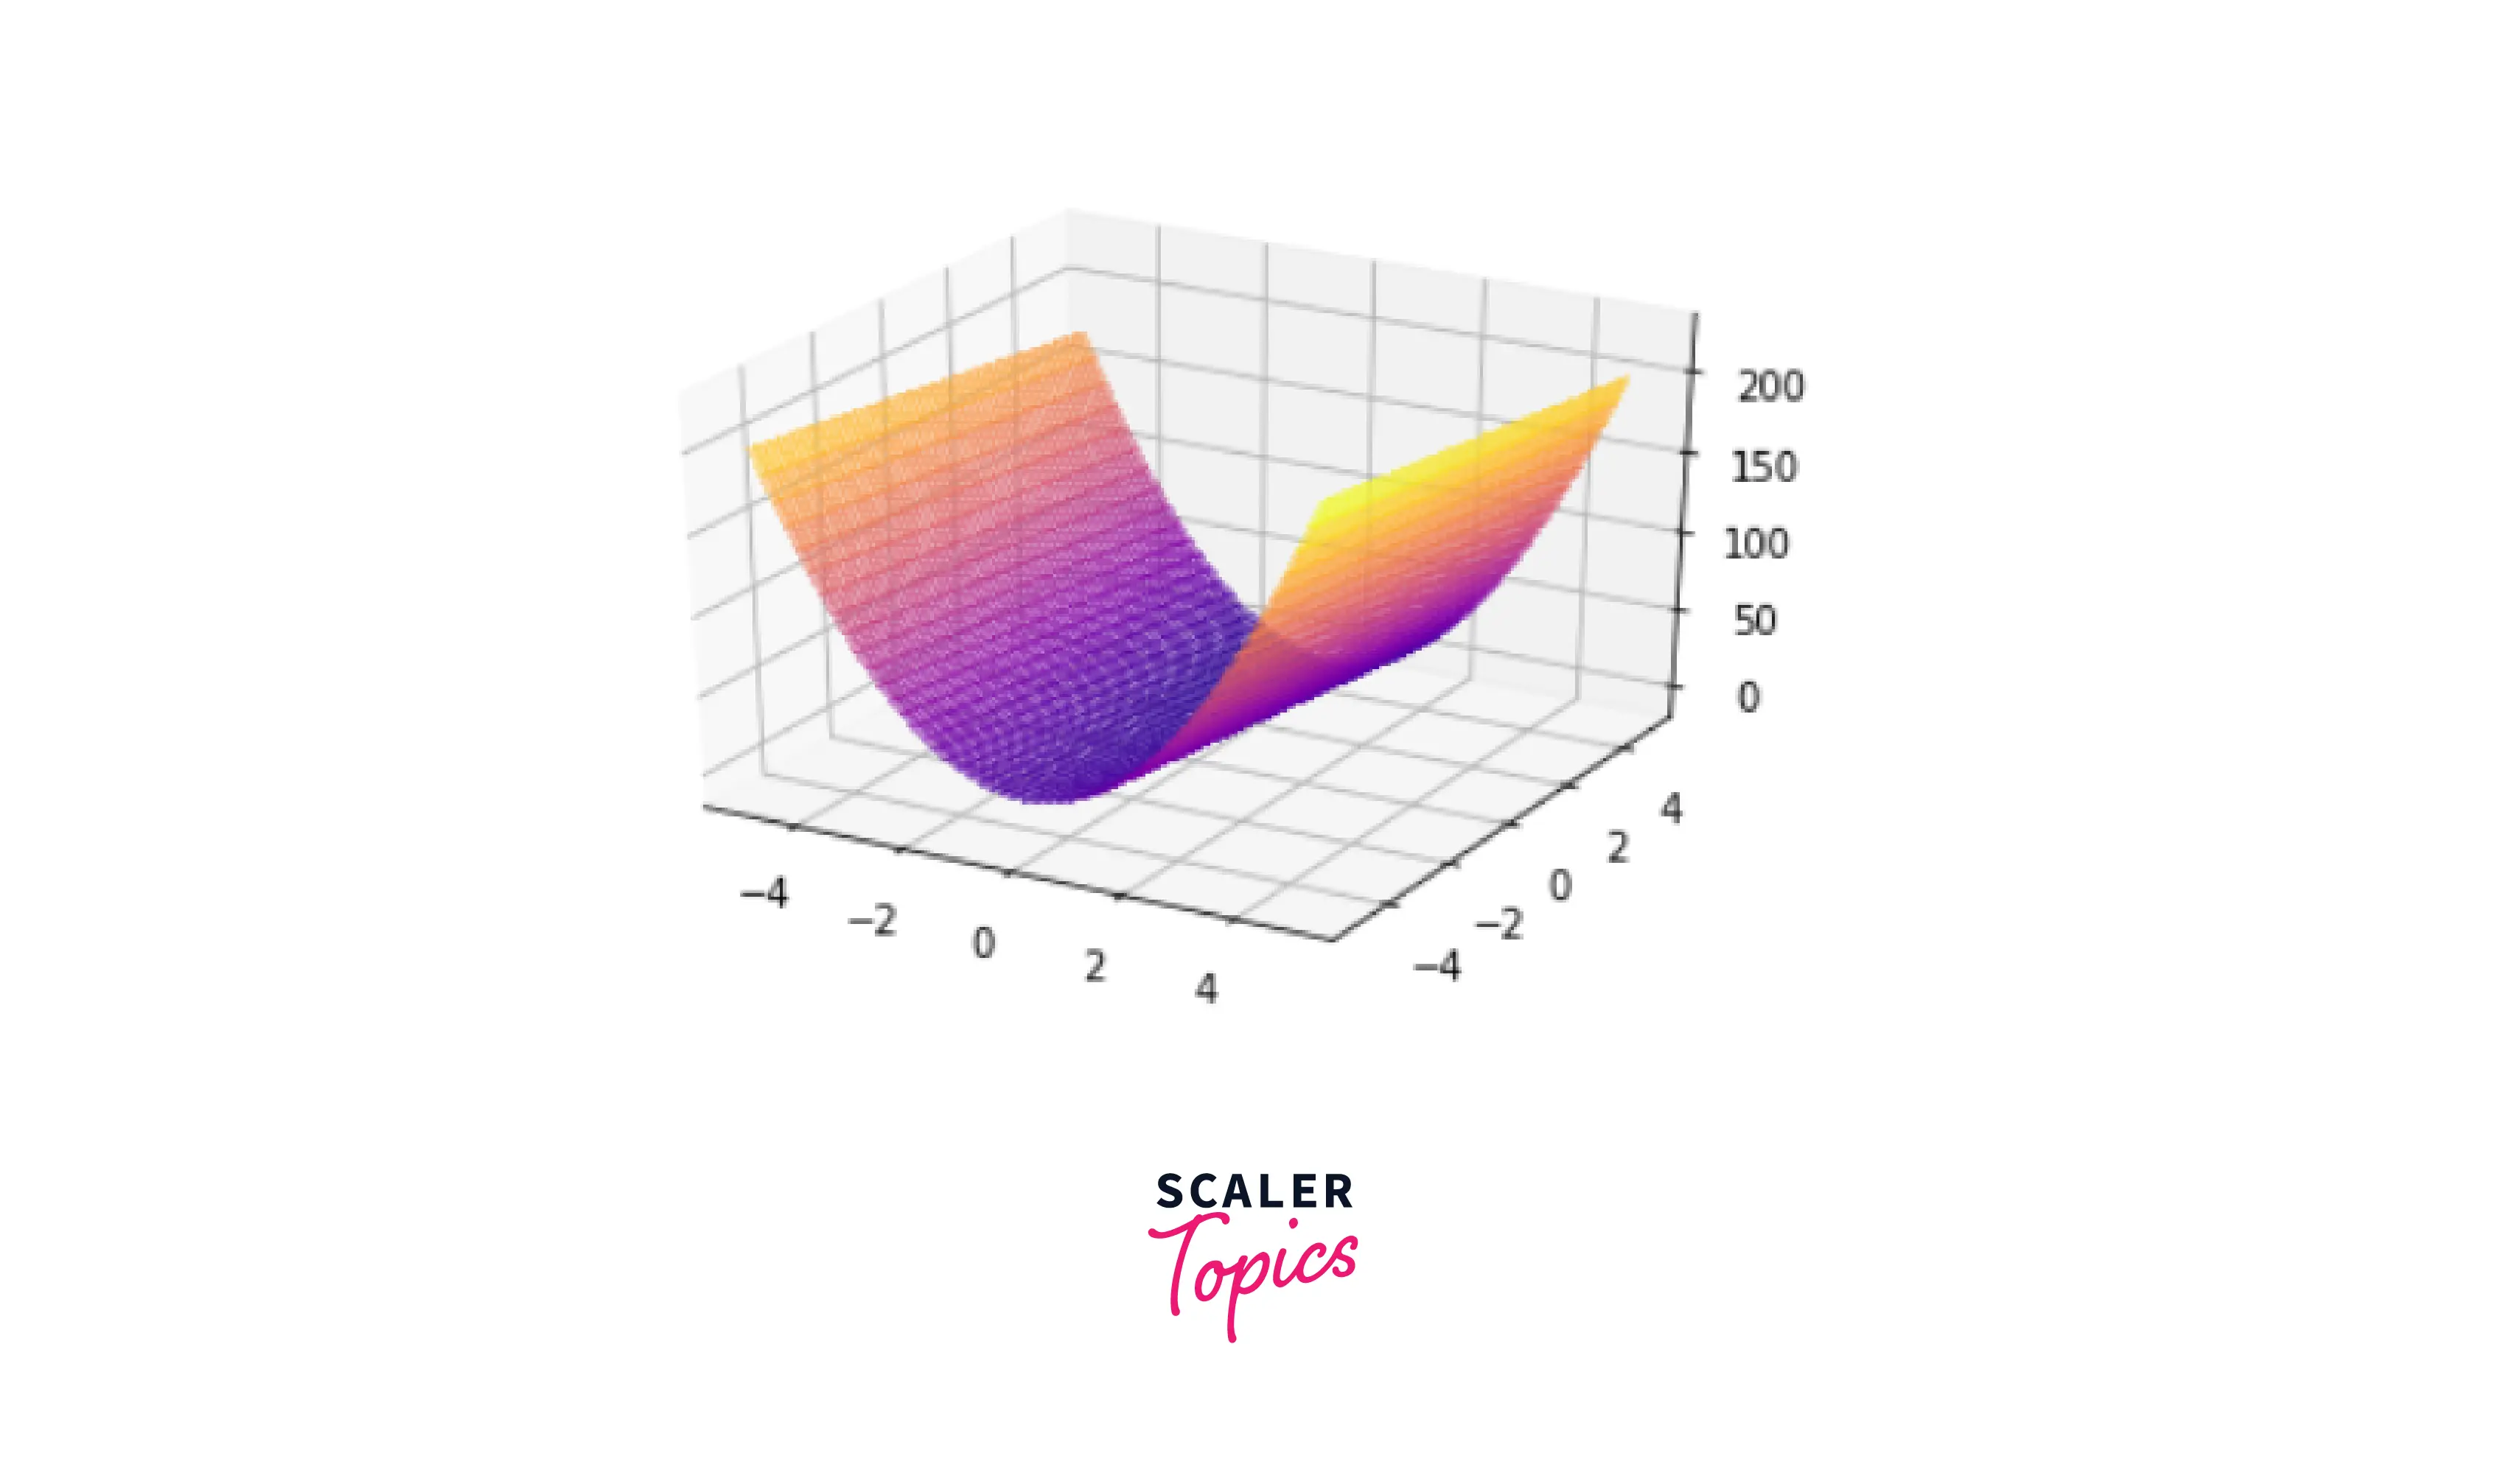
Kudos! A three-dimensional surface graph of a function has been constructed.
Conclusion
This article taught us:
- In Python, the numpy.meshgrid() method is used to return coordinate matrices from provided coordinate vectors.
- numpy.meshgrid() are useful in any circumstance when we want to generate a well-defined two-dimensional or even multidimensional matrix or refer to any place in the matrix.
- Meshgrid is widely used to depict a machine learning model's loss function and how the error margin of the model's projected outcomes decreases when the model is trained, and its parameters are adjusted.
- Polar coordinates can also be shown using numpy.meshgrid().
