How to use Numpy polyfit() Method in NumPy?
Any function that only uses non-negative integer powers or only positive integer exponents of a variable in an equation is referred to as a polynomial function. A quadratic function is a classic example of a polynomial function.
In Python, Numpy polyfit() is a function that is used to fit the data within a polynomial function. By fitting data, we mean finding the least number of squares in the function that fits in a polynomial equation.
For better understanding, a polynomial function P(X) of a degree n fits the coordinate points (a, b). This function will return a coefficient value p that will help in reducing the square error in the n
Syntax of numpy.polyfit()
The syntax of NumPy polyfit() is:
Parameters
The parameters of NumPy polyfit() are:
- a: This mandatory parameter represents the x-coordinate value of the input array.
- b: This mandatory parameter represents the y-coordinate value of the input array.
- deg: This mandatory parameter represents the integer value that fits the polynomial degree.
- rcond: Optional parameters used for the relative condition value of the fit.
Return Values
The NumPy polyfit() function returns an array whose dimensions are equal to the equation's degree + 1.
Examples
How to fit a polynomial function with numpy.polyfit()
Output
In this program, we import NumPy (for polyfit()) and Matplotlib (for plotting purposes). After importing libraries, we set our x-coordinates. Then we create an equation and use the polyfit() to generate coefficients of the 4th degree.
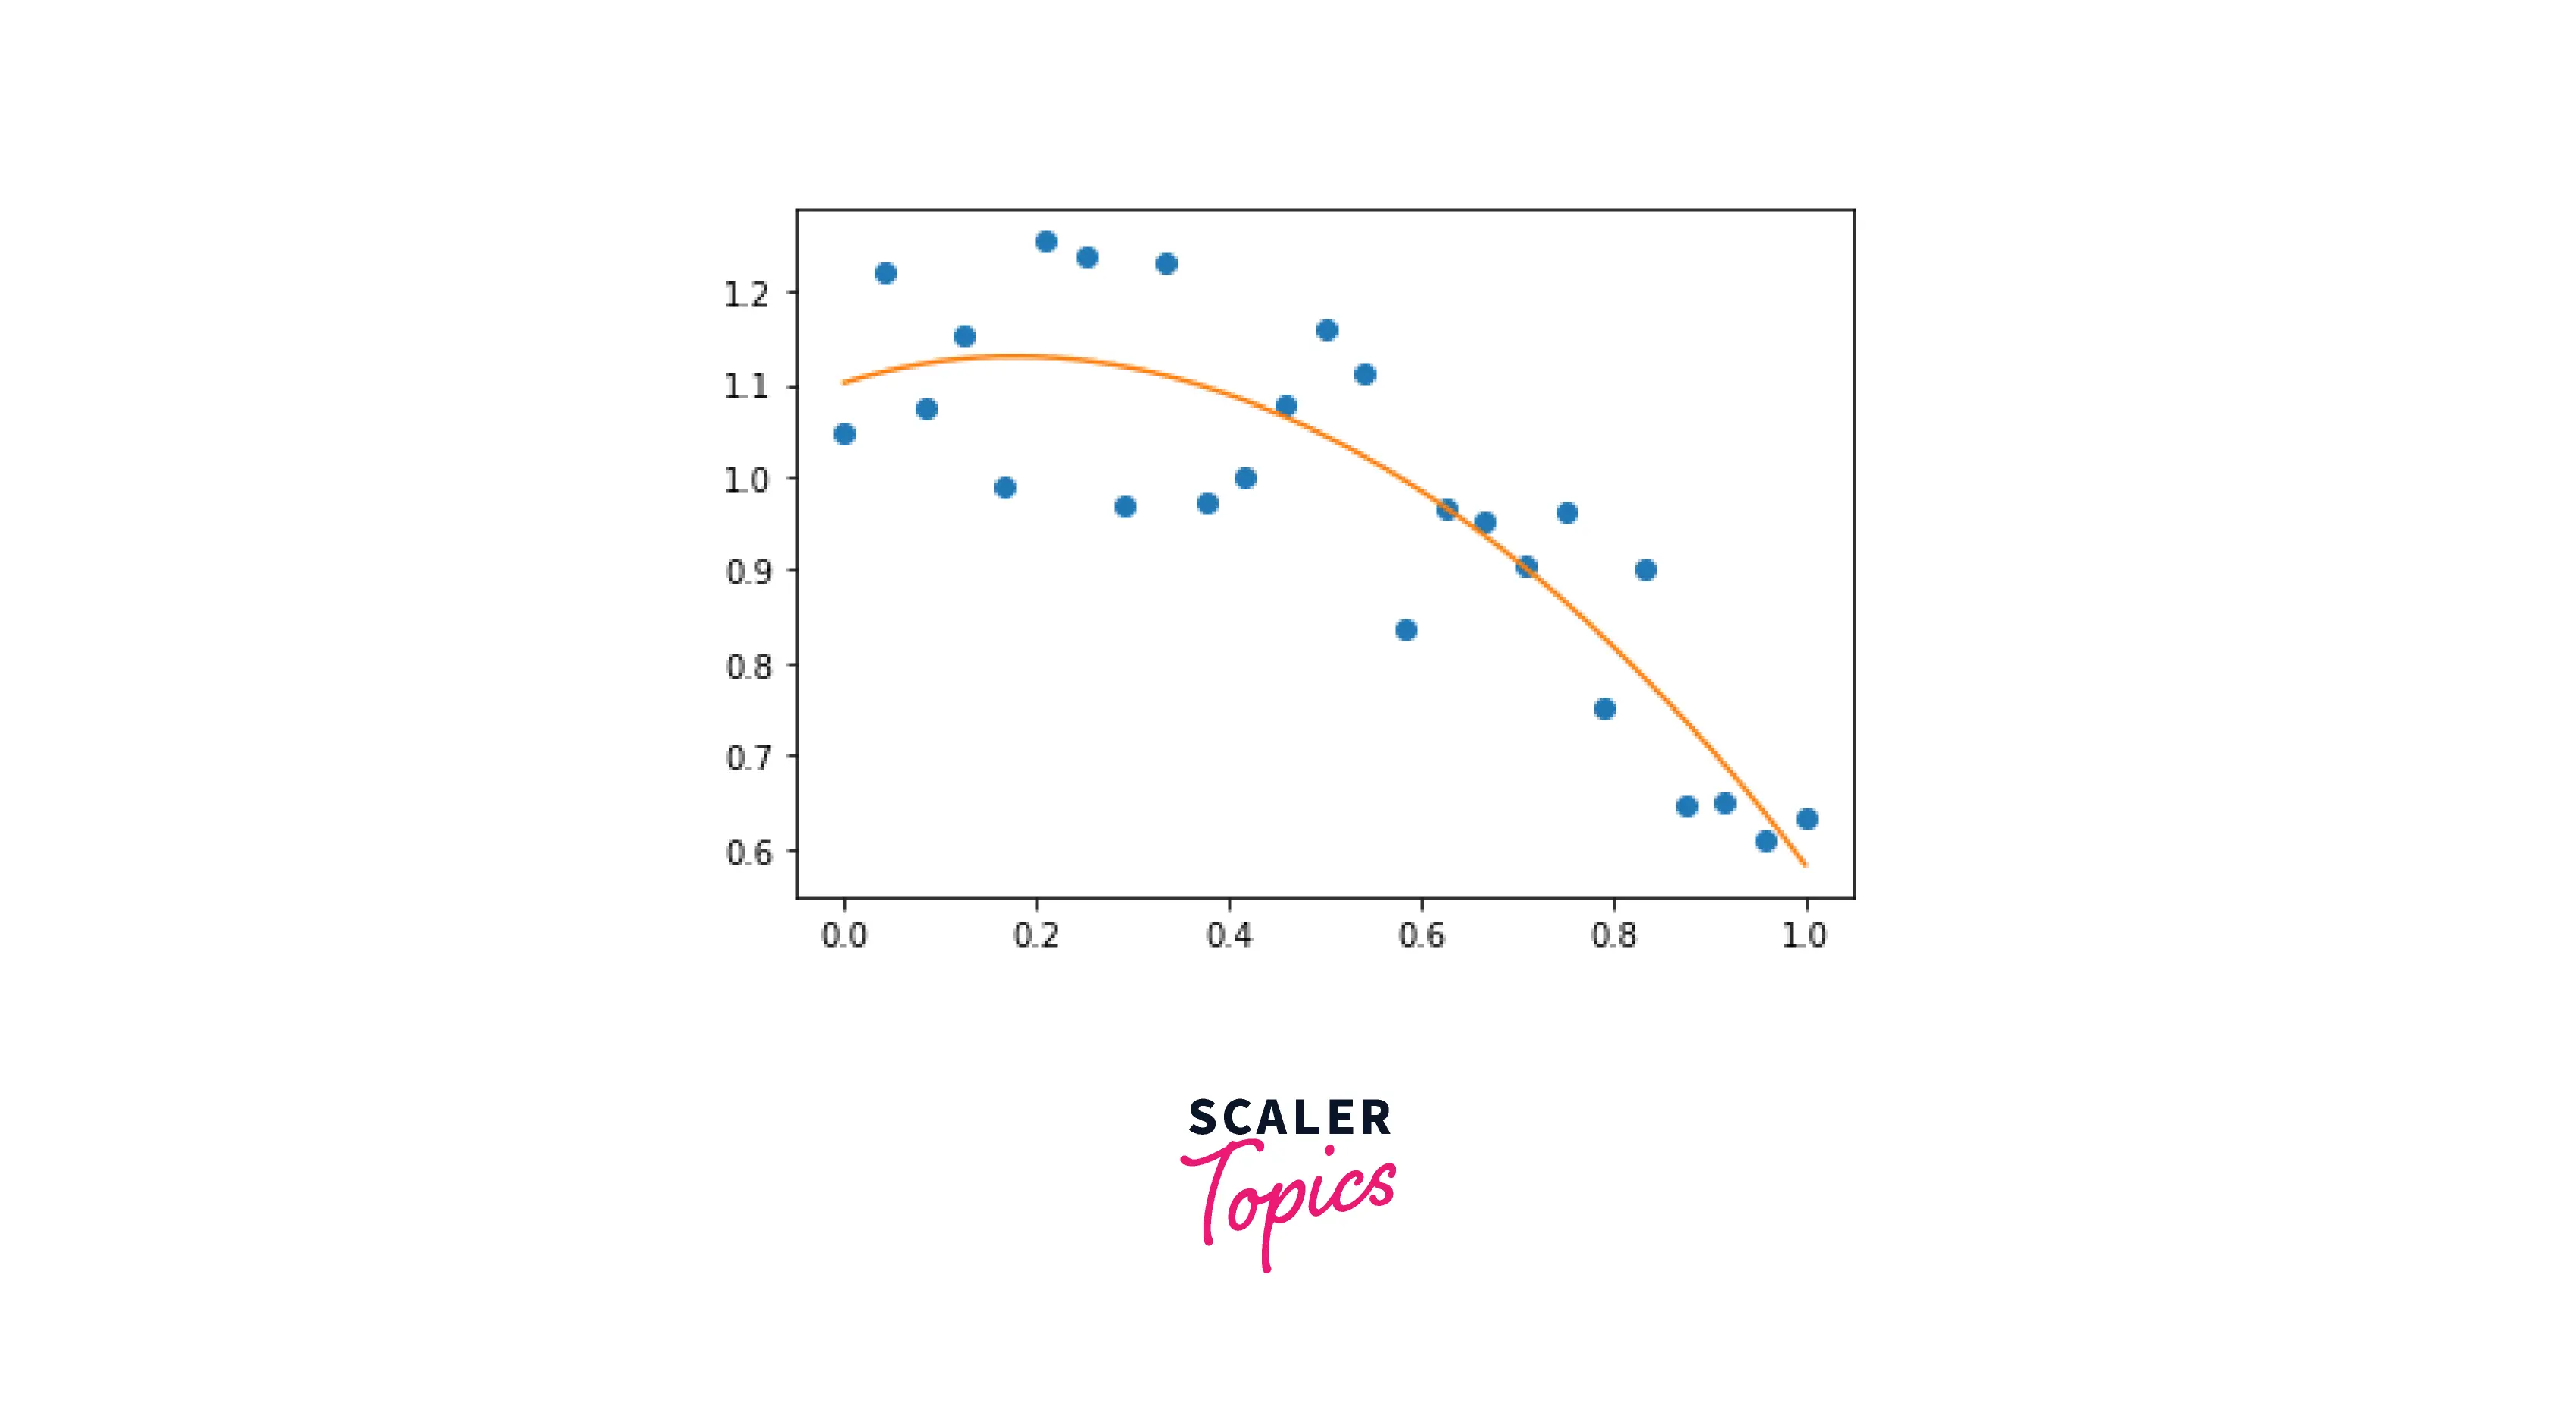
How to fit a polynomial function of a simple line with NumPy.polyfit()
Output
After creating the x-coordinates using linspace, we create a polynomial equation with the degree as 2. Using the polyfit() function, we generate the coefficients for the polynomial equation. To visualize, we plot the coefficients on a straight line.
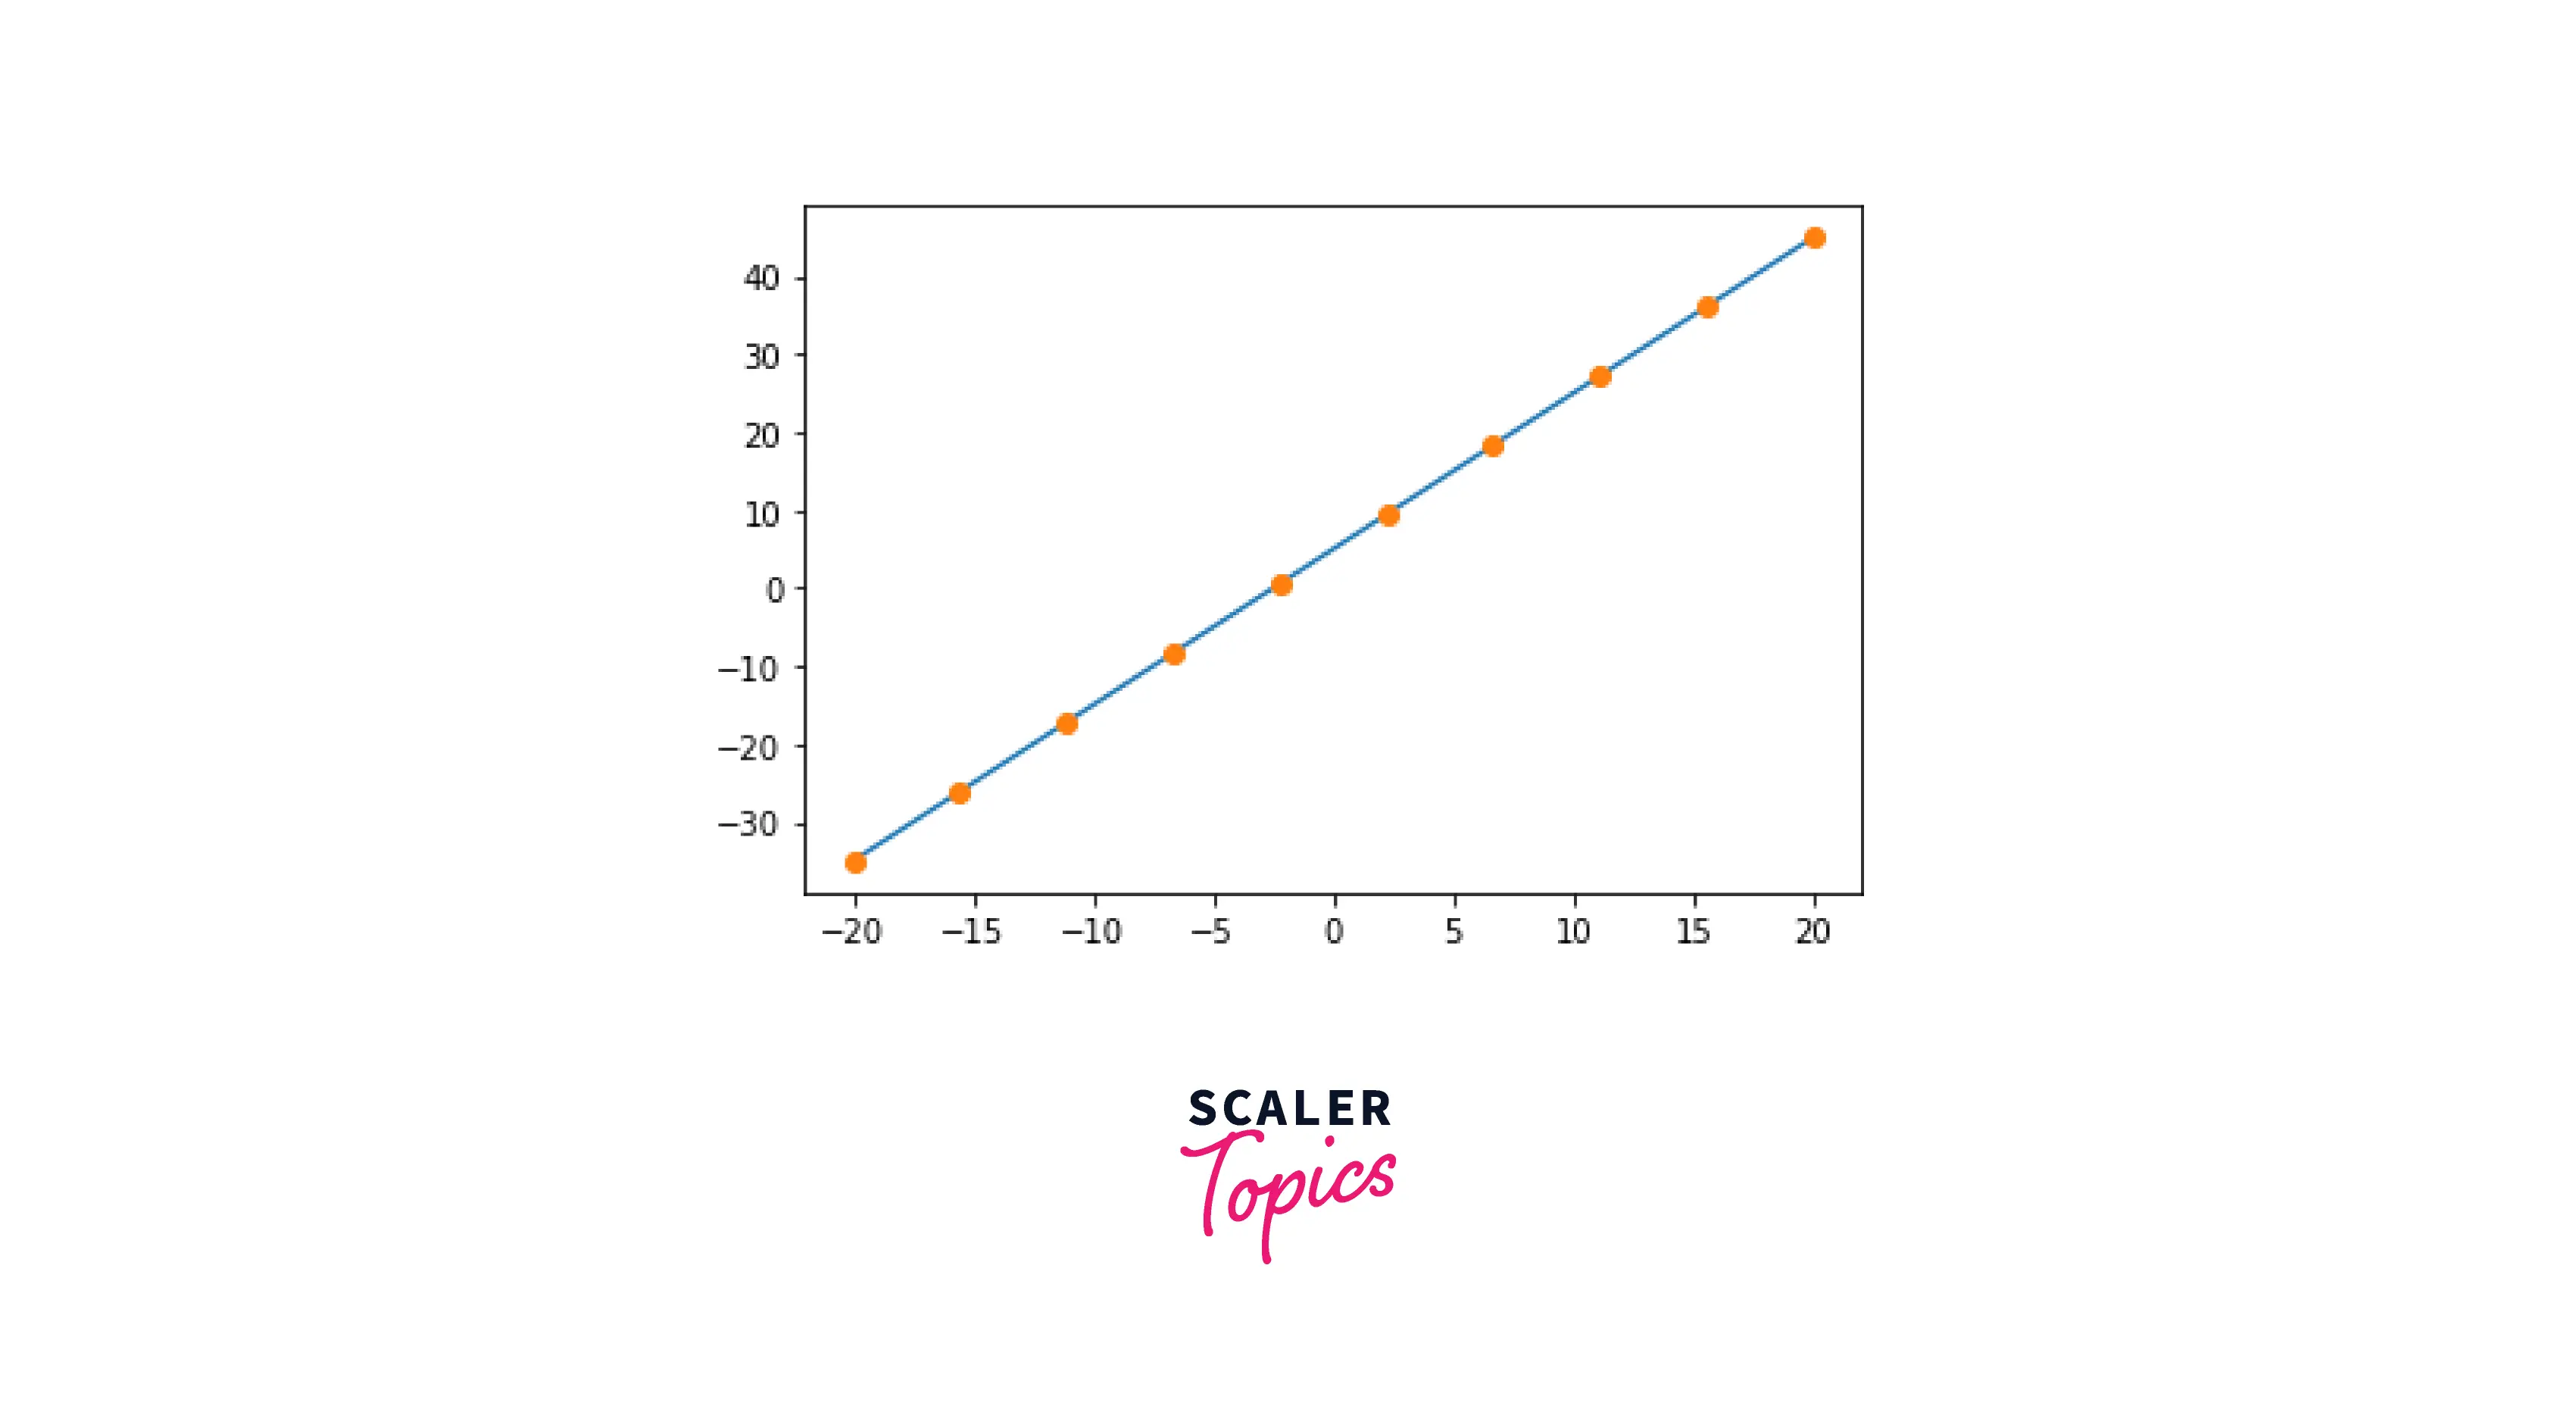
How to use np.polyfit() method to implement linear regression
Output

In this program, we created a dataset using x (linearly-spaced elements from 0 to 20) and and plotted it onto a graph.
To fit this dataset to a polynomial of degree 2, the equation would be . To calculate the values of a, b, and c, we use the NumPy polyfit() function.
These values will signify the best fit that our polynomial function can have regarding the data points. When we test our Linear Regression model by using it to find the value of 20, it comes out to be 400, which is the square of 20. Hence, our Linear Regression model works!
Conclusion
- In this article, we covered the basics of the NumPy polyfit() function, its uses, and some of its applications.
- NumPy polyfit() function helps us to fit our data inside a polynomial function.
- The NumPy polyfit() function takes in 3 mandatory parameters; x-coordinate, y-coordinate and degree of the equation.
- polyfit() function returns an array, and its dimension is equal to the degrees+1.
- With the help of some examples, we learned the utility of polyfit() by fitting it onto a straight line.
- To conclude, we performed Linear Regression using coefficients generated by the NumPy polyfit() function.