What are the Outlier Detection Methods in Data Mining?
Overview
Outlier detection is the process of identifying data points that are significantly different from the rest. The three main outlier detection methods in data mining are statistical, proximity-based, and model-based. Statistical methods rely on mean and variance, proximity-based methods rely on distance or density-based measures, and model-based methods assume a certain distribution or model. The choice of method depends on the dataset and the type of outliers being targeted.
What Are The Different Types of Outliers?
Outlier detection, also known as anomaly detection, is a crucial task in data mining. It refers to the process of identifying data points that are significantly different from the rest of the data in a given dataset. Outliers can cause issues in data analysis, as they can skew results and mislead statistical models. Different types of outliers can exist in a dataset. A few of the most common types of outliers include the following -
- Global Outliers - These are data points that are significantly different from the rest of the dataset. They are often caused by measurement errors, incorrect data entry, or rare events.
- Contextual Outliers - These are data points that are considered outliers only in specific contexts. For example, a high income in a low-income neighborhood might be considered an outlier, but not in a high-income neighborhood.
- Collective Outliers - These are groups of data points that are collectively different from the rest of the dataset. They might indicate a subgroup or a different underlying distribution of data.
Problems Caused by Outliers
Outliers can cause several problems in data mining, including -
- Skewed statistical analysis - Outliers can significantly affect the mean, variance, and other statistical measures, leading to skewed analysis and inaccurate conclusions.
- Misleading visualizations - Outliers can distort visualizations such as scatter plots and histograms, making it difficult to identify patterns and relationships in the data.
- Biased machine learning models - Outliers can have a disproportionate impact on the training of machine learning models, leading to biased or inaccurate predictions.
- Decreased model accuracy - Outliers can decrease the accuracy of statistical models and machine learning algorithms, as these models are designed to fit the majority of the data and may not be able to account for the unusual values of outliers.
What are The Methods of Outlier Detection?
Let’s explore a few of the most common outlier detection methods in data mining to identify and detect outliers in a dataset.
Box Plots
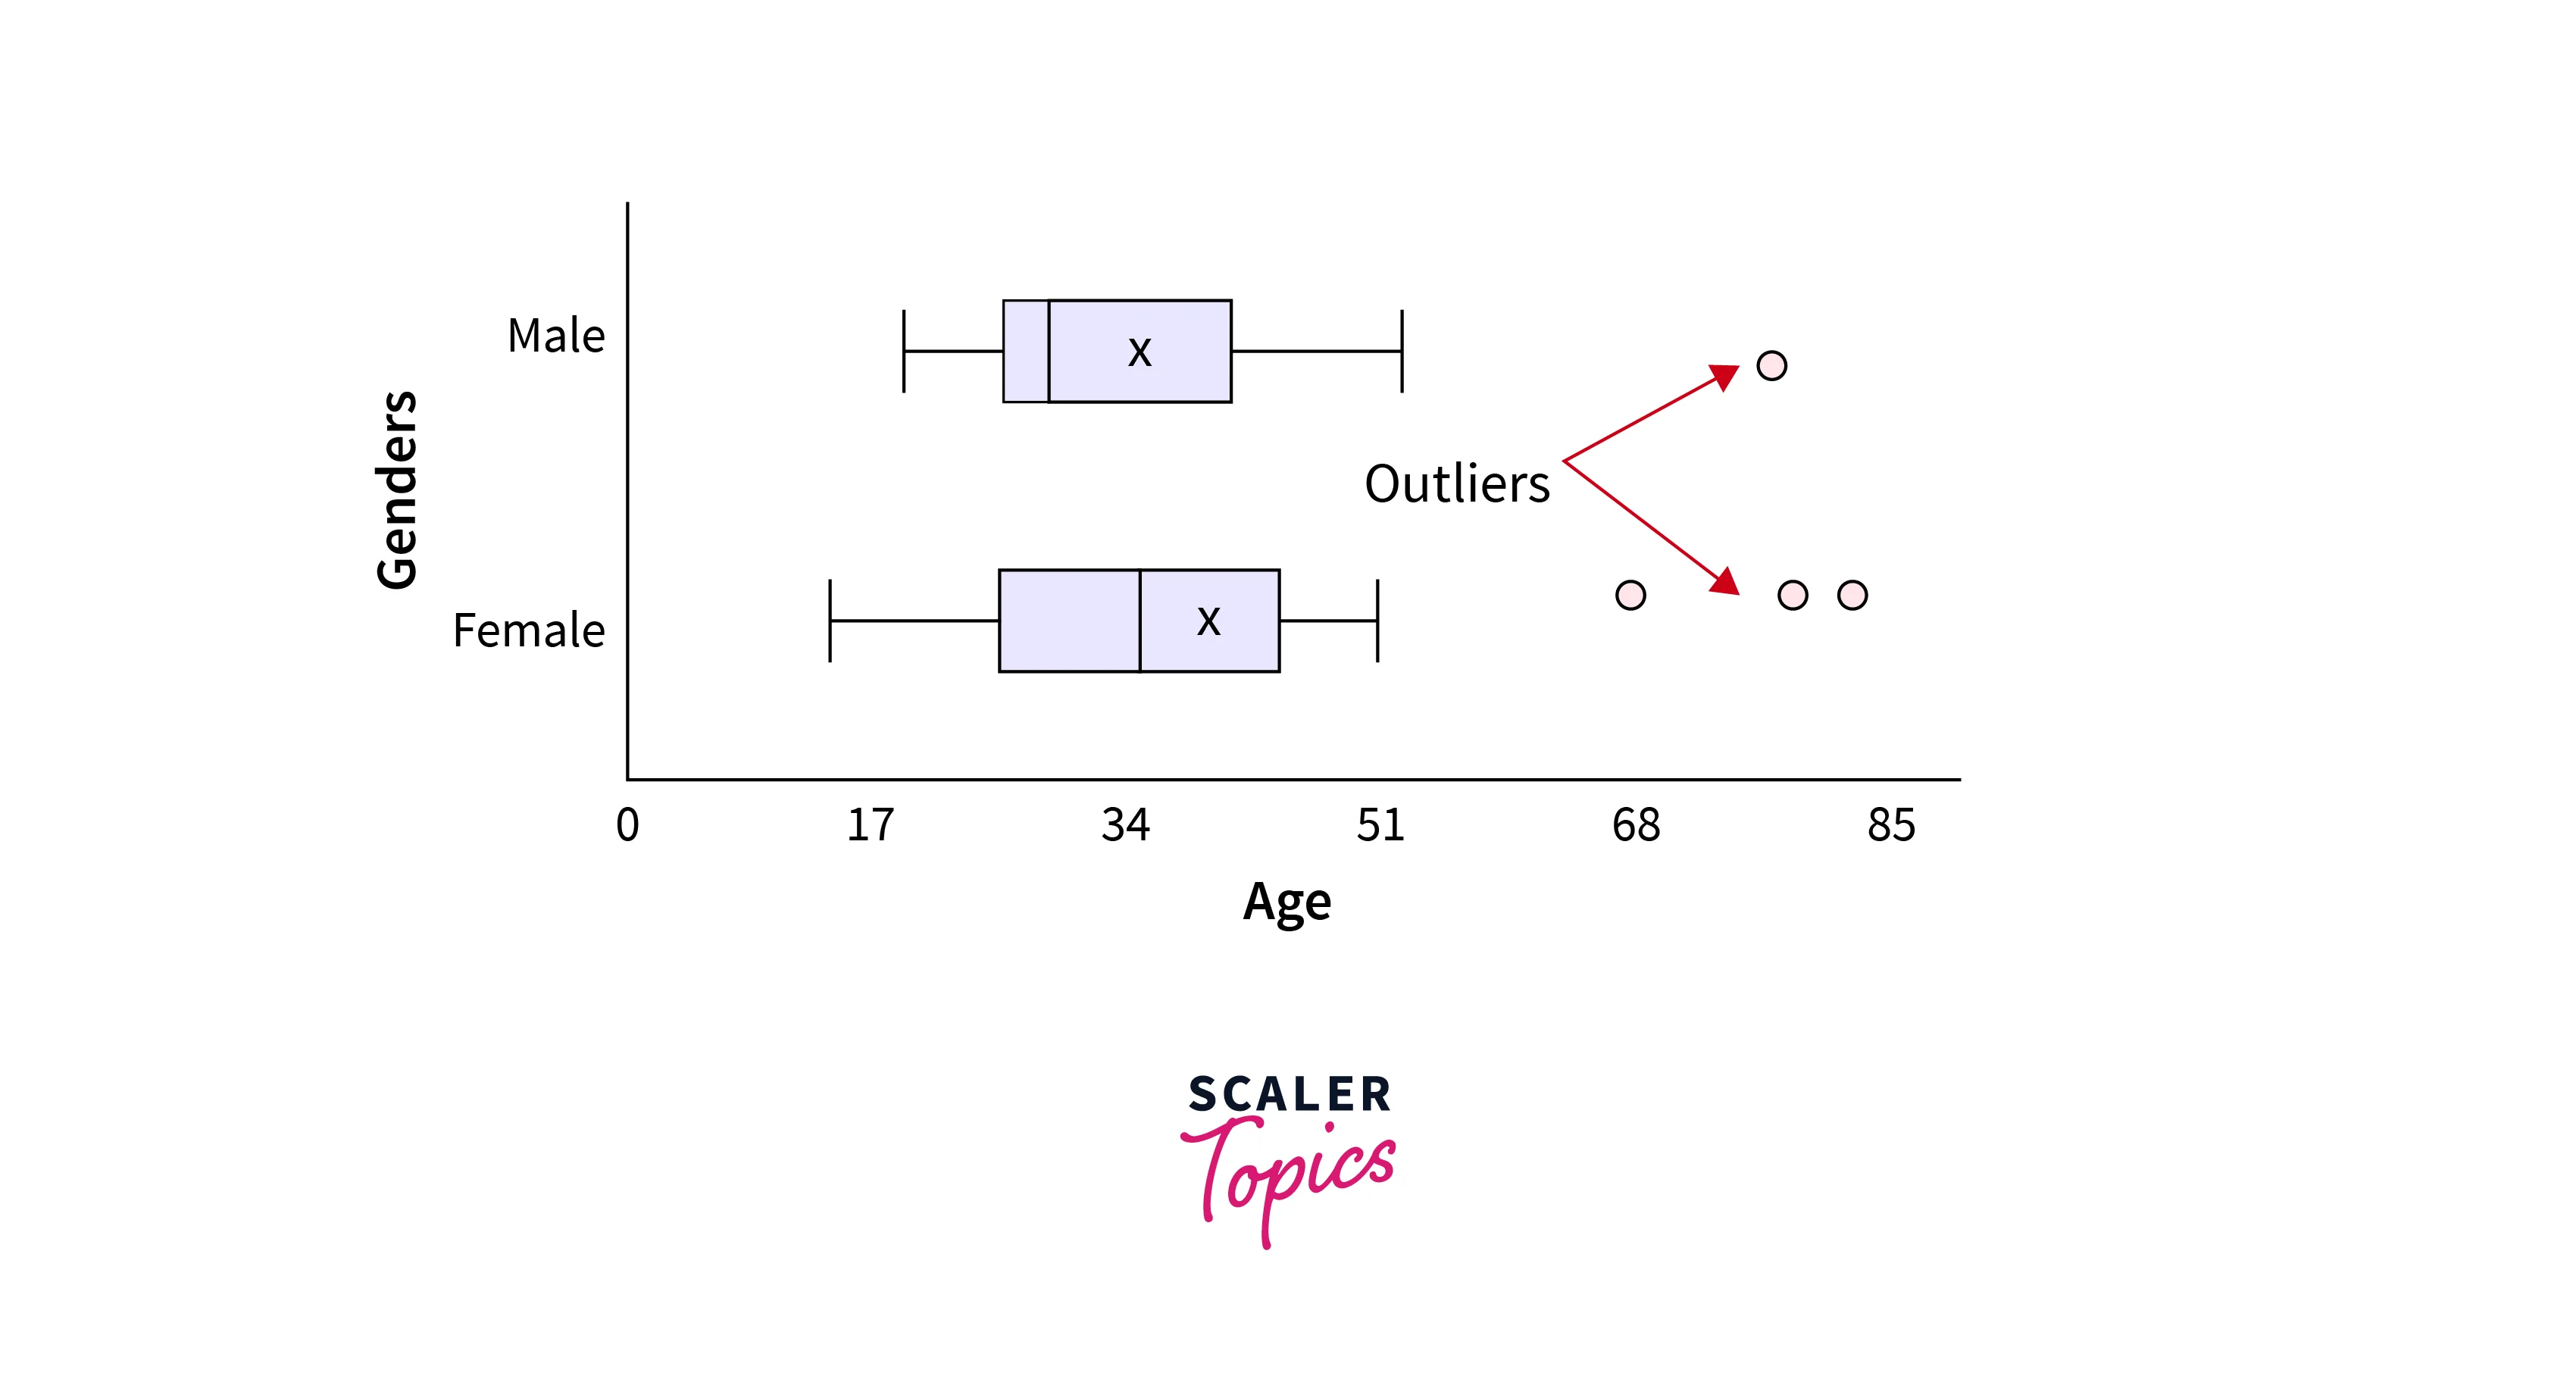
Box plots, also known as box-and-whisker plots, can be used for outlier detection in a dataset. A box plot visualizes the distribution of a dataset by displaying the median, quartiles, and outliers. The box represents the middle 50% of the data, with the median shown as a line in the middle of the box. The whiskers extend from the box to the minimum and maximum values that are not considered outliers.
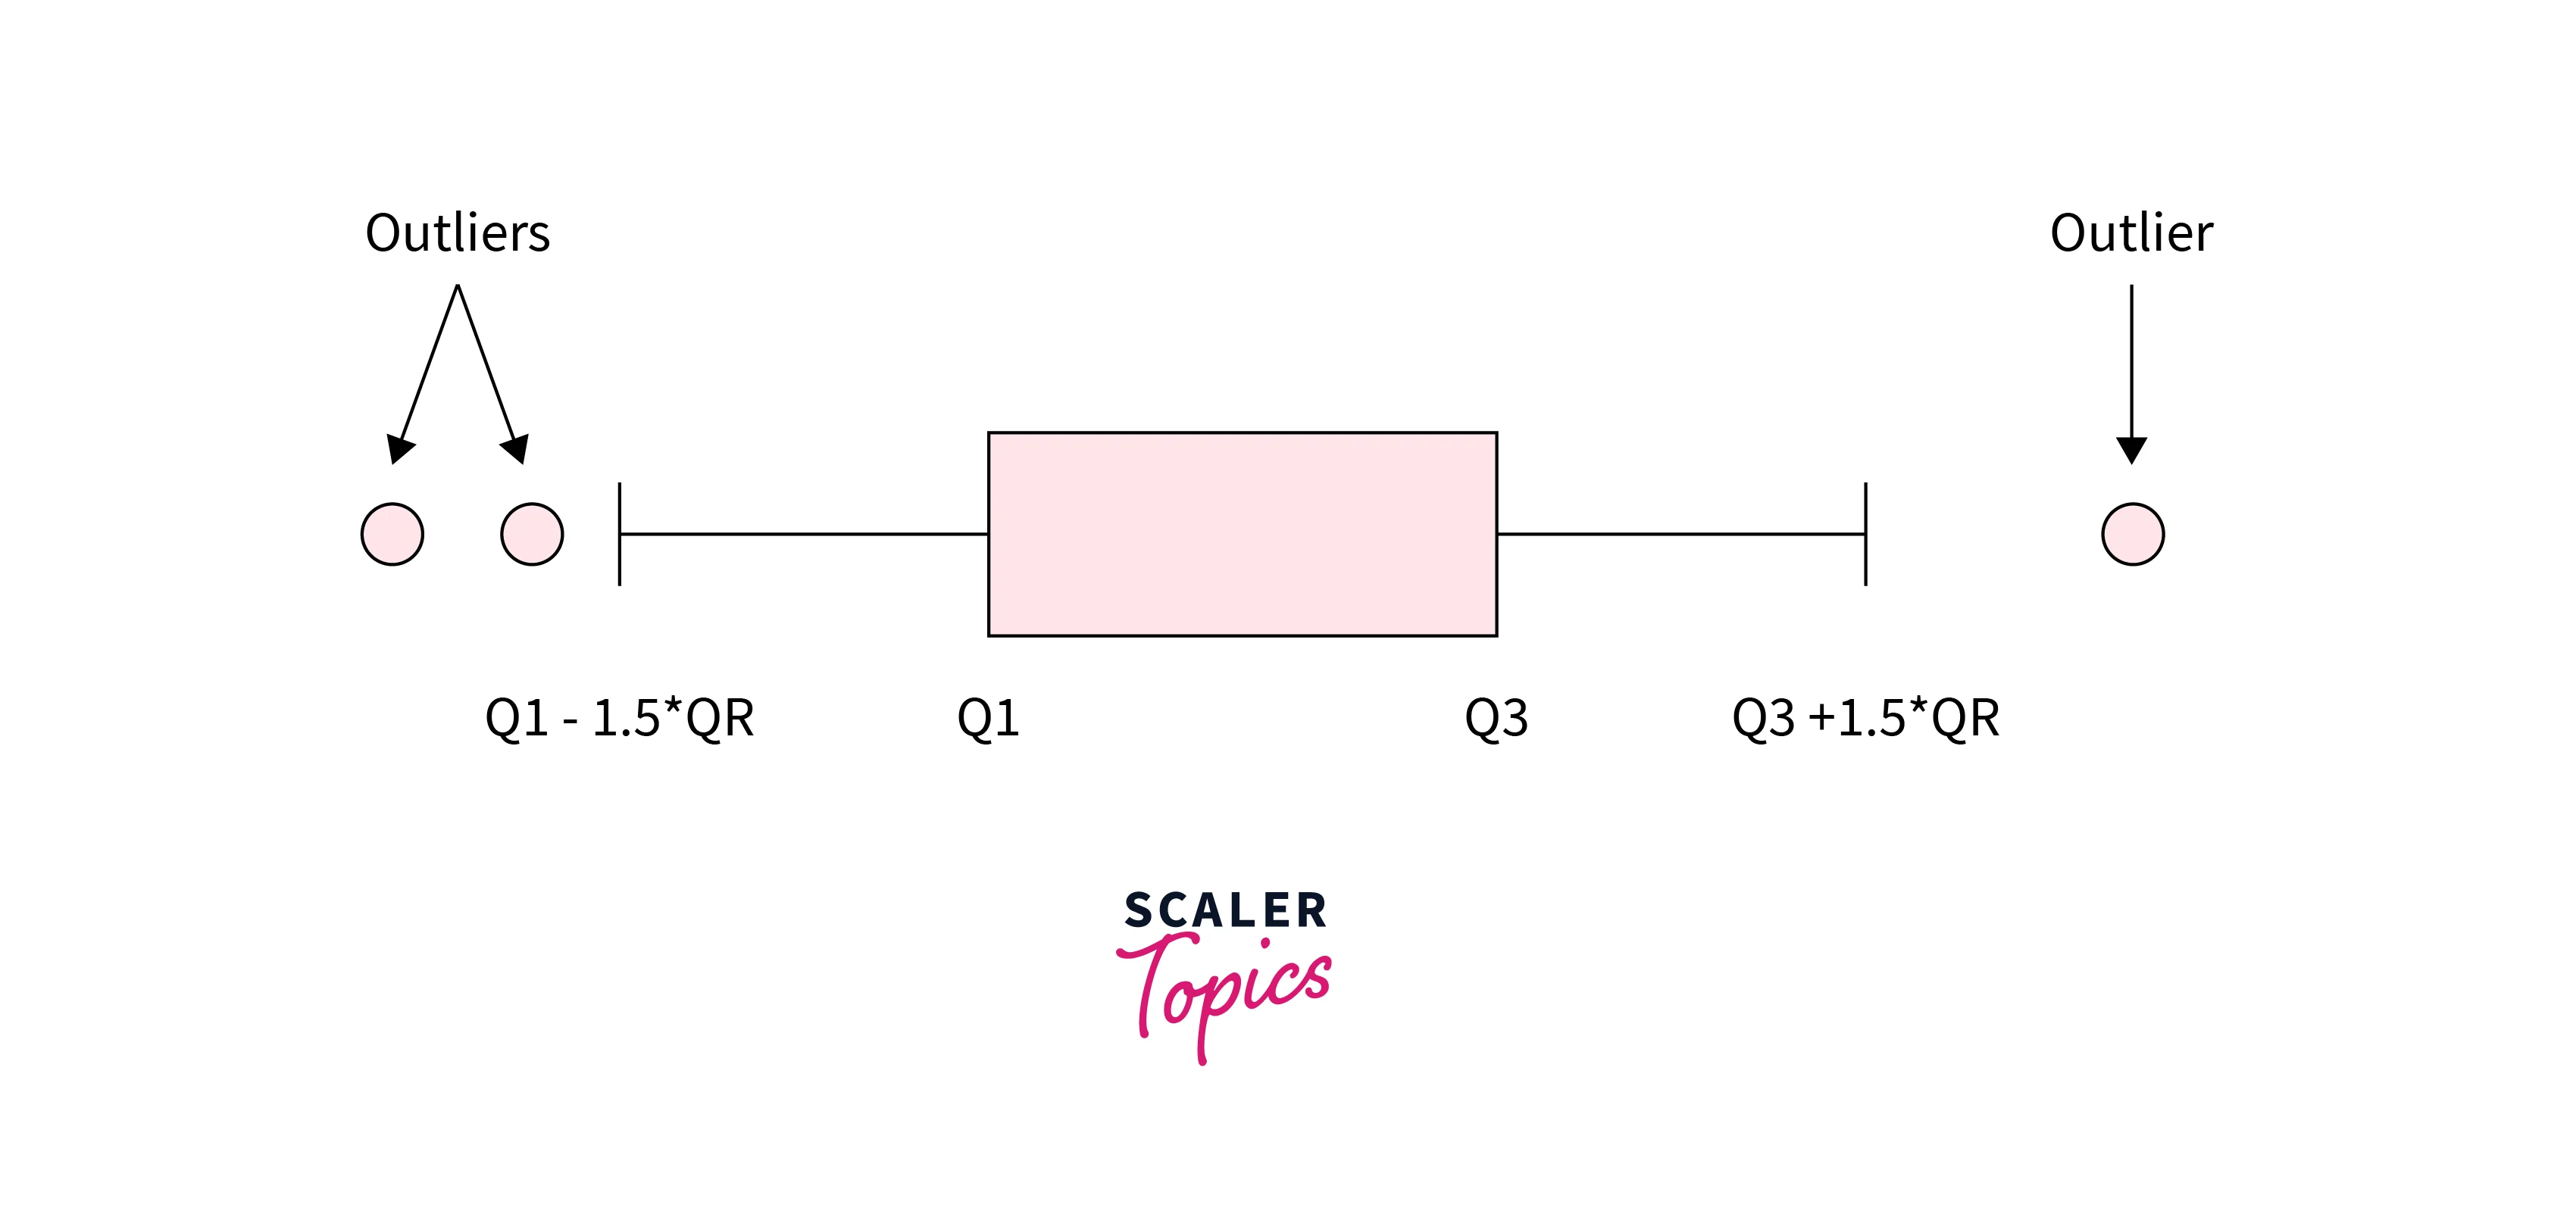
Outliers in a dataset can be identified by plotting them as individual points outside the whiskers. These points are usually considered outliers if they fall over 1.5 times the interquartile range (IQR) outside the box. This method helps visualize the outliers in any feature. For example, in the figure below, points in blue and yellow colors would be considered outliers.
IQR Method
The Interquartile Range (IQR) method is one of the most common outlier detection methods in data mining. The IQR is calculated as the difference between the dataset's third quartile (Q3) and the first quartile (Q1). Q1 is the value at the 25th percentile, and Q3 is at the 75th percentile.
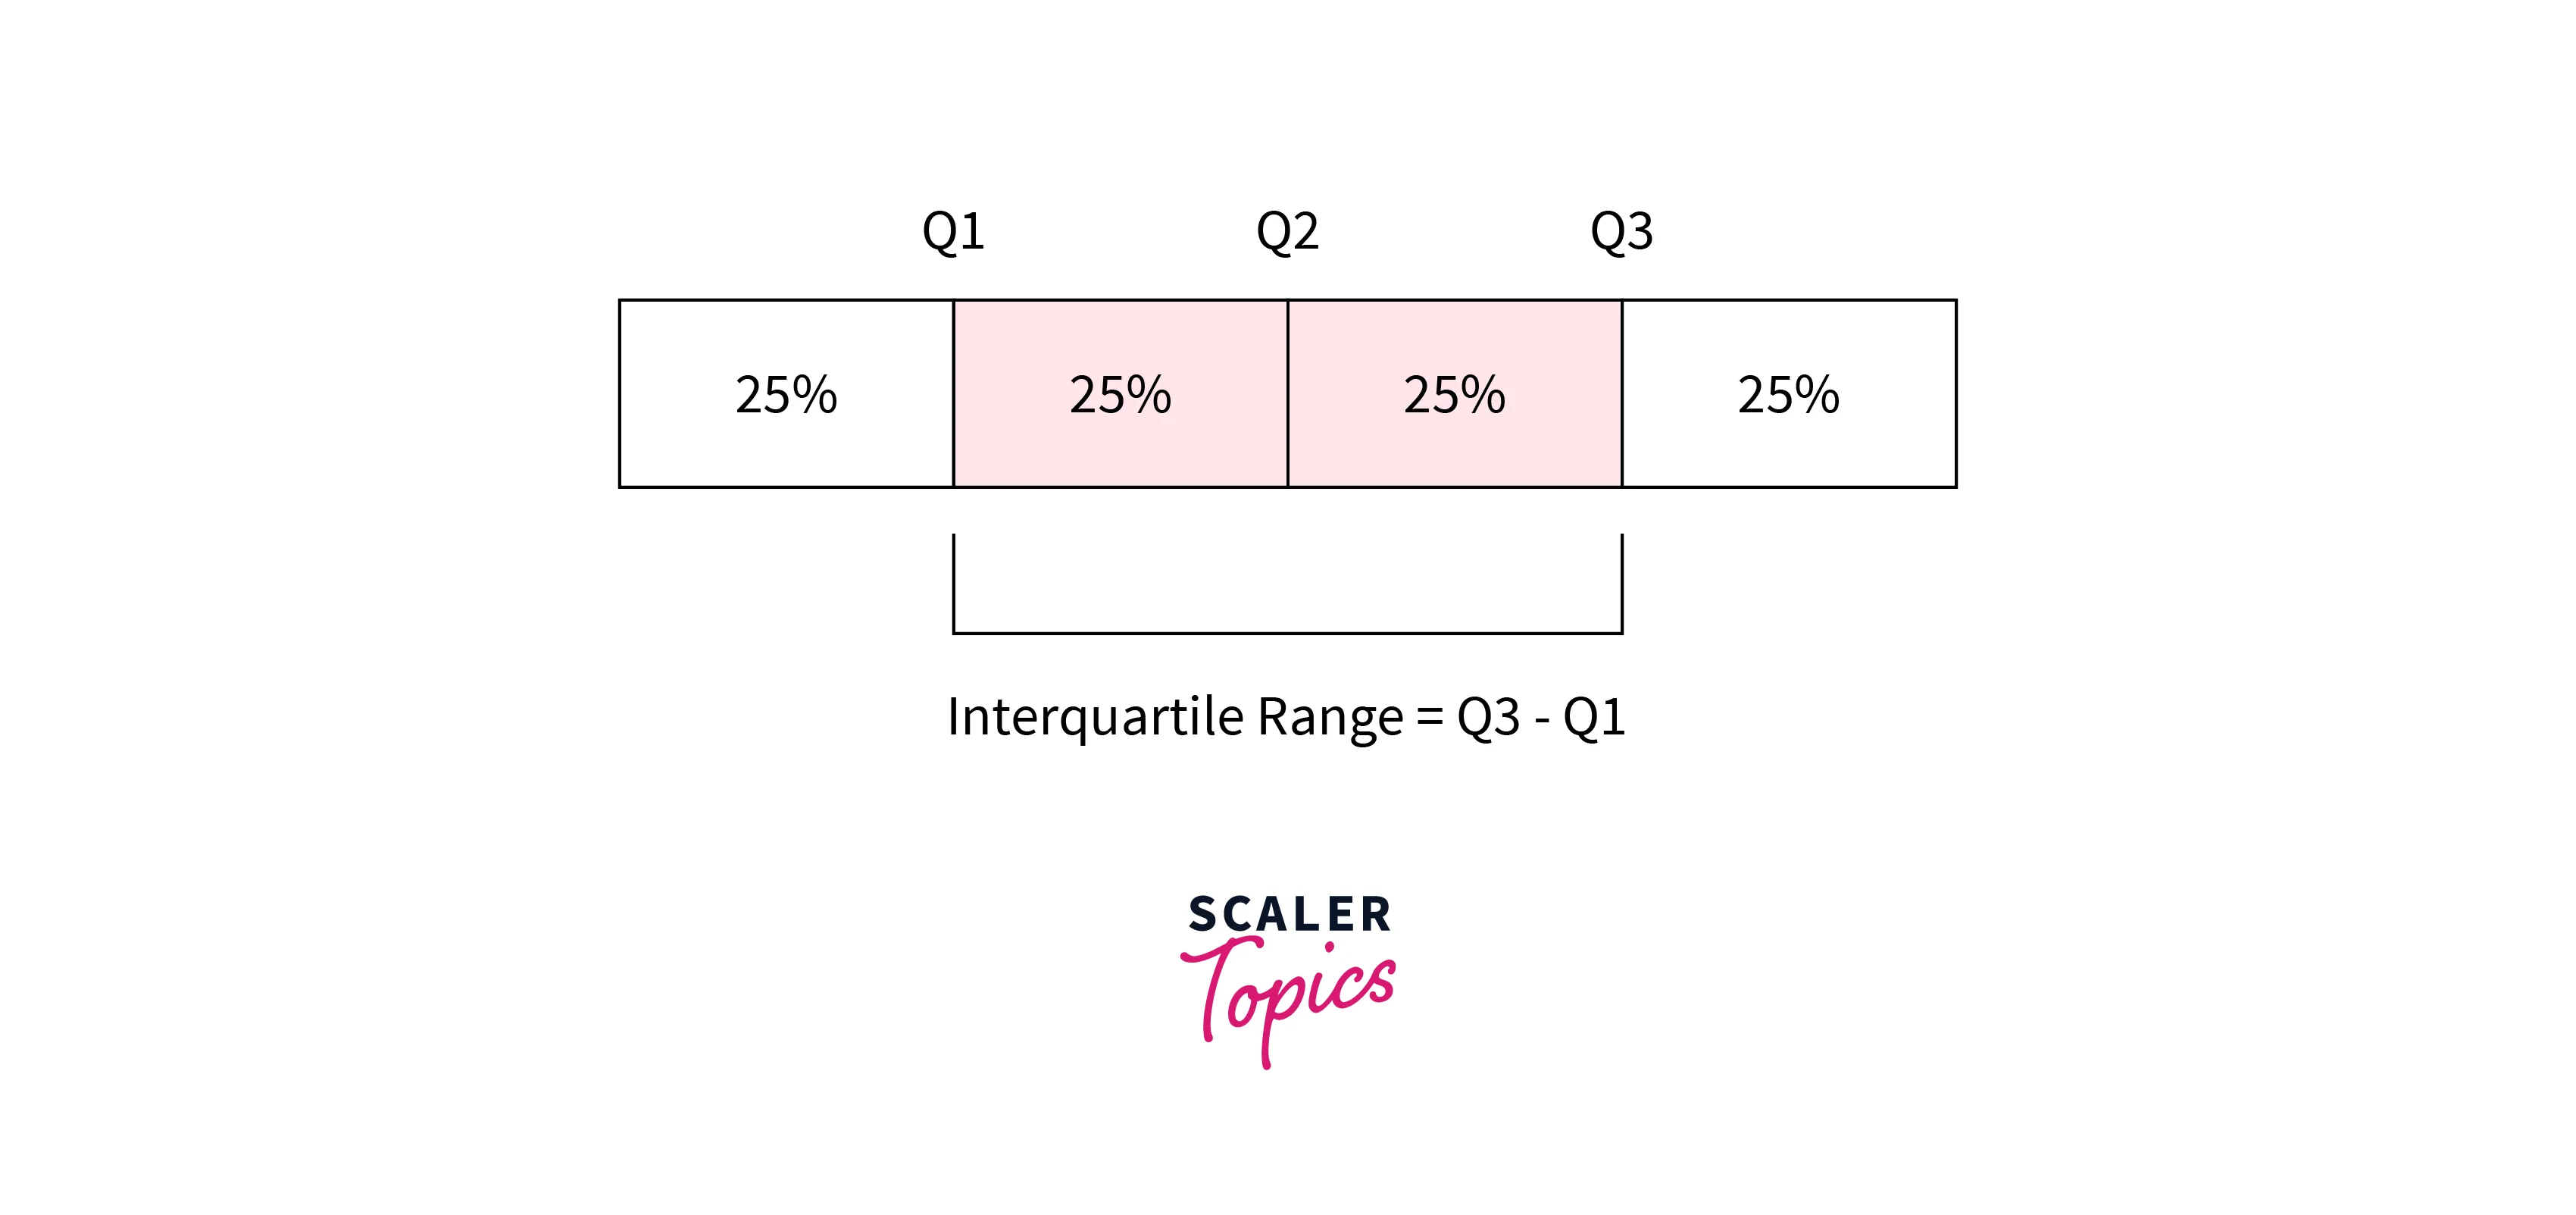
Outliers can be detected by identifying data points that fall below or above . These points are considered significantly different from most of the data and can be labeled as outliers.
Z-Score Method
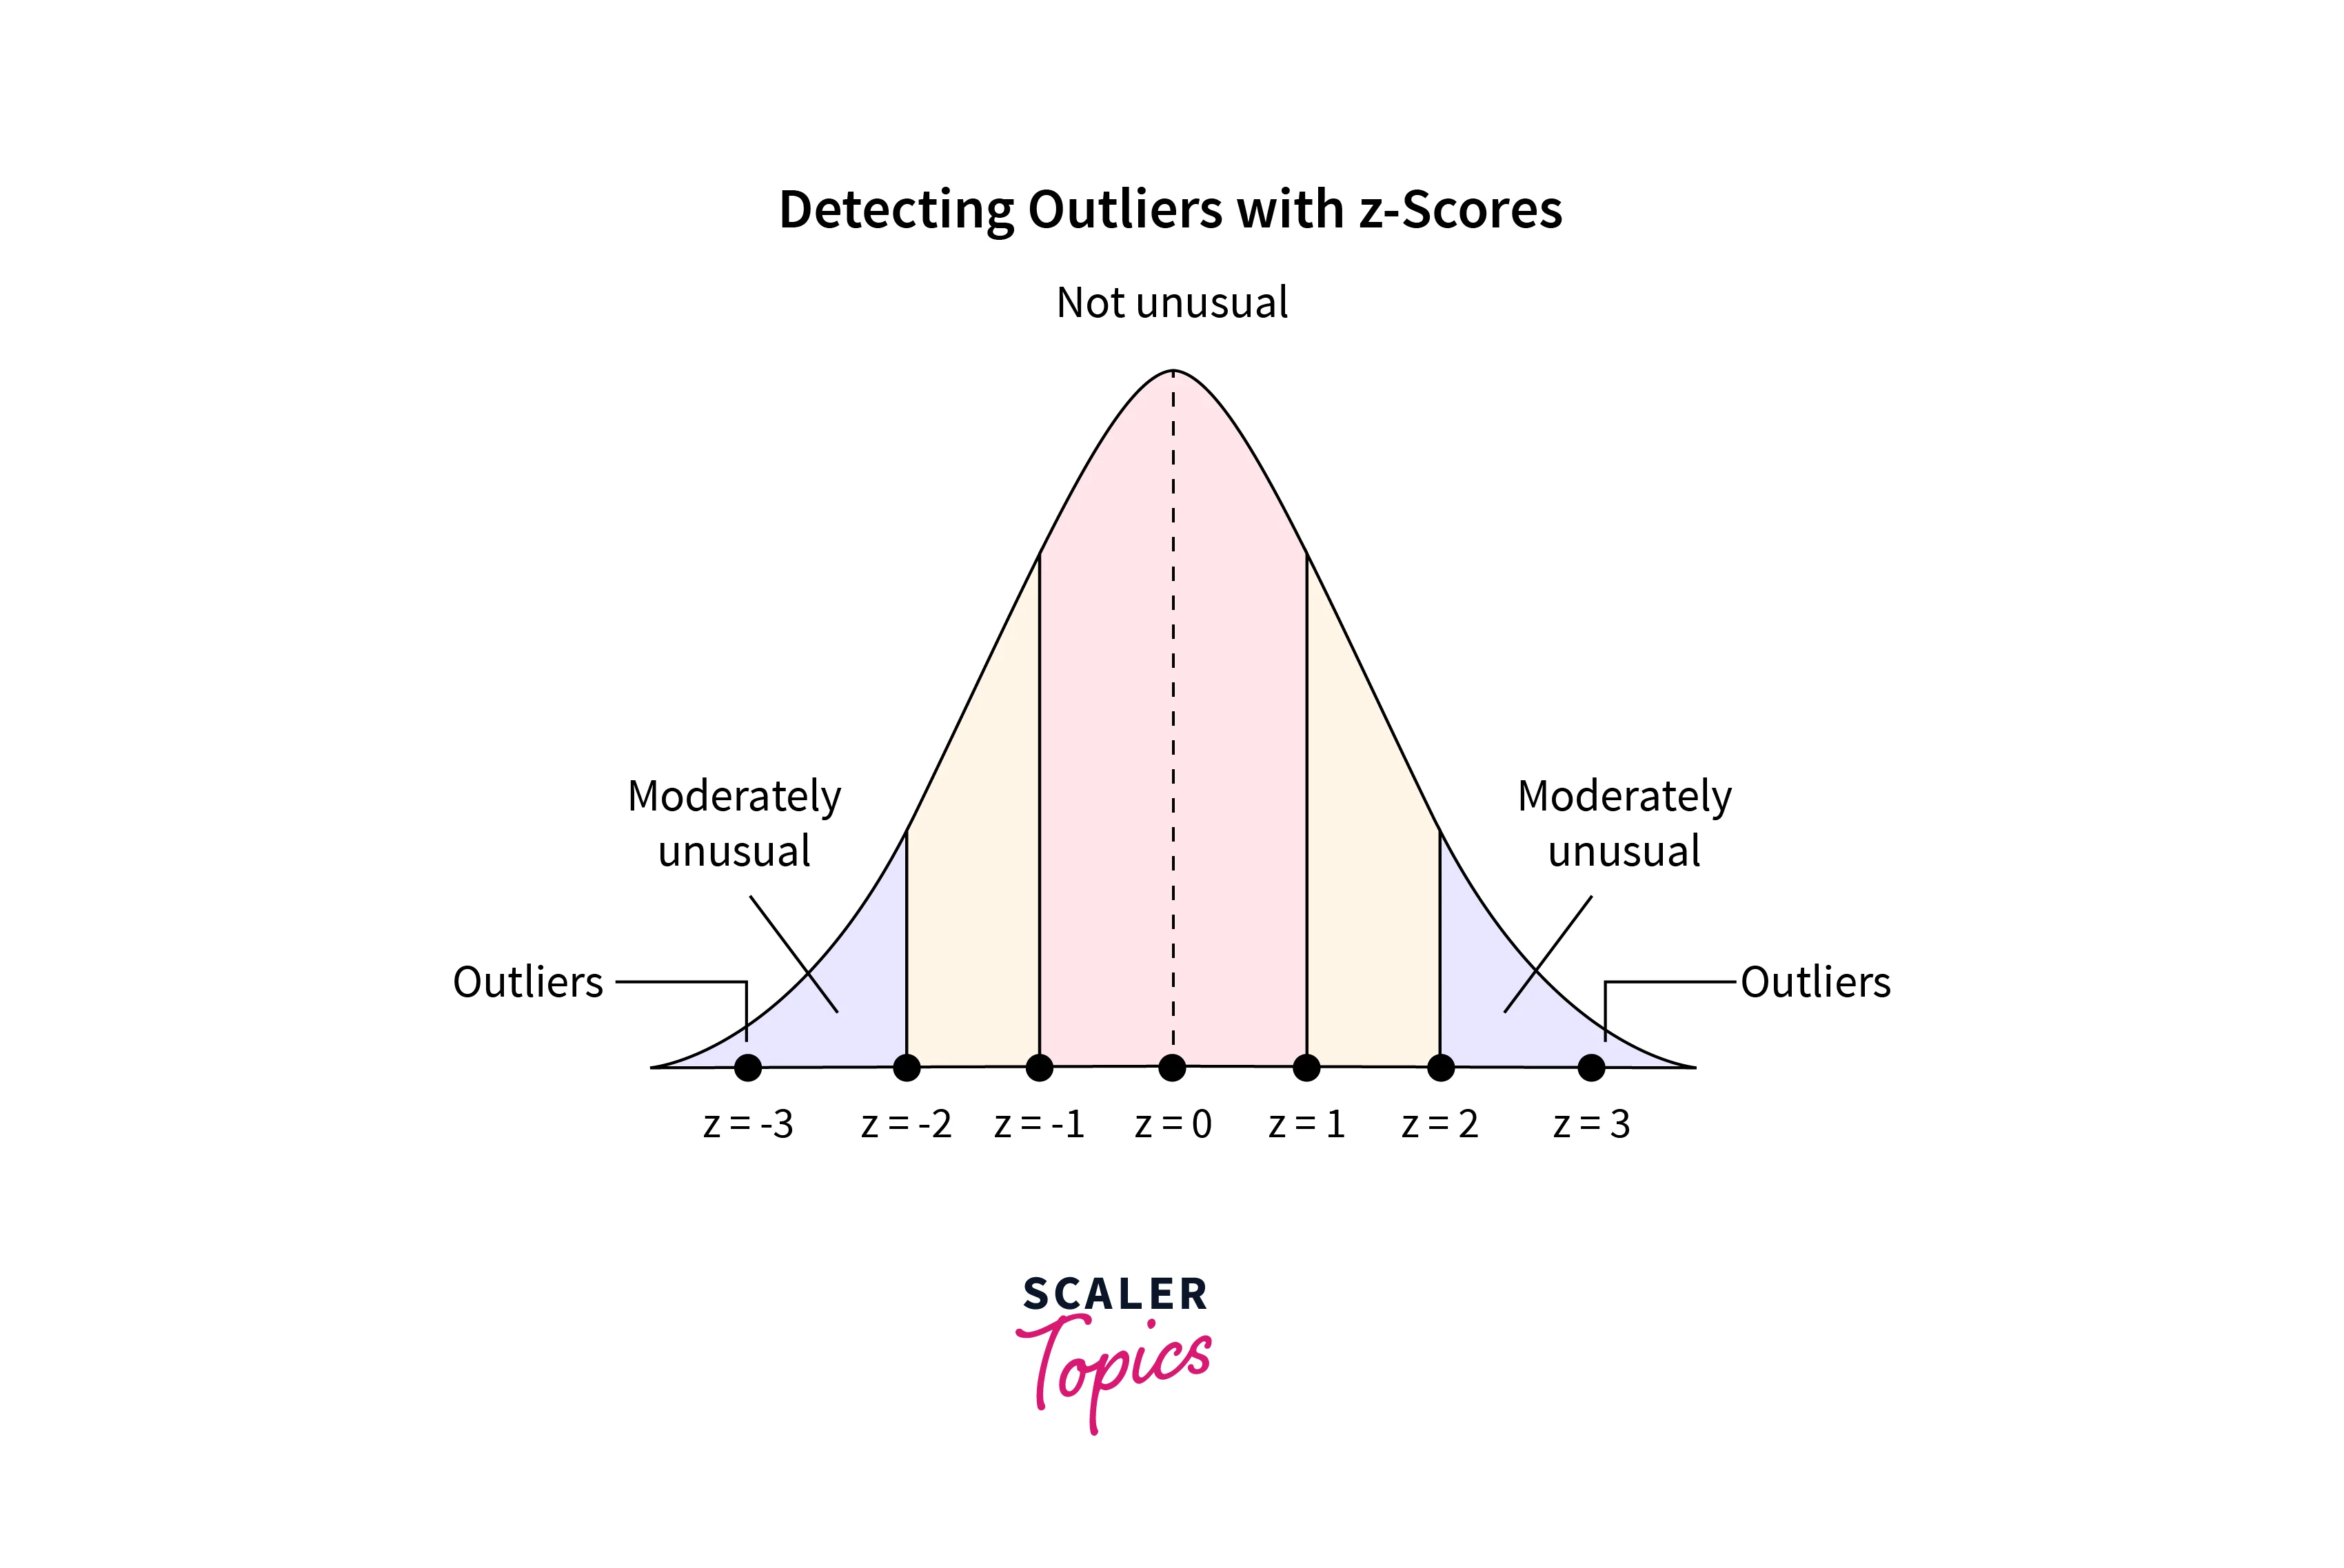
The Z-score of a data point is calculated as the number of standard deviations it falls away from the mean of the dataset. Z-score represents a data point’s distance from the mean in terms of the standard deviation. Mathematically, the Z-score for a data point x is calculated as -
Using Z-Score, we can define the upper and lower bounds of a dataset. A data point with a Z-score greater than a certain threshold (usually 2.5 or 3) is considered an outlier.
Distance From The Mean Method
The distance from the mean method is another approach to outlier detection in a dataset. It is useful in detecting outliers in multivariate analysis. This method involves calculating the distance of each data point from the mean of the dataset and then comparing those distances to a threshold value. A data point's distance from the mean greater than the threshold is considered an outlier.
The threshold value can be set based on the distribution of the distances, such as a certain percentile or multiple of the standard deviation.
Let’s explore how we can implement the above mentioned outlier detection methods in data mining using Python programming language, as shown below -
Explore a hands-on learning experience with this Best Data Science Course! Enroll now to gain certification from the best in the field!
Challenges of Outlier Detection Methods
Outlier detection is a challenging task in data analysis. There are several challenges associated with it. Some of the key challenges are -
- Choosing an appropriate method - There are many different outlier detection methods in data mining, and choosing the right method for a particular dataset and analysis goal can be difficult. For example, some methods may work better with specific data types, such as continuous or categorical variables, while others may be more appropriate for small or large datasets.
- Application-specific outlier detection - Outlier detection methods in data mining must be tailored to the specific application and domain. For example, the definition of an outlier may vary depending on the context, such as detecting fraudulent transactions in finance or identifying rare diseases in healthcare.
- Defining what constitutes an outlier - There is no universal definition of an outlier, and the definition may vary depending on the data and analysis goal. For example, a data point may be considered an outlier based on its distance from the mean or median, its frequency of occurrence, or its deviation from a model or expected pattern.
- Handling the noise in outlier detection - Outliers are different from noise. Due to this, outlier detection methods in data mining may be sensitive to noise in the data, which can lead to false positives or negatives.
- Interpretability - Outlier detection methods in data mining may produce difficult results to interpret or explain, especially in complex or high-dimensional datasets. For example, identifying a cluster of outliers in a high-dimensional space may be difficult to visualize or explain.
- Handling high-dimensional data - Outlier detection in high-dimensional data is a challenging problem, as traditional methods may not be effective or may suffer from the "curse of dimensionality." For example, distance-based outlier detection methods in data mining may become less reliable as the number of dimensions increases, and other outlier detection methods in data mining may require significant computational resources or feature selection techniques.
Outlier Detection Applications
Outlier detection has many applications in various domains. Some of the most common applications are -
- Fraud detection - Outlier detection is widely used in finance and banking to identify fraudulent transactions, such as credit card fraud or money laundering.
- Health monitoring - Outlier detection is used in healthcare to identify rare or unusual medical conditions or anomalies in medical data, such as ECG readings, blood test results, or medical images.
- Quality control - Outlier detection is used in manufacturing and production to identify defective products, such as faulty components or equipment failures.
- Network security - Outlier detection is used in network security to identify unusual or suspicious network traffic patterns, such as intrusion attempts or malware infections.
- Anomaly detection - Outlier detection is used in various domains to identify anomalies or unusual patterns in data, such as environmental monitoring, sensor data analysis, or social media analysis.
Curious about data science? Scaler Topics' free course offers you a window into this exciting world, equipping you with skills to turn data into actionable knowledge.
Conclusion
- Outlier detection methods in data mining vary, ranging from simple techniques such as box plots and IQR to more complex methods such as machine learning and statistical models.
- Choosing appropriate outlier detection methods in data mining depends on the data type, the analysis goal, and the application context. It is important to consider the challenges associated with outlier detection, such as defining what constitutes an outlier, handling noise and interpretability issues, and dealing with high-dimensional data.
- Outlier detection methods in data mining can provide valuable insights into data, including identifying rare or unusual patterns, detecting anomalies and fraud, improving quality control and predictive maintenance, and enhancing cybersecurity and network security.