How to Use Pandas Groupby and Sum?
The groupby function in Pandas is used when working with huge dataframes and categorizing their order. There are three stages involved when using the group by function to state it in descriptive terms.
First, the data is separated into groups, a function is applied to every group, and then the data is reassembled to generate the output.
Pandas group by function is advantageous in Data Science as it lets us combine data effectively and helps us make sense of data. It can be used with either single or multiple rows and columns. The resultant output of the function is an object.
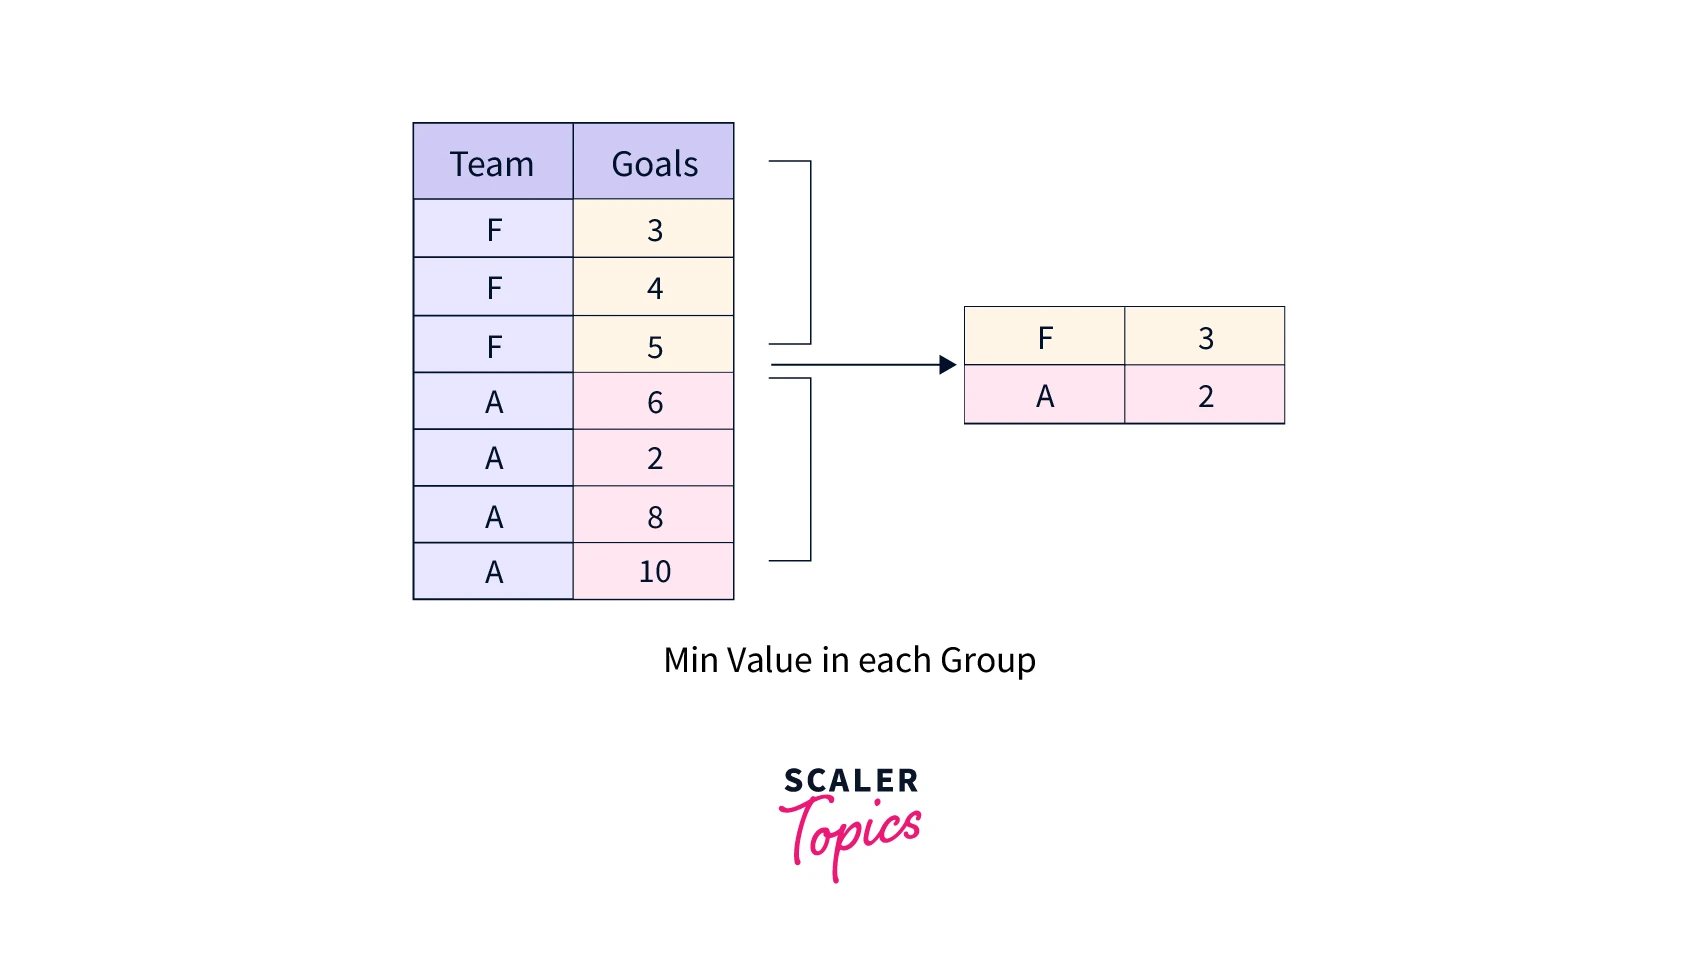
In the case of Pandas Group by Sum method, the output is generated after grouping and adding all the values in each column. The return type is usually a series or a dataframe object depending on the operation.
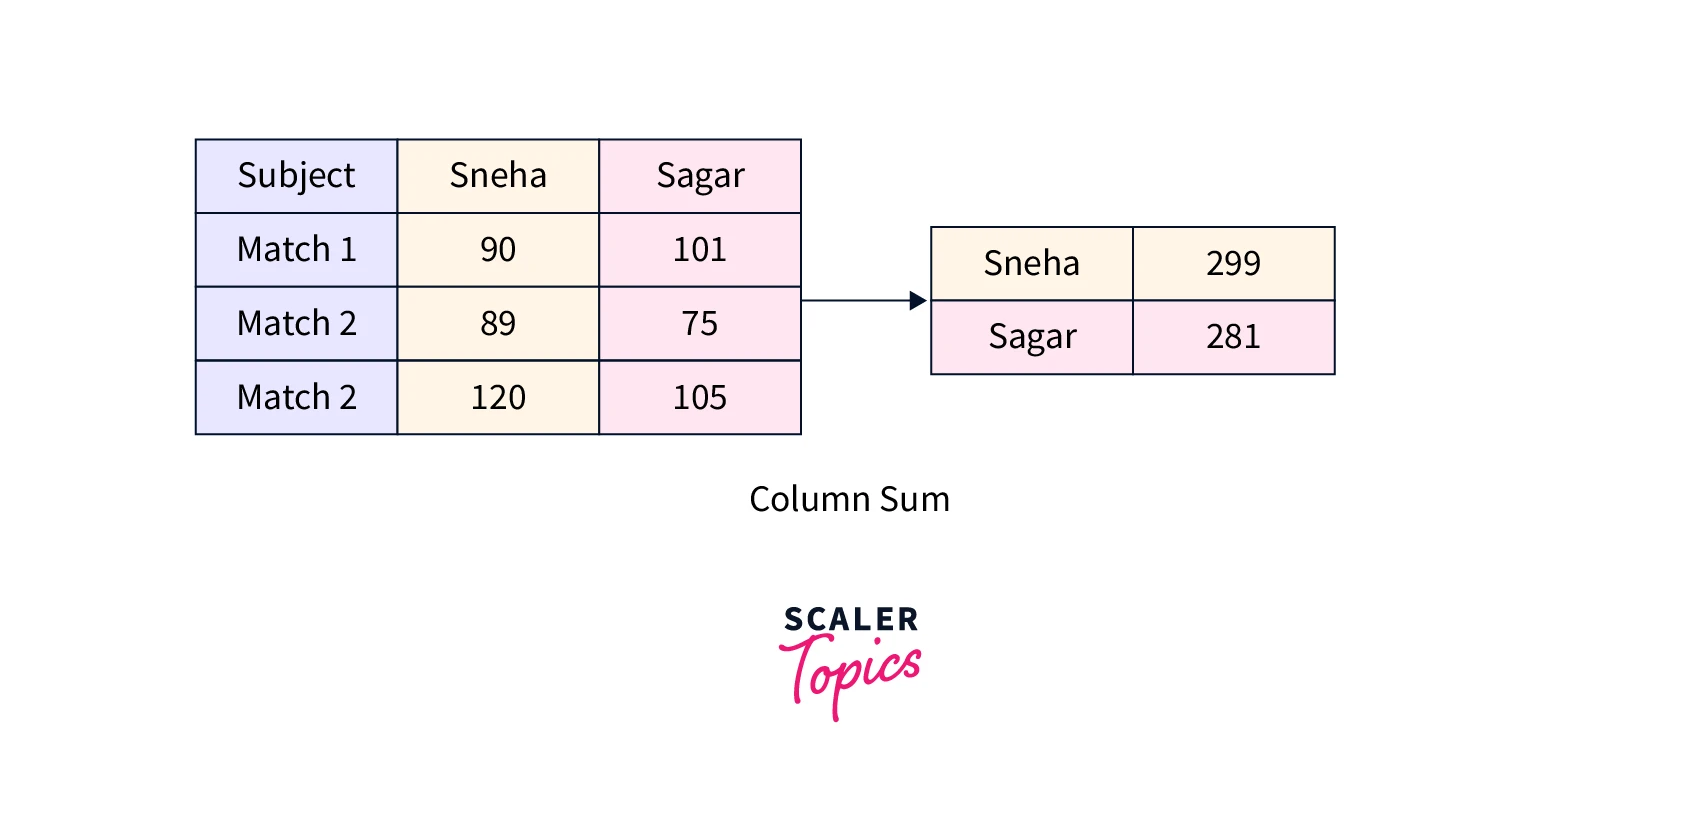
When the given value is an index axis, all the values in that column will be added, extending to all the columns. The result is a series that comprises the total of each column's values.
While calculating the DataFrame's total, it provides the option of skipping across any missing values.
Syntax
Syntax for Groupby
For one column:
For pandas groupby sum multiple columns:
Here, result is the resultant dataframe, data is the dataframe on which we are applying the function, and col1, col2, and col3 are the columns of the dataframe data.
Syntax for Sum
Here, data is the name of the dataframe on which the method sum is applied, and col1 is the name of the column.
Many parameters can be applied to the sum method in Pandas, like :
- skip_na :
to skip null values - axis :
to check which axis to work with in large datasets - level :
used when there is a hierarchy, i.e. multi indexing which helps to identify rows or columns when the dataframe is being manipulated - kwargs :
to accept or not to accept keyword arguments
Examples
Let us begin by building a dataset called the "Starbucks Price Dataset".
Output:
Using Pandas groupby sum with Column Name:
Output:
As the heading suggests, here we have used the group by function with the sum method on the 'Type' column. The output shows the prices for each distinct type, and the adjacent columns contain the sum for each value.
Using Pandas groupby sum Multiple Columns:
Output:
In this case, we have taken two values into consideration for grouping, i.e. type and beverage and the sum of prices in the Grande column.
Using Group By with Get sum() :
As we know, we can use any method with the group by function. Here we have specified sum. Similarly, we can use the count, average, mean, or other methods too. Here, the result is the sum of the Grande prices for every type of beverage.
Output :
Here, we have used the aggregate function to use the sum function. We can use multiple functions at the same time using the aggregate function.
Descending sort using Group By:
The default for the group by function is ascending order. For the resultant dataframe to be descending, we use the ascending parameter and set it as false.
Output:
Here, first, we have grouped the beverages as a set, then reset the indices, and then converted it to a dataframe again. The output we obtain is the descending sum of the beverages in the dataset.
Using the aggregate function:
A very similar method to substitute group by and the sum is the aggregate method, represented as agg. It can be used directly with the dataframe or with the apply function on the dataframe.
Output:
Using transform() Function with DataFrame.GoupBy().sum() :
The transform function returns a dataframe with the same indices as the original one with transformed values. This is useful when we have to split data into categories and combine them again.
Output:
Here, the type column is grouped by the beverage column in ascending order of their sum.
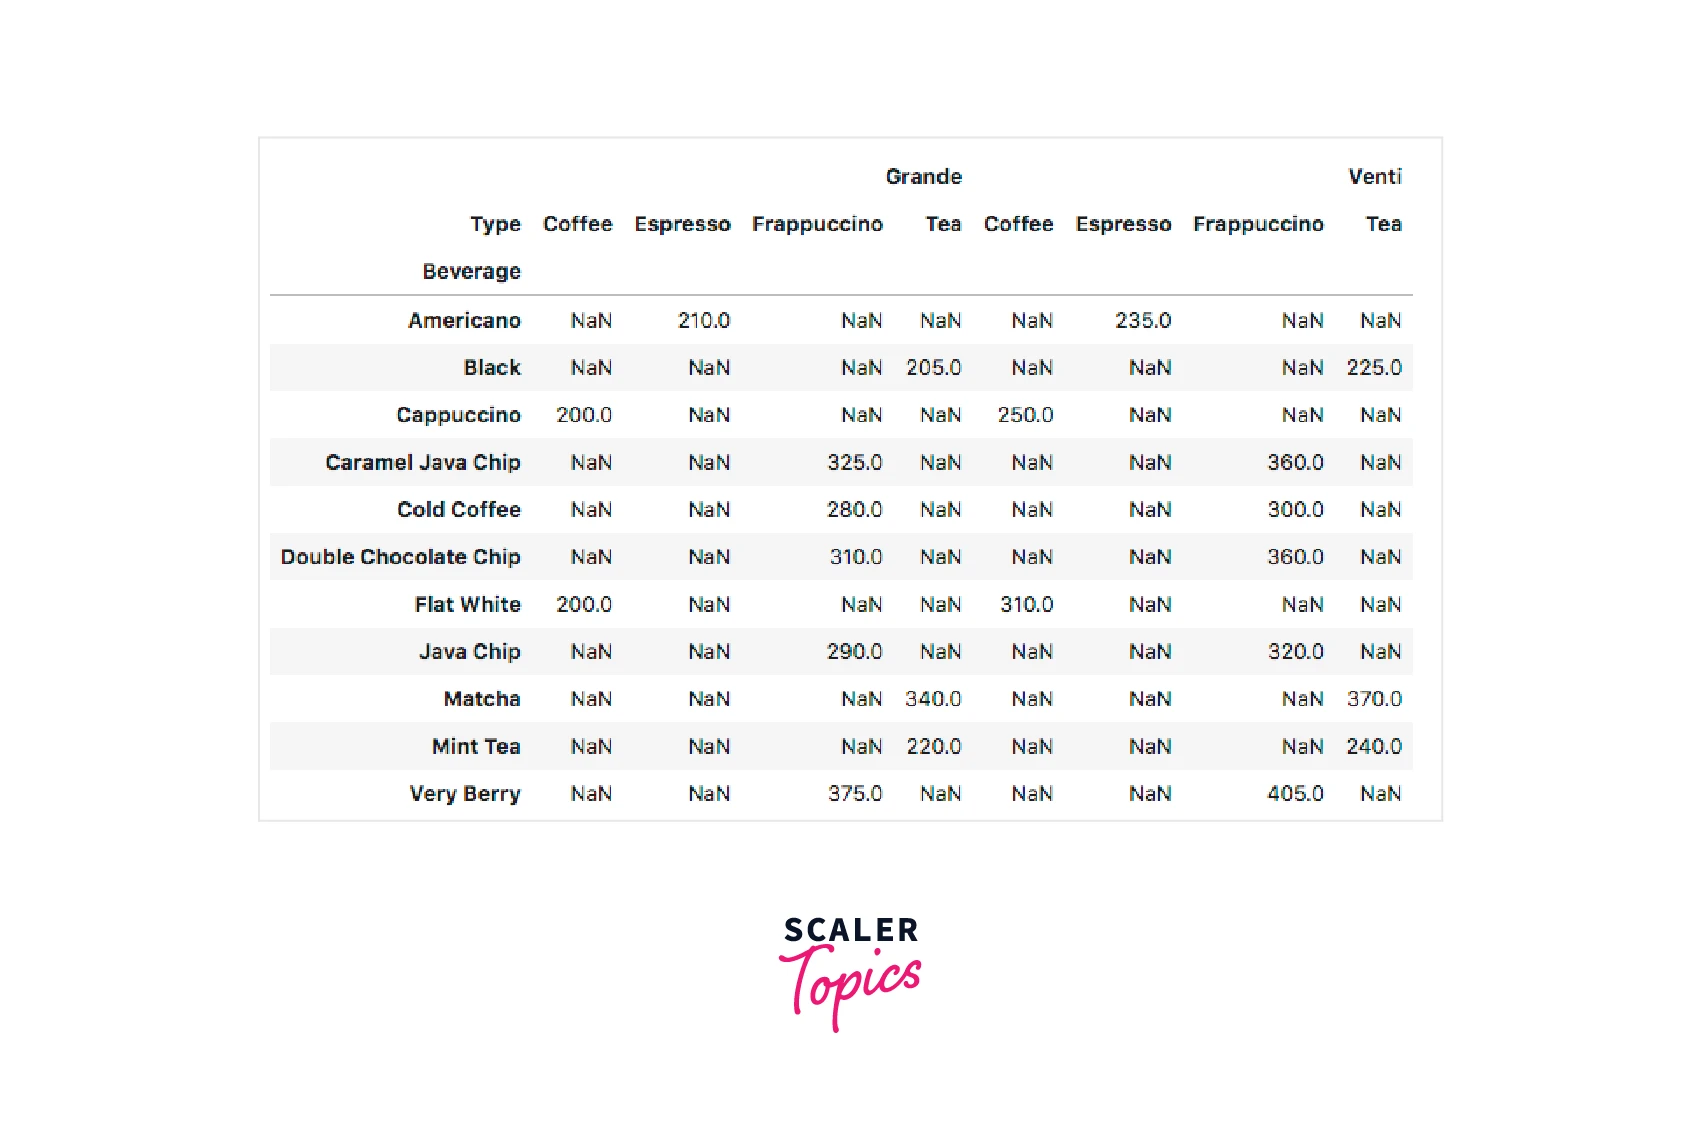
Using pivot function:
As discussed earlier, time series is one of the most common applications of Pandas. The pivot function plays a vital role in this by helping to reshape data where unique values are present, and each index maps to a different matter. The Pivot function builds a pivot table from the Pandas library that represents the results of a feature in a compact two-dimensional table.
 Here, Beverage is the pivoted column, and the column to be pivoted is Type, along which the output dataframe is built.
Conclusion
- Pandas Group By function can be used to categorize data.
- We can group either single or multiple attributes together using various methods.
- One common method used with the groupby is the sum method, which returns the sum of the required columns or attributes.
- We can use pandas groupby sum multiple columns when handling large data.