Power BI - How to Format Table?
Overview
In this article, we will explore the essential techniques and best practices for formatting tables in Power BI. Power BI tables are data visualization elements that organize information in rows and columns, allowing users to present and analyze data efficiently. Understanding how to apply various formatting options in Power BI will enhance the visual appeal and readability of your reports, enabling you to convey insights more effectively.
When to Use a Power BI Table
Tables prove to be a valuable choice in various scenarios, as mentioned below -
- Representing numerical data by category with multiple measures.
- Displaying data as a matrix or in a tabular format with rows and columns.
- Reviewing and comparing detailed data and exact values rather than visual representations.
- Viewing data at a granular level to explore details thoroughly.
- Showing all available rows in specific columns for comprehensive data analysis.
- When a visual representation of data is not necessary
- Presenting a larger number of numerical column data categorized efficiently.
Creating a Simple Table
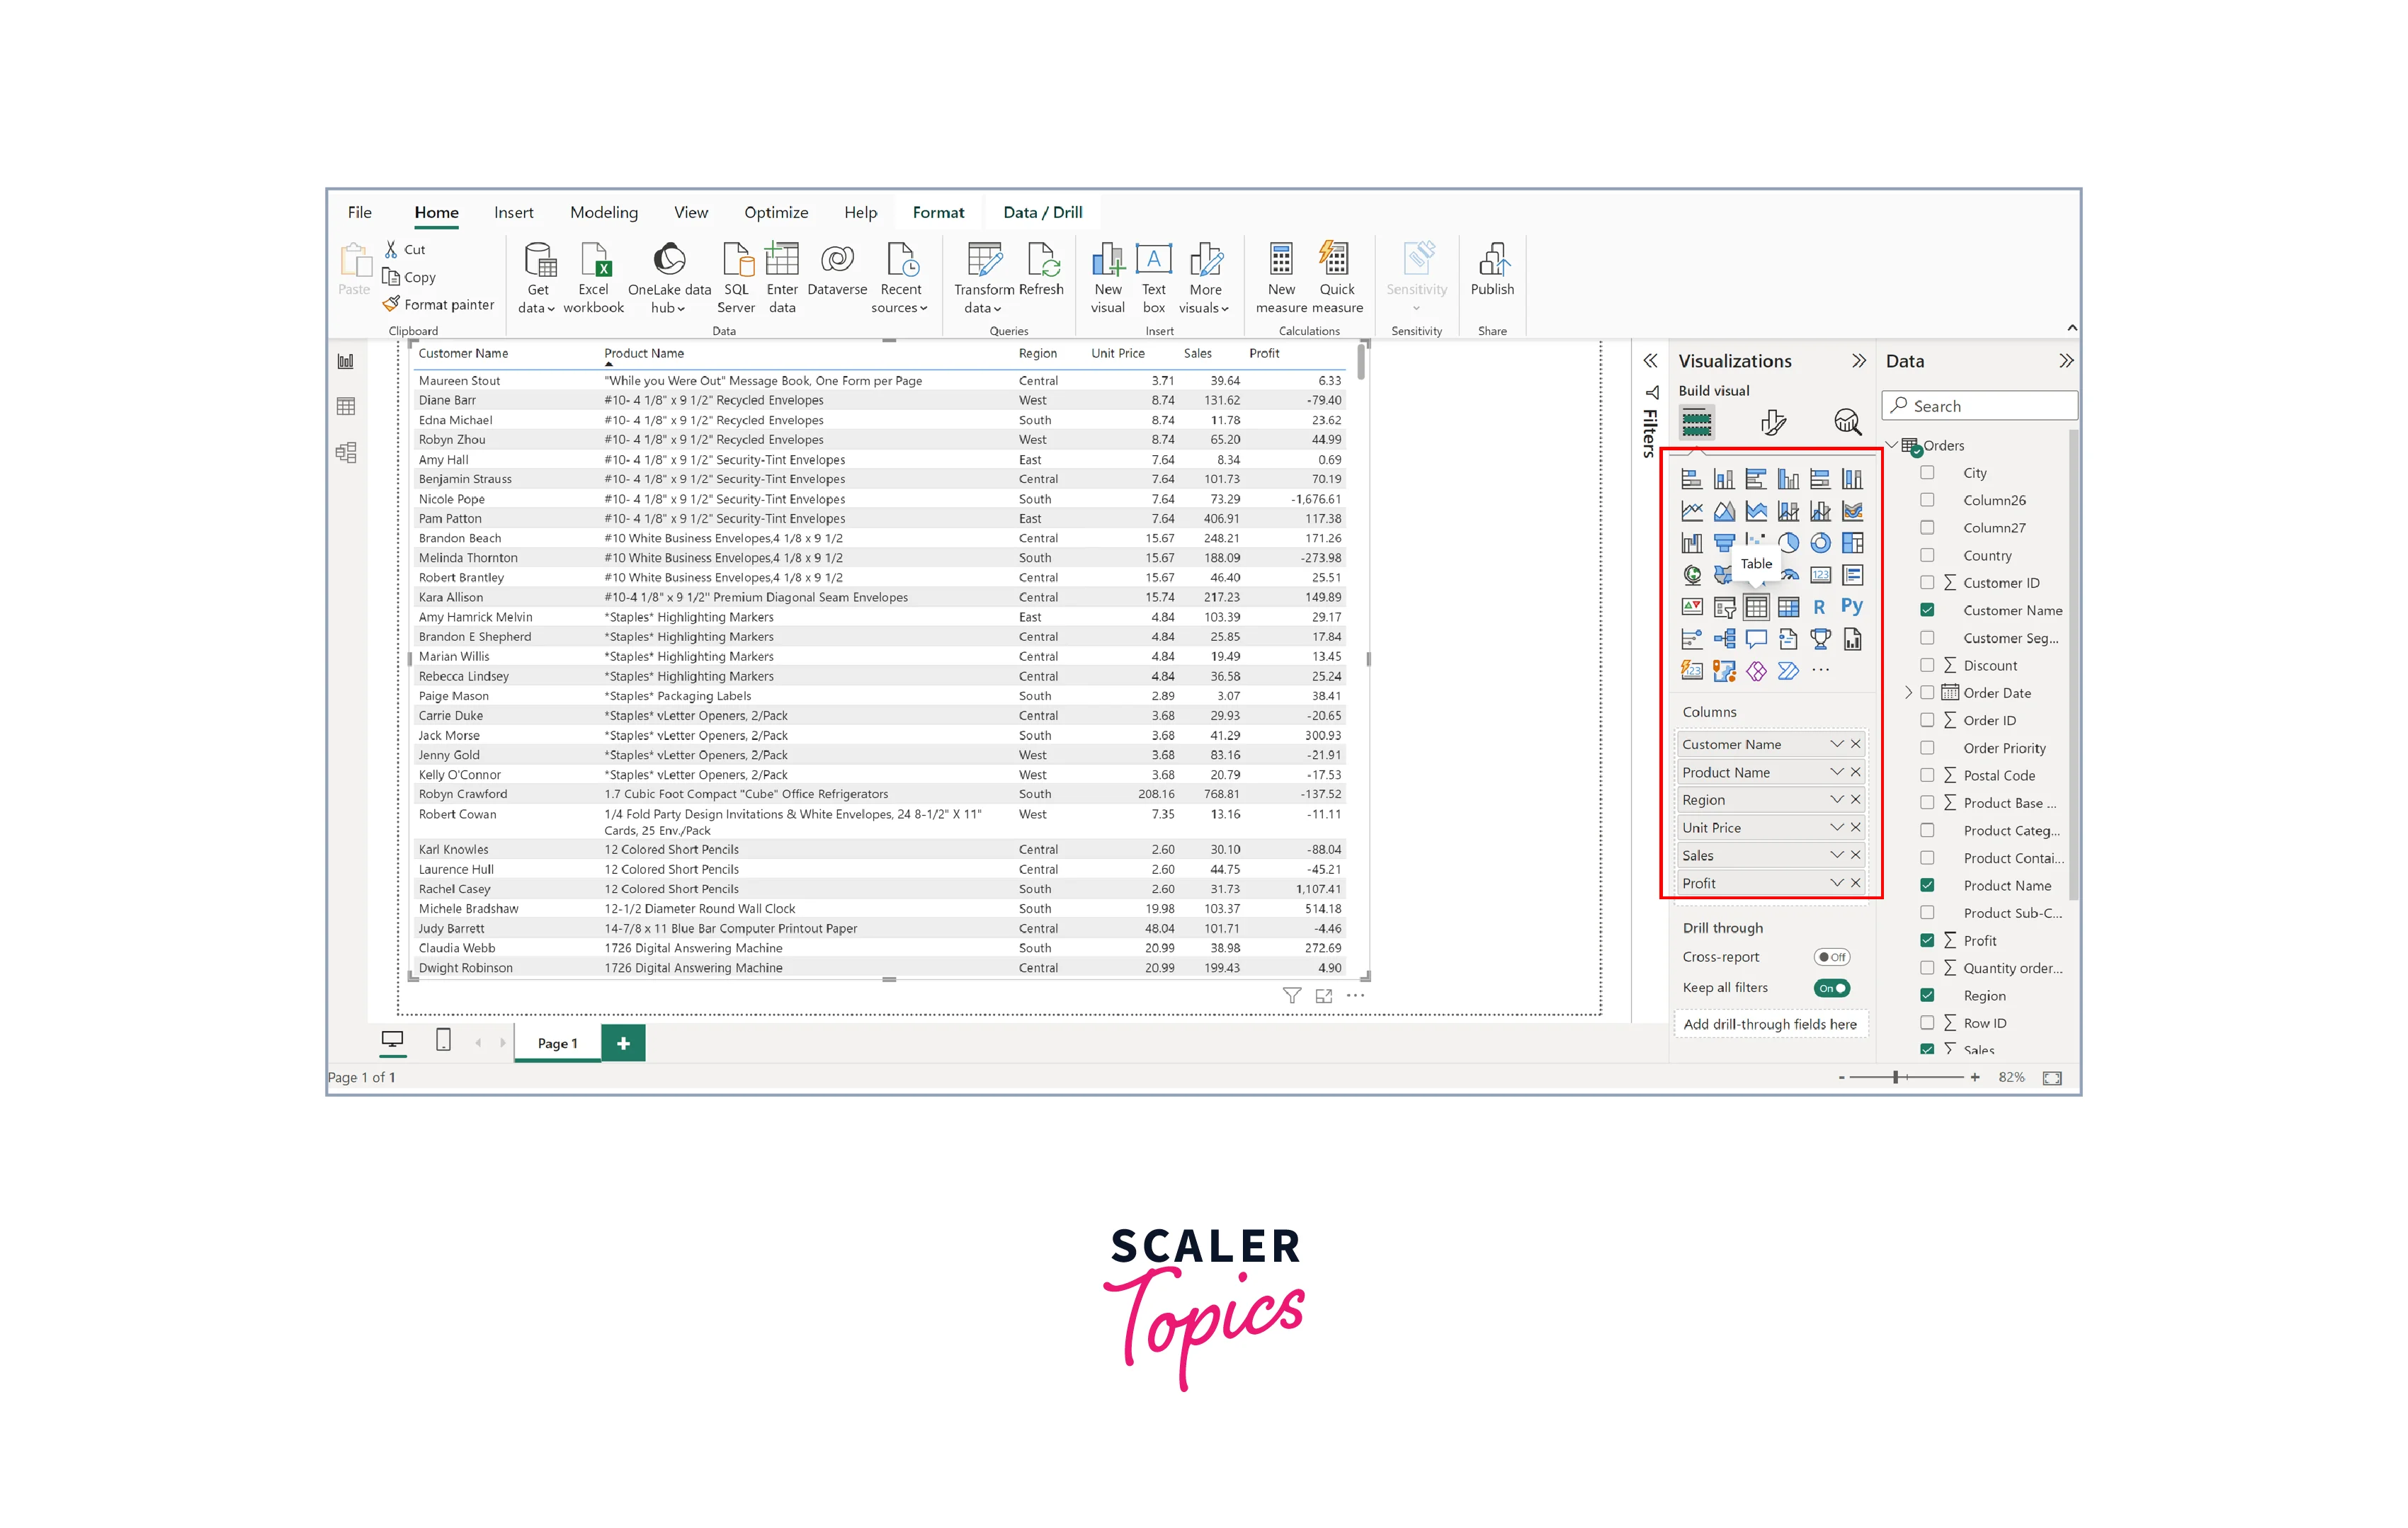
To create a table in Power BI, follow these simple steps -
- Open Power BI Desktop and navigate to the report or page where you want to add the table.
- Click on the "Table" icon from the Visualizations pane on the right-hand side. The table icon in Power BI looks like a grid with rows and columns.
- Drag and drop the desired fields from your data source into the "Columns" field to populate the table with data. Your table is now ready to present and analyze data in a structured and organized manner.
Formatting a Table
In this section, we will explore various ways to format the table, enhancing its visual appeal and readability.
Format Grid of a Table in Power BI
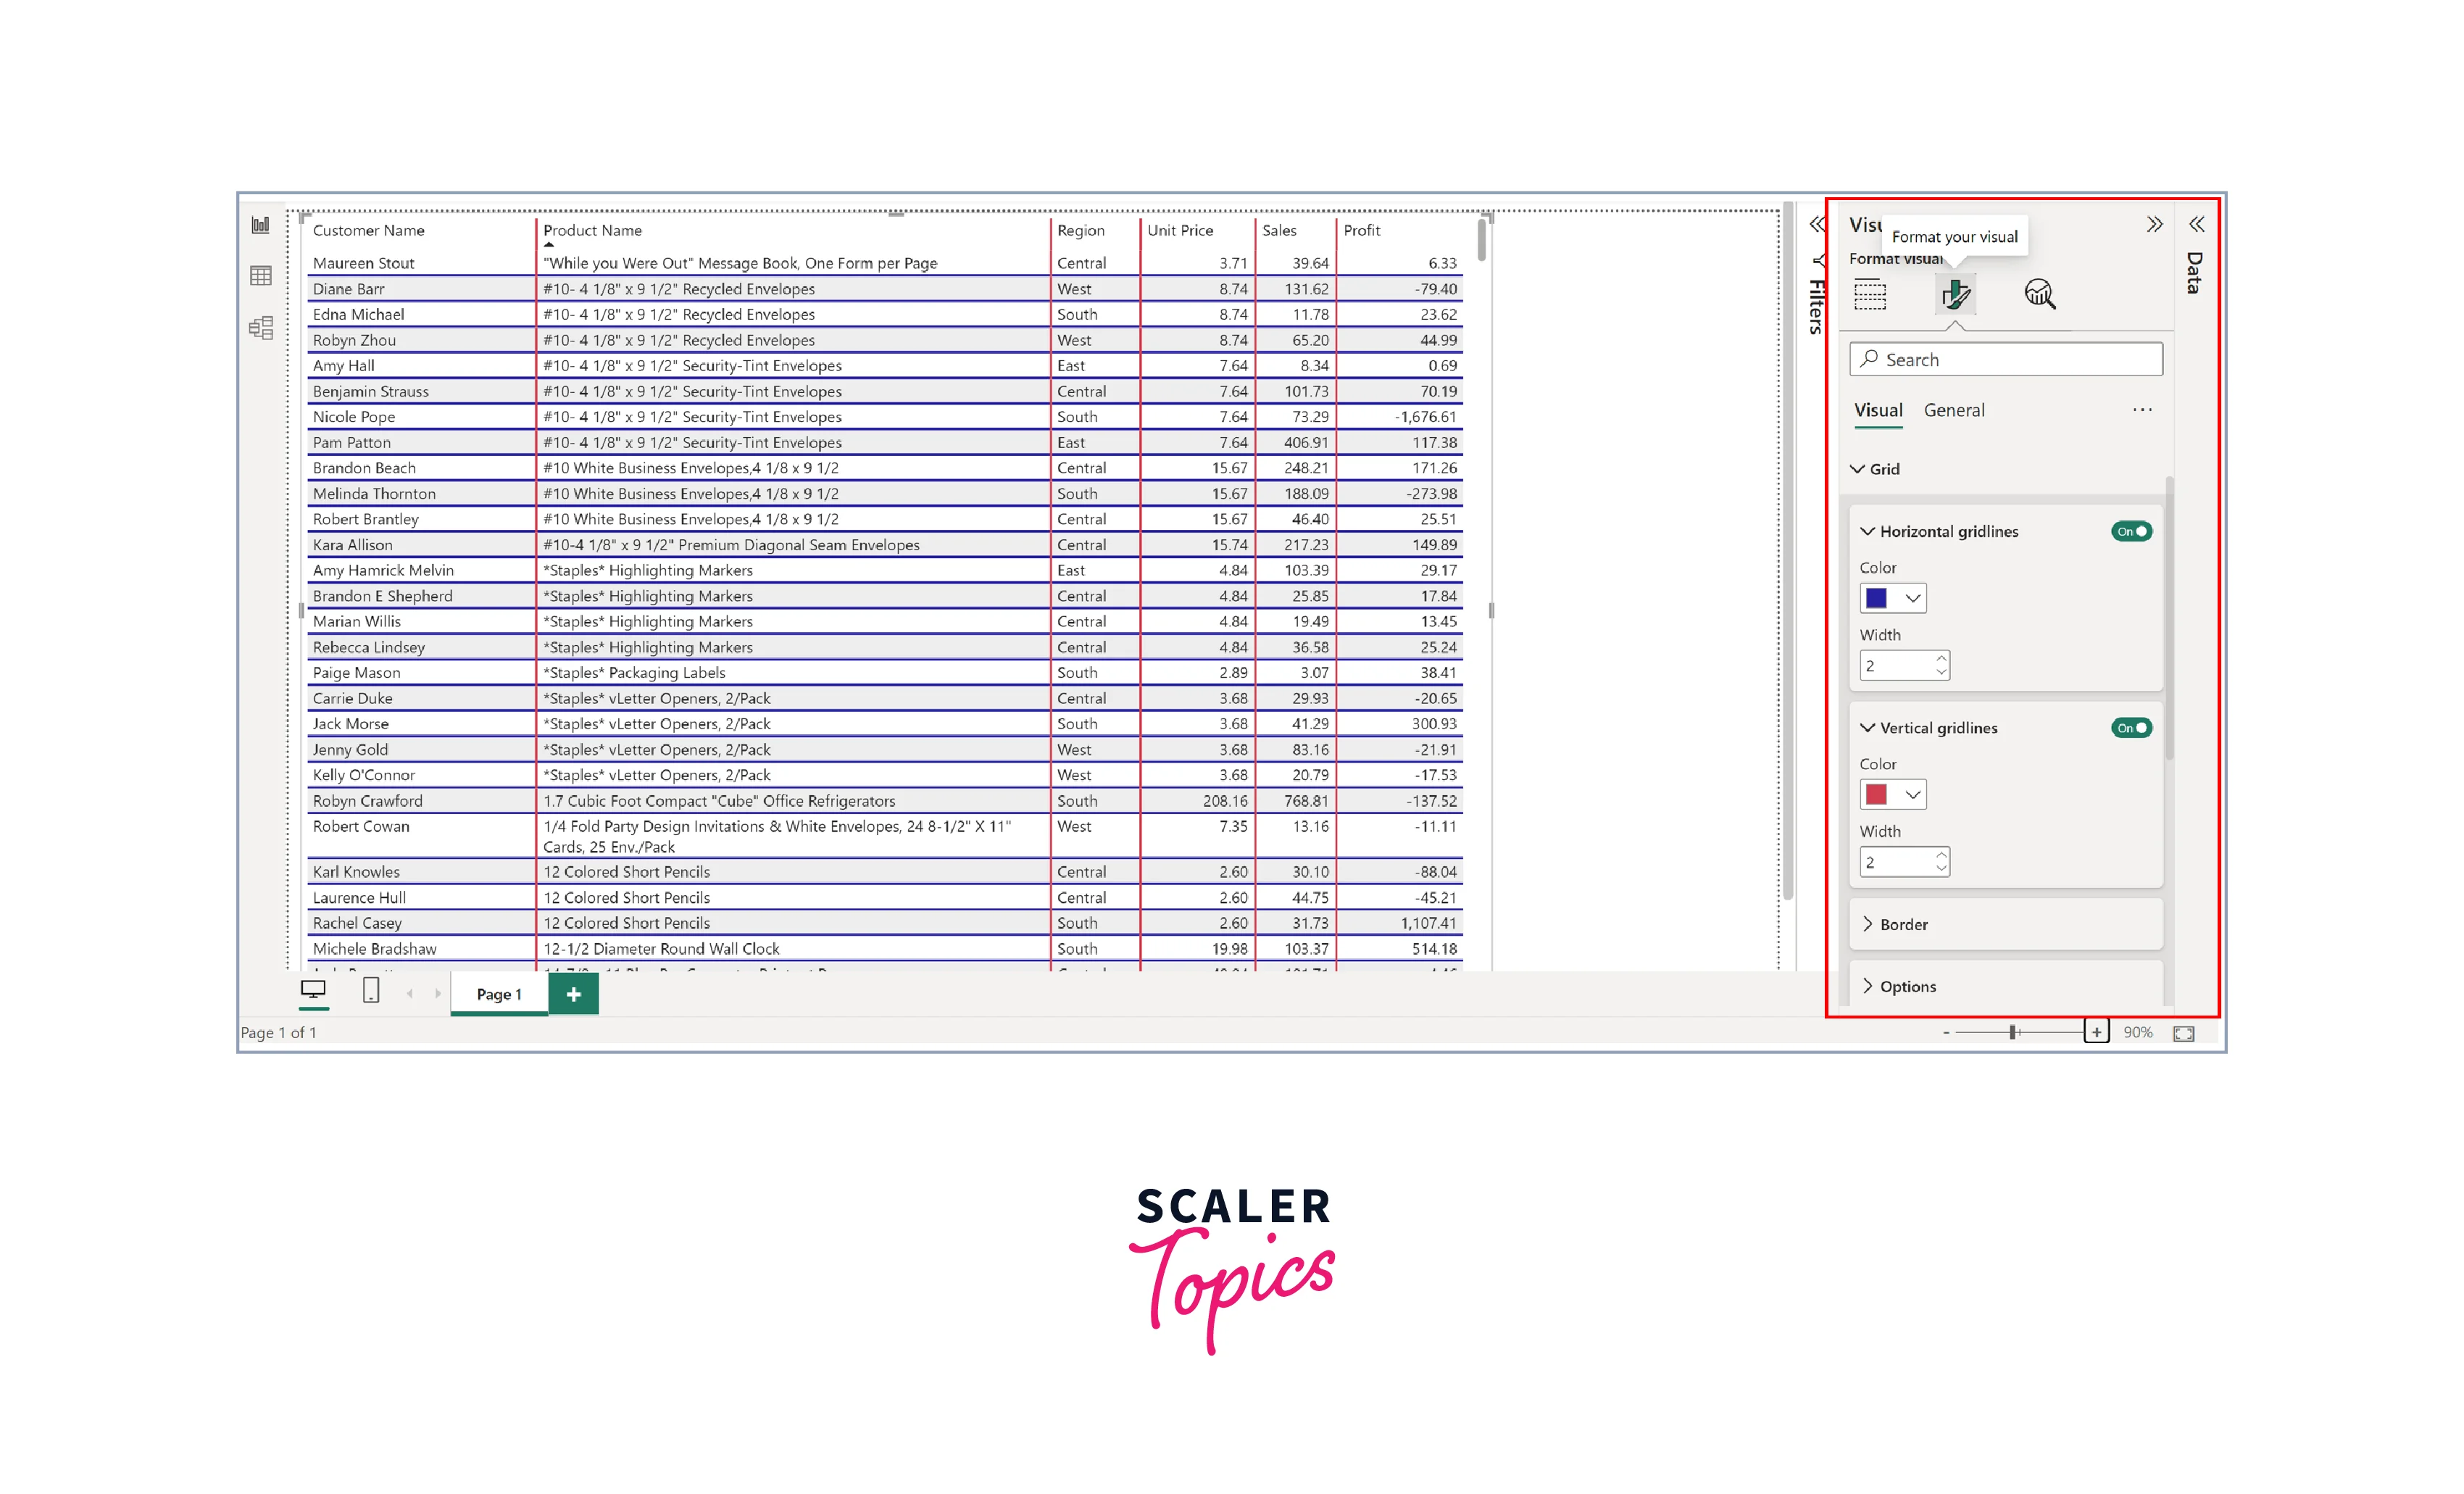
In the context of a table in Power BI, grids refer to the lines that separate rows and columns, forming a structured layout for data presentation. These grid lines act as visual guides, making it easier for users to interpret the data within the table.
In Power BI, you can format a table's horizontal, vertical, and border gridlines, as illustrated in the figure below. You can easily show or hide these gridlines by using toggle buttons, adjusting their visibility within the table. Moreover, you can customize the color and thickness of the gridlines to suit your preferred style and enhance the overall appearance of the table.
Format Column Headers of a Table in Power BI
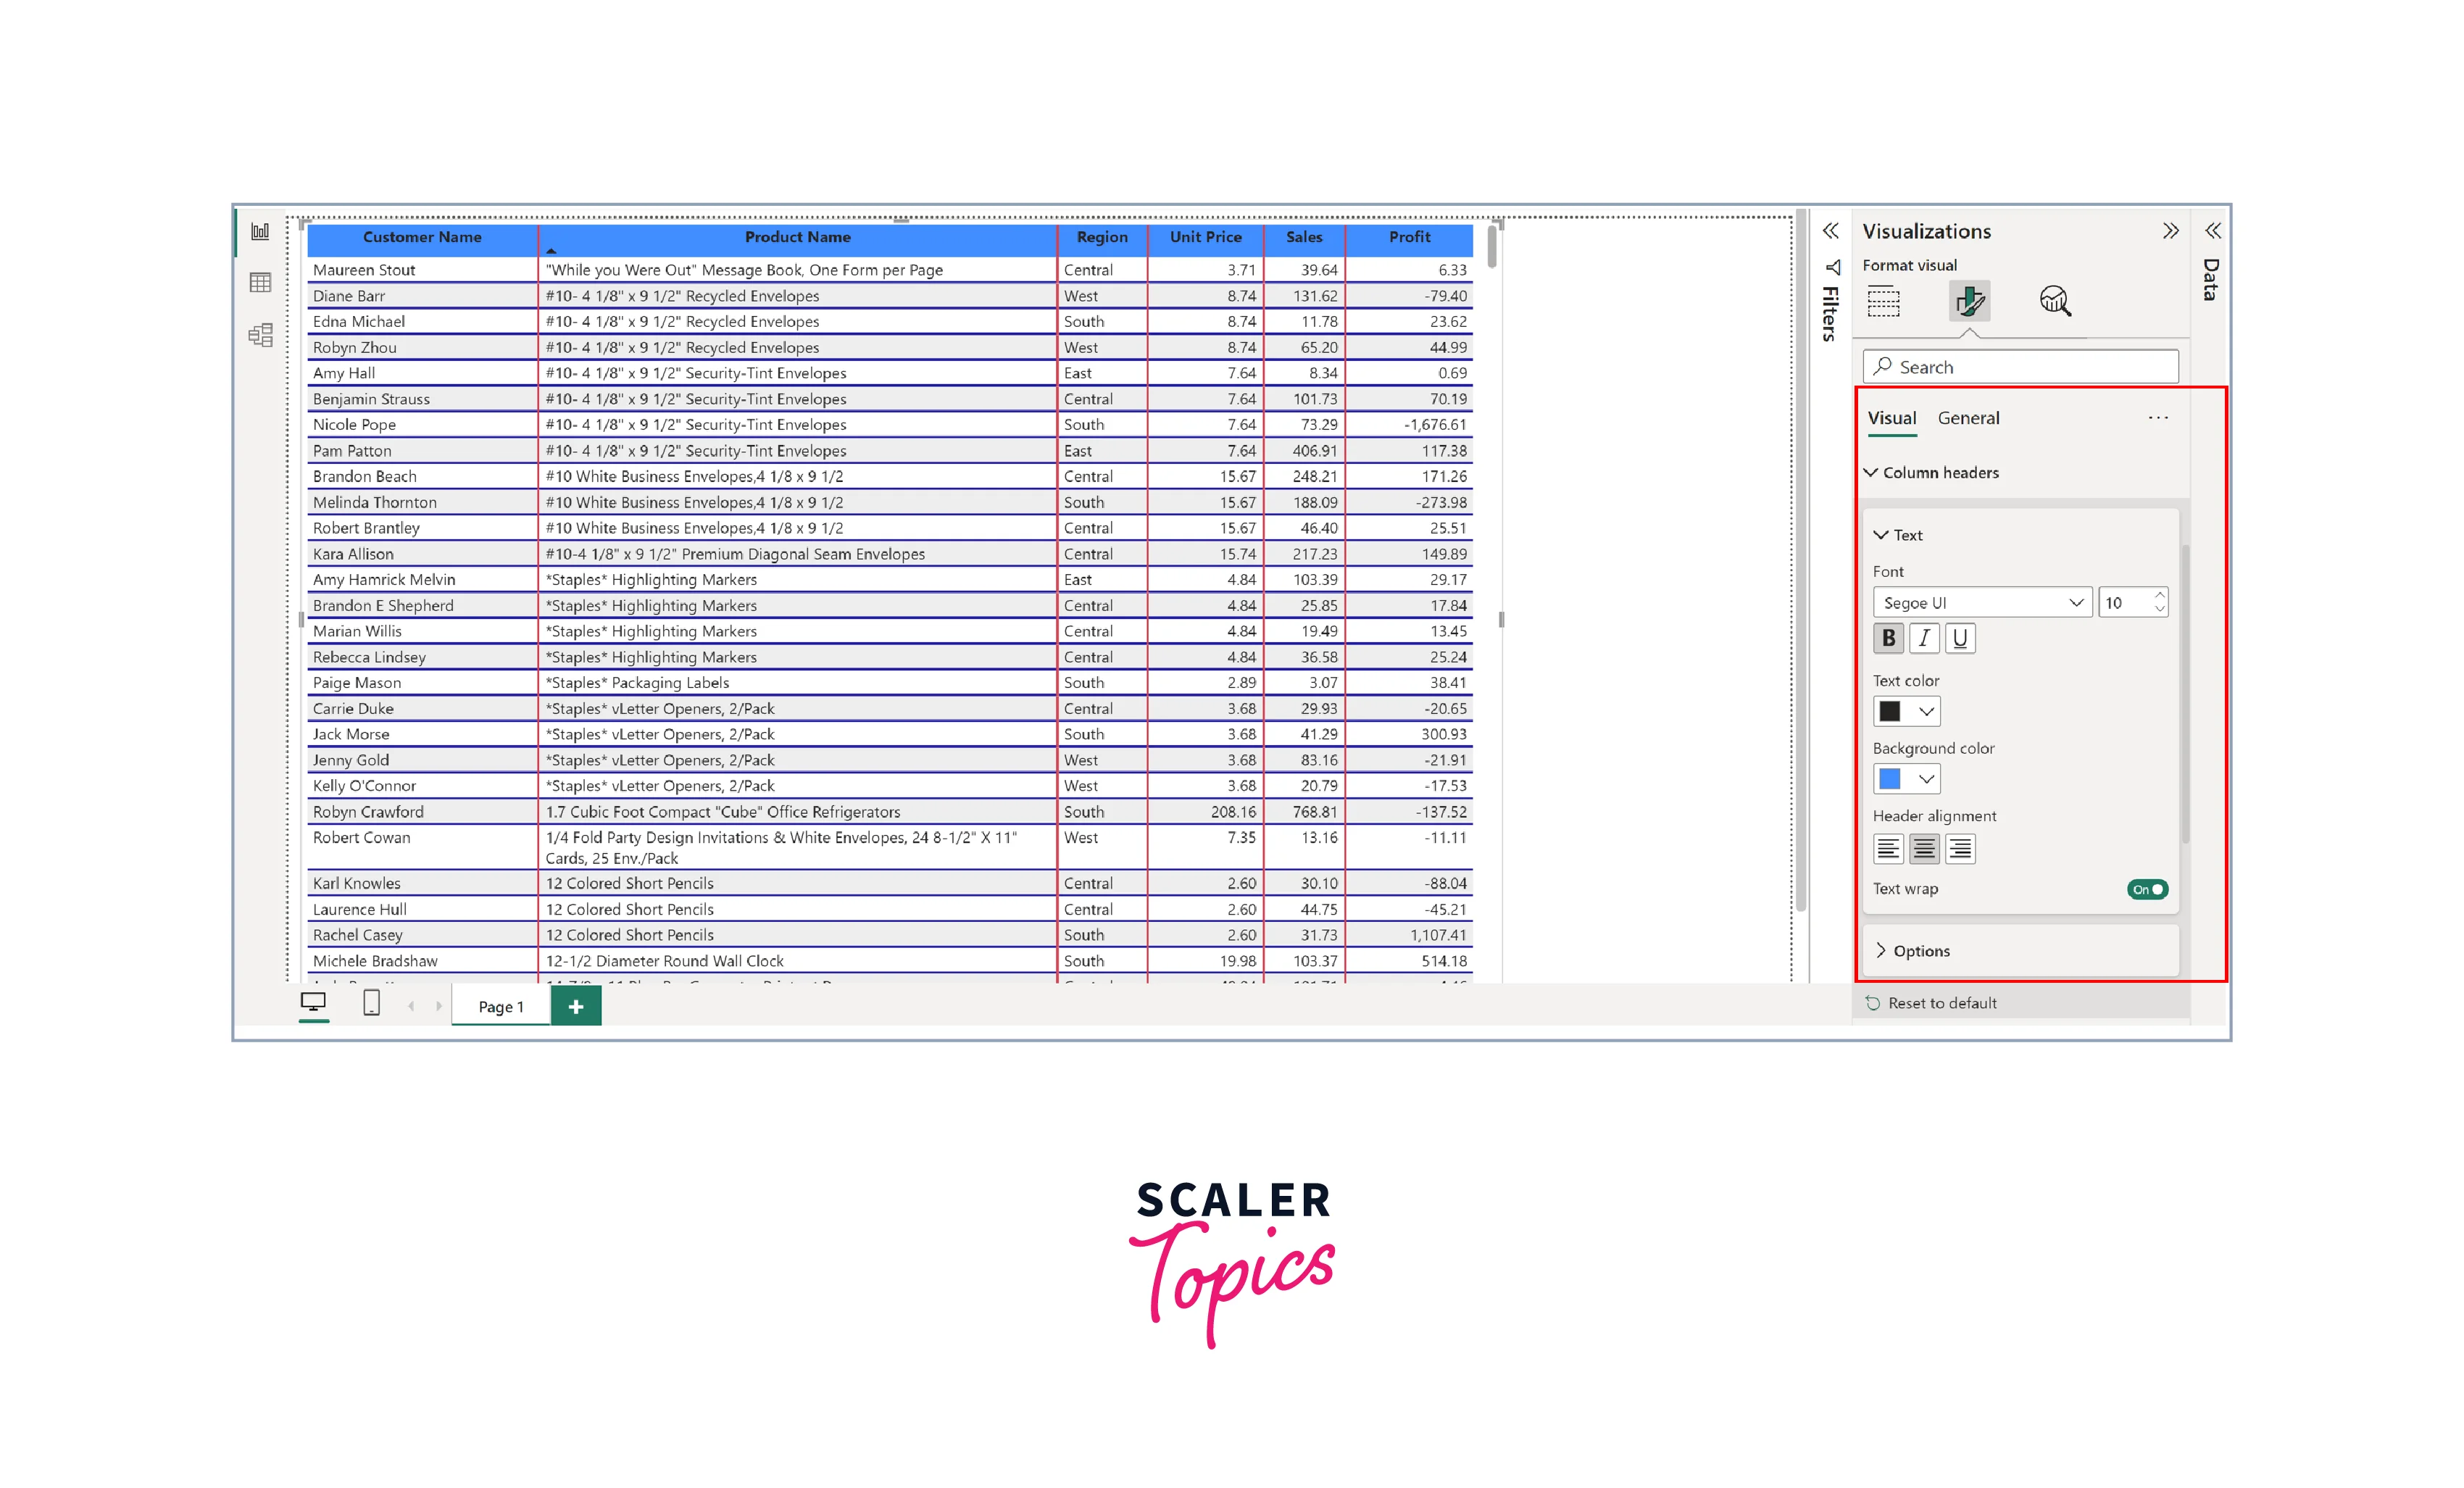
When working with tables in Power BI, you can easily format the column headers to suit your visualization needs. The platform offers various customization options for column headers, as shown below -
- Change Font Type - Modify the font type used in the column headers to match your report's style.
- Apply Font Style - Emphasize header text with options like bold, italic, or underline.
- Adjust Font Size - Resize the header text to enhance visibility or achieve a balanced look.
- Modify Text Color - Customize the color of the header text to fit your report's theme.
- Set Background Color - Personalize the background color of column headers.
- Align Headers - Choose from left, right, or center alignment for the header text.
Format Values of a Table in Power BI
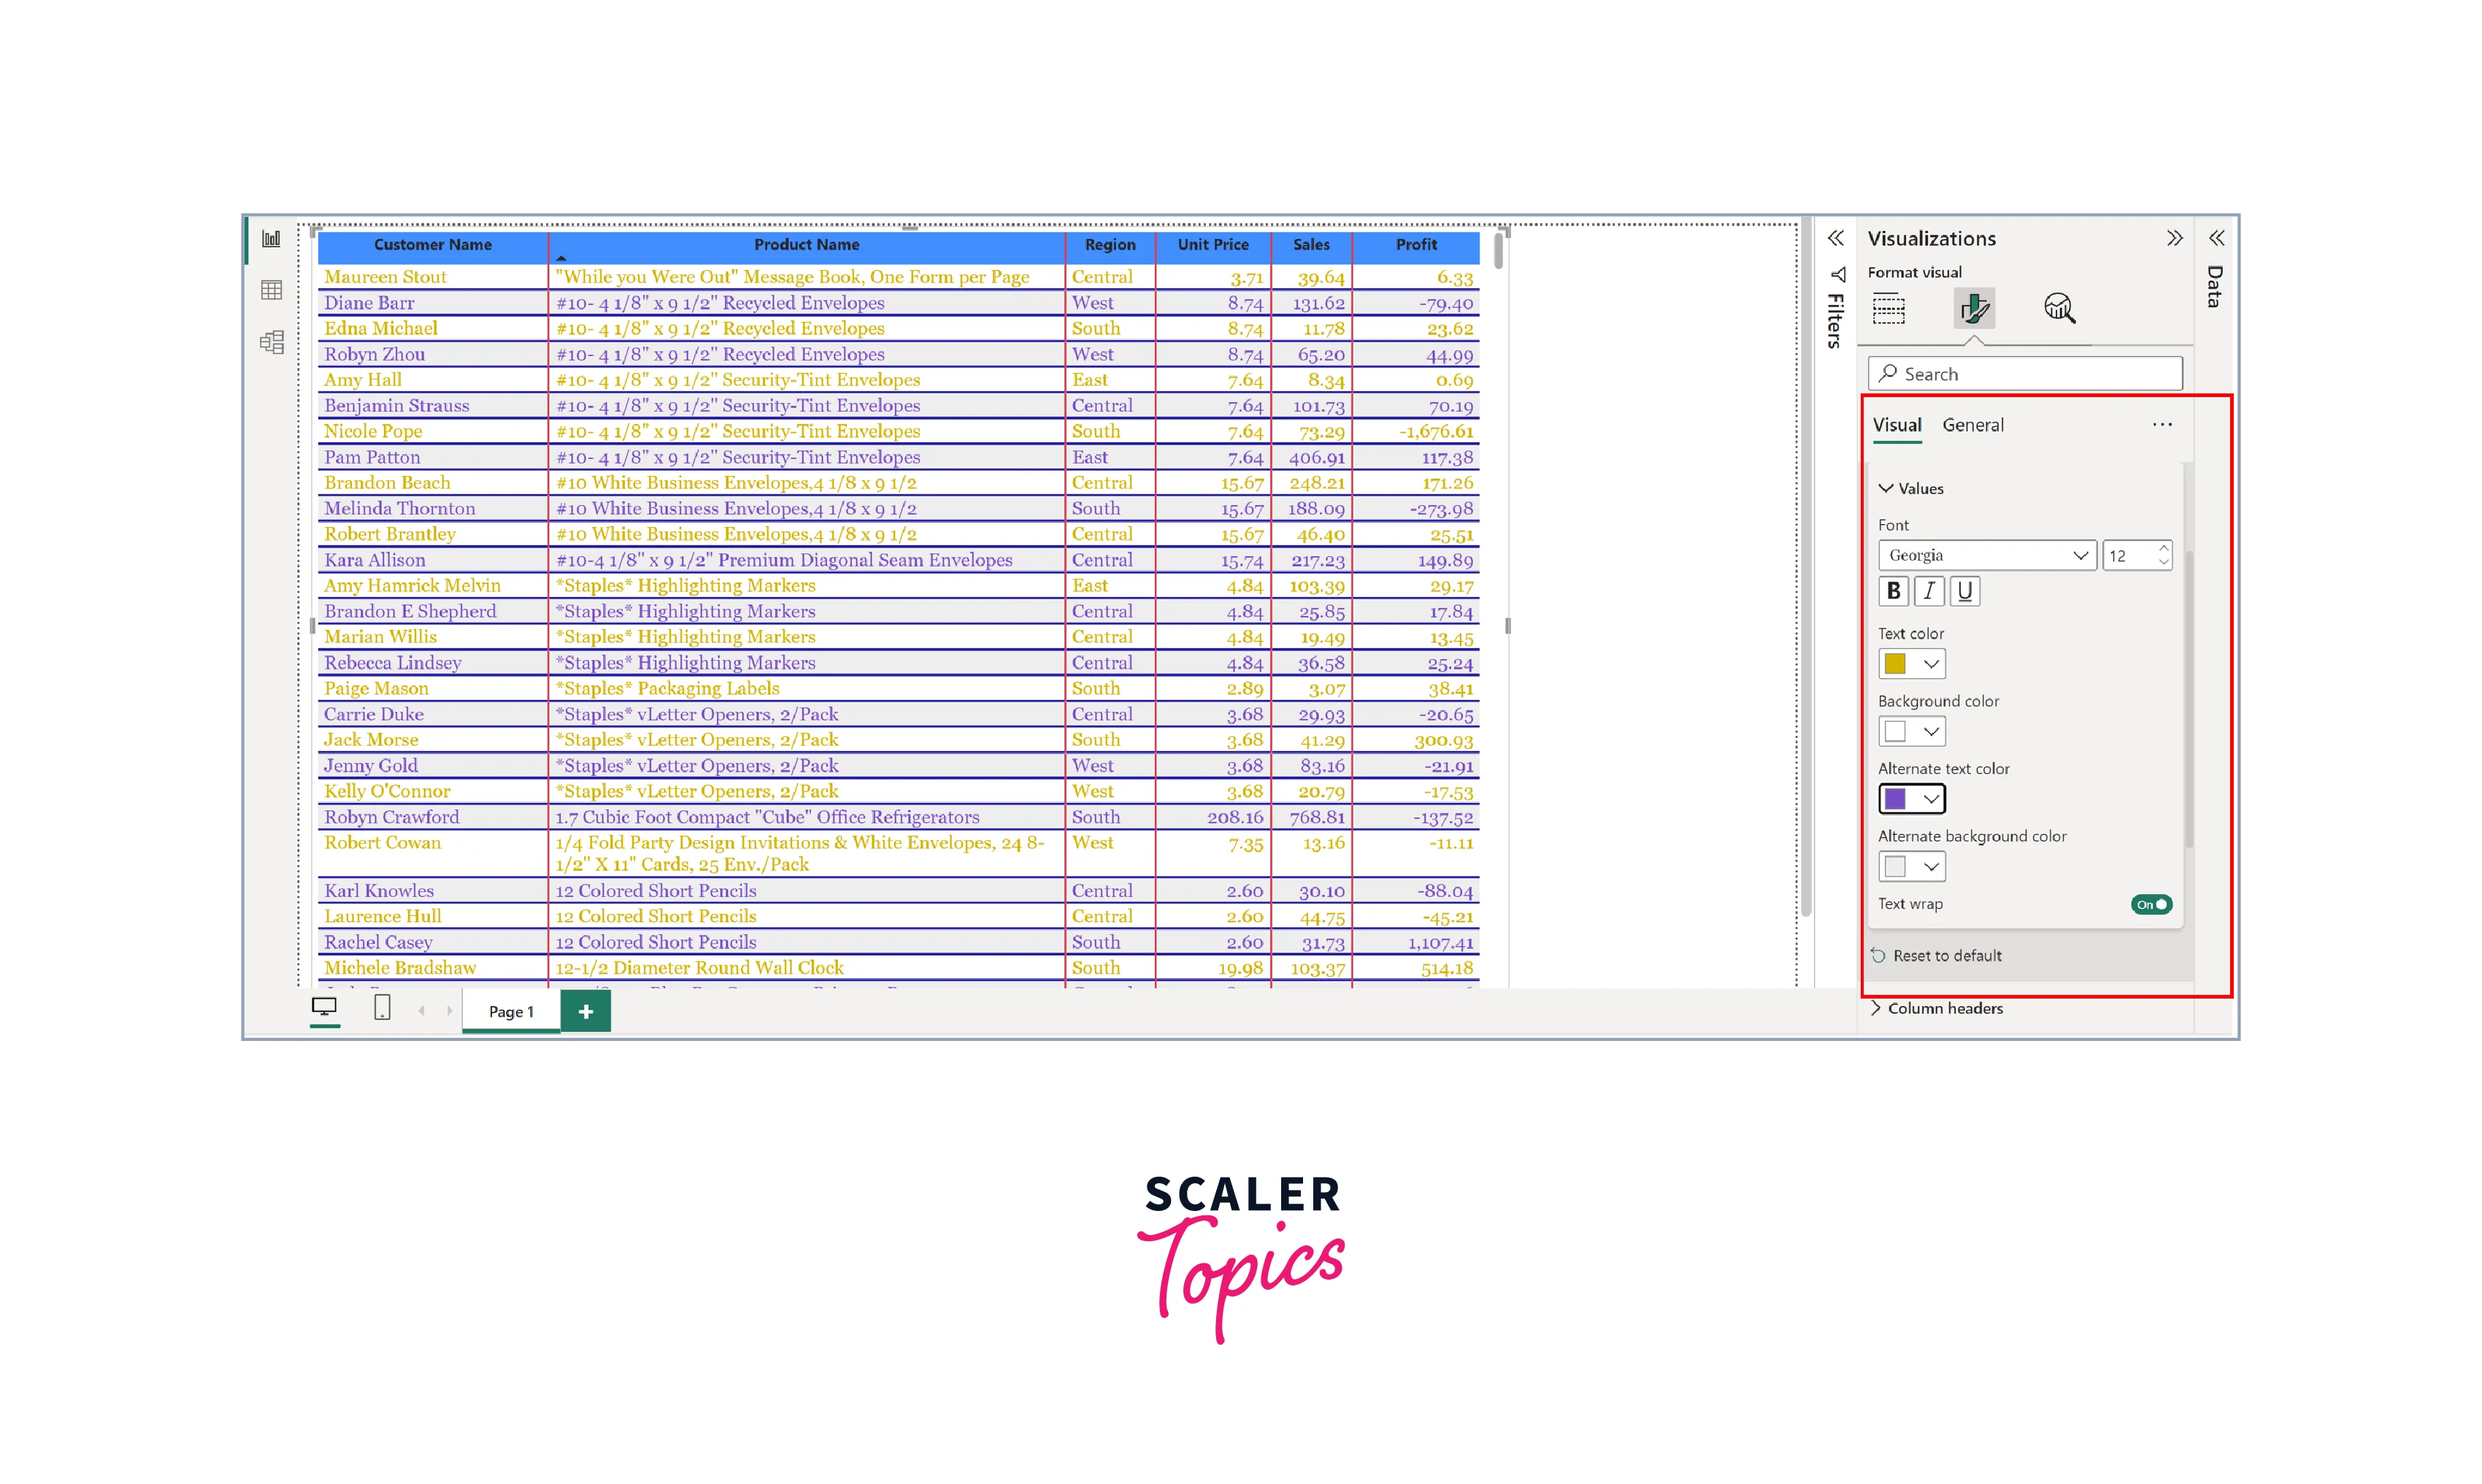
This section empowers you to customize the appearance of table values in Power BI. You can create a visually appealing contrast with the ability to change font and background colors for even and odd rows, as shown in the below figure.
Format Total of a Table in Power BI
In the Total section, you can customize the text and background color of the totals in your Power BI table. You can make the totals stand out by altering the Totals font type and color, setting the background color, and adding an outline to the top and bottom of the Total.
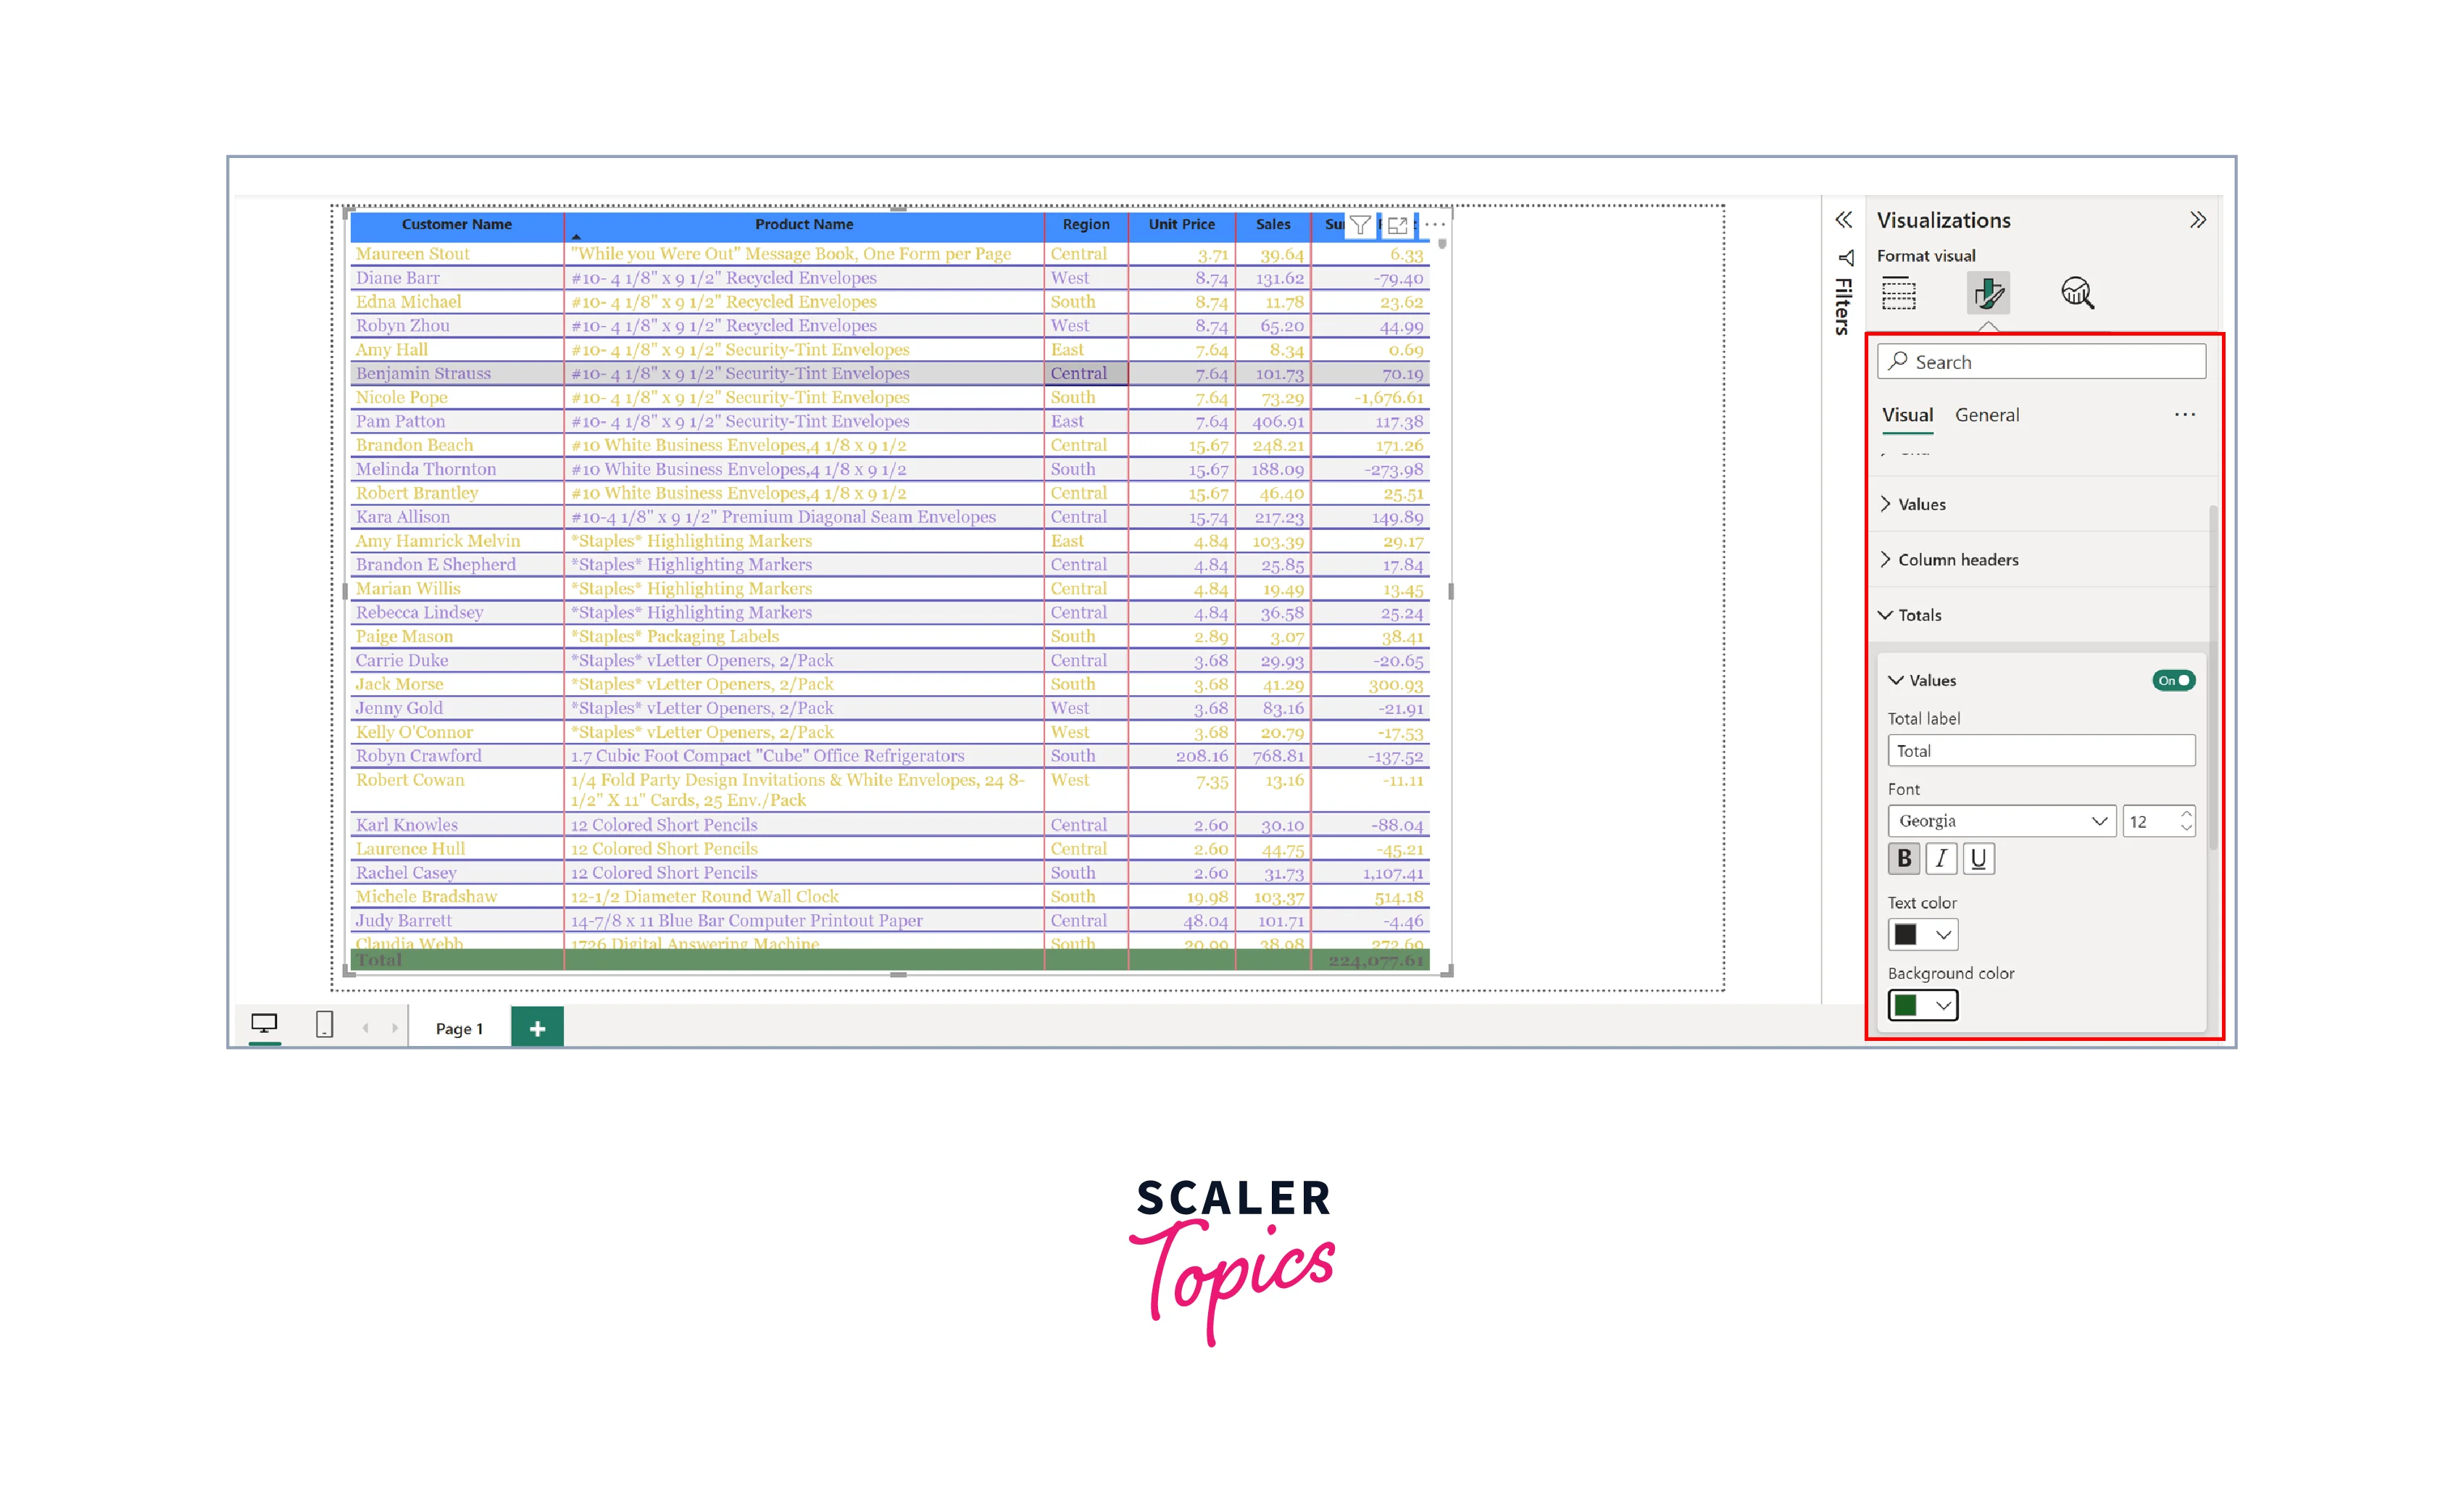
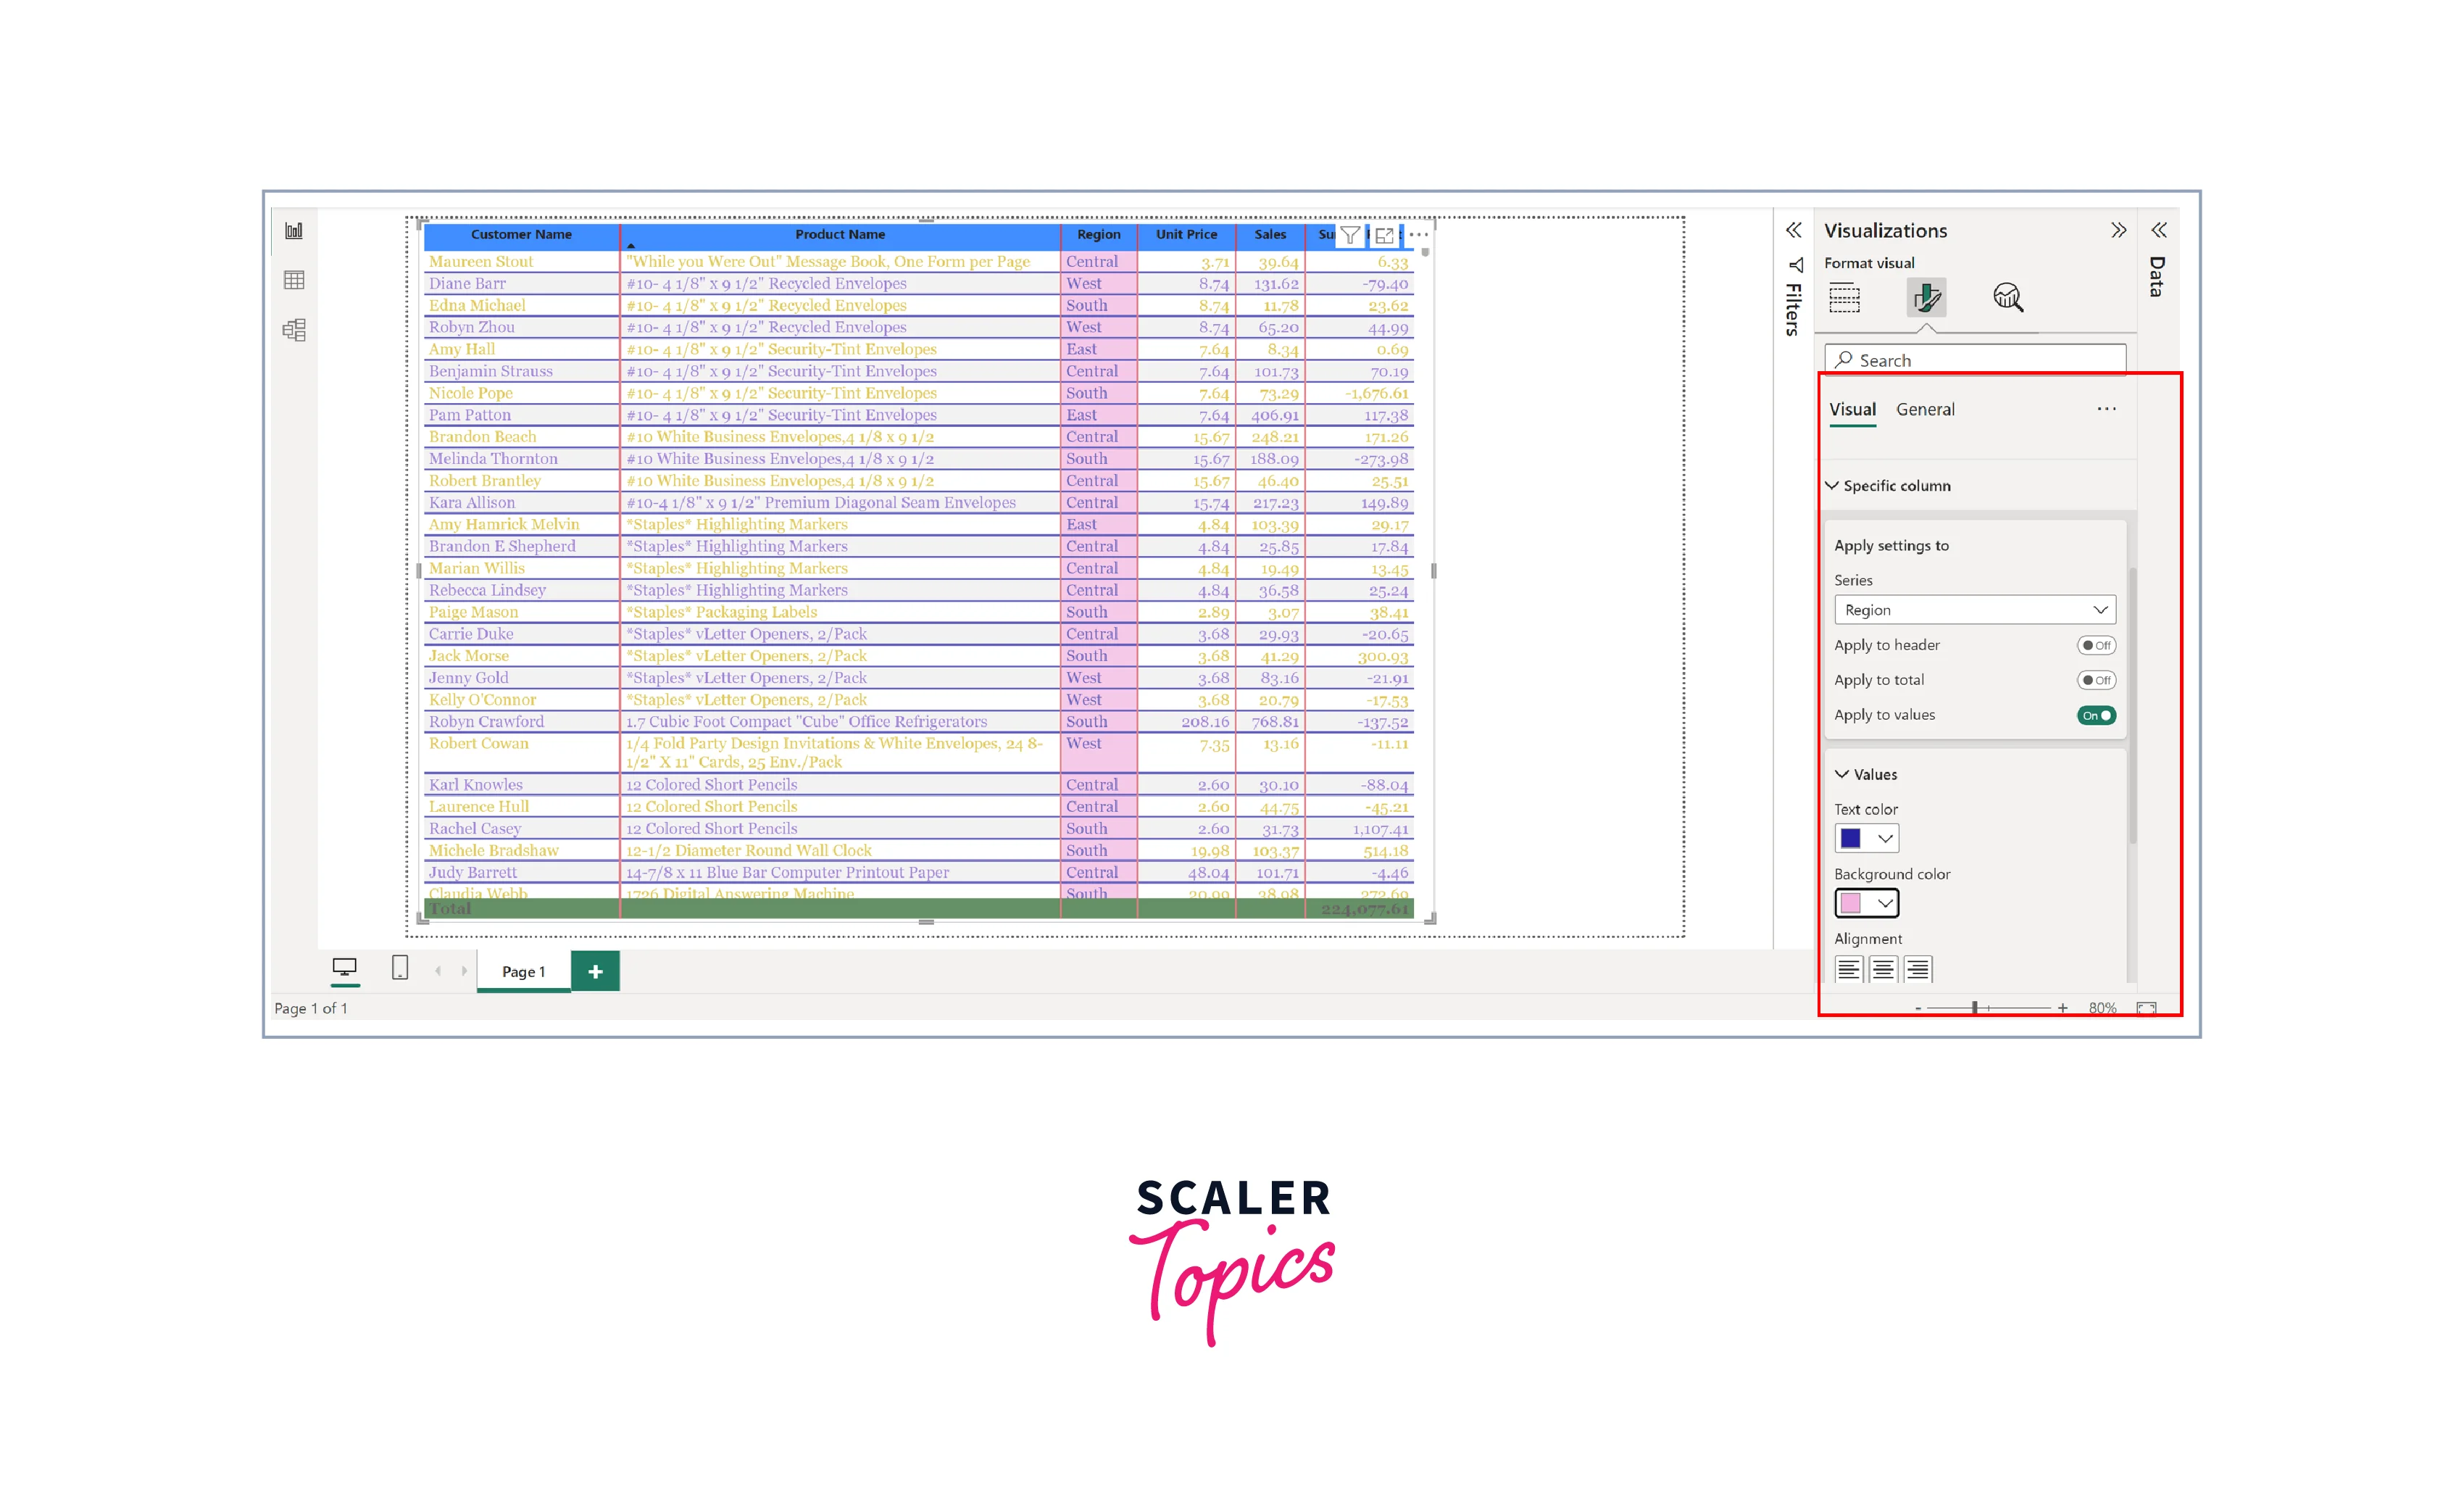
Table Field Formatting
The Table Field Formatting feature in Power BI allows you to format individual columns within a table, offering enhanced customization options. For instance, you can assign a distinct color to a specific column to make it stand out. In the provided example, we are choosing the "Region" column for customization.
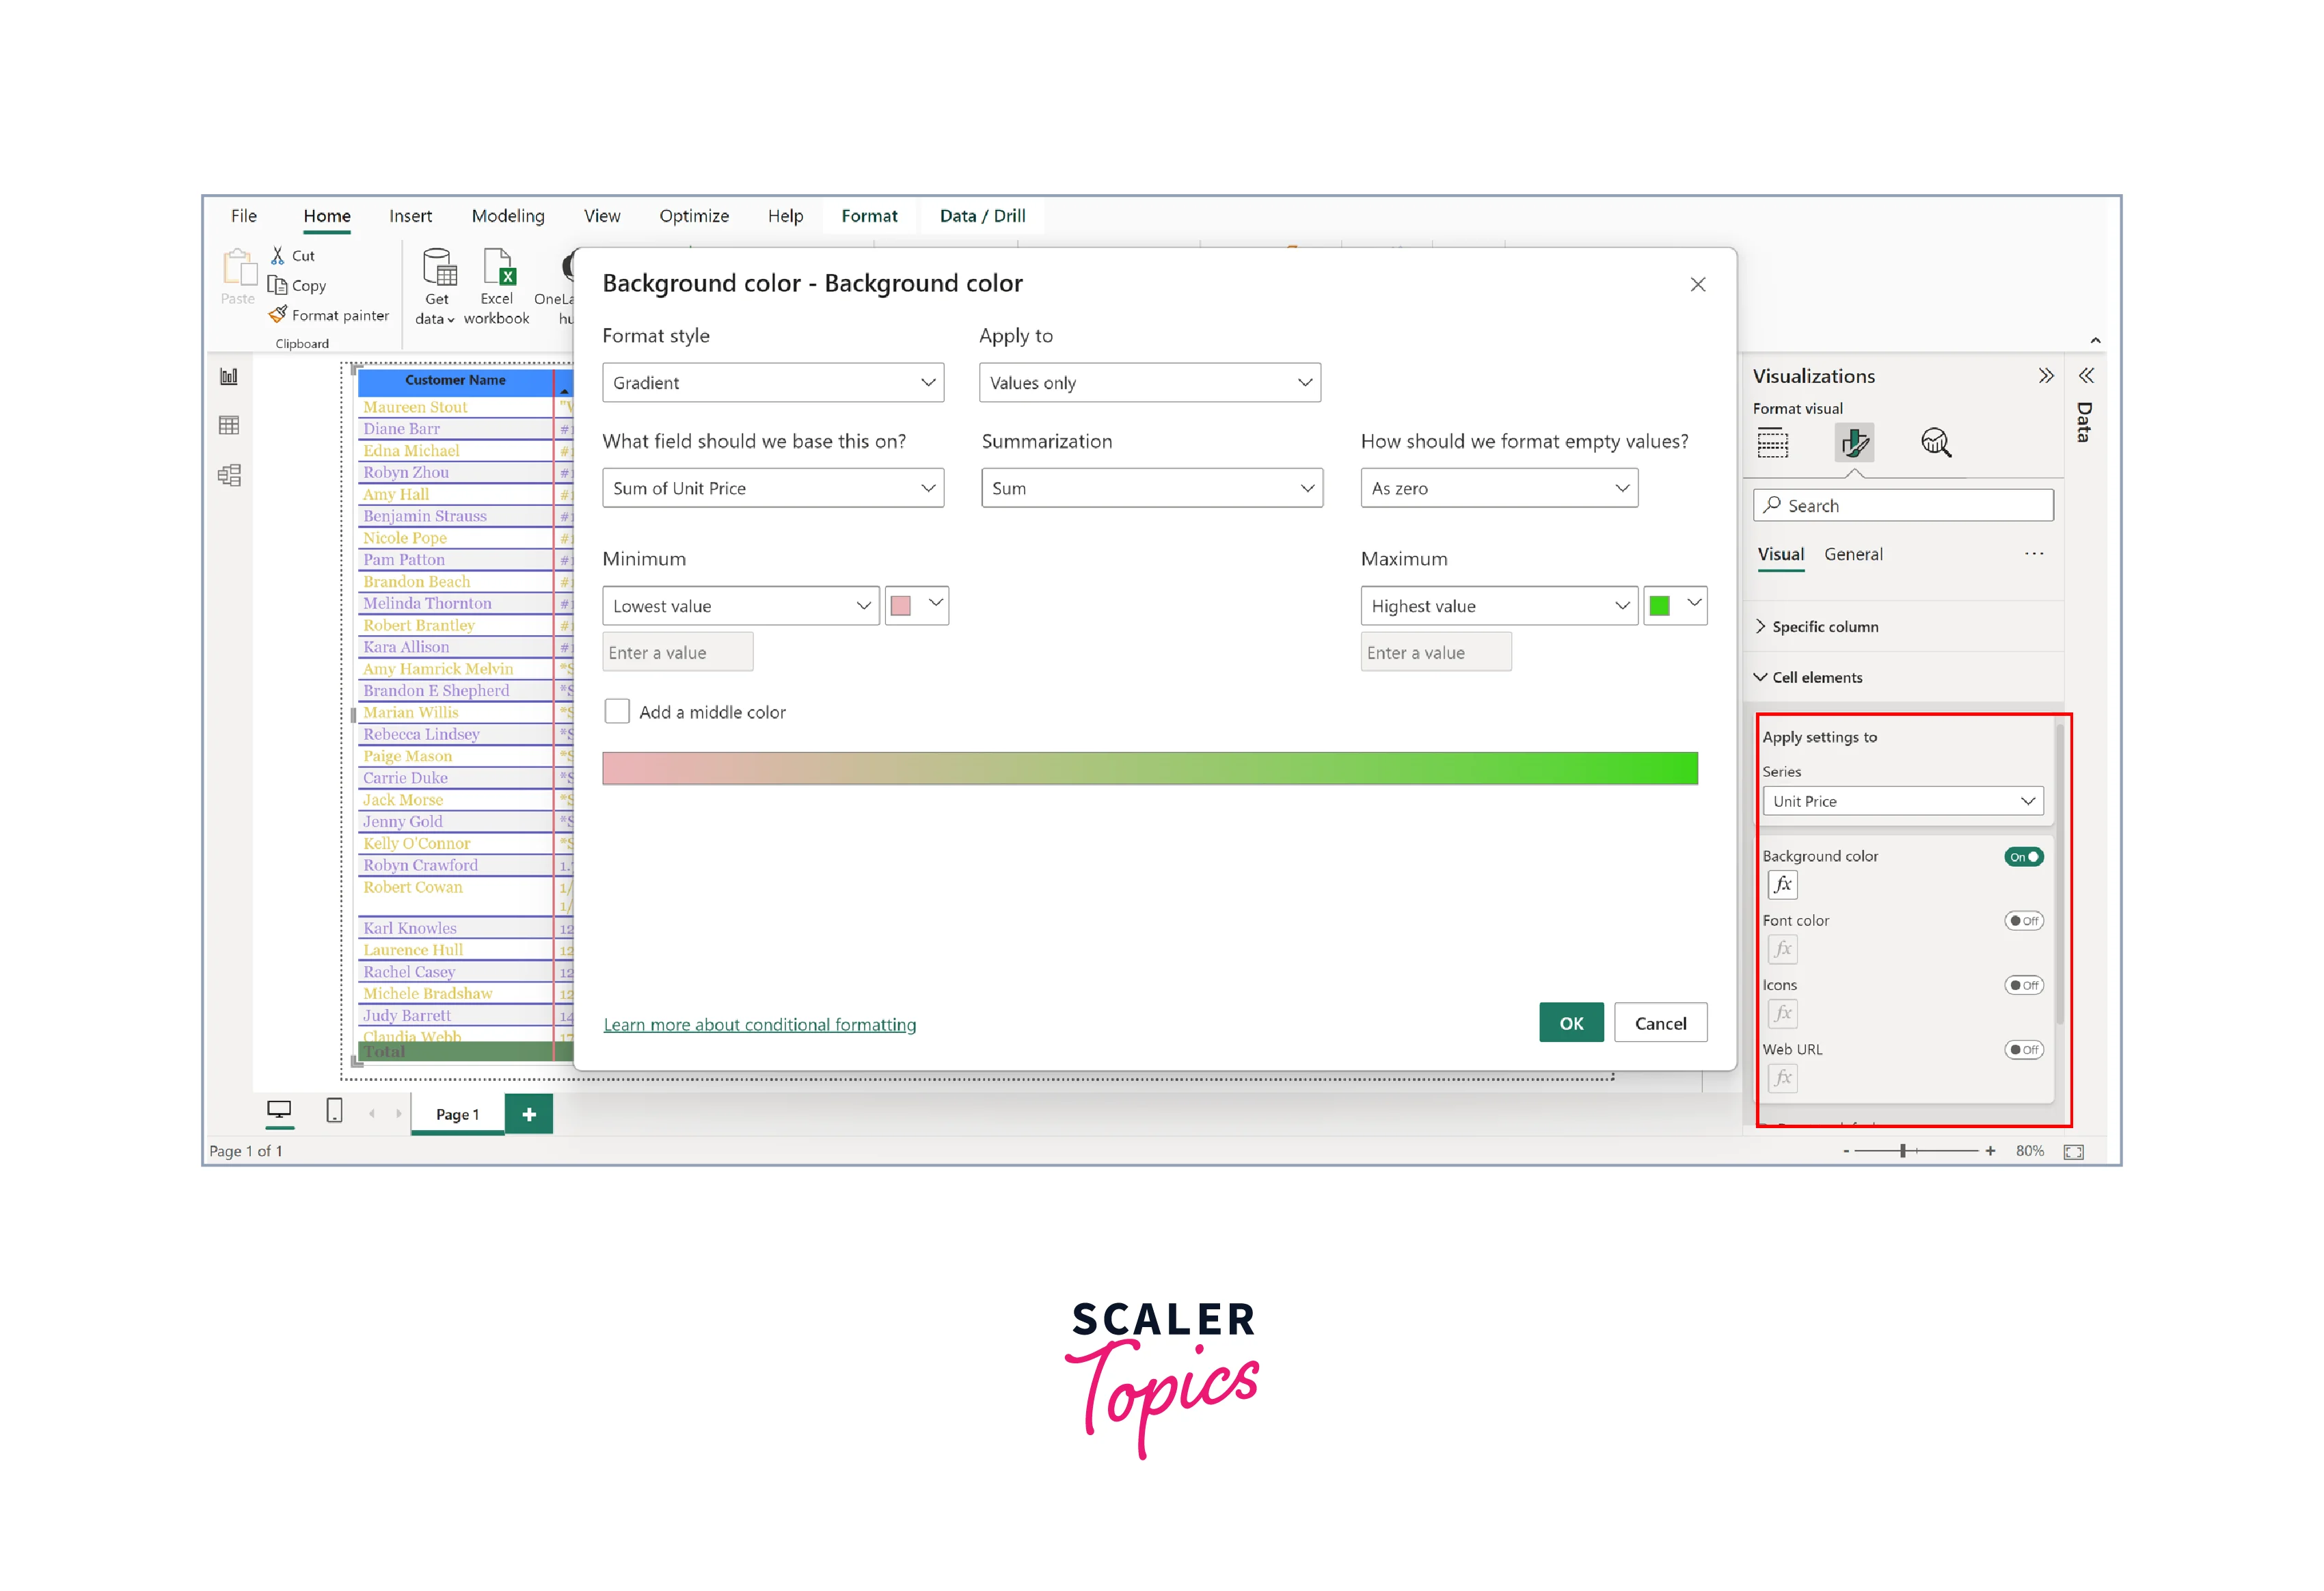
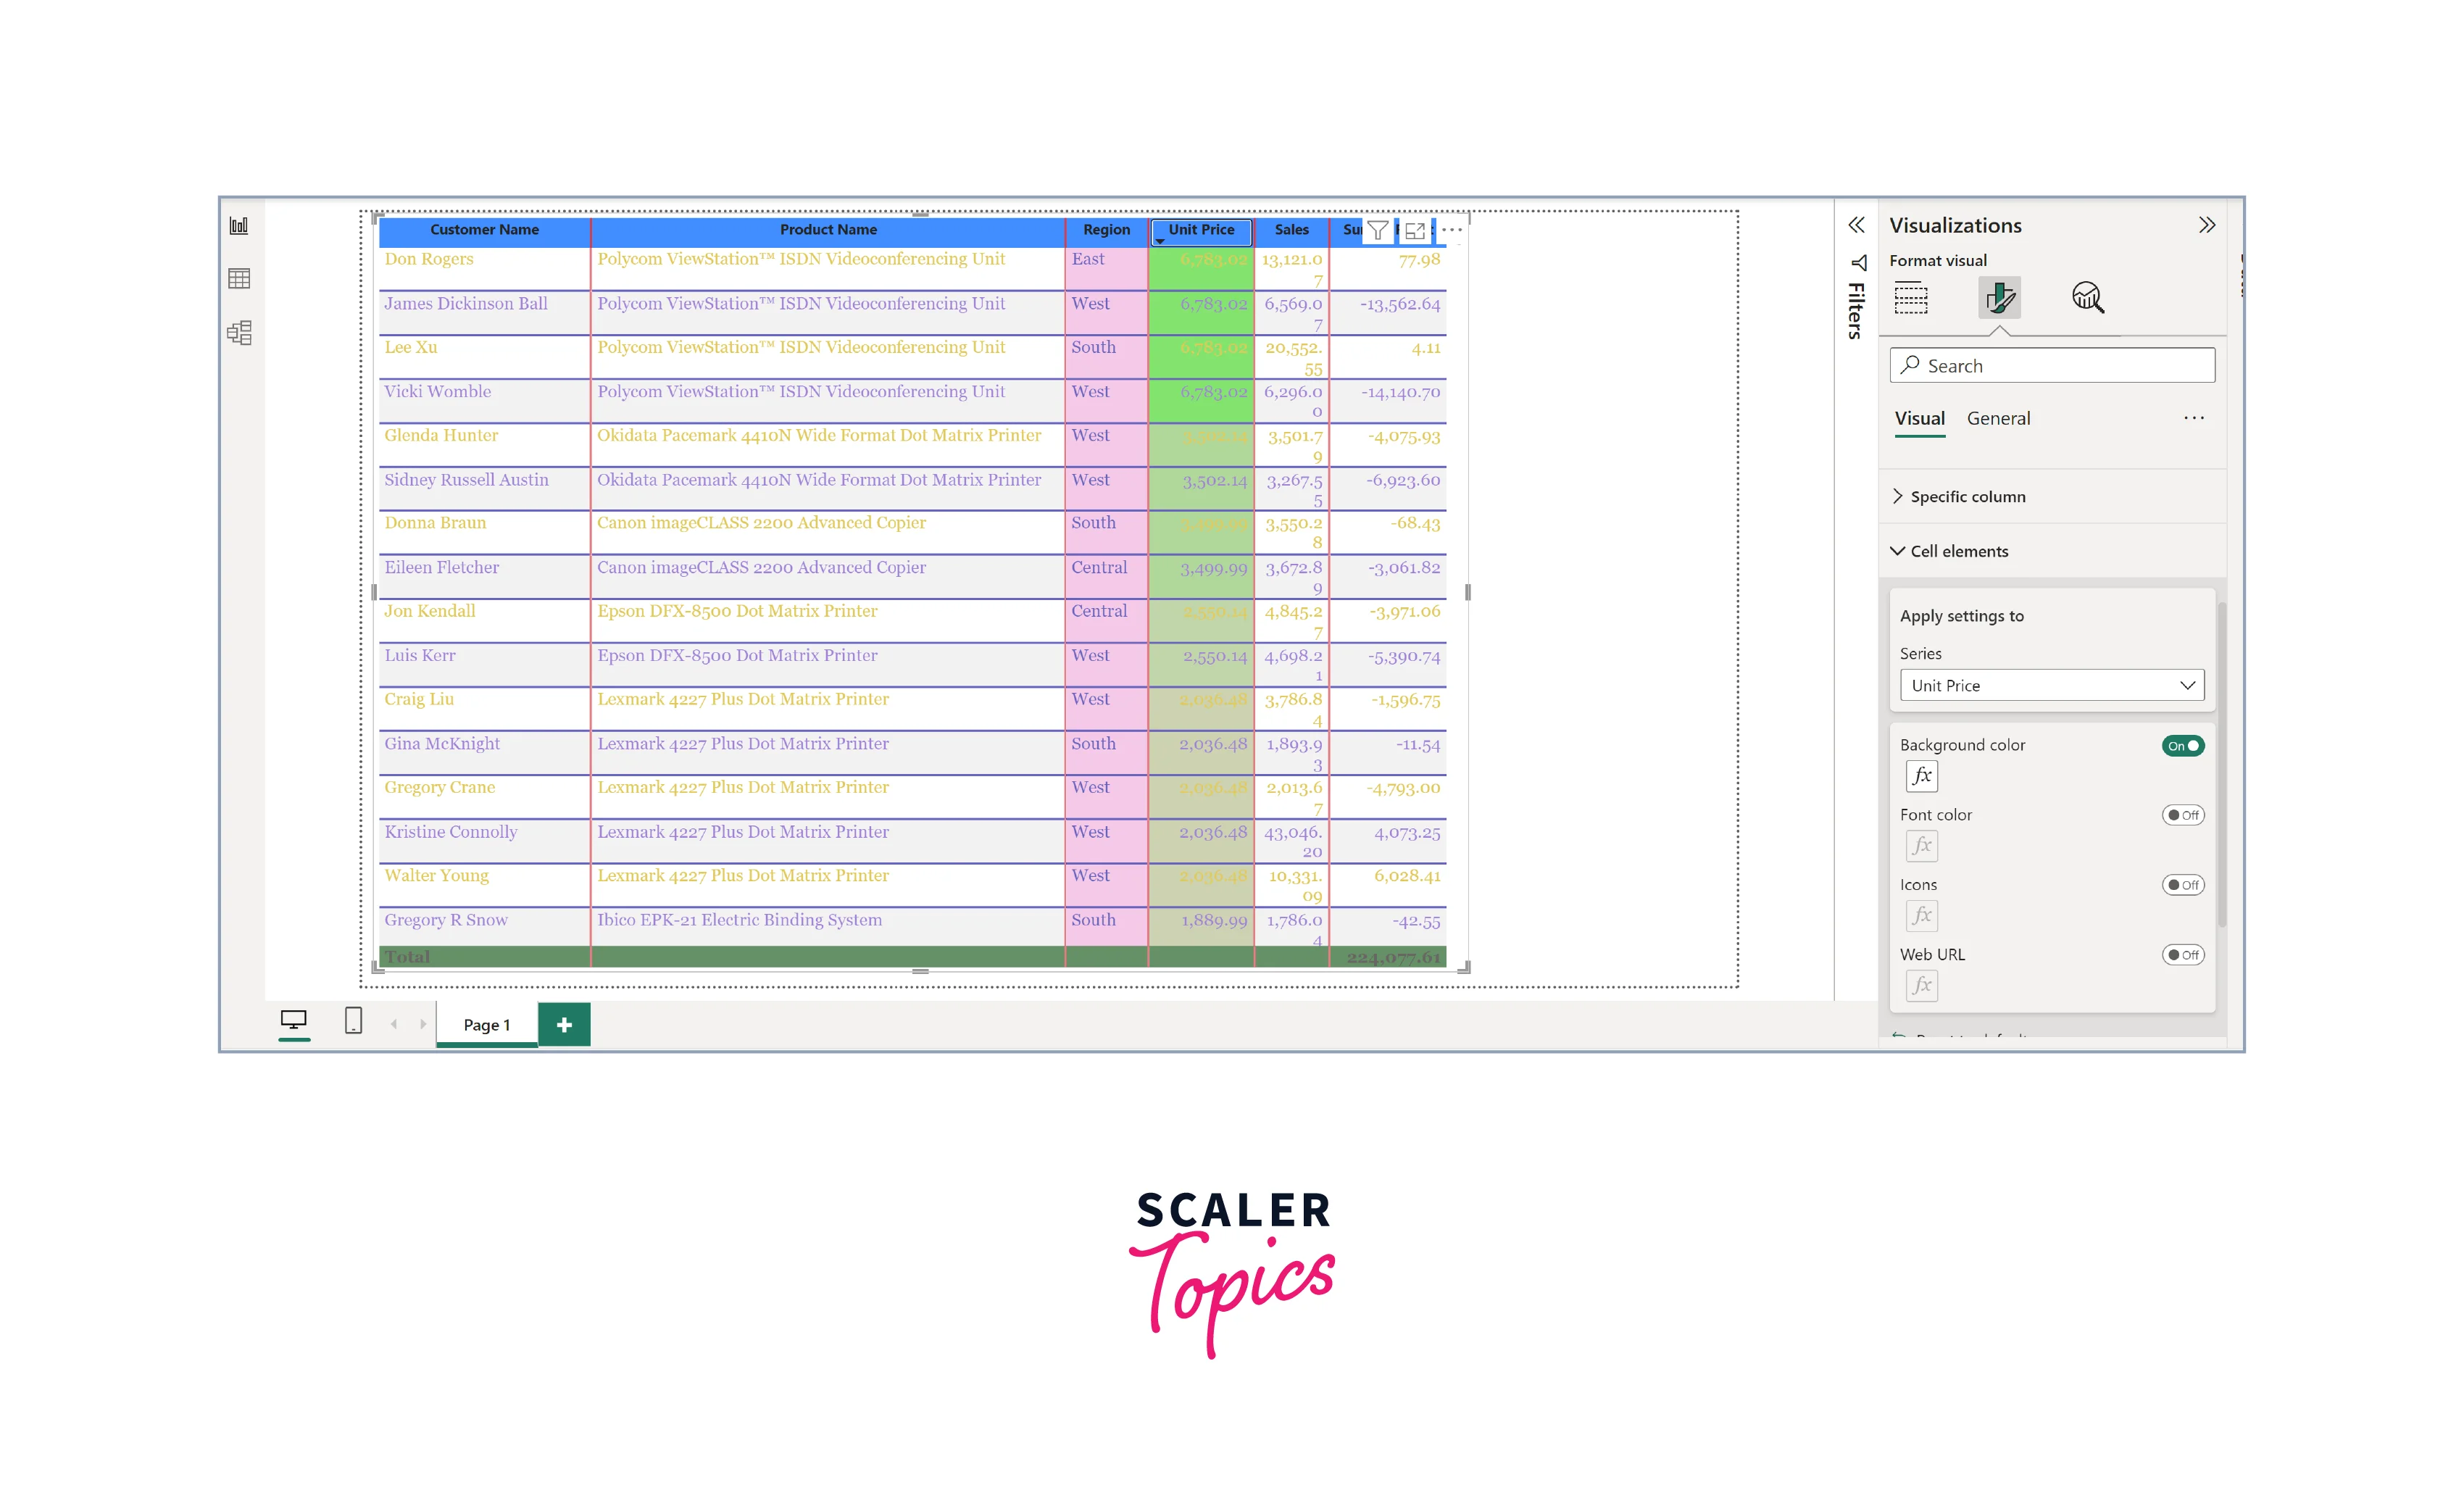
Power BI Table Conditional Formatting
Conditional formatting in Power BI tables enables you to format cells based on specified rules dynamically. This powerful feature lets you visually highlight significant data points, trends, or outliers to draw attention to specific insights. You can transform your table into an interactive and visually appealing data visualization by defining conditional formatting rules, such as data bars, color scales, or icon sets.
As shown in the figure below, we have implemented conditional formatting on the "UnitPrice" column. By utilizing a background color scale, we have configured the scale to range from red for lower values to green for higher values.
Visual Formatting Options
Here's a summary of various visual formatting options for a table in Power BI -
| Formatting Option | Description |
| Format Grid of a Table in Power BI | This option allows you to format the gridlines of the table to improve readability. |
| Format Column Headers of a Table in Power BI | You can use this to format the appearance of column headers, enhancing their visibility and aesthetics. |
| Format Values of a Table in Power BI | Customize the appearance of the values within the table, such as font size, color, and number formatting. |
| Format Total of a Table in Power BI | Customize the appearance of total rows or columns in the table, making them stand out or align with your design. |
| Table Field Formatting | This option lets you format individual columns, allowing for specific data type formatting or conditional formatting. |
| Power BI Table Conditional Formatting | Apply conditional formatting rules to cells in the table based on data values, enabling data-driven visual cues and highlighting. |
Conclusion
- Power BI offers a range of powerful formatting options for tables, allowing users to create visually appealing and informative data visualizations.
- Formatting grids, column headers, values, and totals enhance the table's visual clarity and align it with the overall report style.
- Leveraging Power BI table format with conditional formatting empowers users to highlight key insights and trends, making data analysis more intuitive and effective.