Advanced Features in DAX in Power BI
Overview
In the world of Power BI, unleashing the true potential of data analysis lies in mastering the intricacies of DAX (Data Analysis Expressions). This article delves into the features of advanced DAX for Microsoft Power BI Desktop, equipping you with the skills to harness its capabilities for more profound insights. Whether you're a seasoned analyst or a beginner to Power BI, this journey through features of advanced DAX for Microsoft Power BI Desktop will empower you to unlock the full potential of your data-driven endeavors.
Introduction
In today's data-driven landscape, making informed decisions relies heavily on extracting meaningful and actionable insights from large volumes of datasets. Microsoft Power BI has emerged as a leading BI tool for transforming raw data into actionable intelligence. At the heart of this transformation lies DAX, or Data Analysis Expressions, a formula language designed to facilitate advanced data modeling and calculations. While DAX is a powerful asset in itself, understanding the features of advanced DAX for Microsoft Power BI Desktop can elevate your data analysis to new heights. This article will serve as your guide to exploring these features of advanced DAX for Microsoft Power BI Desktop, helping you leverage them effectively within the Power BI ecosystem.
Key Advanced Features in DAX Power BI
Let’s explore a few of the key features of advanced DAX for Microsoft Power BI Desktop, as mentioned below -
Quick Insights
Quick Insights is a powerful feature in Power BI that allows users to gain rapid, automated insights into their data with just a few clicks. This feature is readily accessible from the Power BI online service and can be initiated by following these simple steps -
-
Step 1: To utilize Quick Insights, log in to your Power BI account on the Power BI online service.
-
Step 2: Select the workspace where your dataset or dashboard is located.
-
Step 3: Locate the specific dashboard or report you want to analyze further and right-click on it. From the context menu that appears, click on "Quick Insights."
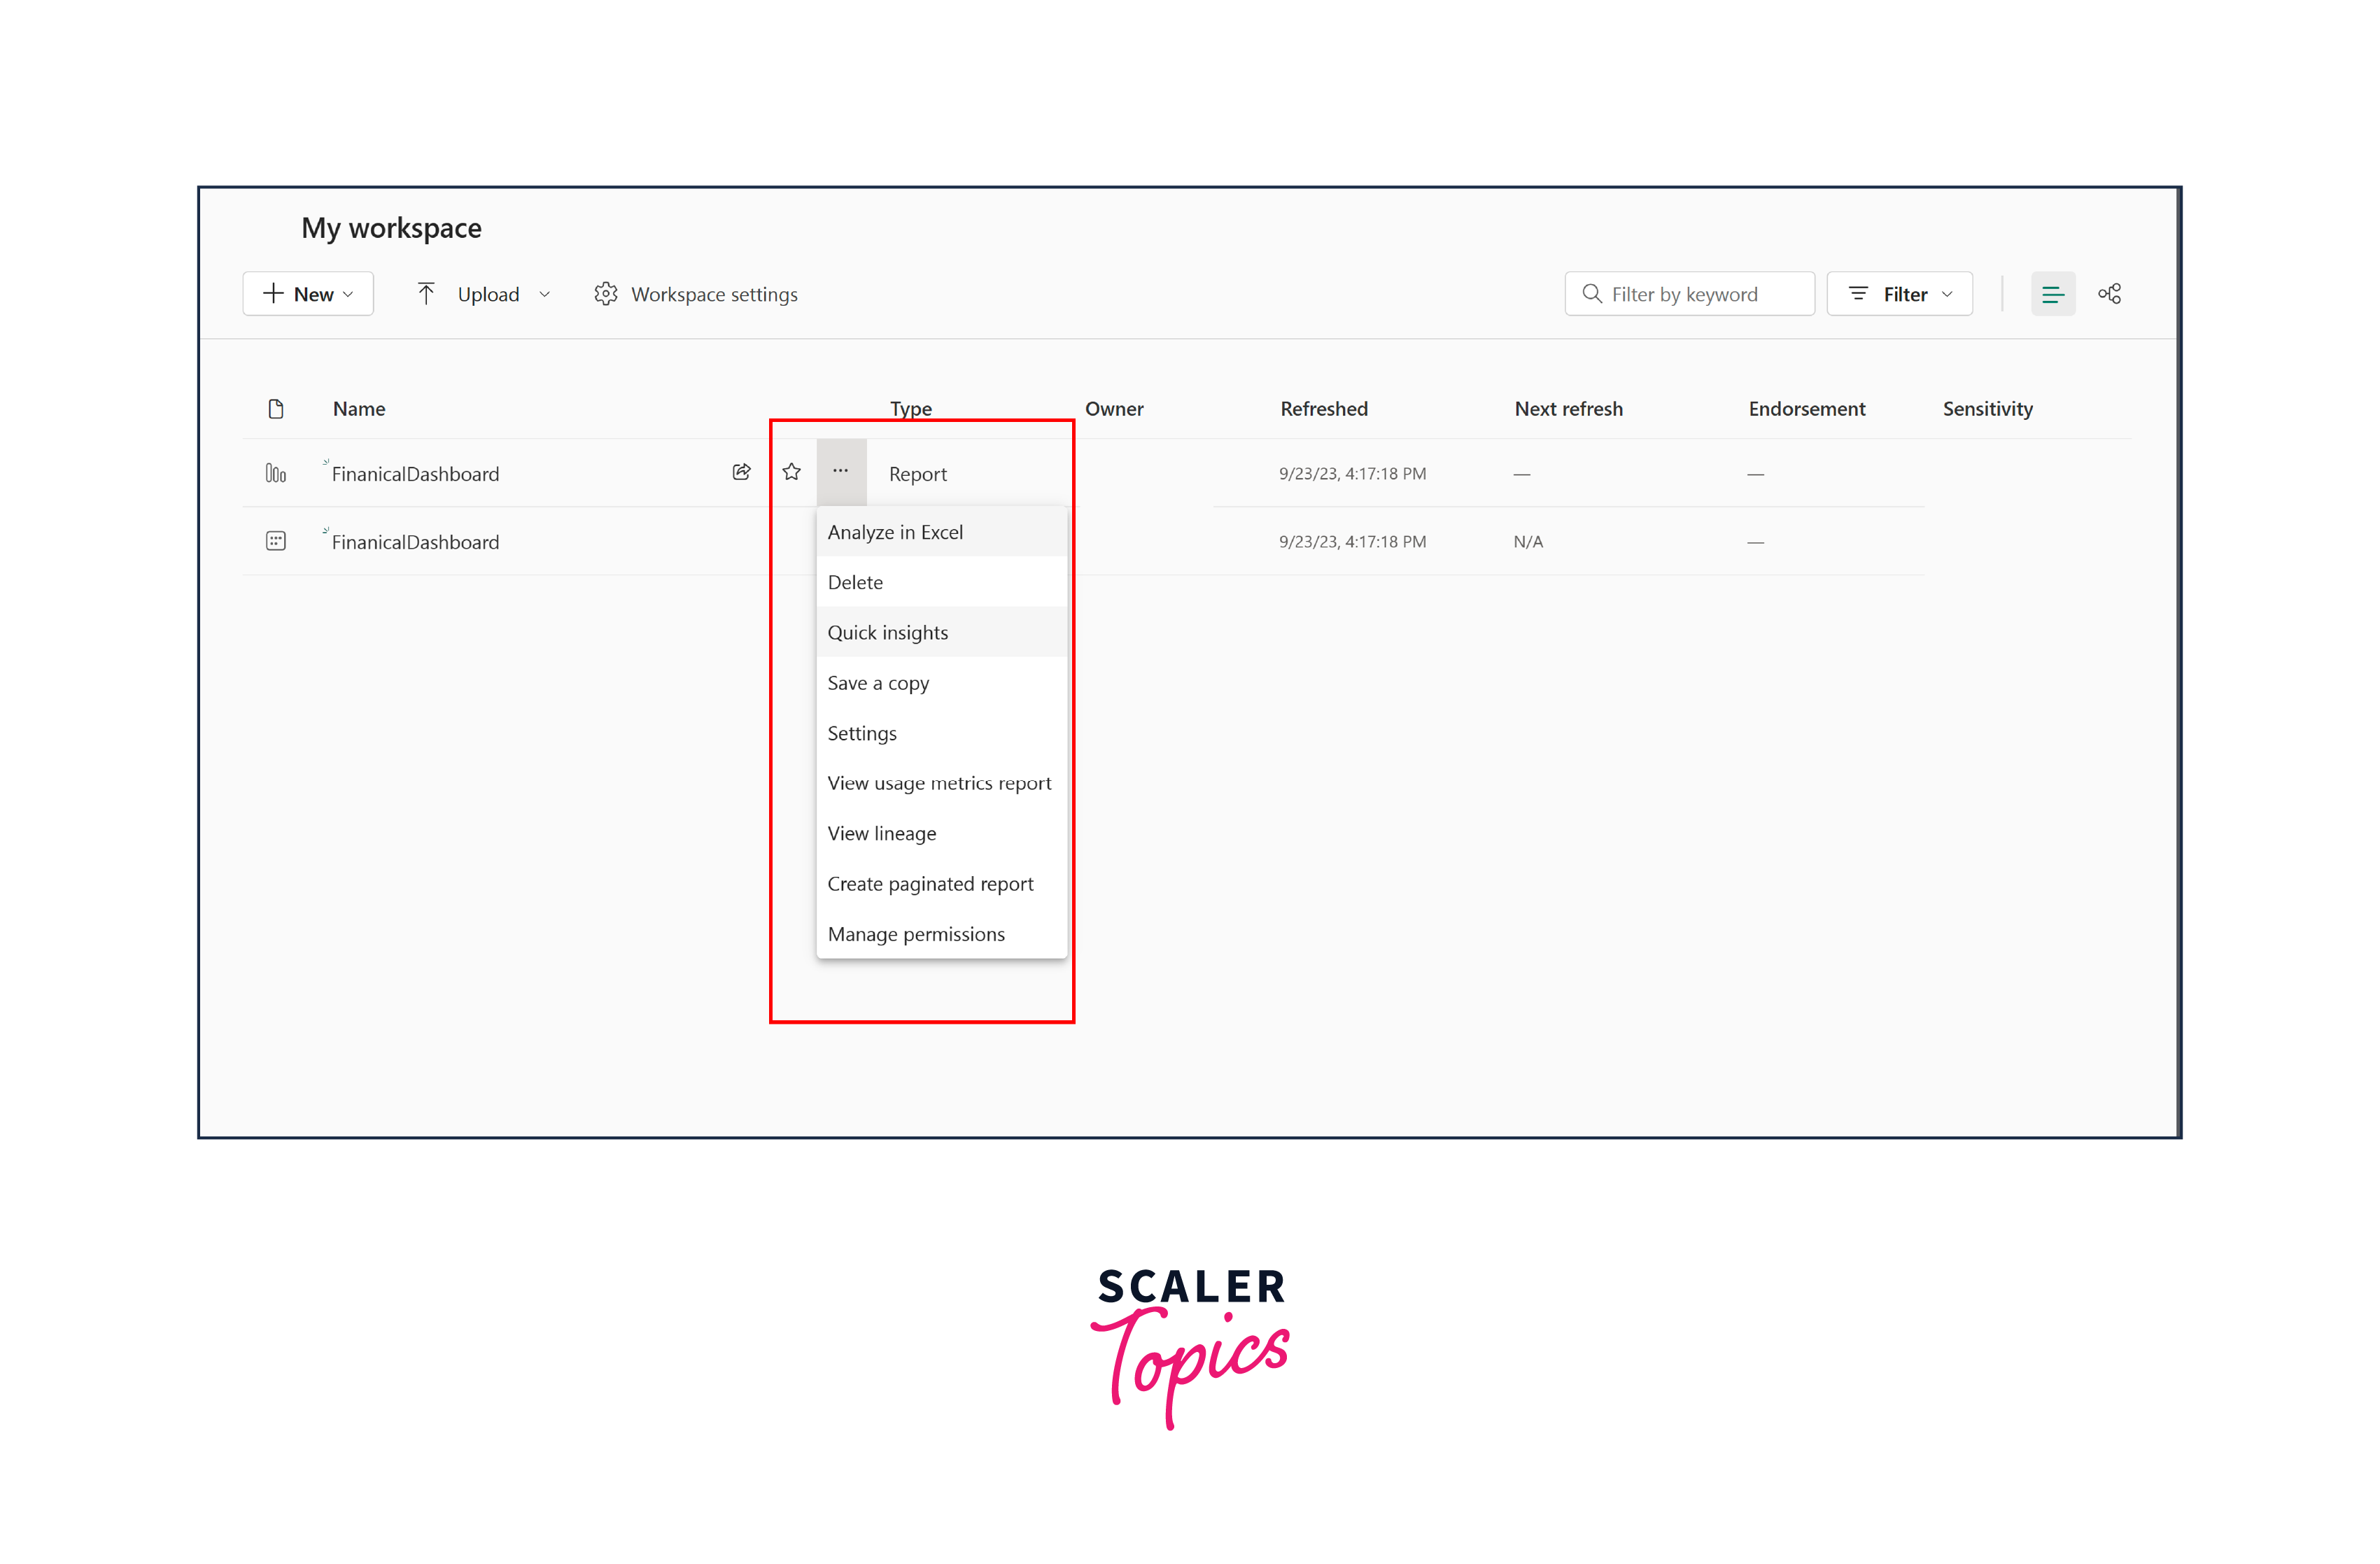
- Step 4: Once Quick Insights are ready, you can see them as illustrated in the figure below.
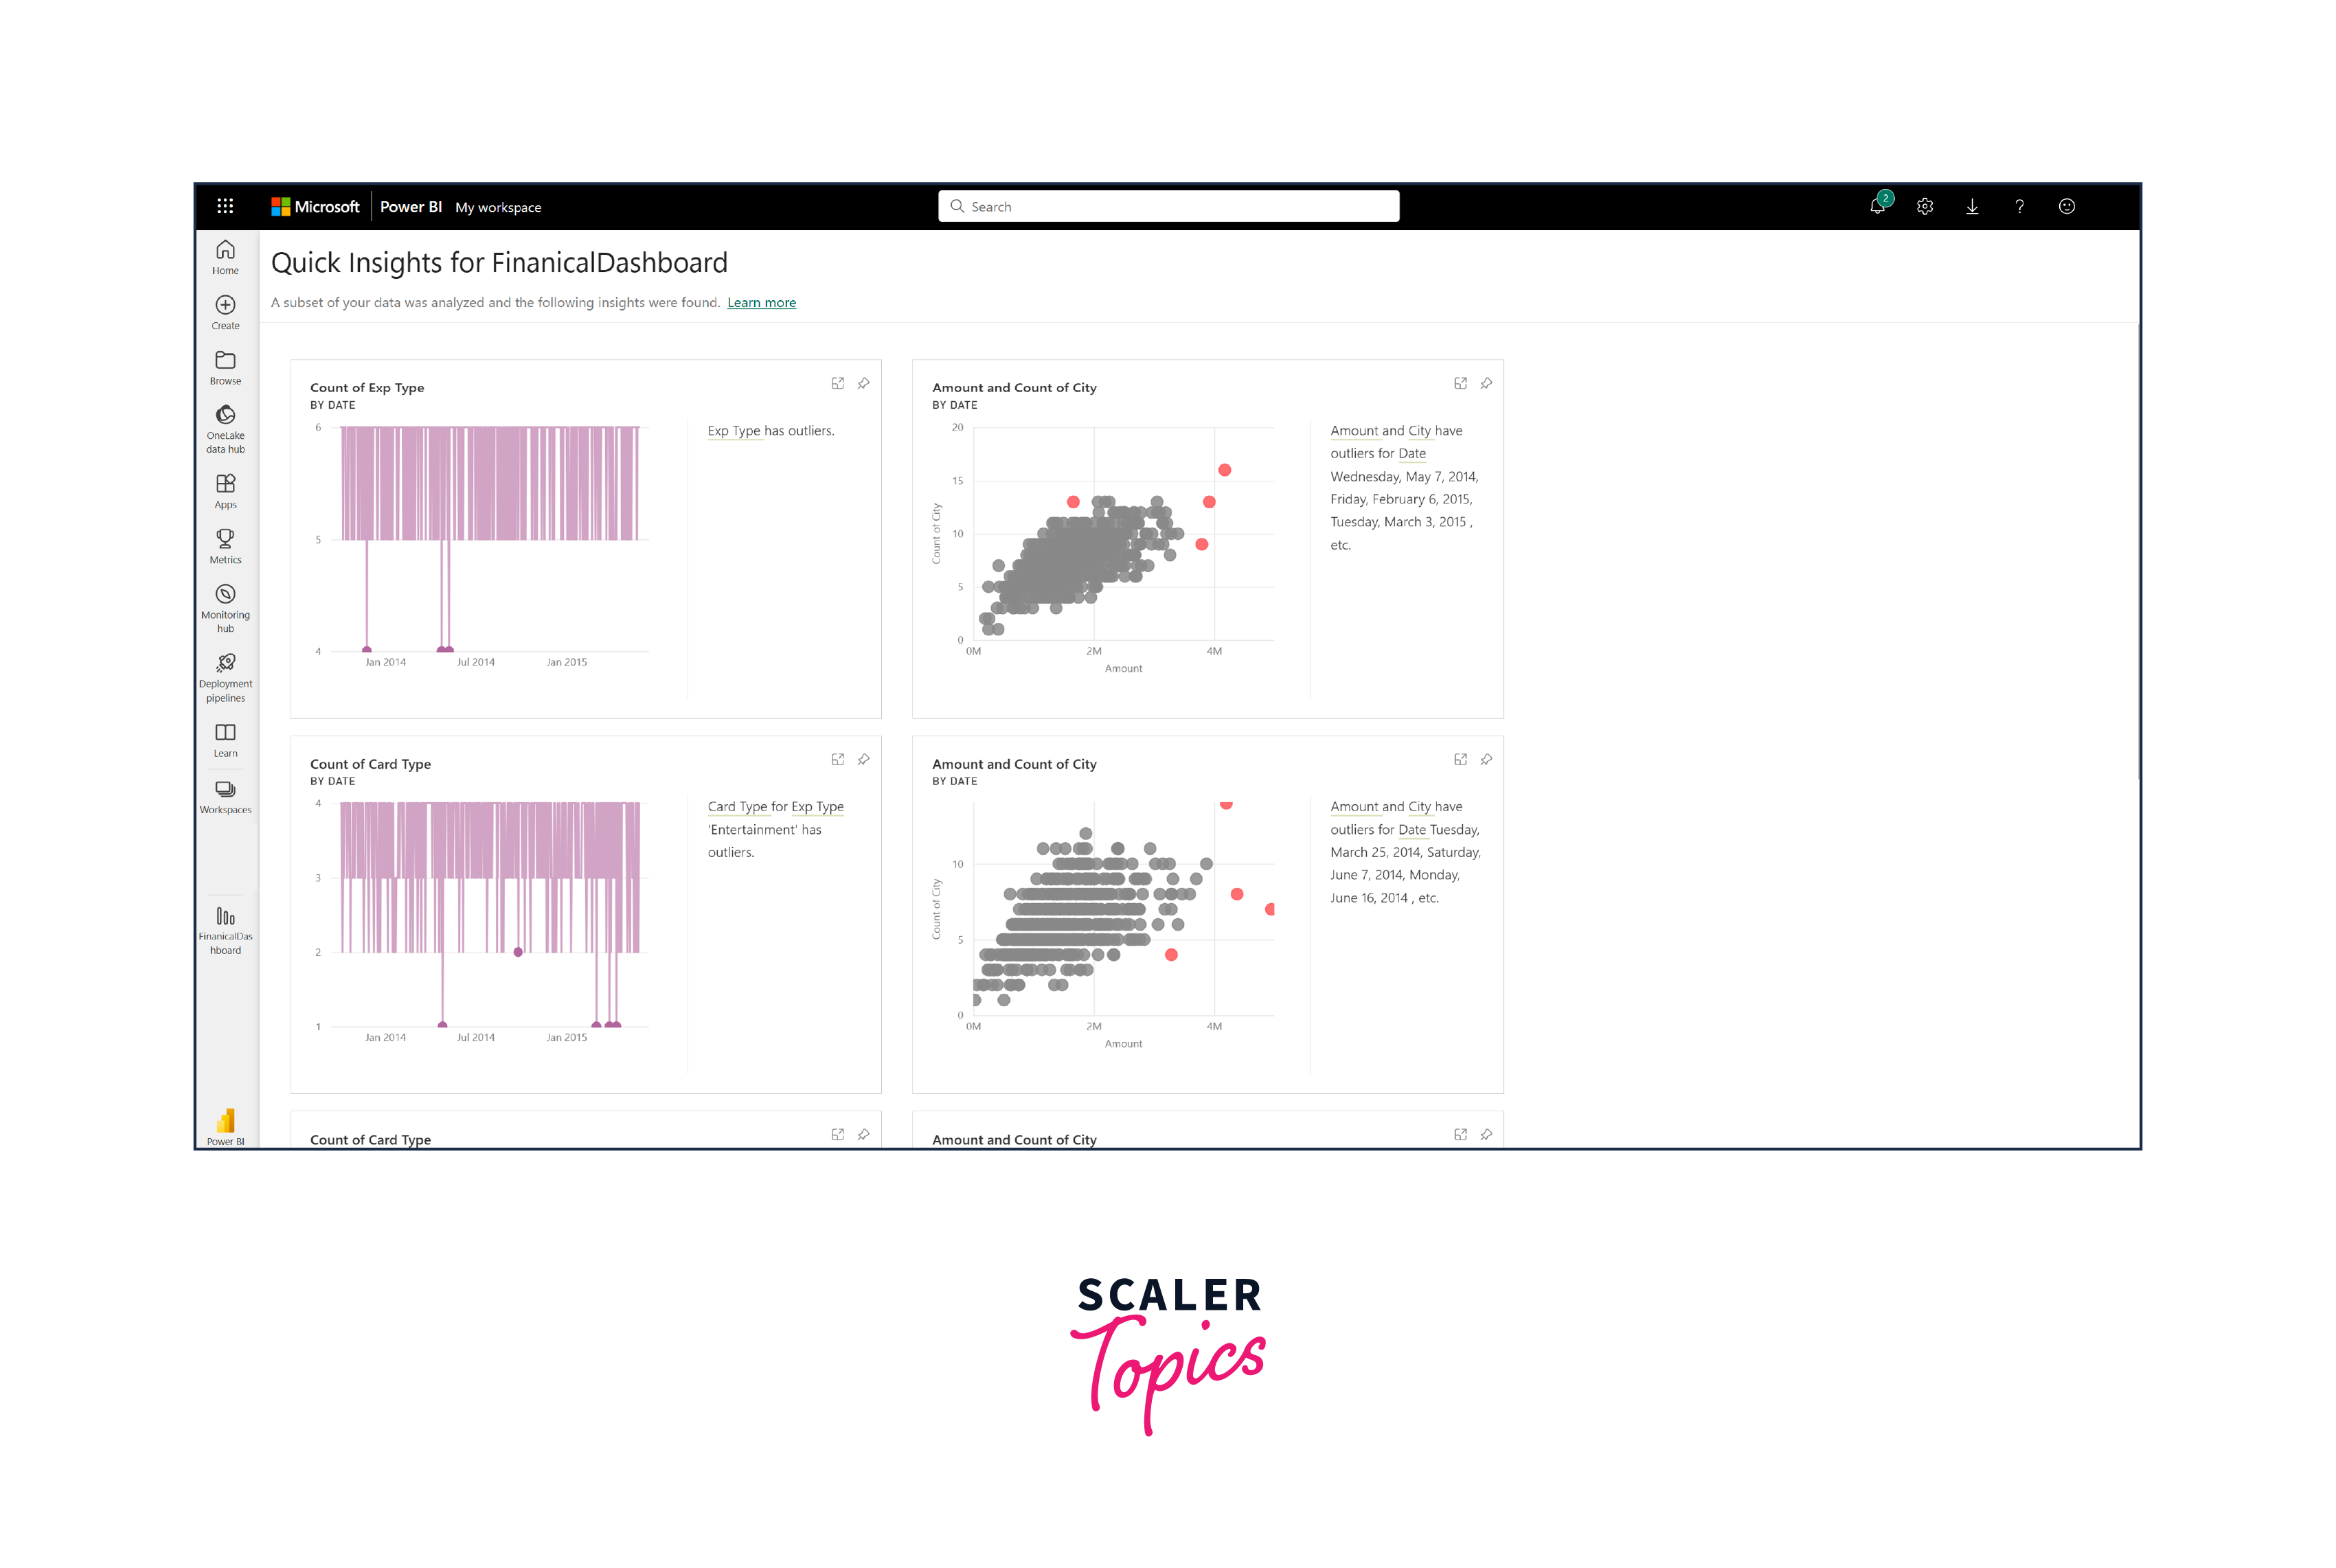
Quick Insights employs machine learning algorithms to automatically identify patterns, trends, outliers, and correlations within your data, as shown in the above figure. It then generates a set of visuals and insights, presenting them in an easy-to-understand format. Here's how you can benefit from this feature -
- Quick Insights can reveal hidden data patterns and trends that you might have missed during manual analysis. This can be especially valuable when dealing with large and complex datasets.
- It helps in identifying key drivers or factors influencing specific outcomes, which can be crucial for decision-making.
- Quick Insights accelerates the data exploration process by automating the generation of reports and visuals. It saves you time that you would otherwise spend creating similar insights manually.
- Users can explore various insights and visuals created by Quick Insights to gain a deeper understanding of their data, which can be further customized and integrated into their reports and dashboards.
Prompt through Questions: Power BI Q&A Functionality
Power BI's Q&A functionality is a powerful feature that enables users to interact with their data using natural language queries. Instead of relying solely on predefined reports or dashboards, you can simply ask questions in plain language to retrieve the insights you need. Here's how it works and how it can be effectively used -
- With Power BI Q&A, you can type or speak your questions in plain, conversational language. For example, you might ask, "Show me sales by region in the last quarter" or "What were the top-selling products in June?"
- Power BI's Q&A engine interprets your question and generates visualizations and answers in real-time. These results can include tables, charts, and narratives, depending on the query.
- As you type your question, the tool offers suggestions and auto-completions to help you frame your query effectively.
You can use this advanced Power BI feature by following the steps mentioned below -
-
Step 1: To use Q&A, open a Power BI report or dashboard that supports this functionality.
-
Step 2: The Q&A box can be located in the "Insert" ribbon at the top of the Power BI Desktop interface.
-
Step 3: Simply type or speak your questions into the Q&A box and press Enter or click the search icon.

Power BI's Q&A functionality is a bridge between data and insights, democratizing data access and exploration within organizations. By enabling users to ask questions in plain language, it empowers a wider range of stakeholders to make data-driven decisions and gain deeper insights into their data. Here are some of the key benefits of this feature -
- Instant Insights - Power BI's Q&A functionality provides instant access to insights without the need for predefined reports. This is especially useful for exploring data on the fly.
- Interactive Dashboards - Q&A can be integrated into interactive dashboards, allowing users to interact with data and generate reports dynamically.
- Ad Hoc Analysis - Q&A allows for ad hoc analysis, enabling users to explore data in a flexible and intuitive manner.
- User-Friendly - It's accessible to users without in-depth knowledge of data analysis or SQL queries, making it ideal for business stakeholders and decision-makers.
Intuitive Reports
Intuitive reporting in Power BI refers to the creation of reports that are user-friendly, easy to navigate, and provide a clear and intuitive representation of data insights. This feature is essential for ensuring that your audience can quickly grasp the information presented in your reports. Here's an overview of what intuitive reports are and how to create them effectively -
- Use appropriate charts, graphs, and visuals to represent data in a way that is easy to understand. Choose visuals that best convey the message you want to communicate.
- Organize your report in a logical order, with a clear flow of information. Consider using sections, headings, and page navigation to guide users through the report.
- Maintain consistency in fonts, colors, and styles throughout the report. Consistency makes it easier for users to focus on the content rather than distractions.
- Implement interactive features like slicers, filters, and drill-through options that allow users to explore data further.
- Provide data labels and tooltips on visuals to offer additional context and details when users hover over or click on data points.
- Utilize bookmarks to save different report views or states. This enables users to switch between predefined perspectives within the report.
Creating intuitive reports in Power BI enhances the effectiveness of data communication and decision-making. By presenting information in a clear, user-friendly manner, you empower your audience to extract valuable insights efficiently, whether they are business stakeholders, colleagues, or clients.
Real-Time Data Analytics
Real-time analytics in Power BI is a game-changer for organizations that require up-to-the-minute insights and monitoring of critical data. This advanced feature leverages automatic data refresh and streaming data capabilities to ensure that dashboards and reports are continuously updated in real time. Here's a detailed look at what real-time analytics is and how it can be effectively utilized -
a. Automatic Page Refresh
- Autopage refresh is accessible when connected to supported data sources, primarily catering to DirectQuery sources and specific LiveConnect scenarios. This capability is contingent on your connection to a compatible data source, and it's pertinent to both types of automatic page refresh.
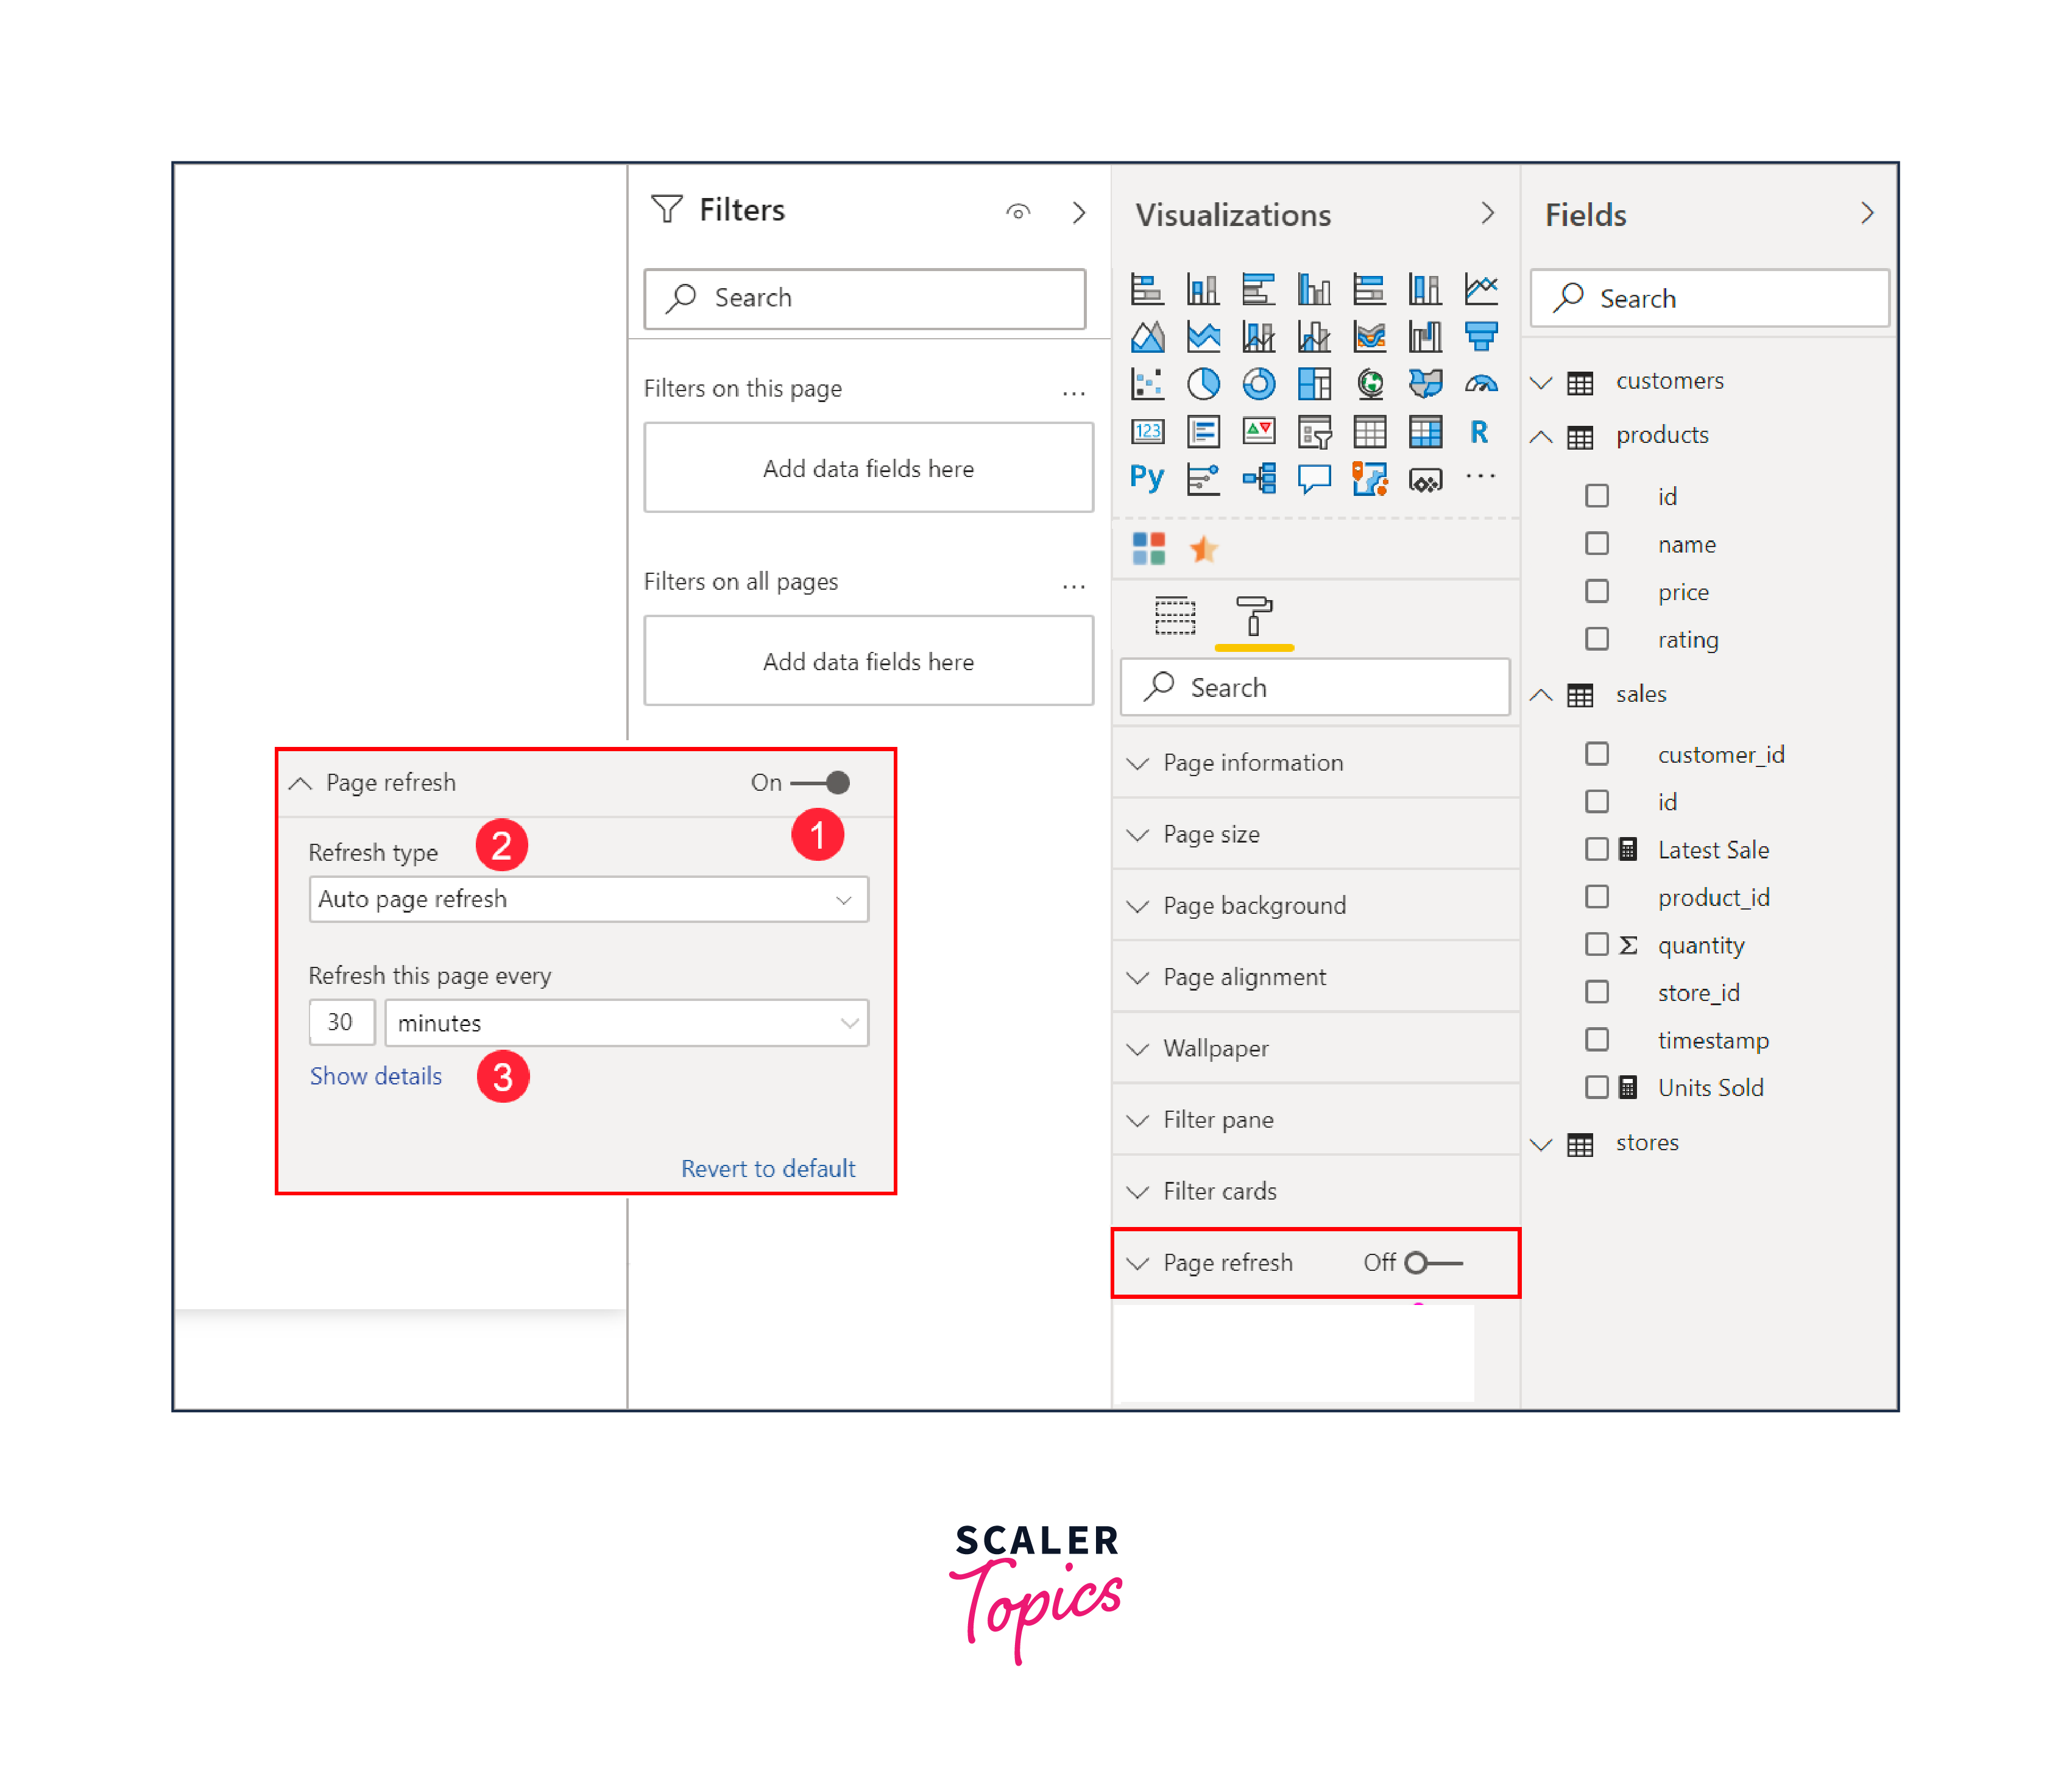
- To activate automatic page refresh in Power BI Desktop, designate the report page where you wish to enable this feature. Navigate to the Visualizations pane, where you'll encounter the Formatting option, depicted as a paint roller icon. Proceed to locate the Page refresh section positioned toward the lower part of the pane.
b. Streaming Data
- Streaming data sources, such as IoT devices, sensors, or live databases, can be integrated into Power BI. This data is continuously ingested and reflected in your visuals in real time.
c. Push Dataset
- Using a push dataset in Power BI involves pushing data directly into the Power BI service. When you create this dataset, the service automatically generates a new database to store the incoming data.
- This database serves as the foundation for creating reports, allowing you to build reports and visuals using Power BI's comprehensive set of features. These reports are fully equipped with Power BI visuals, and data alerts, and can be pinned to dashboard tiles, just like any other report visuals."
A few of the use cases for real-time analytics include the following -
- IoT Monitoring - Real-time analytics is ideal for monitoring IoT devices, tracking sensor data, and responding to anomalies as they happen.
- Financial Markets - In financial services, real-time analytics can track stock prices, currency exchange rates, and trading volumes, enabling traders to make timely decisions.
- Supply Chain Management - Monitor the movement of goods and inventory levels in real-time to optimize supply chain operations.
- Customer Engagement - In e-commerce or customer service, track website activity or customer interactions in real time to improve customer engagement and responsiveness.
Conclusion
- Quick Insights simplifies data exploration by automatically uncovering patterns, saving time, and facilitating data validation.
- Power BI's Q&A empowers users to access insights through natural language queries, enhancing accessibility and usability.
- Creating intuitive reports ensures data is presented clearly and facilitates effective decision-making.
- Real-time analytics provides up-to-the-minute insights, essential for monitoring dynamic data sources and making timely decisions.