Data Aggregation in Power BI
Overview
In the realm of data analytics and business intelligence, harnessing the power of data is paramount for any business to stay ahead of the competition. Power BI, Microsoft's data visualization and business intelligence tool, stands at the forefront of this revolution. At its core, Power BI relies on effective data aggregation to transform raw information into actionable insights. Data aggregation in Power BI refers to the process of summarizing and condensing large volumes of data into meaningful and manageable insights, facilitating informed decision-making through visualization and analysis. In this article, we explore the data aggregation in Power BI, its significance, methods, and its pivotal role in making informed business decisions.

Understanding Aggregation Functions in Power BI
In this section, we explore the essential data aggregation functions in Power BI, each serving as a powerful tool to distill and analyze data, enabling informed decision-making and insightful visualizations.
- SUM (Summation):
The SUM function in Power BI adds numeric values in a column, providing a total or cumulative sum. It's valuable for calculating the total sales, revenue, or any other metric that involves adding numeric values. - AVG (Average):
AVG calculates the average of a set of numeric values in a column. It's useful for finding the mean value of data, such as the average temperature, rating, or score. - COUNT:
COUNT in Power BI counts the number of non-blank or non-null values in a column. It's commonly employed to determine a dataset's quantity of items, customers, or occurrences. - MIN (Minimum):
This function identifies the smallest value within a numeric column. It's often applied to find the minimum value in a dataset, such as the lowest temperature, cost, or time. - MAX (Maximum):
The MAX function does the opposite of MIN. It identifies the largest value in a numeric column, such as the highest sales, temperature, or profit. - COUNTA (Count All):
COUNTA counts all the values in a column, including both non-blank and blank cells. It's useful for assessing the total number of entries in a dataset. - DISTINCTCOUNT (Distinct Count):
DISTINCTCOUNT calculates the number of unique values in a column, eliminating duplicates. This function is crucial when you want to count your data's distinct items, customers, or categories.
How to Create Custom Aggregations?
While Power BI offers a range of built-in aggregation functions, there are instances when your data analysis requires custom calculations. Power BI allows you to create custom aggregations using DAX (Data Analysis Expressions). For example, you can define a custom aggregation to calculate the rolling average of monthly sales, which isn't achievable with standard aggregation functions. With DAX, you can define your formulas and measures tailored to your specific business needs. This flexibility empowers you to calculate unique metrics, perform complex calculations, and gain deeper insights from your data. In this section, we'll explore the process of creating custom aggregations in Power BI through DAX, giving you the ability to unlock the full potential of your data analysis.
Aggregation with DAX Measures
DAX (Data Analysis Expressions) measures are a key component of Power BI's data modeling and aggregation capabilities. These measures allow you to create custom calculations and perform data aggregations tailored to your specific requirements. Let's look at an example to demonstrate how you can use DAX measures for aggregation in Power BI.
Let's say you want to calculate the Year-to-Date (YTD) sales for your company. This custom aggregation involves summing the sales amounts from the beginning of the year up to the selected date, regardless of the granularity of your data. To achieve this with a DAX measure, you follow these steps:
-
Open your Power BI Desktop and go to the "Modeling" tab.
-
Click on "New Measure" to create a new DAX measure.
-
Enter the following DAX formula:
YTD Sales = TOTALYTD(SUM(Sales[SalesAmount]), 'Date'[Date])
This formula uses the TOTALYTD function to calculate the YTD sales. It takes the sum of the SalesAmount column and considers the date column for the YTD calculation.
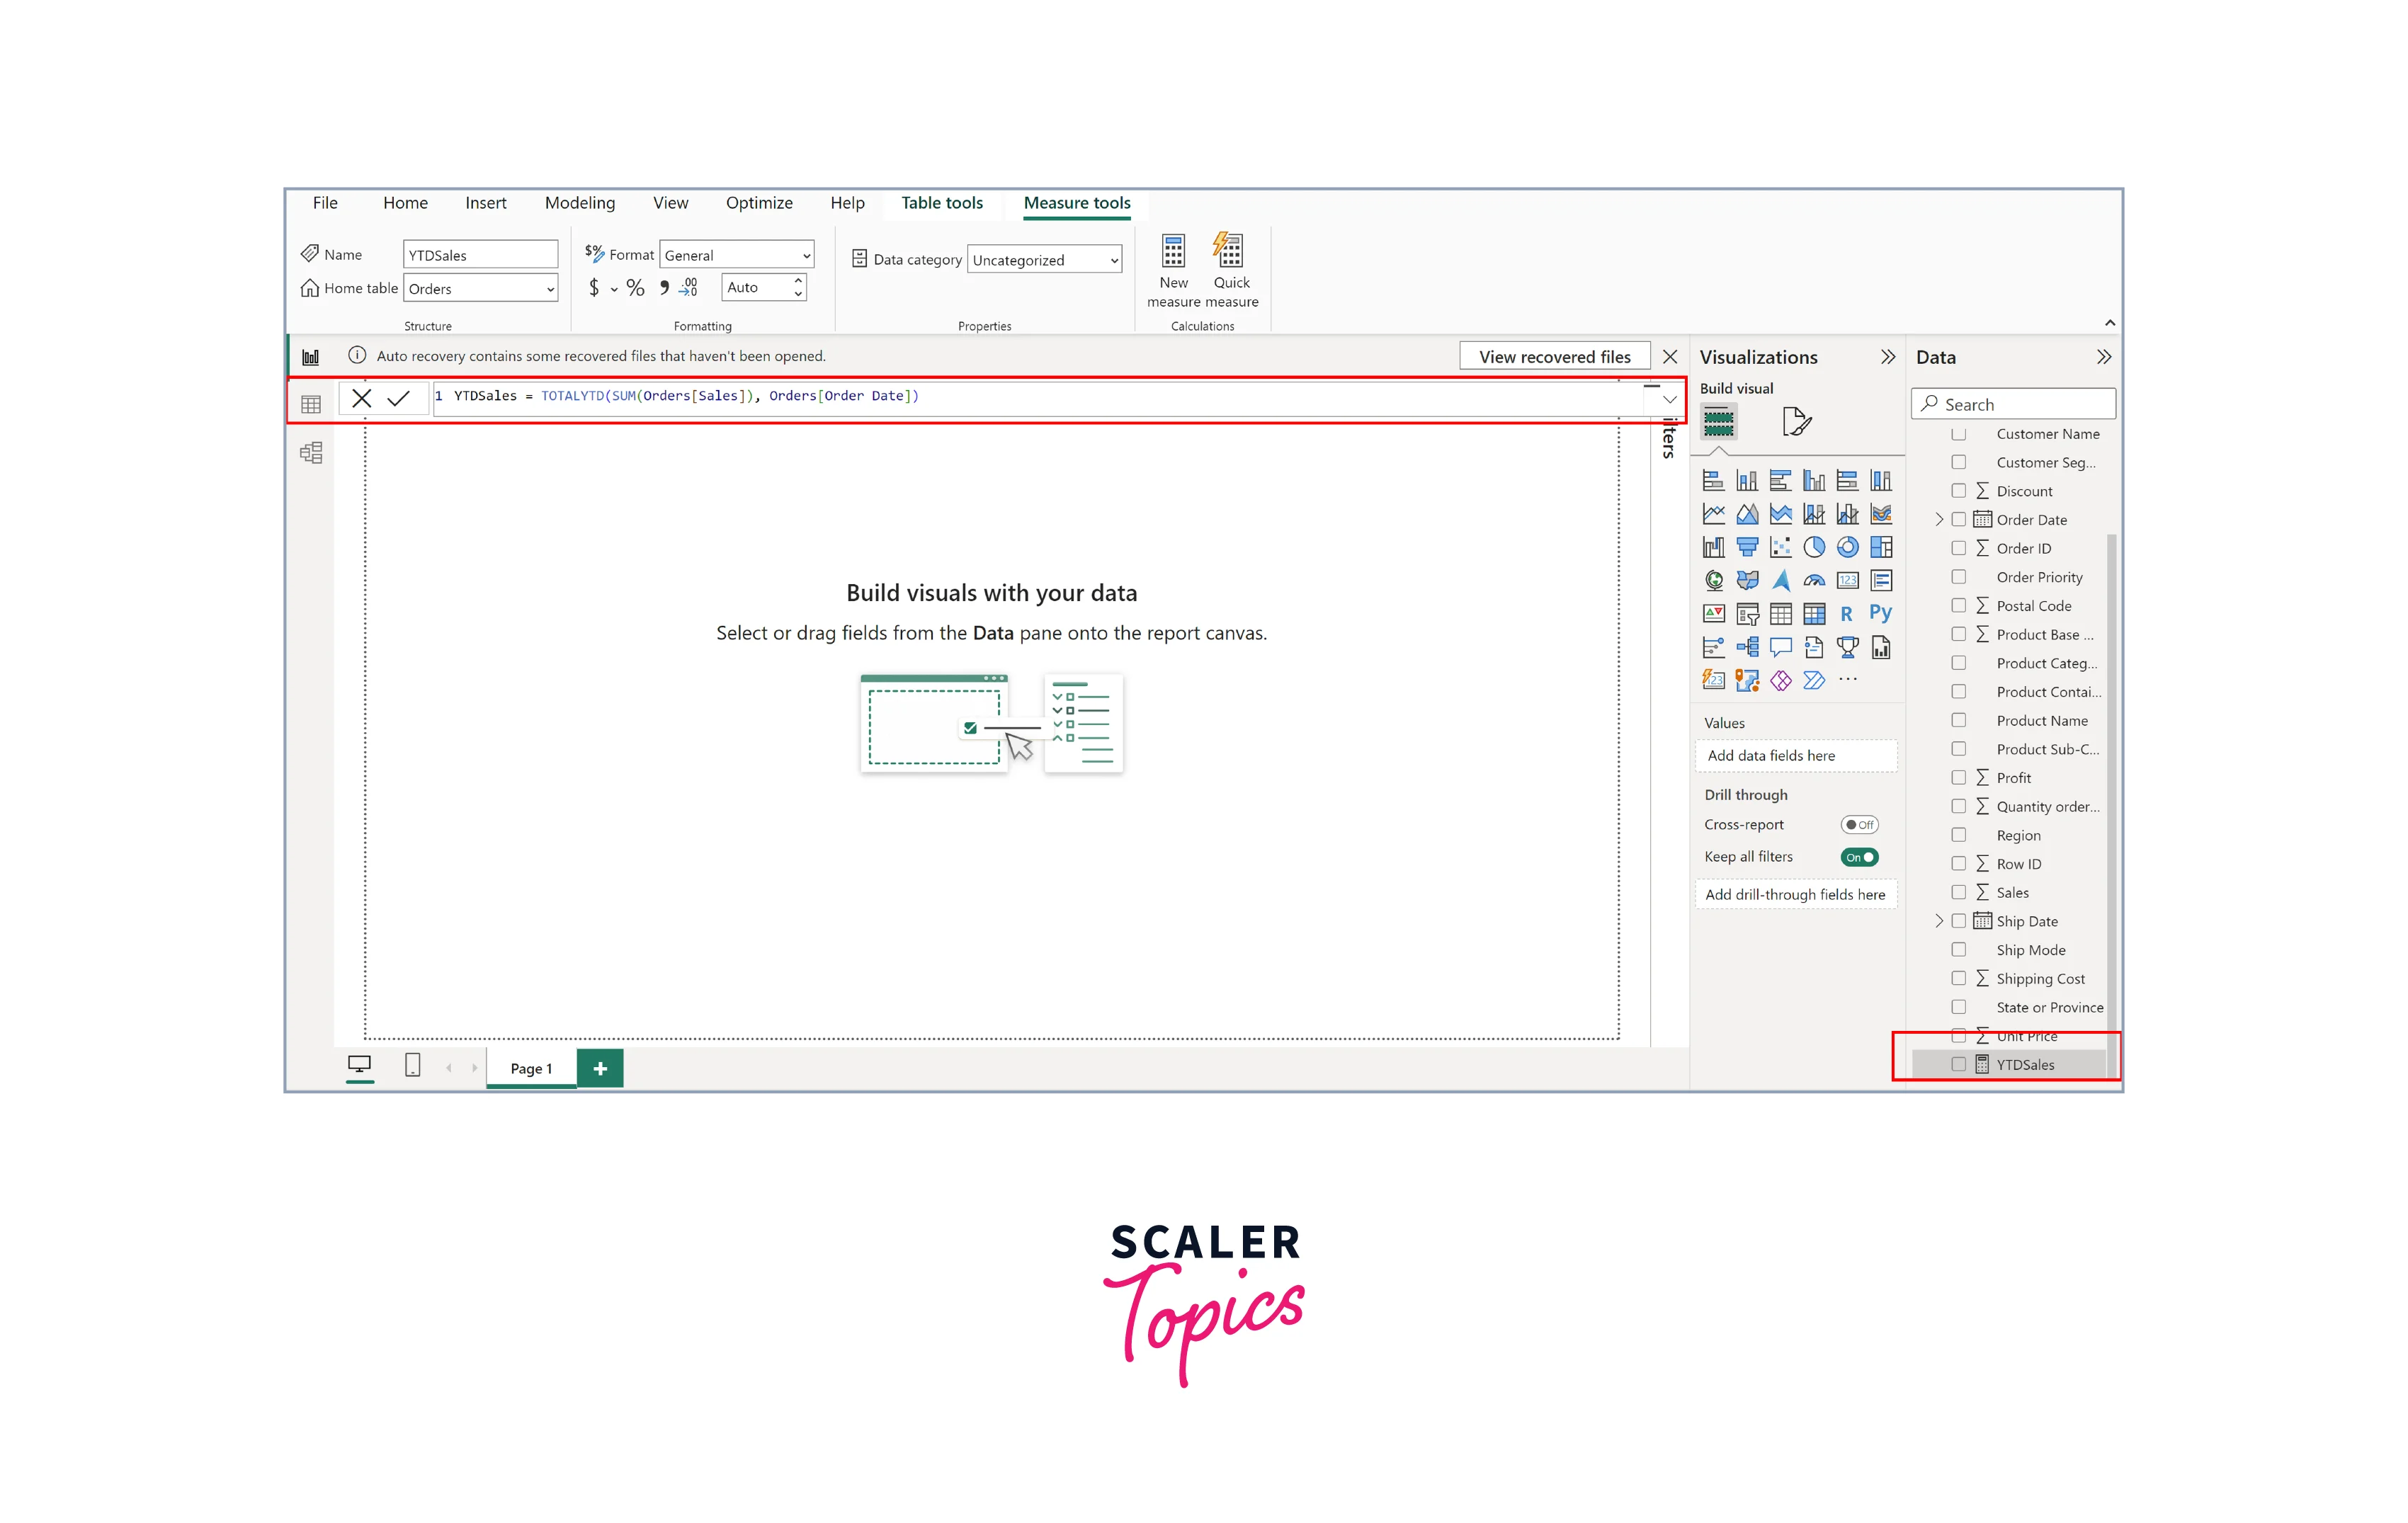
Once you've created the measure, you can now use it in your visuals. For example, you can add a line chart and place the 'Date' column on the x-axis and 'YTD Sales' measure on the values axis to visualize the YTD sales trend over time. DAX measures like this provide the flexibility to create custom aggregations and calculations, allowing you to gain deeper insights from your data and create more informative reports and dashboards in Power BI.
Aggregating Data with Grouping
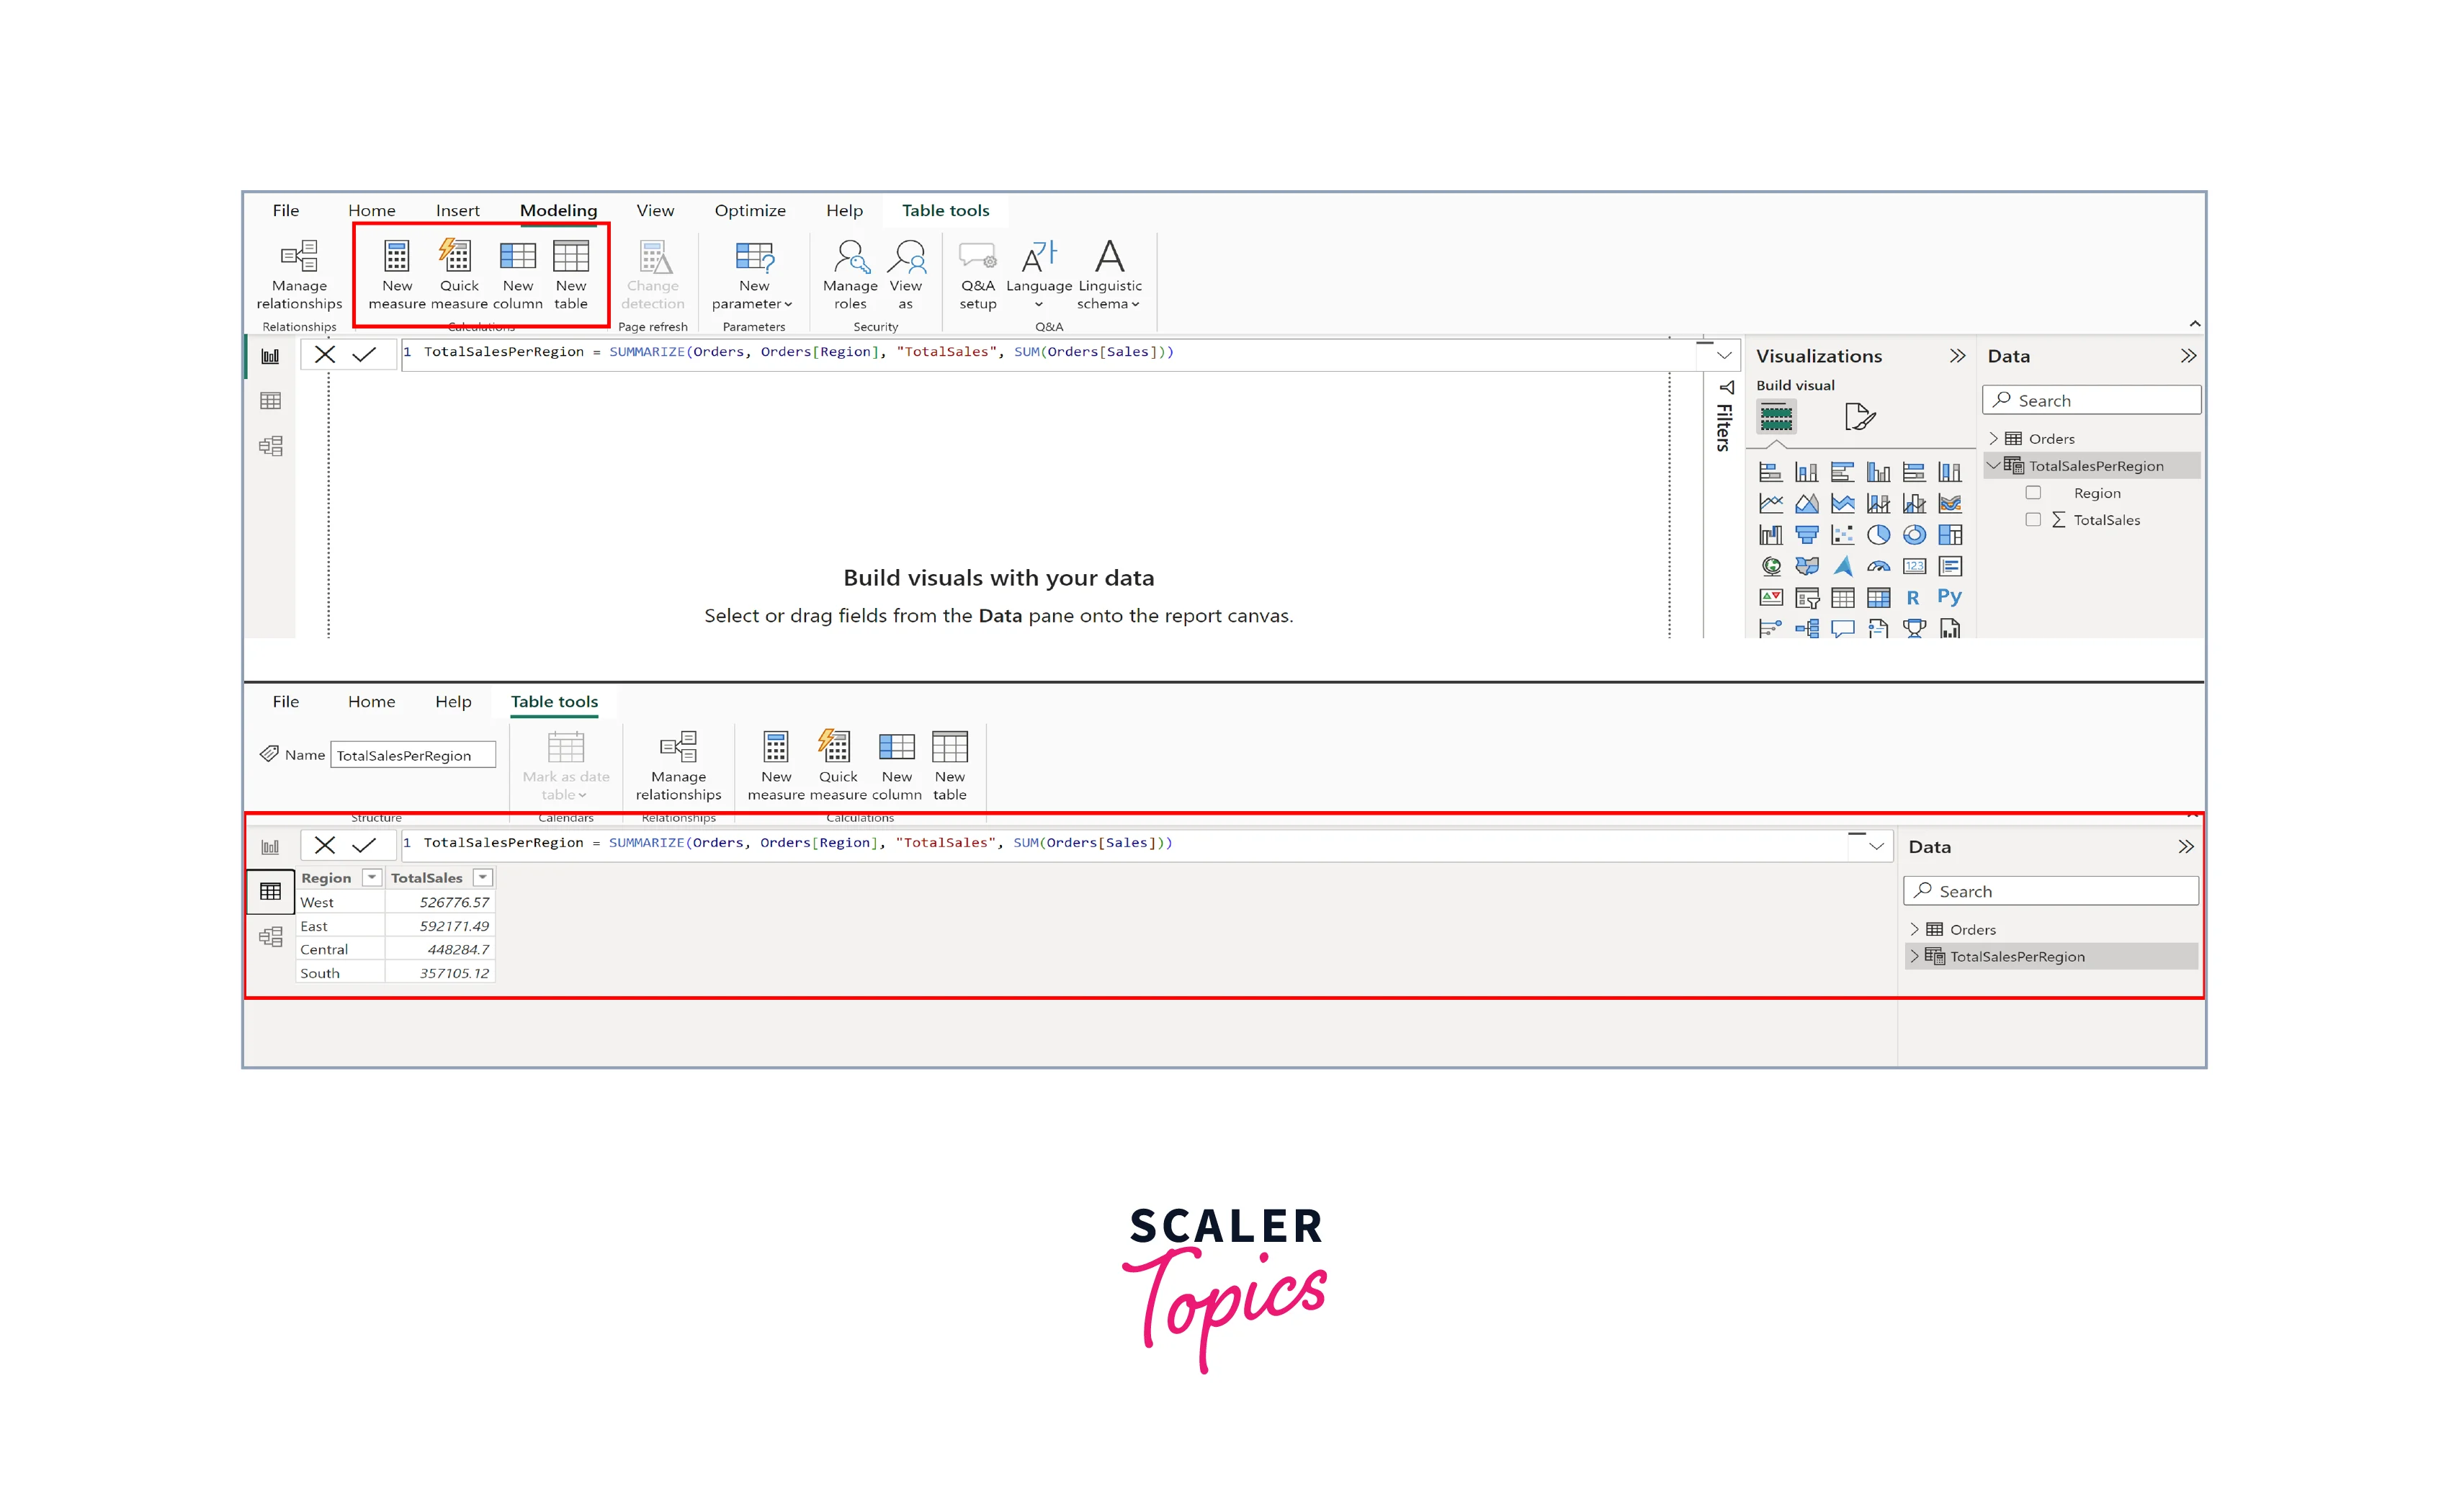
In Power BI, you can aggregate data with grouping by creating new tables and using DAX (Data Analysis Expressions) queries. This approach allows you to organize and summarize your data based on specific criteria. Here's how to do it:
-
In Power BI Desktop, go to the "Modeling" tab and select "New Table".
-
In the formula bar, write a DAX query to create your new table with grouping and aggregation. For example, to group sales data by region and calculate the total sales for each region, you can use the following DAX query:
TotalSalesPerRegion = SUMMARIZE(Orders, Orders[Region], "TotalSales", SUM(Orders[Sales]))
-
Once you've created the new table, you can add it to your visuals in Power BI, such as tables or charts, to display the aggregated data.
Working with Hierarchical Data and Levels of Aggregation
Hierarchical data structures are information systems organized in layers or levels, where each level contains more specific details than the previous one. Working with hierarchical data in Power BI involves managing and analyzing such structures effectively. This approach allows users to navigate through data from a broad perspective down to fine-grained details.

Consider a scenario where you have sales data. You can create a hierarchy from 'Region' to 'Country' to 'City' to 'Store.' This hierarchy enables you to analyze sales at various levels. For instance, you can view total sales for an entire region, drill down to see sales per country, further drill to city-level sales, and finally, examine individual store performance. You can also use DAX measures to perform aggregations at different hierarchy levels. For instance, you can simultaneously calculate sales totals at the city, state, and country levels. Furthermore, you can utilize visualizations like treemaps or drill-through reports to effectively showcase hierarchical data and its various levels of aggregation.
Levels of aggregation refer to the varying degrees of data summarization within a hierarchy. Power BI enables users to drill down or roll up data within hierarchies to access information at different levels of granularity. This flexibility empowers analysts to gain insights from an overall perspective and then zoom in to explore specific subsets of data. It's a valuable technique for in-depth data analysis and reporting, particularly in scenarios involving complex organizational structures, geographical data, or product hierarchies.
Utilizing Aggregation in Visualizations
Efficiently utilizing data aggregation in visualizations is pivotal to transforming complex datasets into understandable and actionable insights within Power BI. This section will explore how to utilize data aggregation using visualizations.
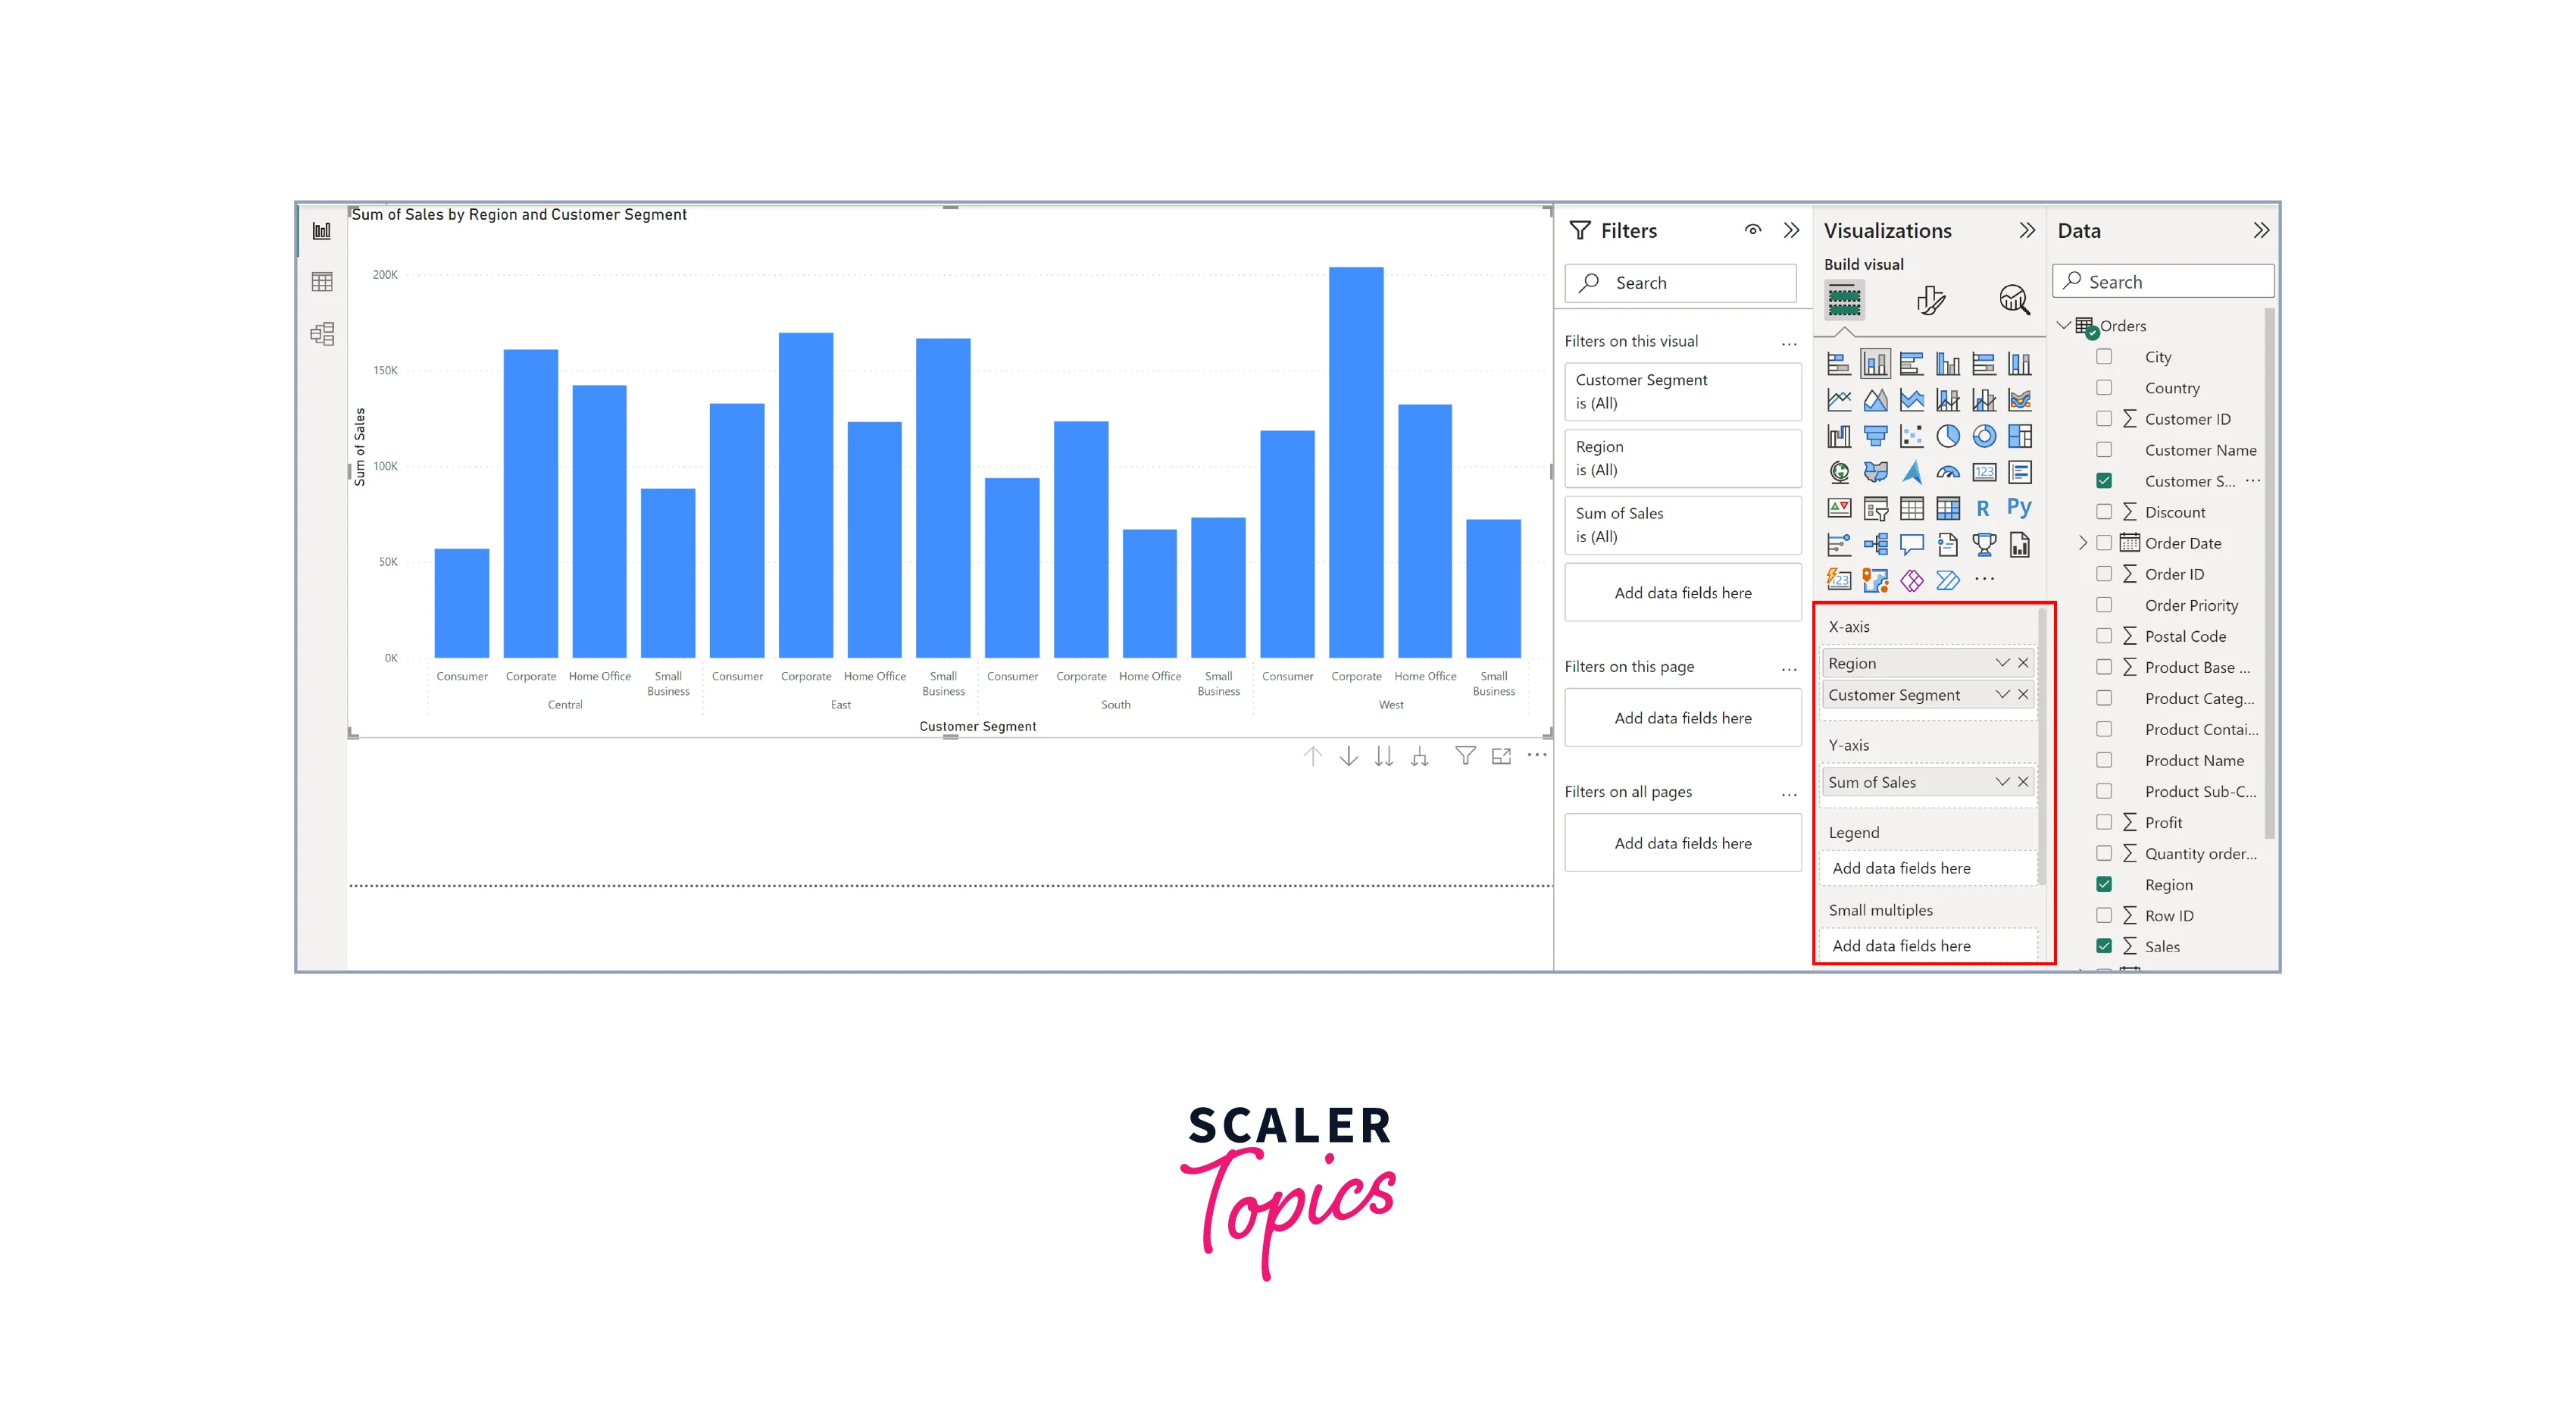
Bar Charts and Column Charts with Aggregated Data
Bar charts and column charts are powerful visualization tools in Power BI for displaying aggregated data. They excel at presenting comparisons, trends, and distributions. By aggregating data, these charts provide a clear and concise overview of key insights, making complex information more accessible and actionable for decision-makers.
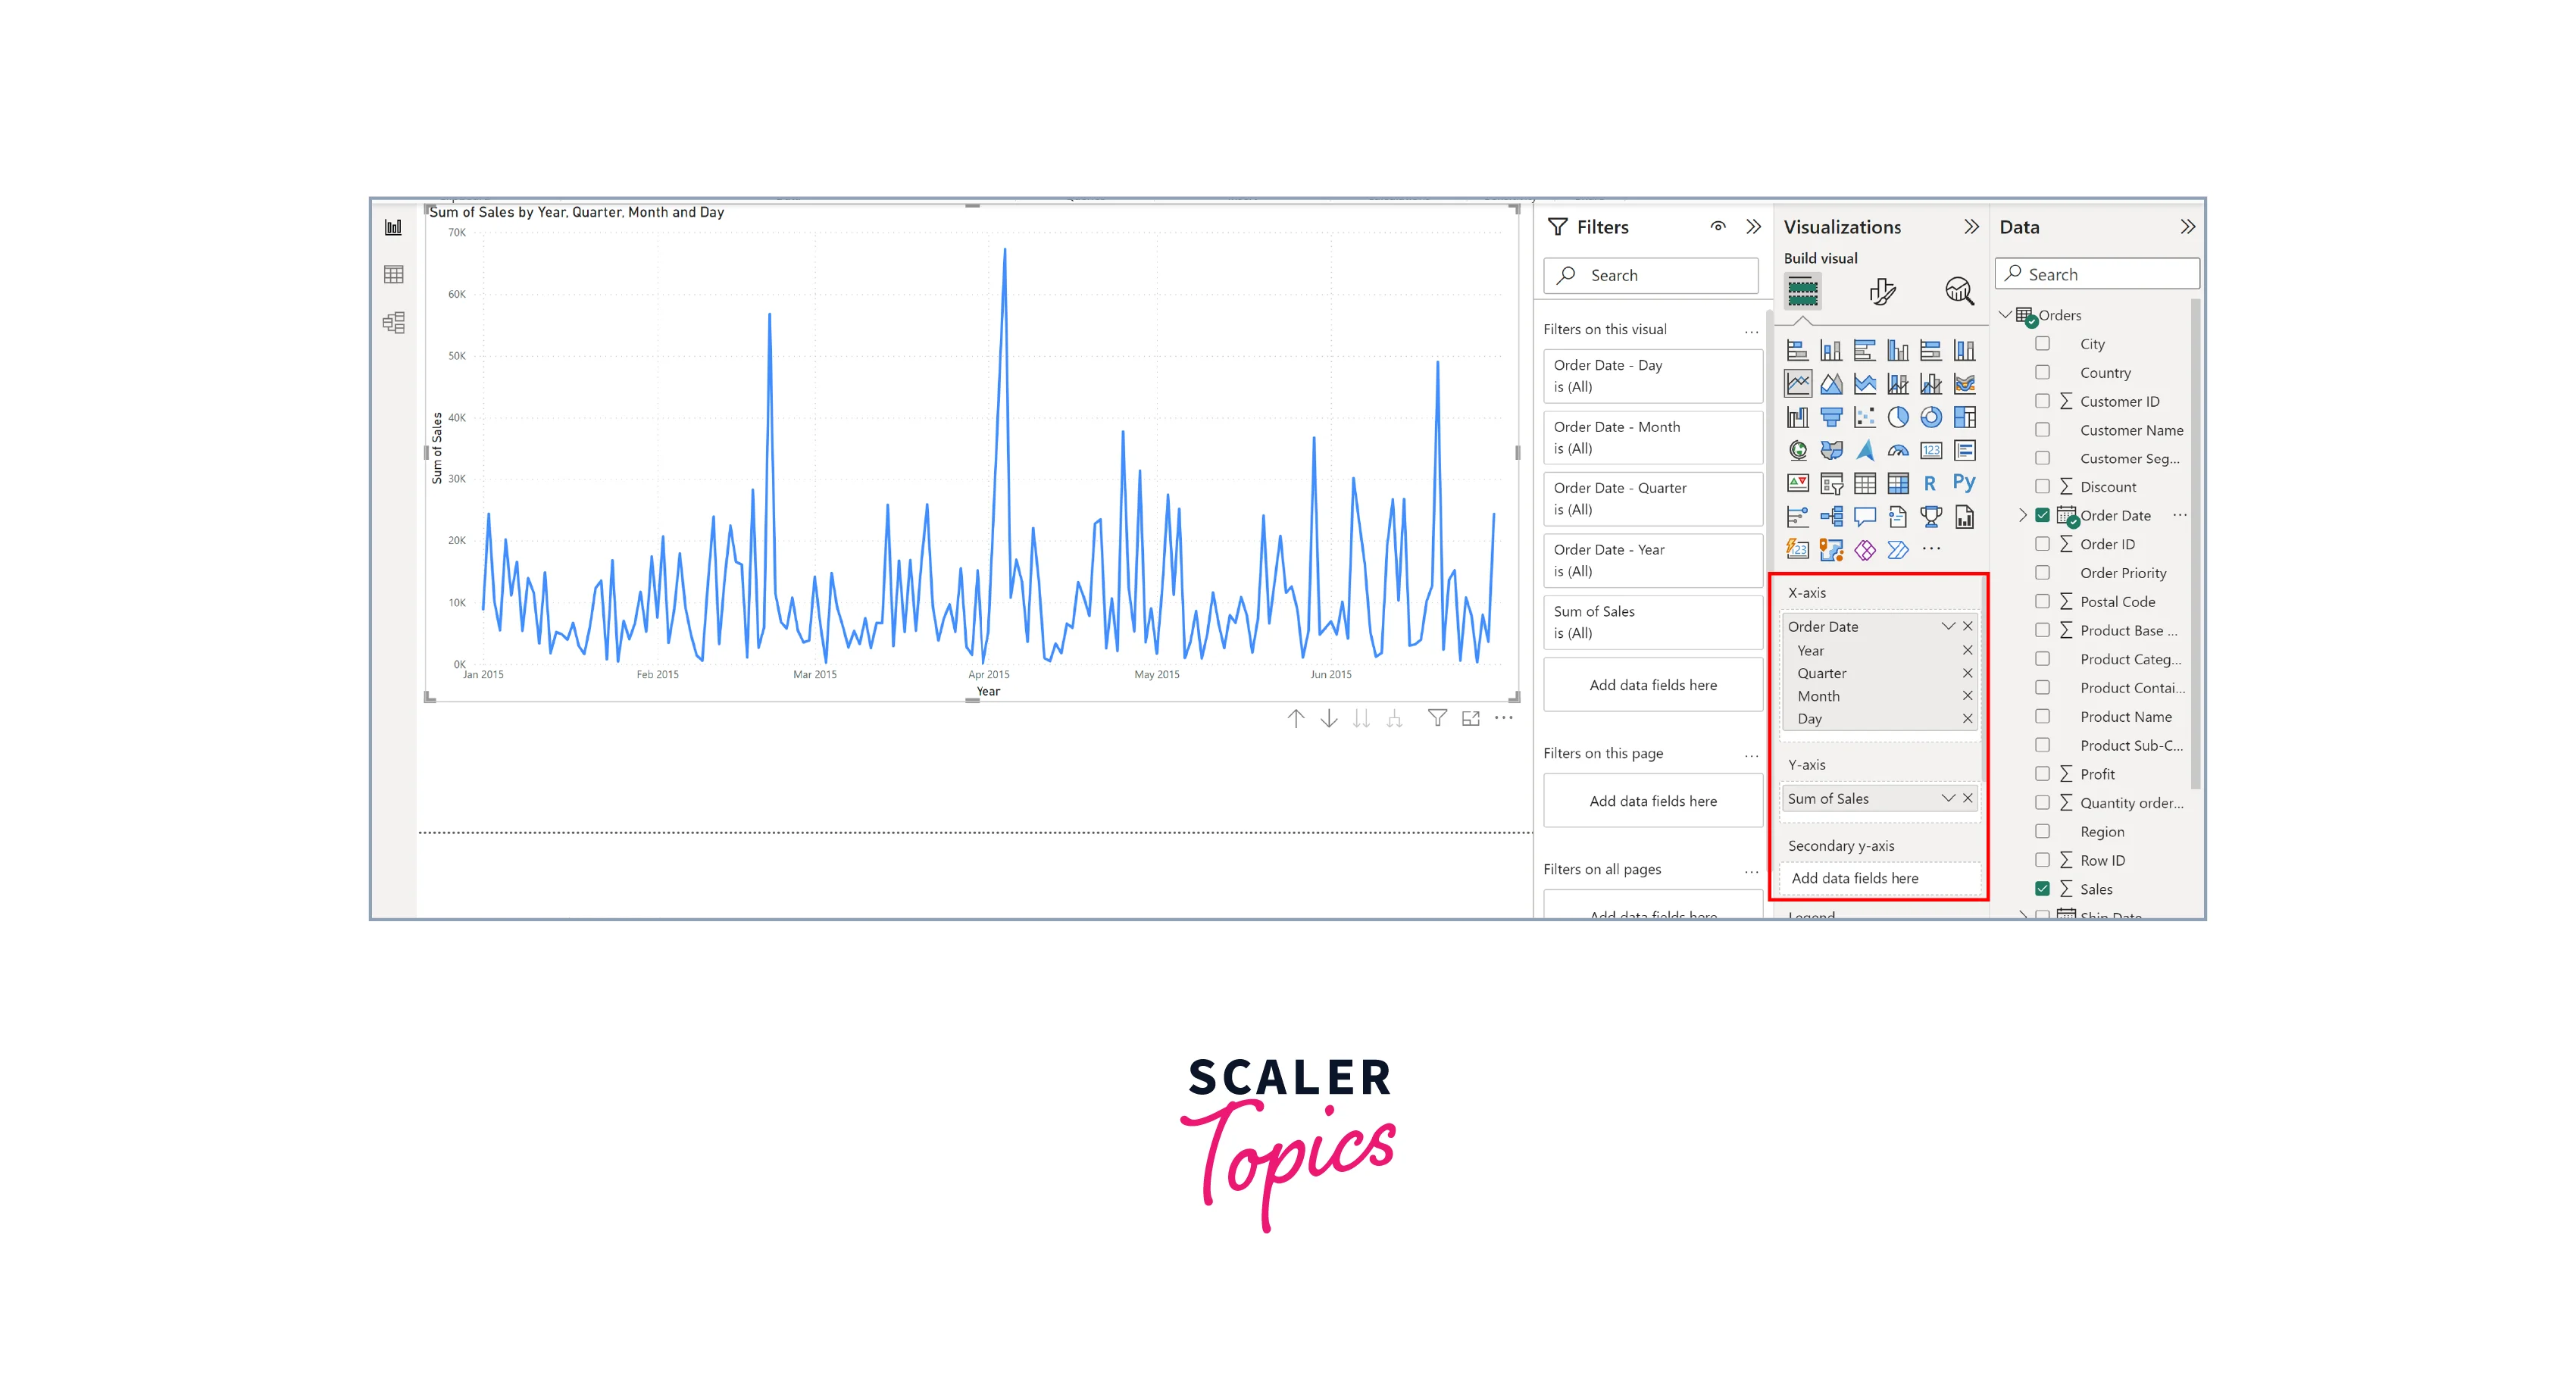
Line Charts and Area Charts with Time Aggregation
Line and area charts are dynamic visualization options in Power BI, especially effective when dealing with time-based data. These charts excel at showcasing trends, patterns, and fluctuations over time. By aggregating data across different time intervals, such as days, weeks, or months, they provide a comprehensive view of temporal insights, aiding in forecasting, trend analysis, and historical comparisons.
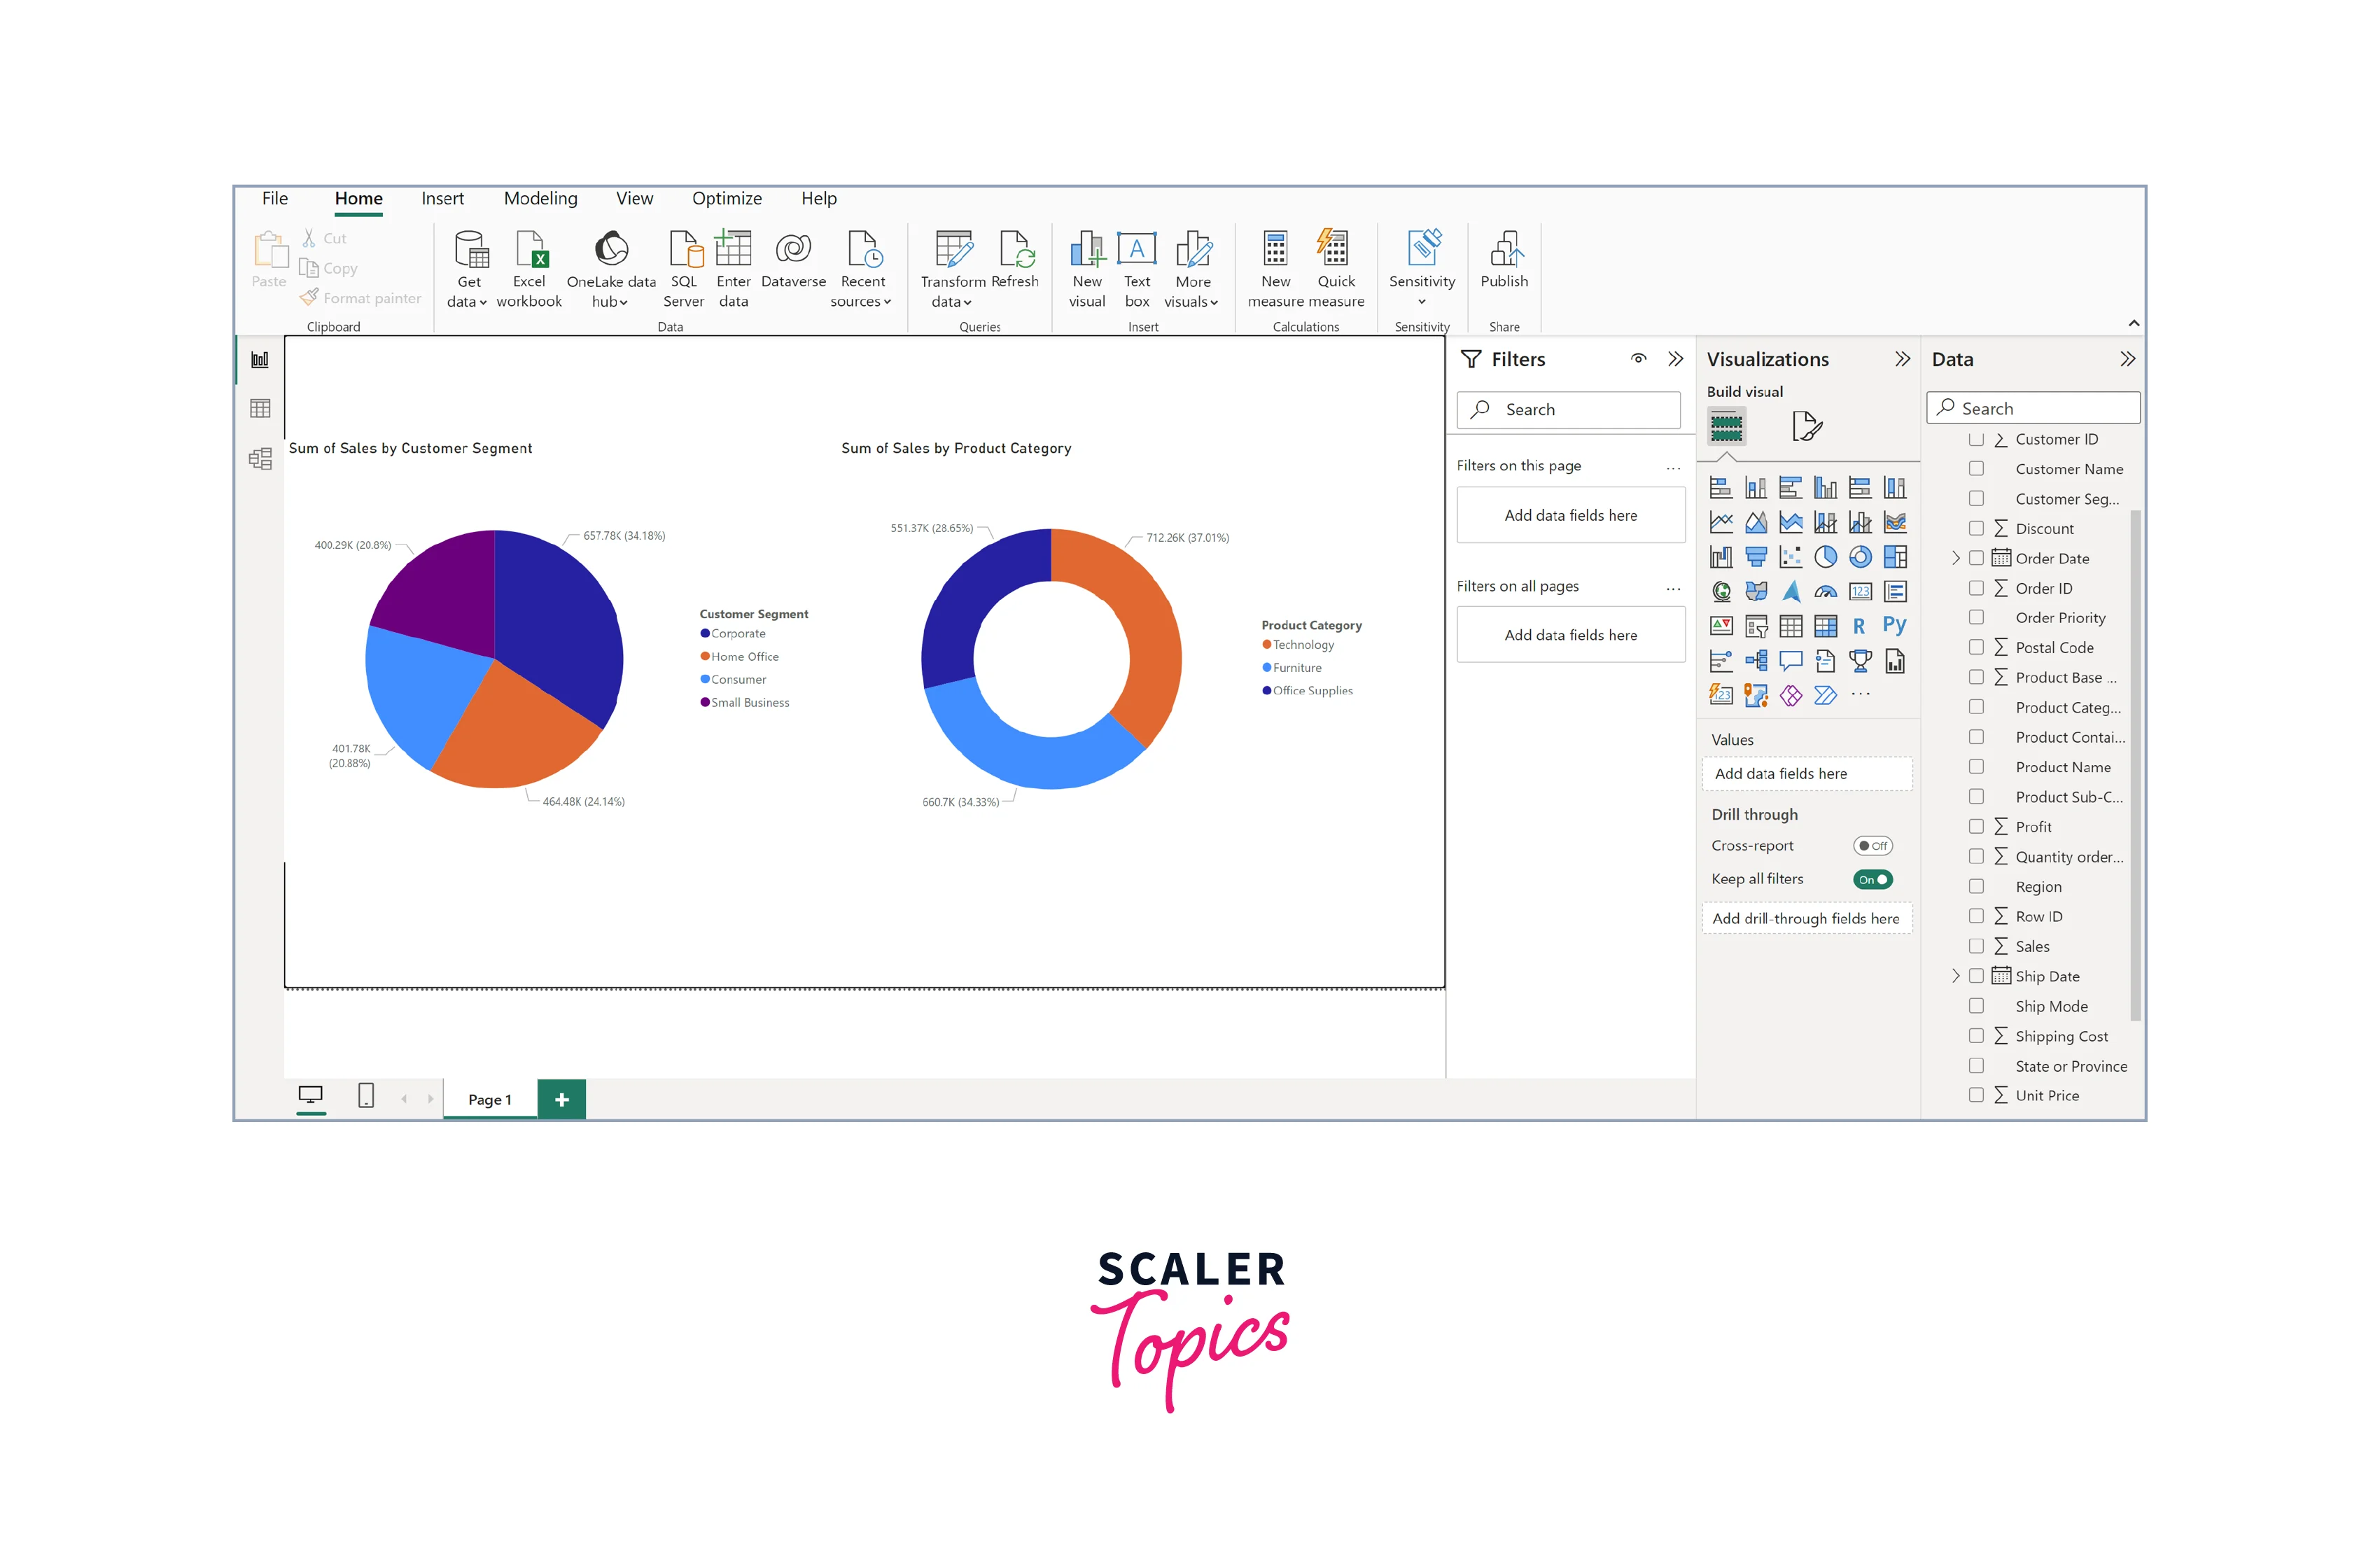
Pie Charts and Donut Charts for Proportional Aggregation
Pie and donut charts in Power BI are valuable for representing proportional data aggregation. These charts visually display how parts relate to the whole, making them effective for showcasing categorical data and the distribution of values within it. Pie and donut charts offer a quick and intuitive way to grasp proportions and relative importance within a dataset by aggregating data into segments or categories.
Conclusion
- Data aggregation in Power BI is the catalyst for transforming raw information into actionable insights, providing decision-makers with the clarity they need to drive strategic choices.
- Power BI's array of aggregation functions and DAX measures enable users to tailor calculations to their precise needs, allowing for unique and granular analyses.
- Aggregated data can be utilized with various visualizations, from bar and line charts to pie charts, unlocking the potential to convey complex data understandably and compellingly.