Enterprise Analytics with Power BI
Overview
In today's data-driven landscape, enterprises are constantly seeking smarter ways to harness the power of their data. This article explores the transformative potential of Power BI, Microsoft's robust business intelligence tool, in the context of enterprise analytics Power BI. We will embark on a journey to construct a dynamic dashboard that empowers organizations to unlock insights, streamline decision-making, and drive strategic growth. Whether you are a beginner or an experienced professional, this guide will help you harness the power of the Enterprise Analytics Power BI and unveil the art of data-driven excellence.
What are we Building?
In this project, we will leverage the Airbnb listings dataset to conduct enterprise-level analytics to extract invaluable insights. These insights will encompass aspects such as the distribution of listing types and an in-depth assessment of their performance within the platform.
Pre-requisites
Here's a list of prerequisites to create a Sales Dashboard Using Power BI -
- Power BI Desktop - Ensure you have Power BI Desktop downloaded and installed on your computer. You can also download it from the official Microsoft Power BI website.
- Familiarity with Data Analysis - A foundational understanding of data analysis concepts, such as data types, aggregation, and trends, will be helpful.
- Basic Excel Skills - A basic knowledge of Excel is beneficial for data pre-processing and transformation before importing into Power BI.
- Visualization Concepts - Basic comprehension of data visualization principles and chart types, like bar charts, line graphs, and pie charts.
How are we going to Build this?
We'll meticulously follow a structured set of steps to build this insightful Airbnb analytics dashboard. First and foremost, we'll begin by loading the Airbnb listings dataset, ensuring we have the foundational data required for our analysis. With the dataset at hand, our next crucial move will be to engage in comprehensive data transformation and cleaning, refining the information to its most accurate and usable state. Once our data is primed, we'll embark on the creative phase, infusing the dashboard with various visualizations designed to unveil the distribution of listing types and gauge their performance on the platform. We'll incorporate slicers that allow filtering based on essential factors such as construction year, rating, and location to enhance user interactivity and exploration. Through these methodical steps, we'll leverage the enterprise analytics Power BI power that empowers users to extract meaningful insights and make informed decisions.
Building Enterprise Analytics with Power BI
Let’s explore the various steps involved in performing enterprise analytics in Power BI using the Airbnb listings dataset -
Data Connection
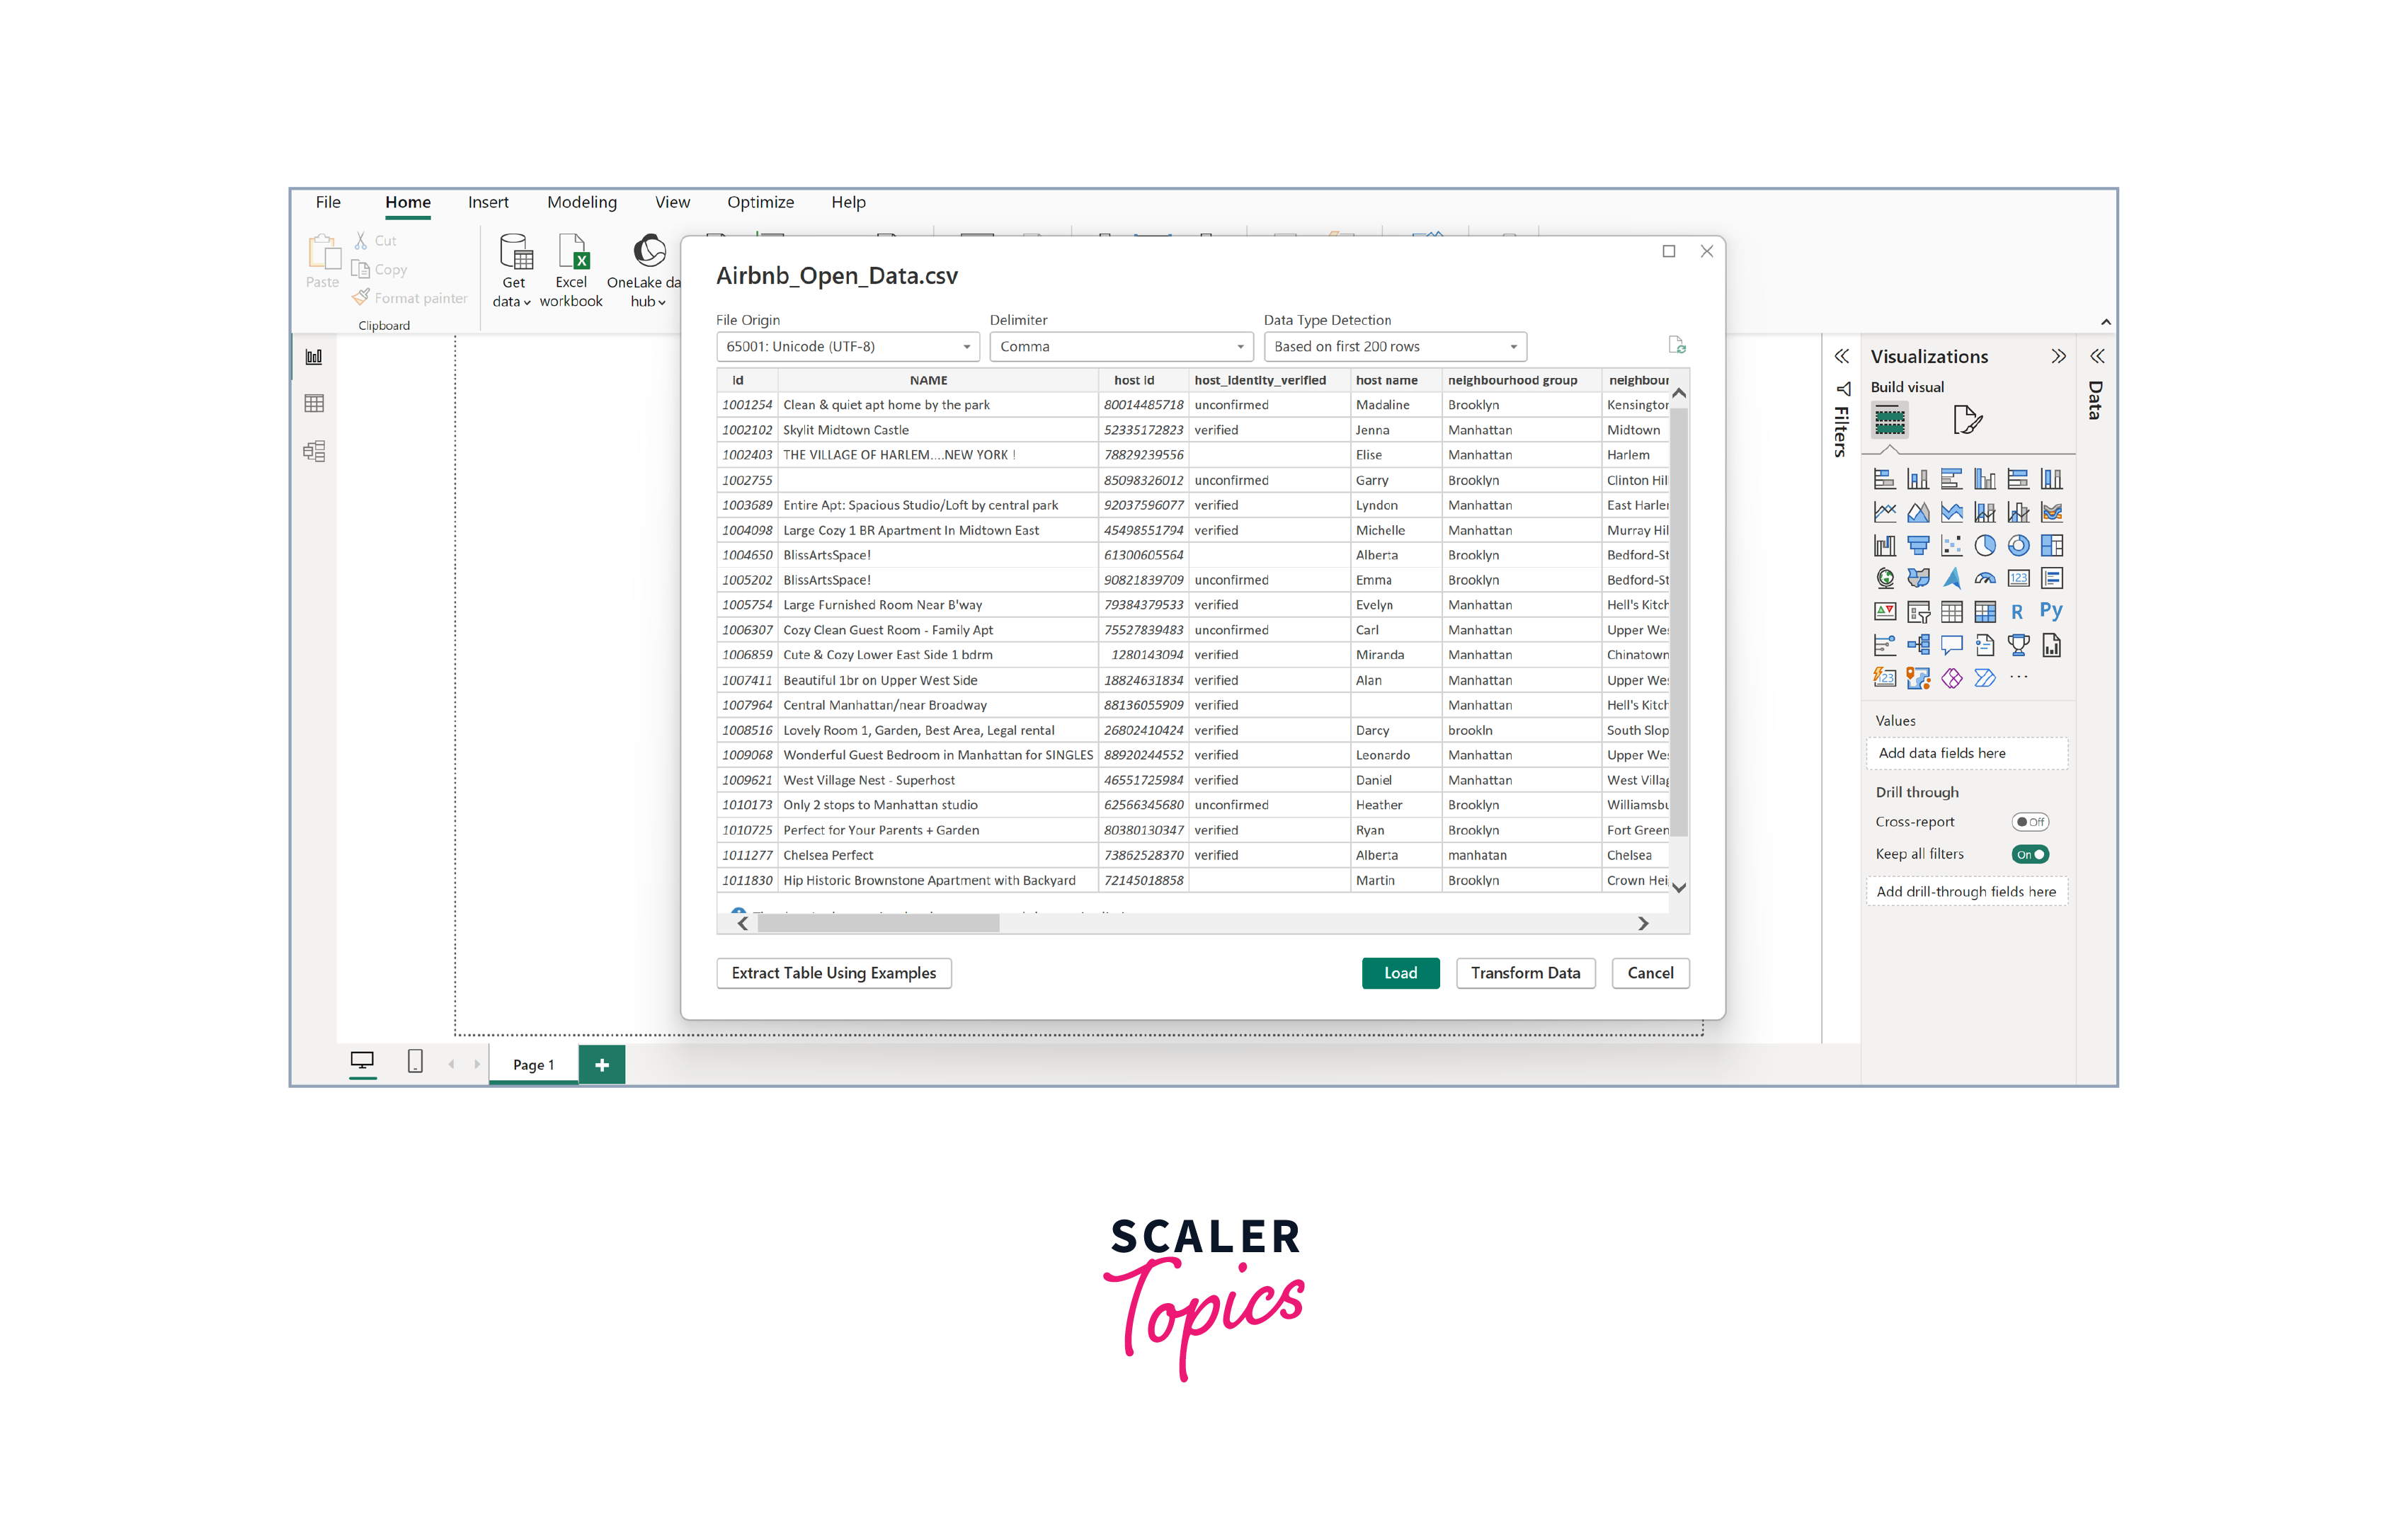
To kick start our journey toward building the Airbnb analytics dashboard, we need to establish a robust data connection by obtaining the sample dataset containing essential features such as listing name, construction year, hostnames, neighborhood, country, ratings, total reviews, pricing, and more. You can conveniently access and download this dataset by following the link here. Once you've downloaded the dataset, we can proceed to the next step of data transformation and cleaning, setting the stage for insightful analytics and visualization.
To connect to a data store using Power BI -
- Open Power BI Desktop.
- Click "Home" > "Get Data" > select your data source (e.g., Excel, CSV, database).
- Browse and select your dataset, then follow the prompts to configure the connection and load data into Power BI.
Data Transformation
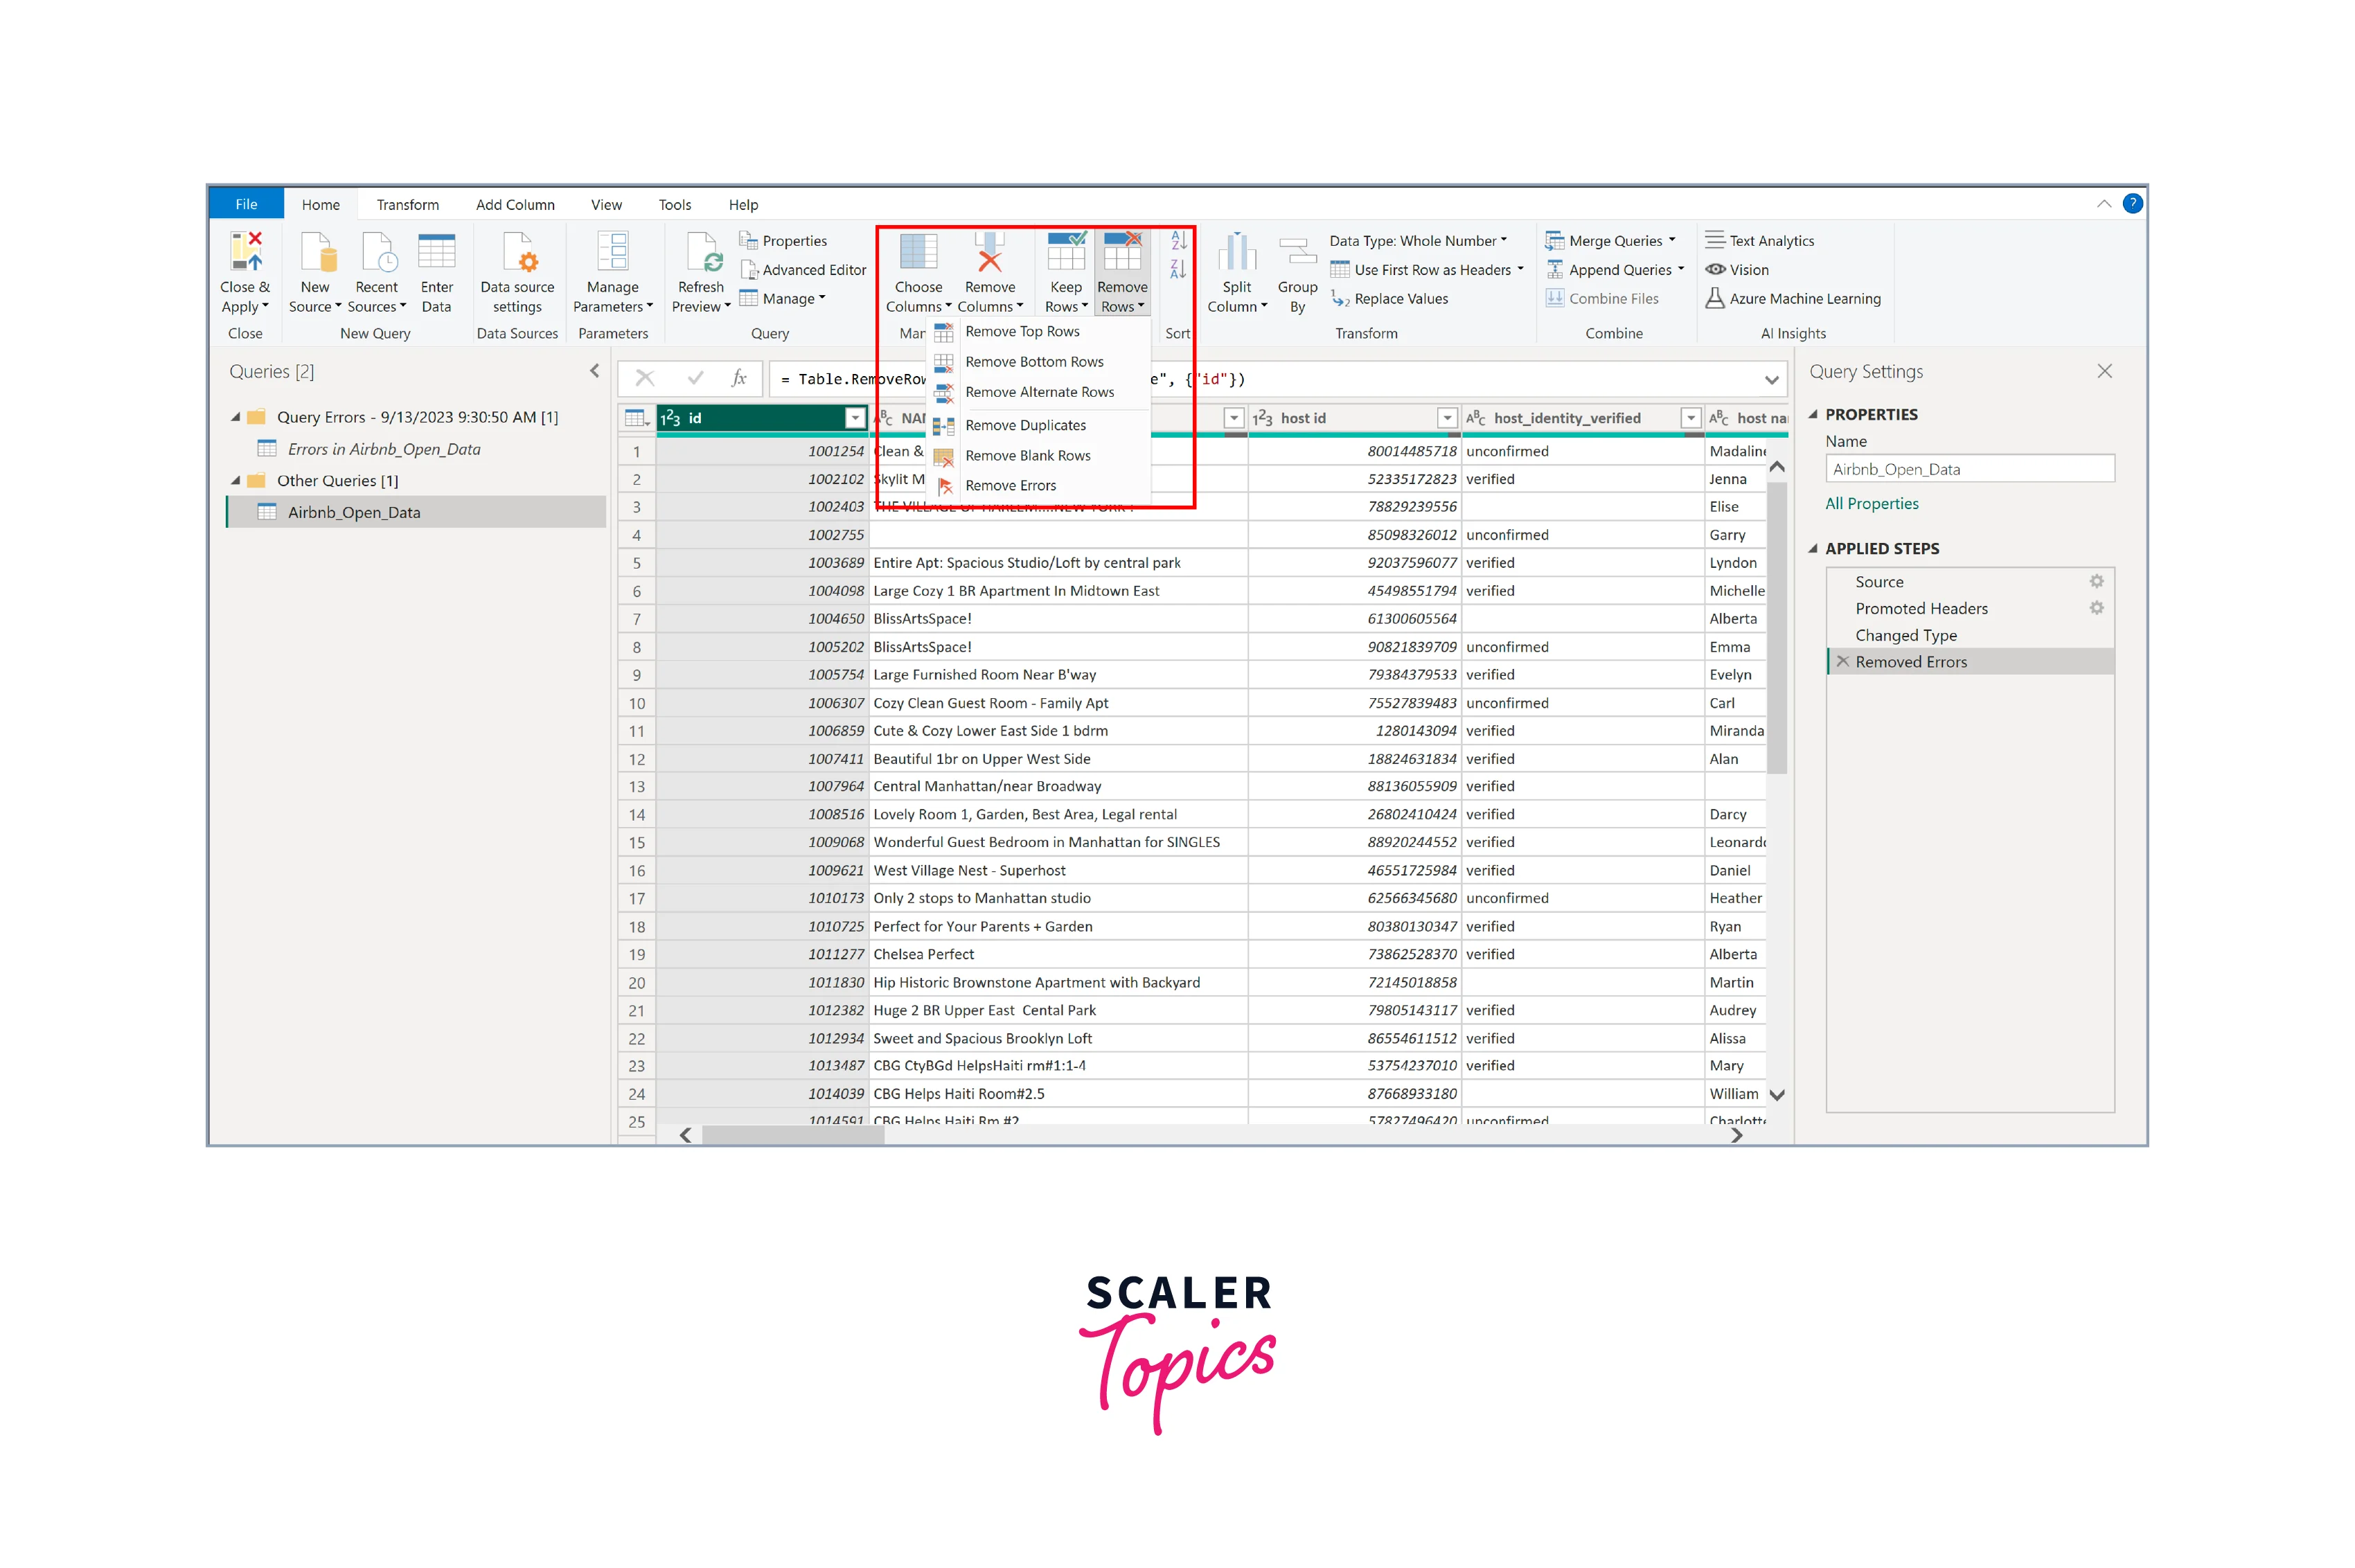
In the data transformation and cleaning phase of our Power BI marketing dashboard project, our main goal is to get our dataset ready for a deep dive into analysis. To do this, we'll go through some important steps. First, we'll check the data type in each column to ensure everything is in the right format. We want dates to be in date format, numbers to be in numeric format, and text to be in text format.
Next, we'll closely examine the data to find any missing information. If we find any gaps, we'll decide how to deal with them. Sometimes, we can make educated guesses to fill in the missing data (that's called imputation), but if we can't do that reliably, we might have to remove those parts from our analysis. Upon importing the Airbnb dataset into Power BI, you will see a few entries containing errors. For the further analysis, we will remove these records from the dataset, as shown in the figure below.
In this project, we have not added any new features to the dataset, but you can follow the mentioned steps to add a new column of your choice using DAX -
- Launch Power BI Desktop and open your report where you want to add the calculated column.
- Select the table/dataset to add the calculated column in the Fields pane on the right. This is the table where your new column will reside.
- Go to the "Modeling" tab in the Power BI Desktop ribbon and click "New Column." This will open a formula bar where you can enter your DAX expression.
- In the formula bar, write your DAX expression to calculate the values for the new column. Press Enter to apply the expression. Power BI will calculate and add the new column to your table.
Creating Visualizations
Now that our data is ready for further analysis, we can move on to the next part—creating visualizations that will convert raw data into actionable insights. To create these visualizations in Power BI -
- Drag and drop the required fields onto the visualization area.
- Choose the appropriate visualization type (bar, line, or pie chart).
- Customize the visualizations by configuring labels, colors, and other settings.
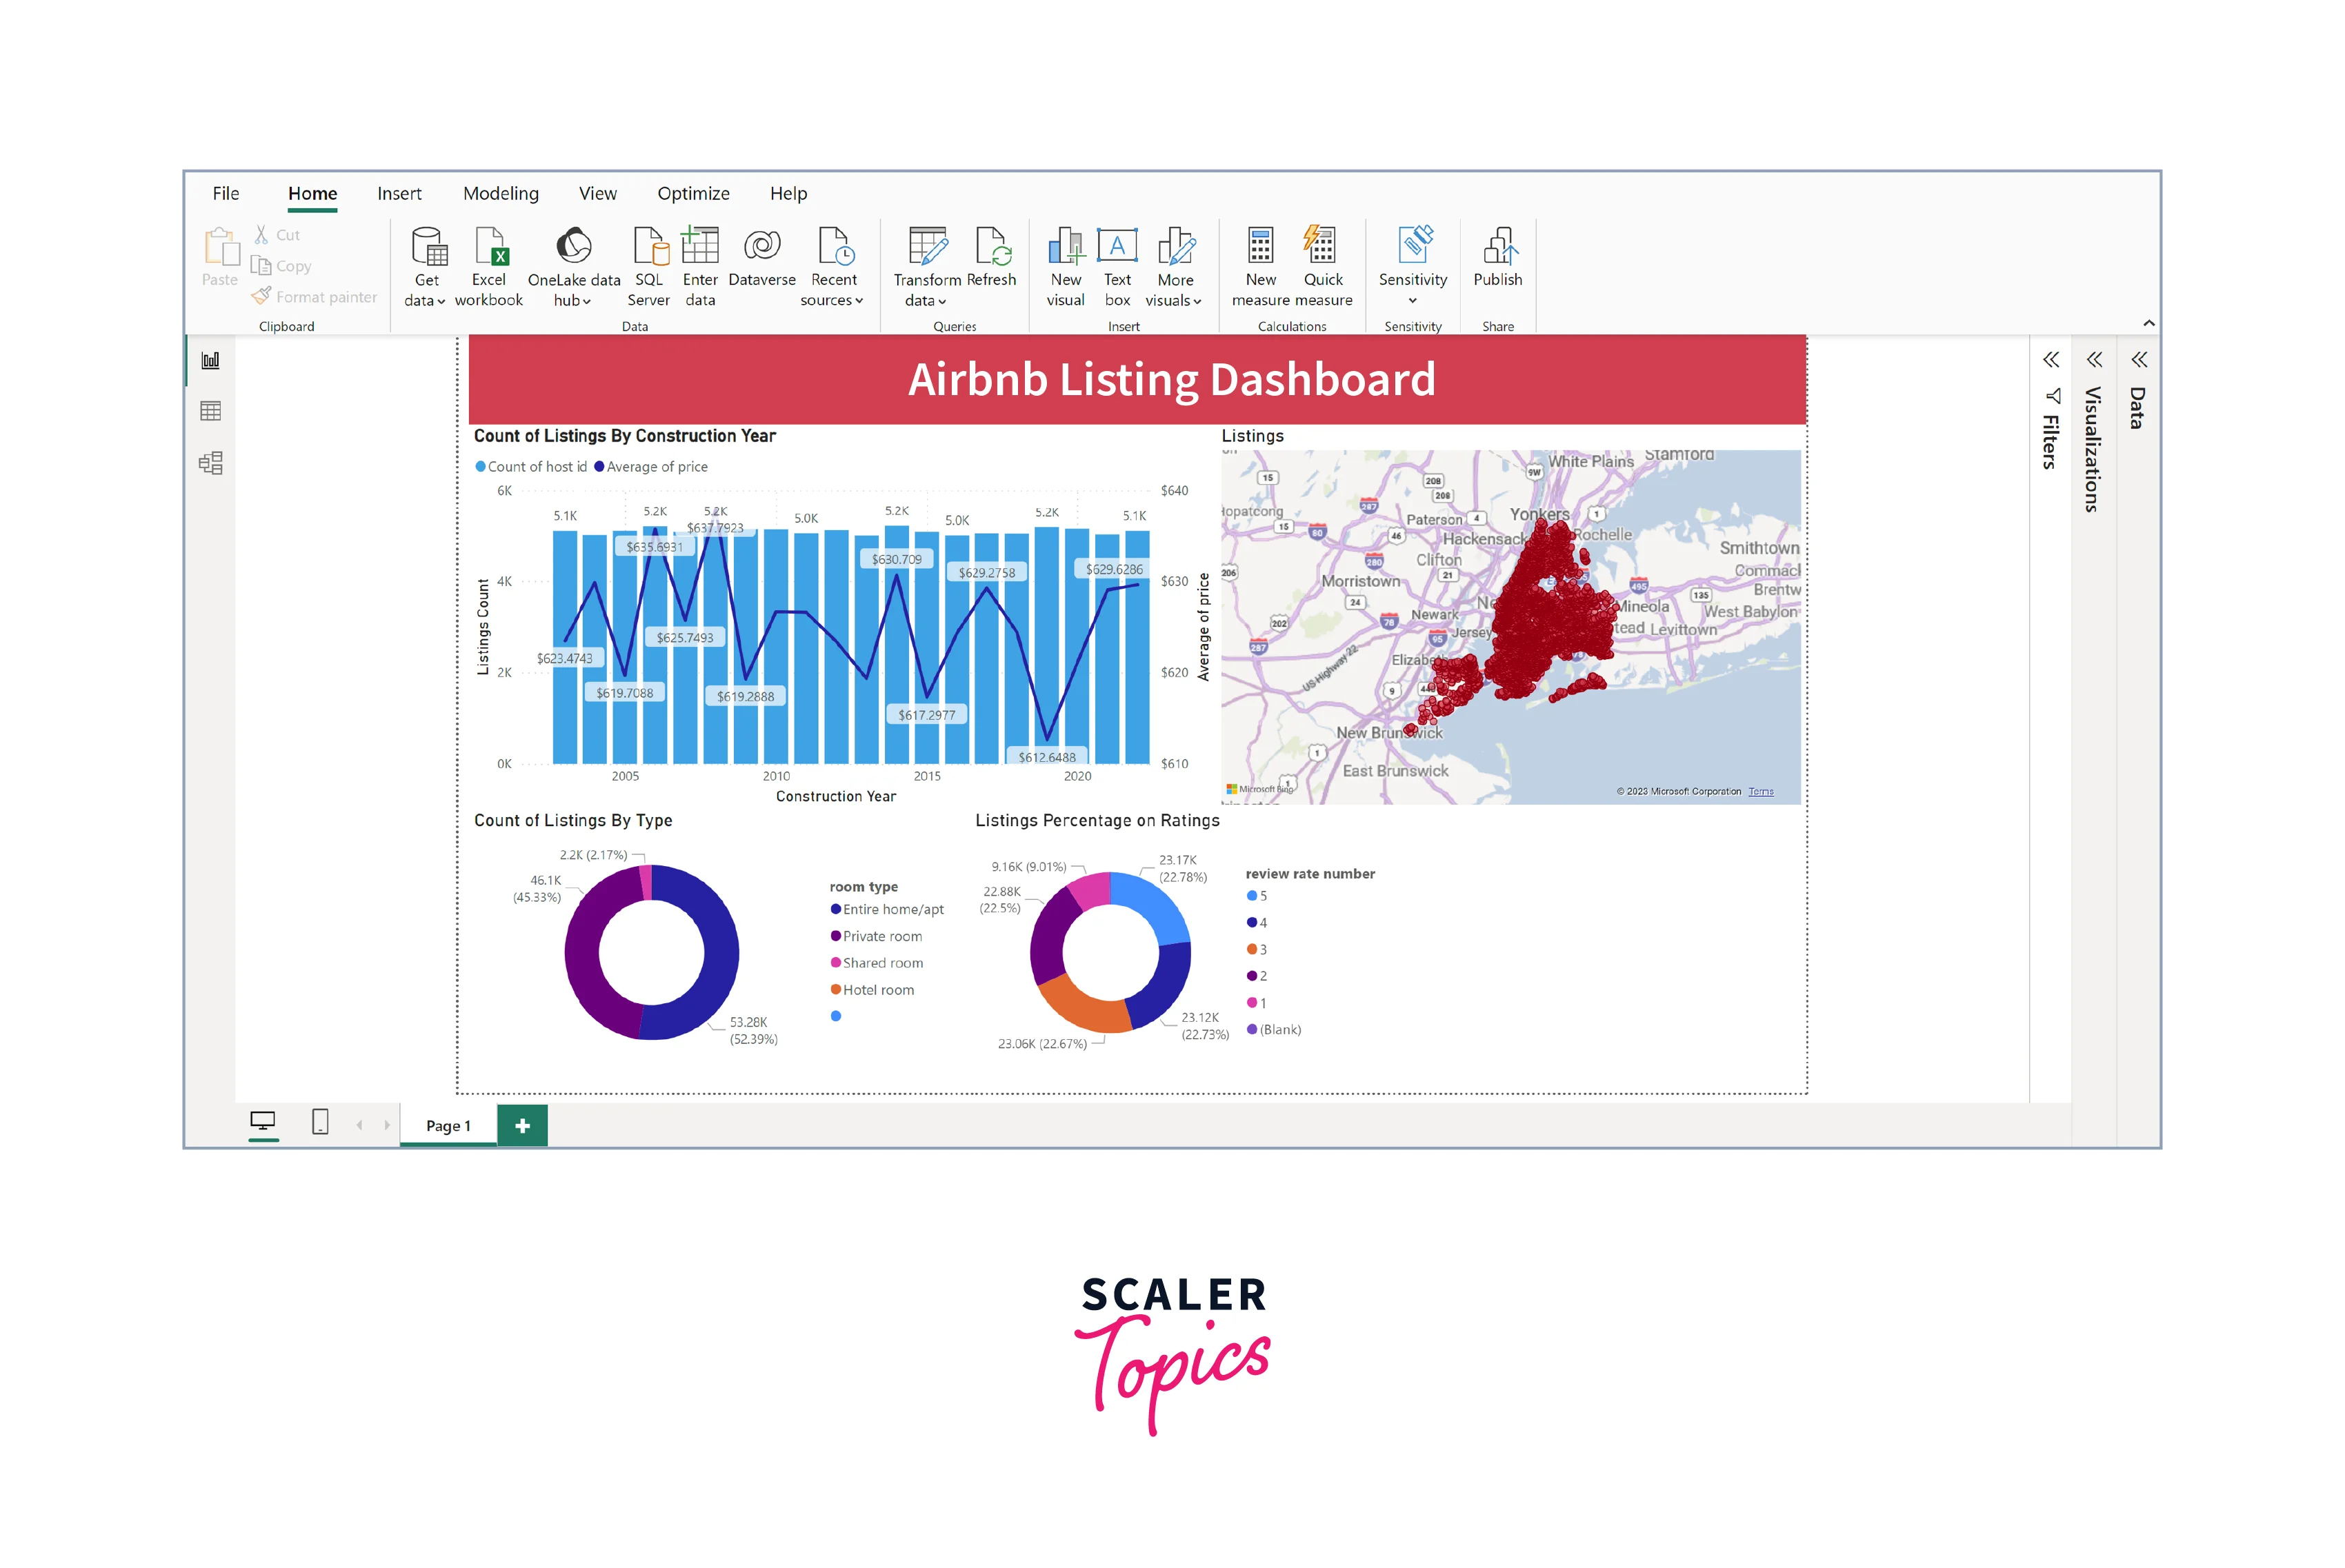
In this enterprise analytics Power BI dashboard, we will focus on the following visualizations -
- Count of Listings and Average Listing Price by Construction Year (Bar and Line Chart) - This visualization helps us understand how the number of Airbnb listings and their average prices depend on their construction years. The bar chart displays the listing count for each construction year, providing insights into the distribution of properties. The line chart, on the other hand, illustrates the trend in average listing prices, allowing us to identify any correlations between construction year and pricing trends. This can be valuable for pricing strategies and understanding property demand over different years.
- Distribution of Listings by Type (Pie Chart) - The pie chart showcasing the distribution of listings by type (e.g., entire home, apartment, private room, shared room) offers a quick overview of the variety of accommodations available on Airbnb. It helps both hosts and users understand the market landscape and preferences, aiding in targeted marketing efforts and customer selection.
- Distribution of Listings by Ratings (Pie Chart) - This pie chart provides a visual breakdown of Airbnb listings by their ratings. It allows users to gauge guests' overall satisfaction and assess the popularity of listings based on positive ratings. Understanding the distribution of ratings can guide hosts in improving their offerings and give potential guests confidence in their choices.
- Listings on the Map - This map visualization is a powerful tool to display the geographic distribution of listings. It offers an intuitive way to explore the location of properties, helping users make informed decisions based on factors like proximity to landmarks or desired neighborhoods. For hosts, it can be instrumental in identifying trends in property hotspots and targeting specific areas for investment or marketing efforts.
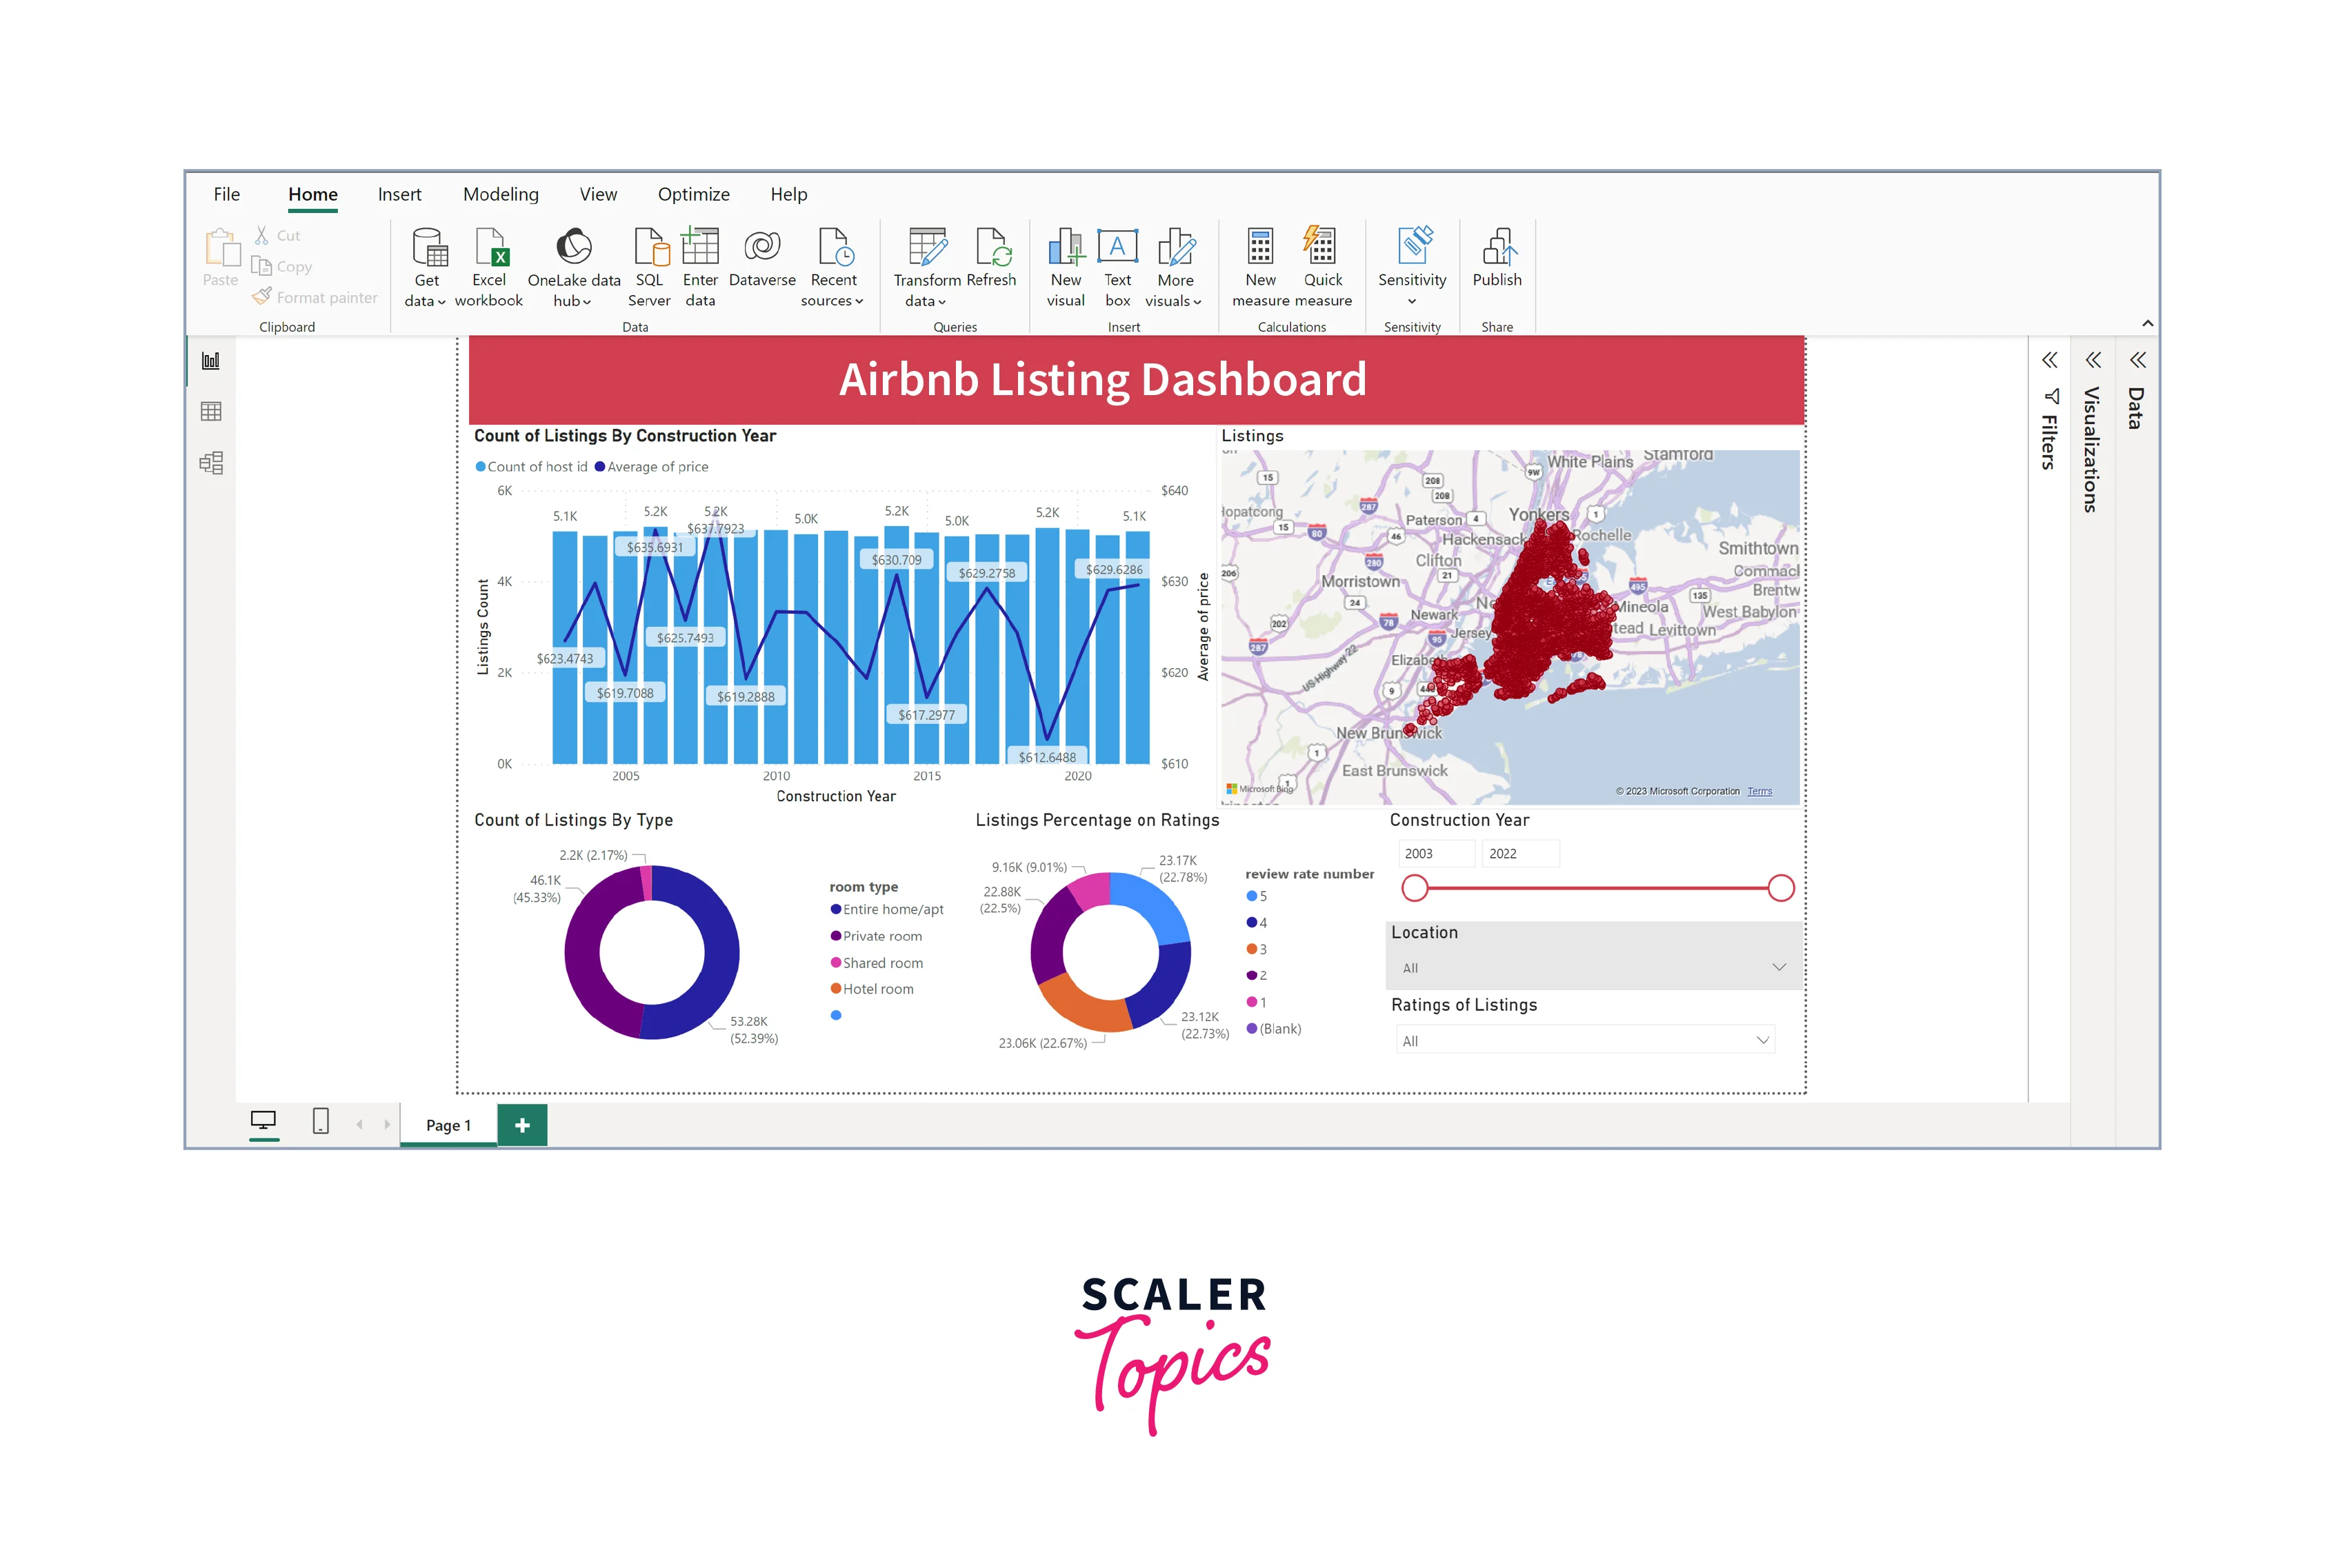
In addition to the visualizations mentioned earlier, including slicers for selecting or filtering on construction year, ratings, and location is a pivotal step in enhancing user interactivity and exploration within your Power BI marketing dashboard. Here's why each slicer is significant -
- Construction Year Slicer - This slicer allows users to filter listings based on the construction year of properties. It's useful for users interested in historical trends or those looking for newer or older accommodations. For hosts, it aids in identifying the impact of the construction year on pricing and occupancy rates, helping them make informed decisions about property renovations or investments.
- Ratings Slicer - The ratings slicer empowers users to filter listings based on guest ratings, enabling them to choose accommodations that meet their quality expectations. For hosts, it provides insights into the importance of maintaining high ratings and tailoring their services to match guest preferences.
- Location Slicer - The location slicer is instrumental in narrowing down listings by geographic area or neighborhood. It helps users find properties in specific regions or near desired landmarks, enhancing the booking experience. For hosts, it assists in identifying competitive advantages of their property's location and tailoring marketing efforts accordingly.
Dashboard Reporting
Publishing and sharing the dashboard is important, allowing stakeholders to access insights and collaborate seamlessly. Here's how to do it -
- Click "Publish" in Power BI Desktop.
- Choose Power BI Service workspace for report publishing.
- In Power BI Service, open the report, click "Share," and specify the email addresses of recipients.
- Set desired permissions (view or edit).
- Recipients will receive an email invitation with an access link to the shared dashboard.
Conclusion
- Enterprise analytics with Power BI enables organizations to make informed decisions based on comprehensive data insights. By analyzing Airbnb data, businesses can refine their strategies, optimize pricing, and target specific customer preferences.
- Creating interactive dashboards with visualizations and slicers empowers users to explore data on their own terms. This user-centric approach enhances engagement and enables stakeholders to extract the most relevant information for their needs.
- Analyzing Airbnb data provides valuable market insights. Enterprises can identify trends in property construction years, popular listing types, and high-demand areas. This information can guide investment decisions and marketing strategies.