Bookmarks in Power BI
Overview
In the world of data visualization and business intelligence, Power BI has emerged as a powerful tool, enabling users to create interactive and dynamic reports. Among its many features, Bookmarks in Power BI stands out as a valuable feature, allowing users to capture and revisit specific views of their data. In this article, we will delve into the concept of Bookmarks in Power BI, exploring how they can be utilized in various ways, their creation, and management.
What is a Bookmark?
In Power BI, a Bookmark is a saved state of a report or dashboard page, capturing specific configurations such as filters, slicers, visuals, and their respective data view. It allows users to create, save, and revisit custom views of their reports or dashboards, facilitating seamless navigation between different report states. Bookmarks essentially act as shortcuts that enable users to focus on particular insights or compare various data scenarios without having to recreate the desired view from scratch.
For instance, consider a Power BI sales report for XYZ Electronics. The user can create a Bookmark named "Q1 Sales," capturing a custom view showing sales data for January to March, a specific region, and top-selling products. The user can instantly revisit the saved report state by clicking on the "Q1 Sales" Bookmark later without manually reapplying filters and sorting.
Why Data Option Matters?
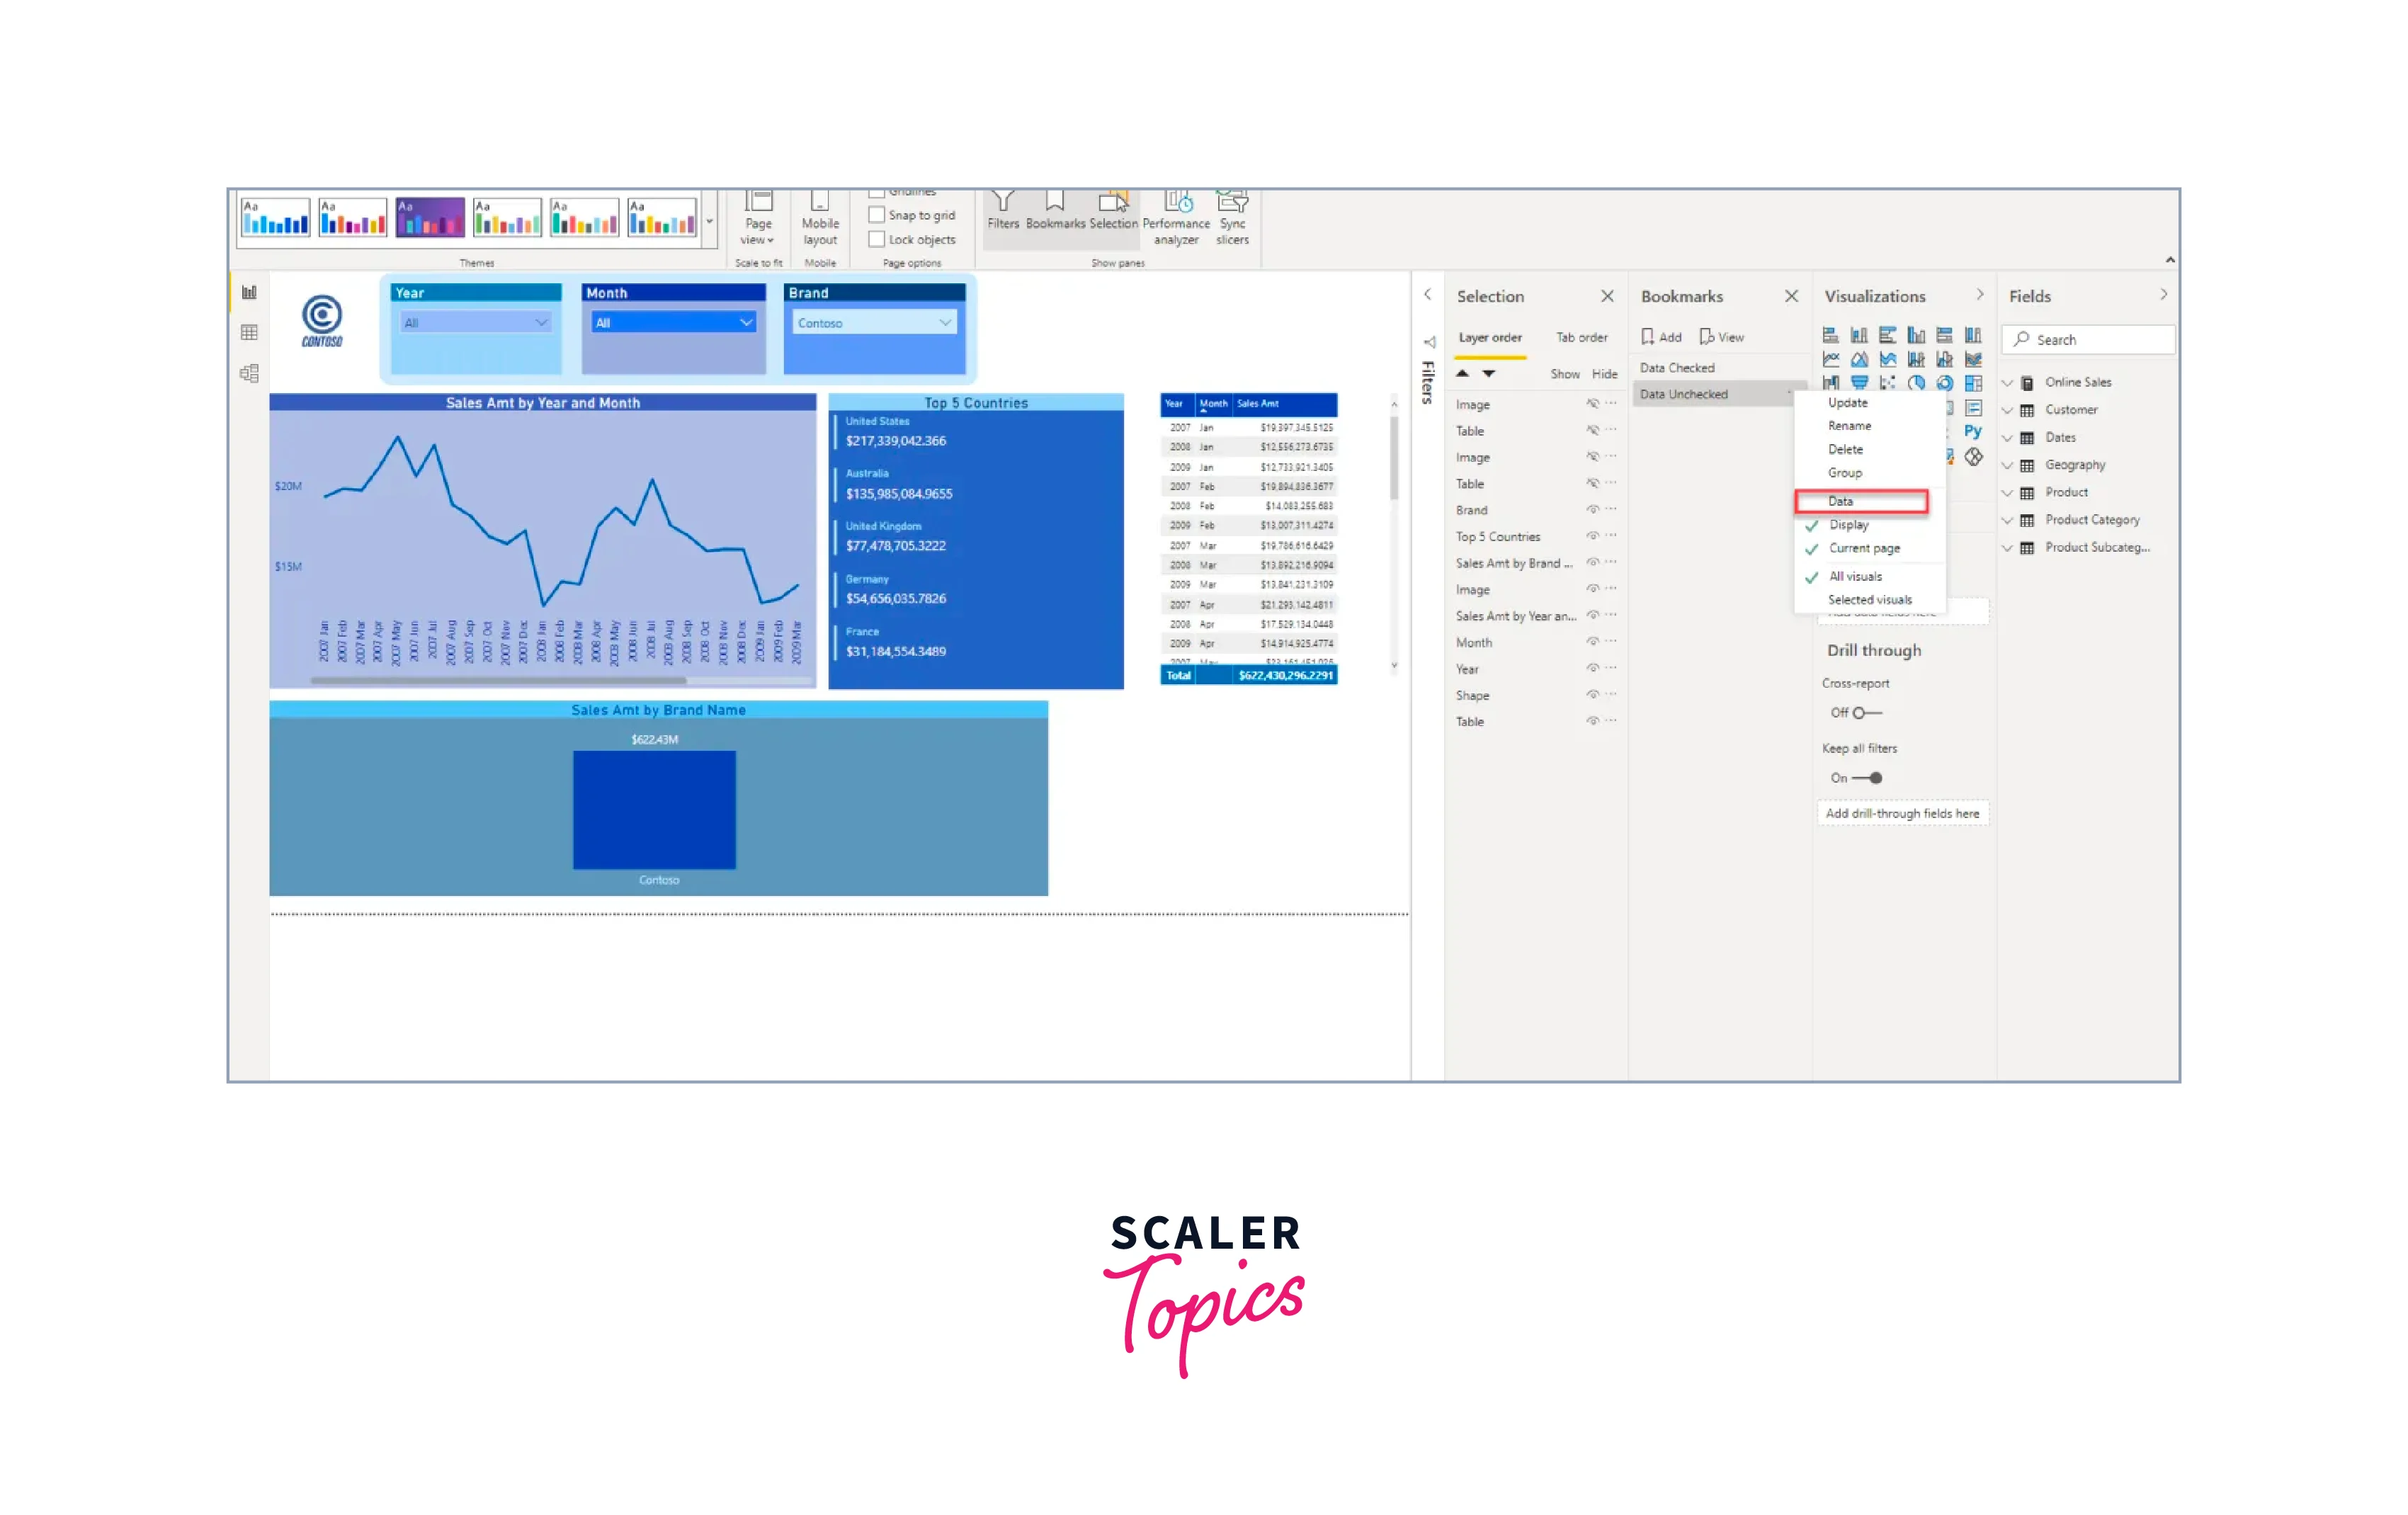
Data options in bookmarks matter significantly because they give users control over how data changes are handled when navigating through different report states. When creating a bookmark in Power BI, the "Data" option can be checked or unchecked, determining whether the bookmark includes data changes or not.
By checking the "Data" option, users ensure that the bookmark will capture and apply data context changes, such as filters and slicers. By default, bookmarks include data, meaning that when a bookmark is created, the selected data values at that particular moment are saved as part of the bookmark's configuration. For instance, if you set the order date slicer to display data for 2022 and then create a bookmark, the bookmark will always return you to that specific period.
In contrast, the data option should be unchecked when you want the bookmark to focus solely on toggling visualizations, changing page navigations, or other display-related adjustments, without altering the slicer selections. By creating a bookmark without data, you can ensure that the current slicer selections remain unaffected when the bookmark is applied, providing more flexibility in your report exploration and visualization experience.
Some Of The Ways One Can Utilize The Power Bi Bookmarks Feature
Here are some of the ways you can leverage the power of bookmarks in Power BI while working on your data analysis project -
- Navigation Menus - Employing bookmarks, you can create interactive navigation menus within your report. By setting up bookmarks for different sections or views of your report and using buttons or hyperlinks to apply them, users can seamlessly navigate between key insights and focus areas, enhancing the user experience and data exploration process.
- Filter Resets - Bookmarks enable the creation of reset buttons that users can click to restore specific visuals or the entire report to its default state. This feature is particularly useful when users want to clear filters or slicers quickly, providing a convenient way to reset and start a new analysis without leaving the report.
- Visual and Context Swapping - Bookmarks allow for dynamic visualization swaps, enabling users to compare different types of visuals on the same report page. You can create bookmarks for alternate visual representations (e.g., bar chart, pie chart, table) of the same data, facilitating easy comparison and helping users gain deeper insights into their data.
- Page Overlays - Using bookmarks, you can create overlays to present additional information or insights without switching to a different report page. For example, you can use bookmarks to show explanatory text, highlight data trends, or provide contextual information, allowing users to access relevant details right where needed.
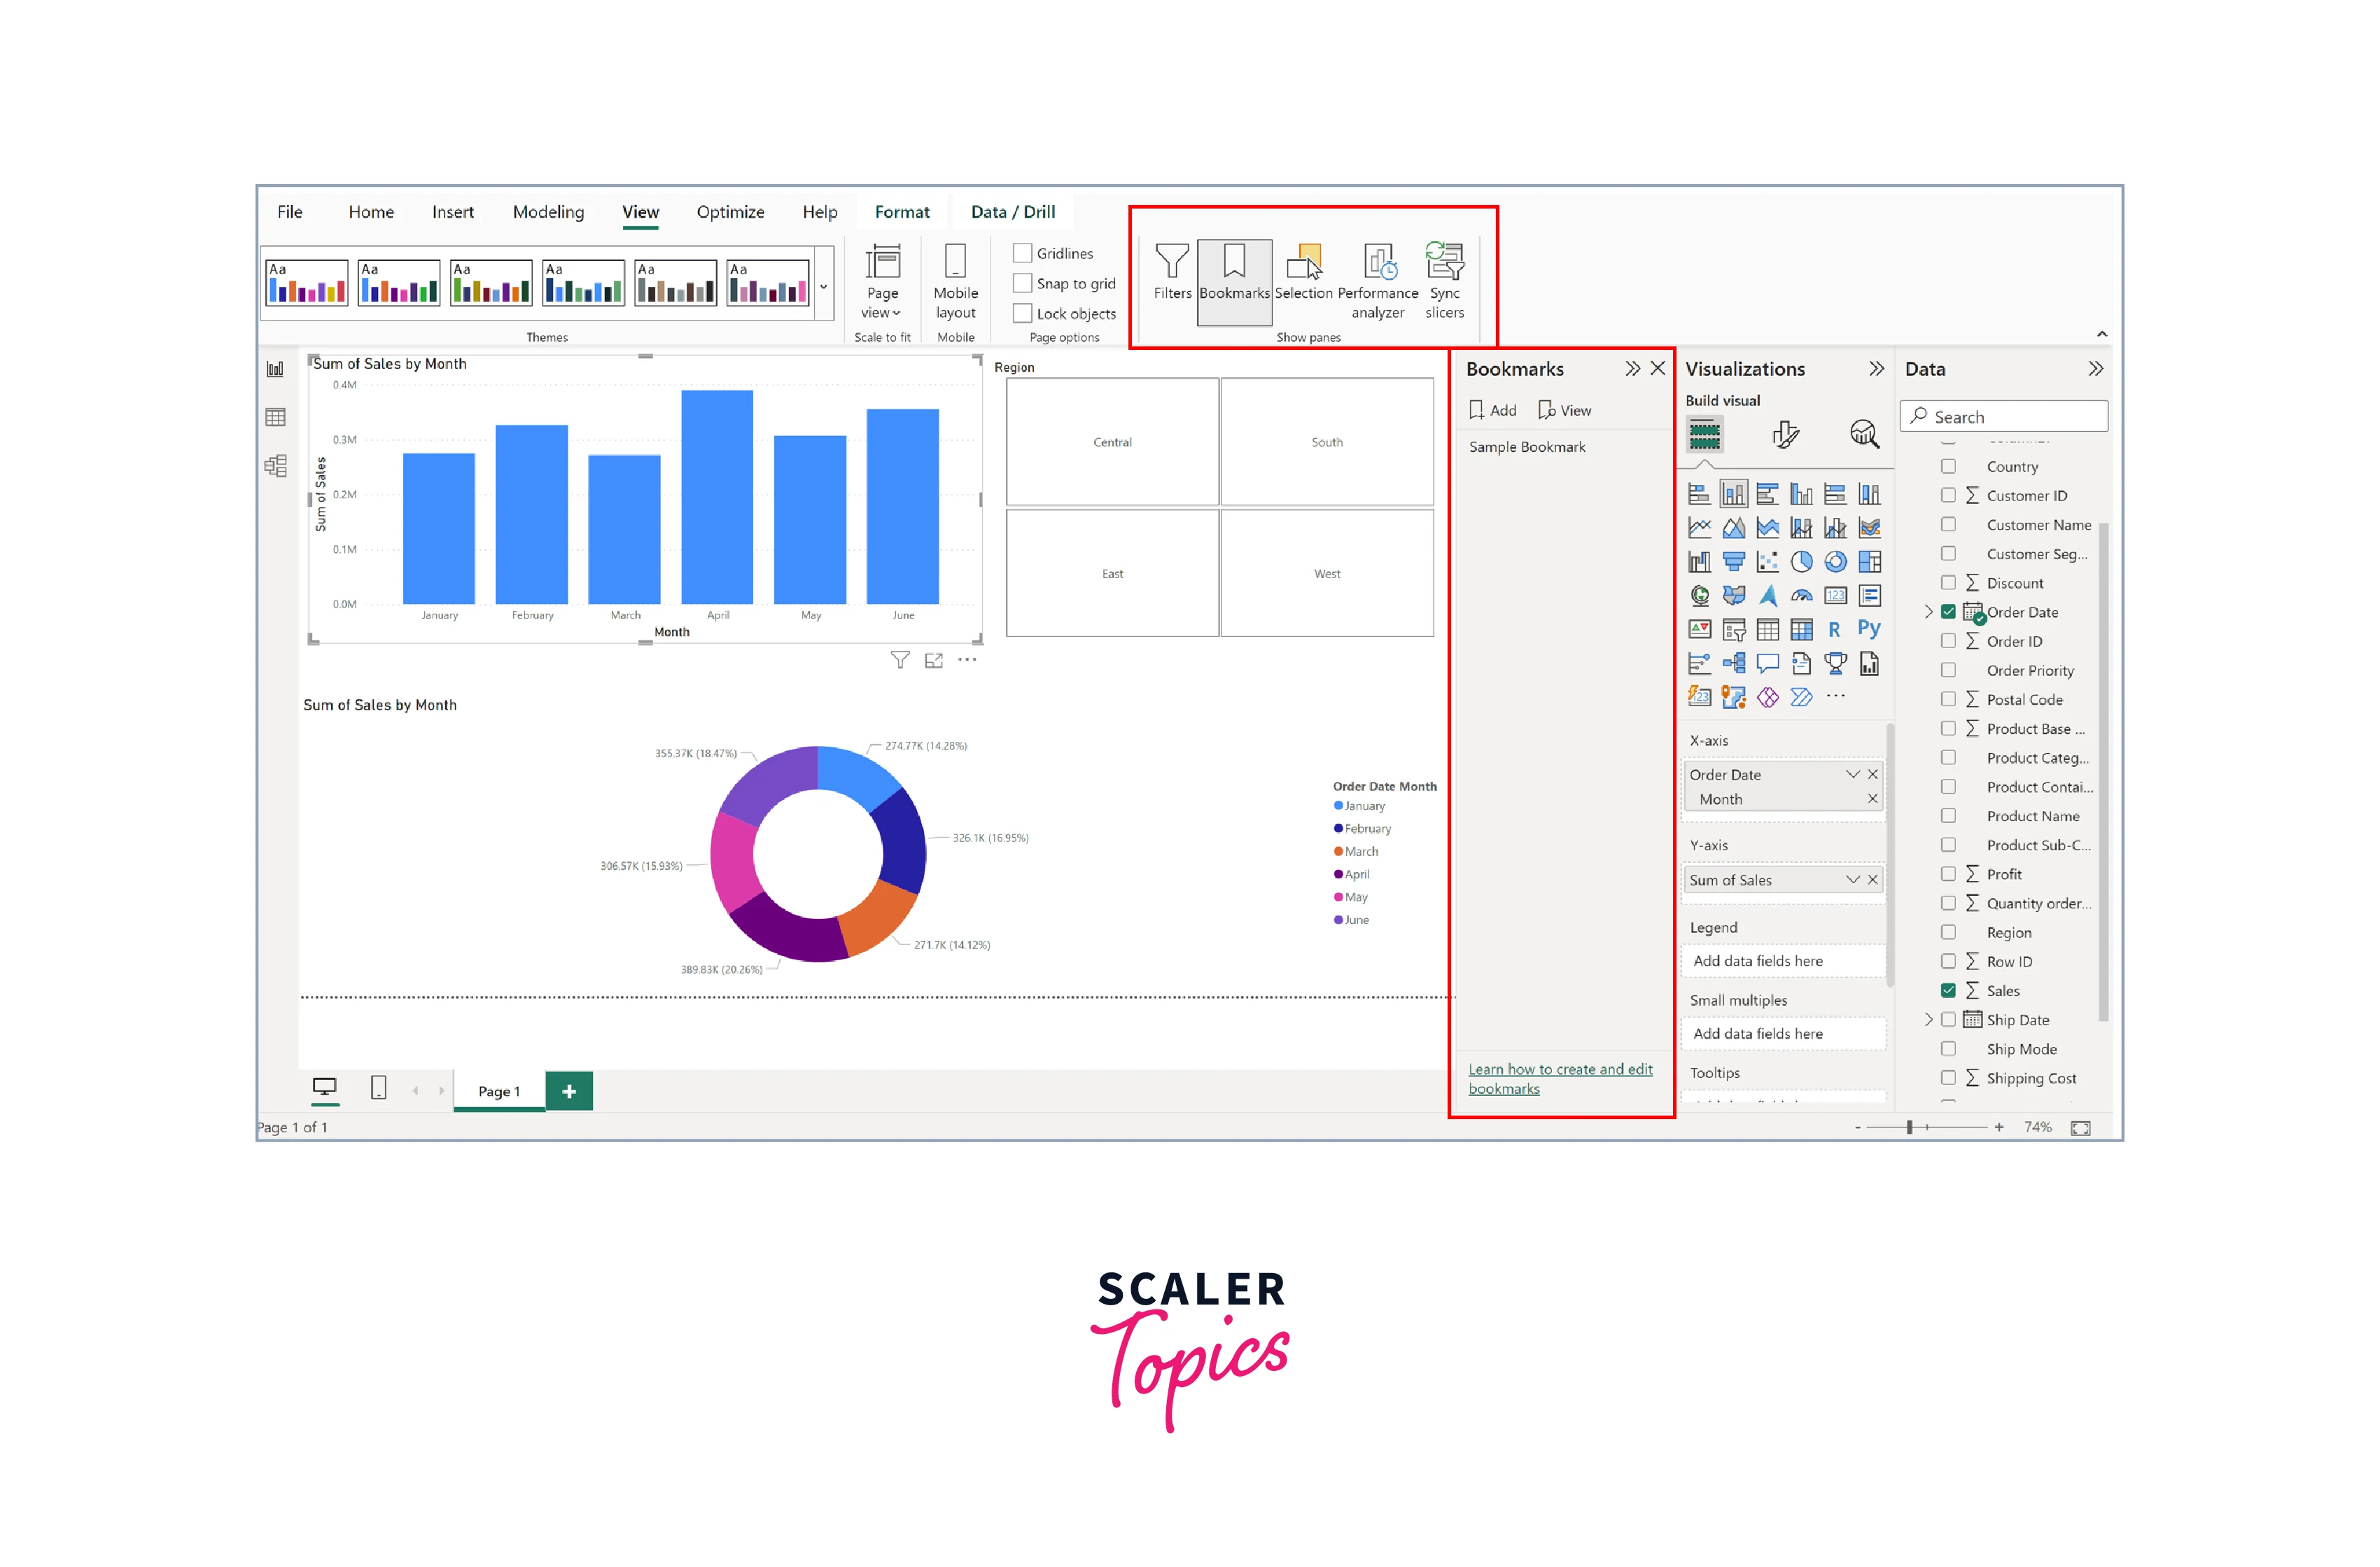
Creating a Bookmark
Creating a Bookmark in Power BI is a straightforward process that empowers users to save specific report states for easy access and analysis. To create a bookmark, simply navigate to the "View" tab on the Power BI ribbon and click on the "Bookmarks" pane to reveal the bookmark options. Arrange the report page as desired, including filters, slicers, visuals, and other configurations, and then click the "Add" button in the Bookmarks pane to save the current state as a bookmark. Give the bookmark a descriptive name to make it easily identifiable, and it will be ready for use.
Modifying a Bookmark
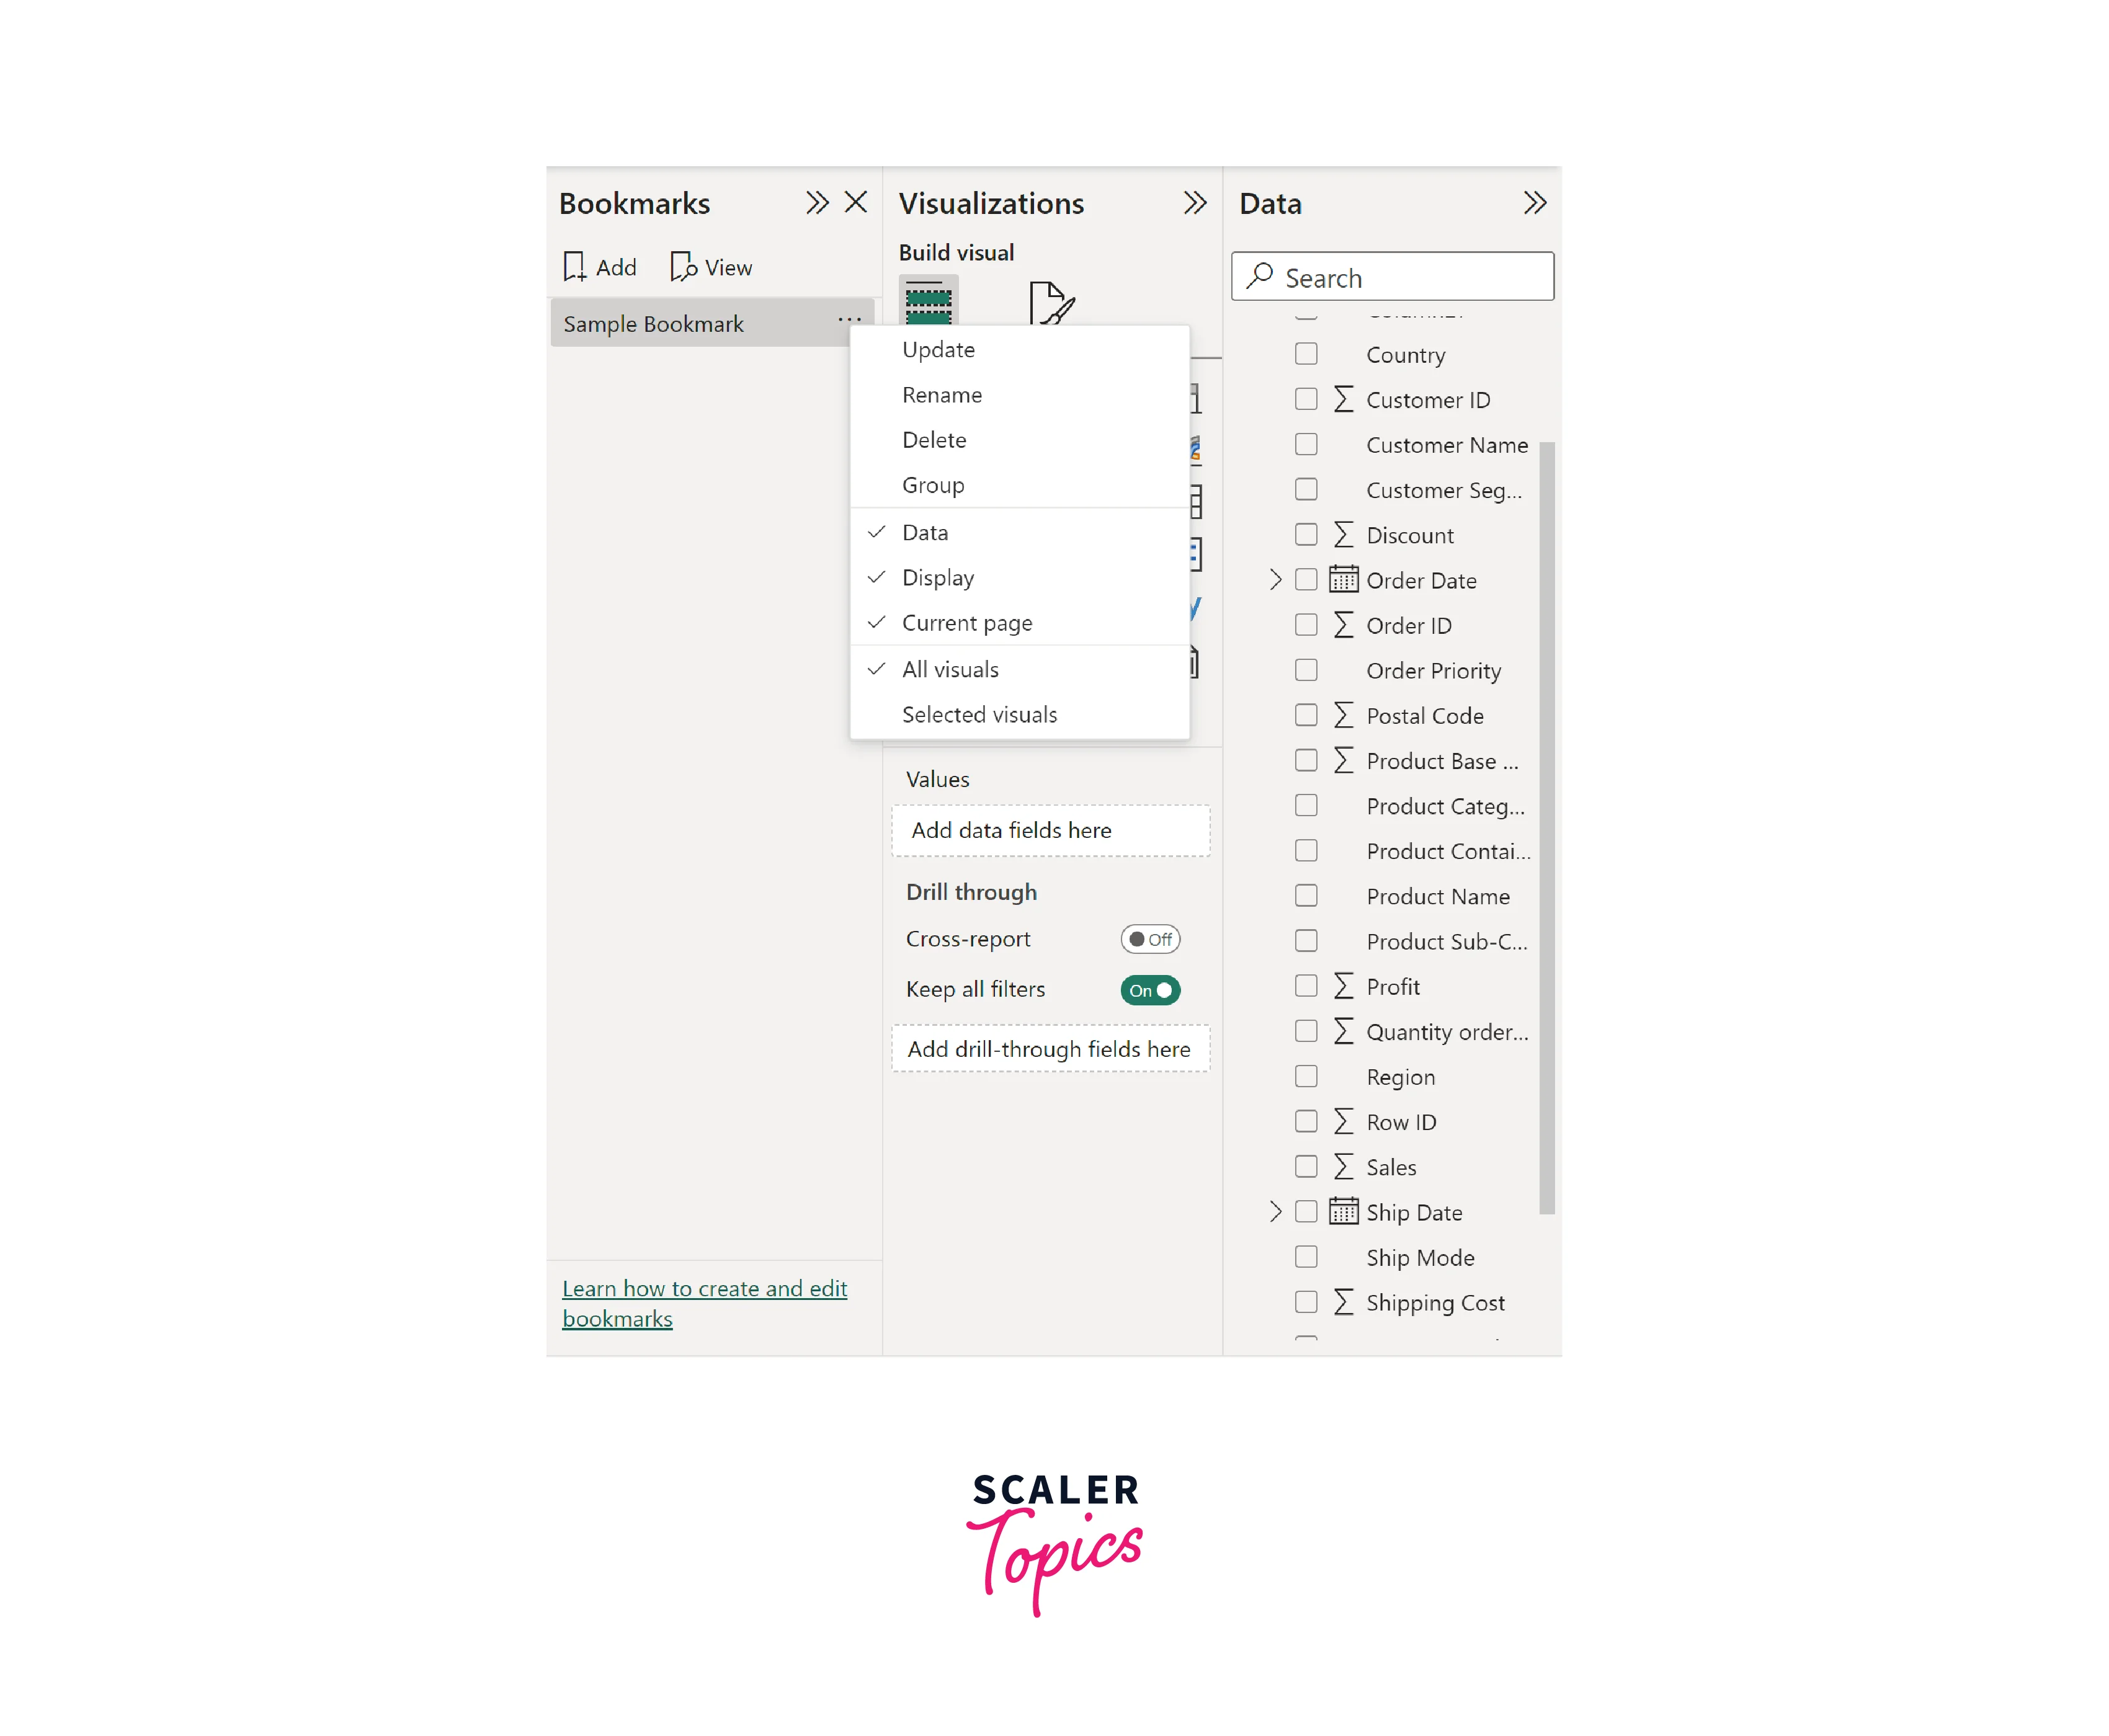
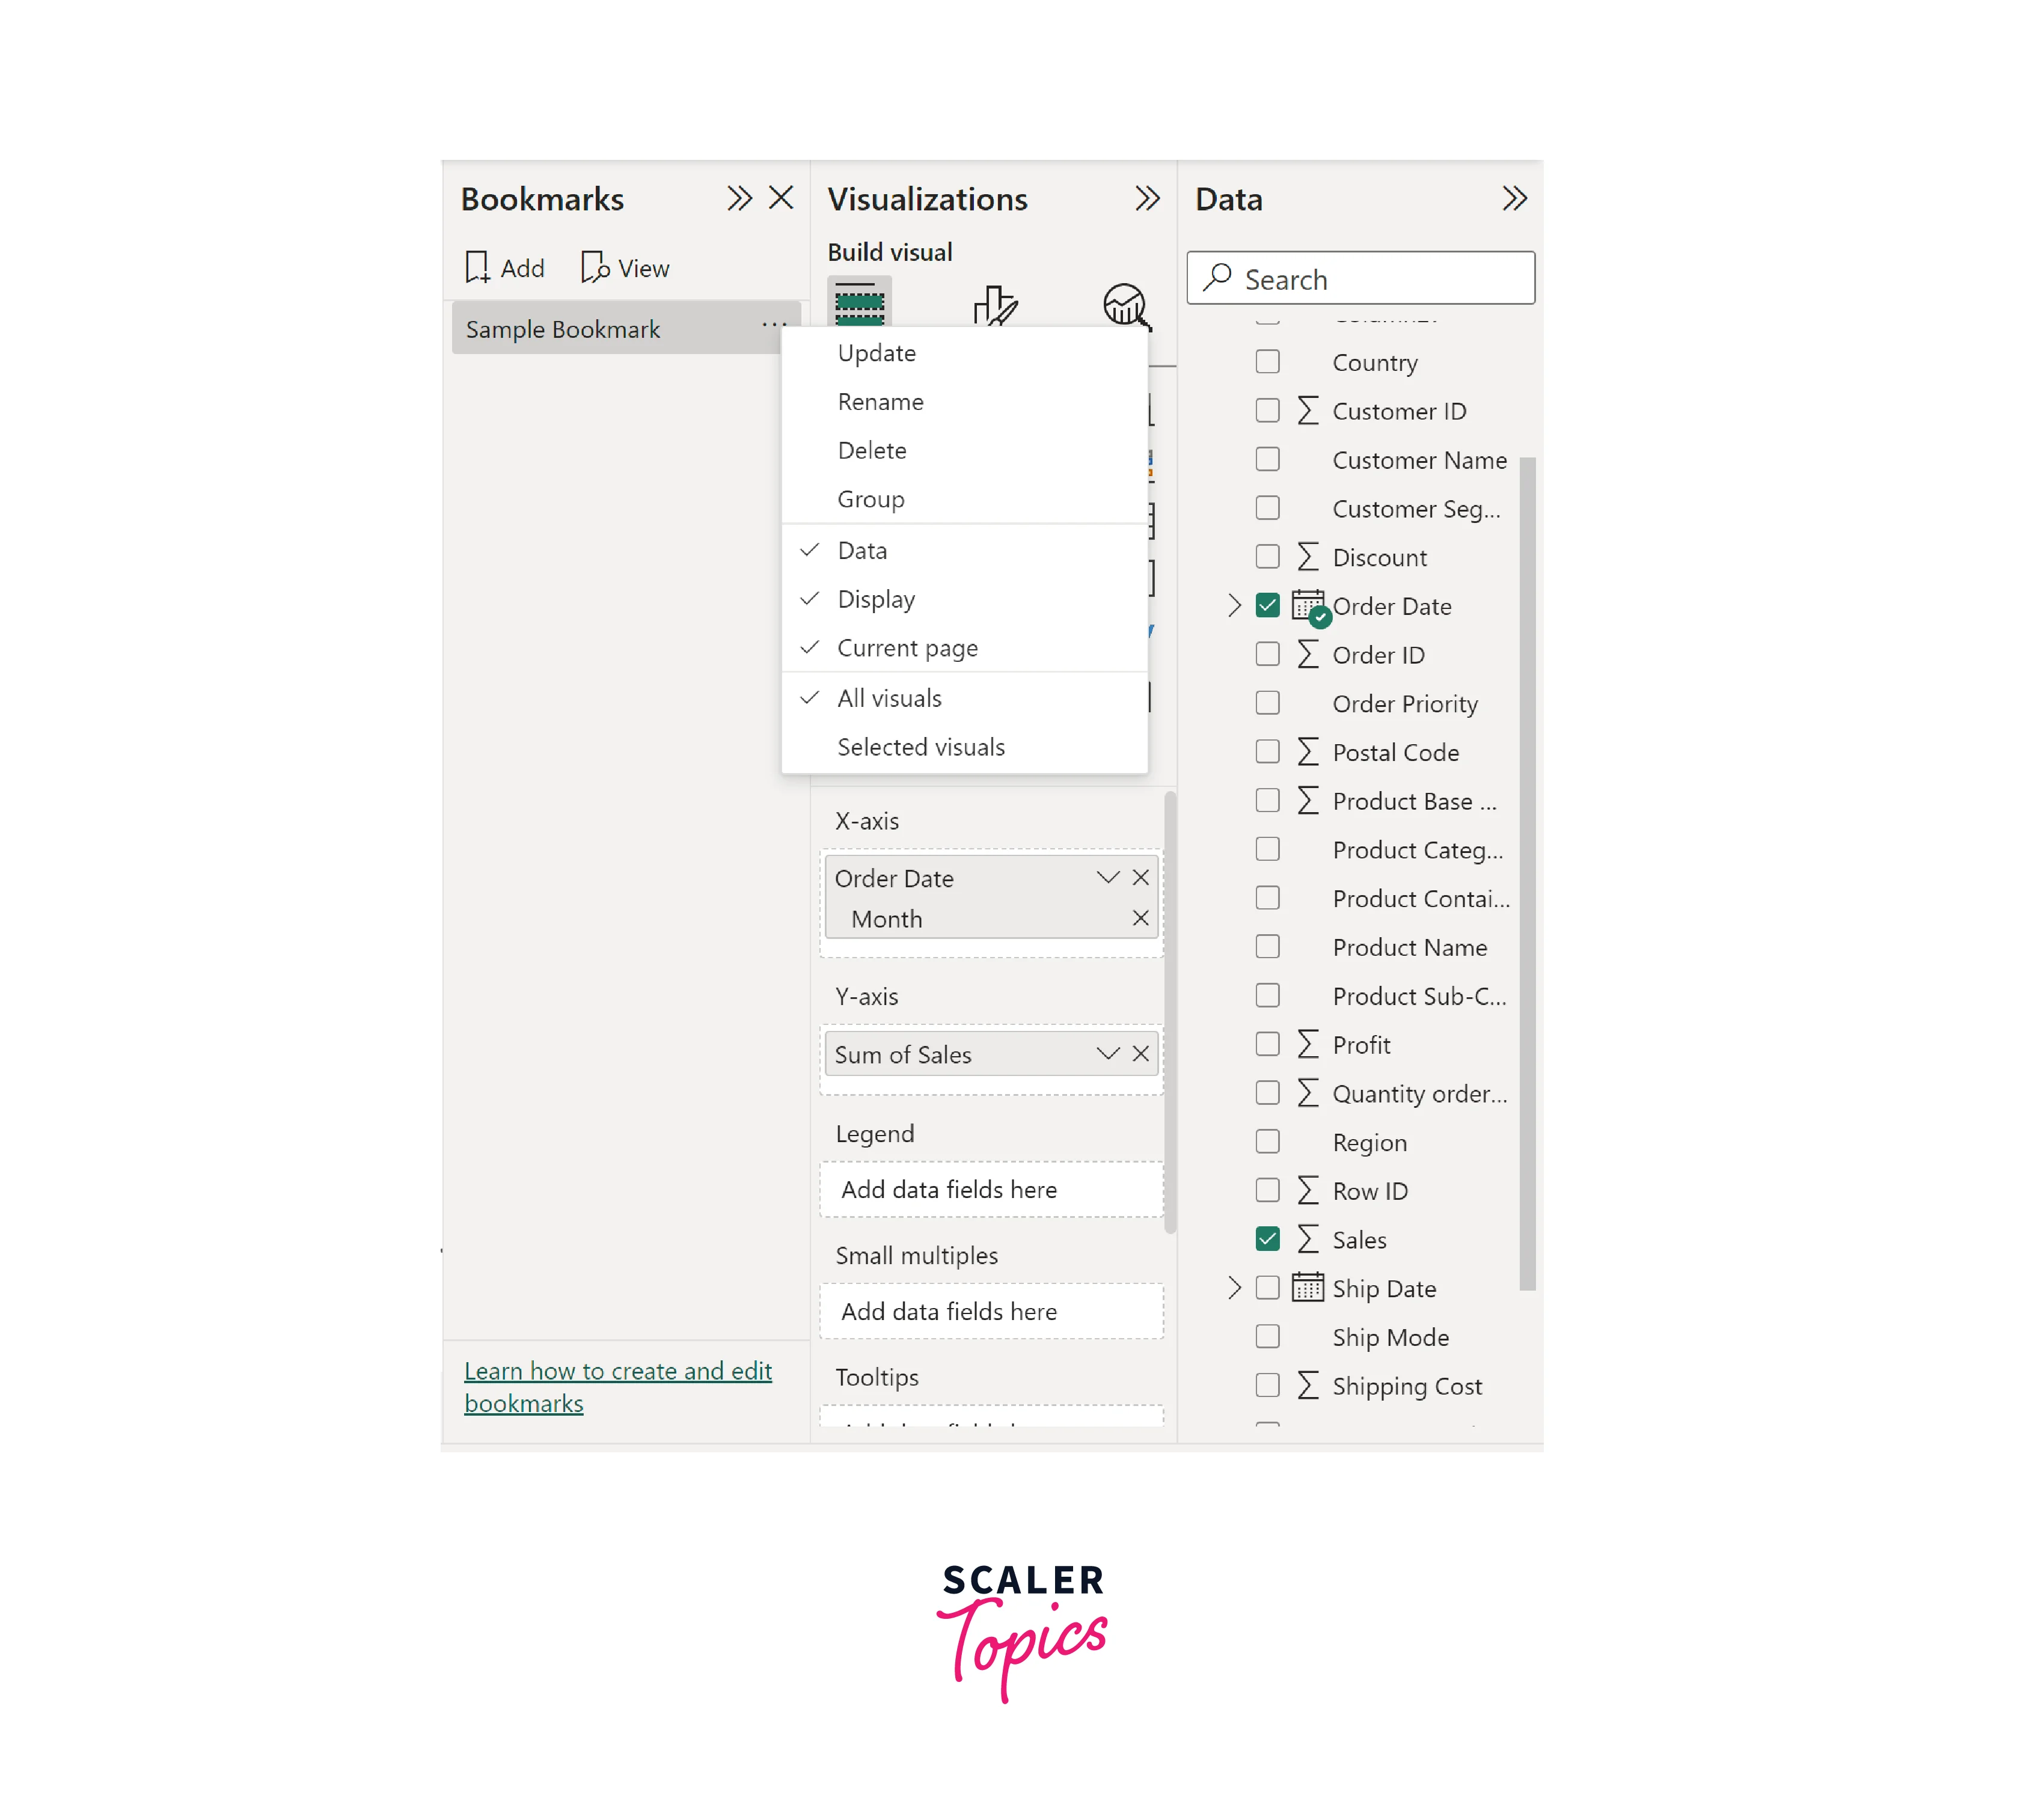
Modifying a Bookmark in Power BI offers flexibility and customization options for enhancing the bookmark's behavior. Right-clicking on a bookmark provides a context menu with various modification choices -
- Update - Overwrites the bookmark's saved state with the currently selected page configuration, making it useful for updating visuals or adding new elements to the bookmark.
- Rename - Allows users to rename the bookmark, promoting better organization and preventing confusion when dealing with multiple bookmarks.
- Delete - Deletes the bookmark, although this option is rarely needed due to the ability to update bookmarks and can be undone if necessary.
- Group - Enables users to group bookmarks together for a better organization based on common themes or related pages.
The middle section of options changes the bookmark's actual behavior and is applied by default during creation -
- Data - Applies data properties like filters and slicers to the bookmark, ensuring the selected data context is maintained whenever the bookmark is activated.
- Display - Determines whether the bookmark carries over visual properties, preserving the visual appearance and spotlighted elements when the bookmark was created.
- Current Page - By default, the current page is selected, meaning the bookmark takes the user back to the page where the bookmark was set. Without this option, the bookmark still applies changes to its page, but no page navigation occurs.
The last section allows selecting either "All Visuals" or "Selected Visuals," impacting how visuals are considered within the bookmark -
- All Visuals/Selected Visuals - Choosing between these options determines whether the bookmark applies changes to all visuals on the page or only to the visuals selected when the bookmark was created. This influences whether adjustments need to be made on a bookmark or page basis for the visuals contained within the bookmark.
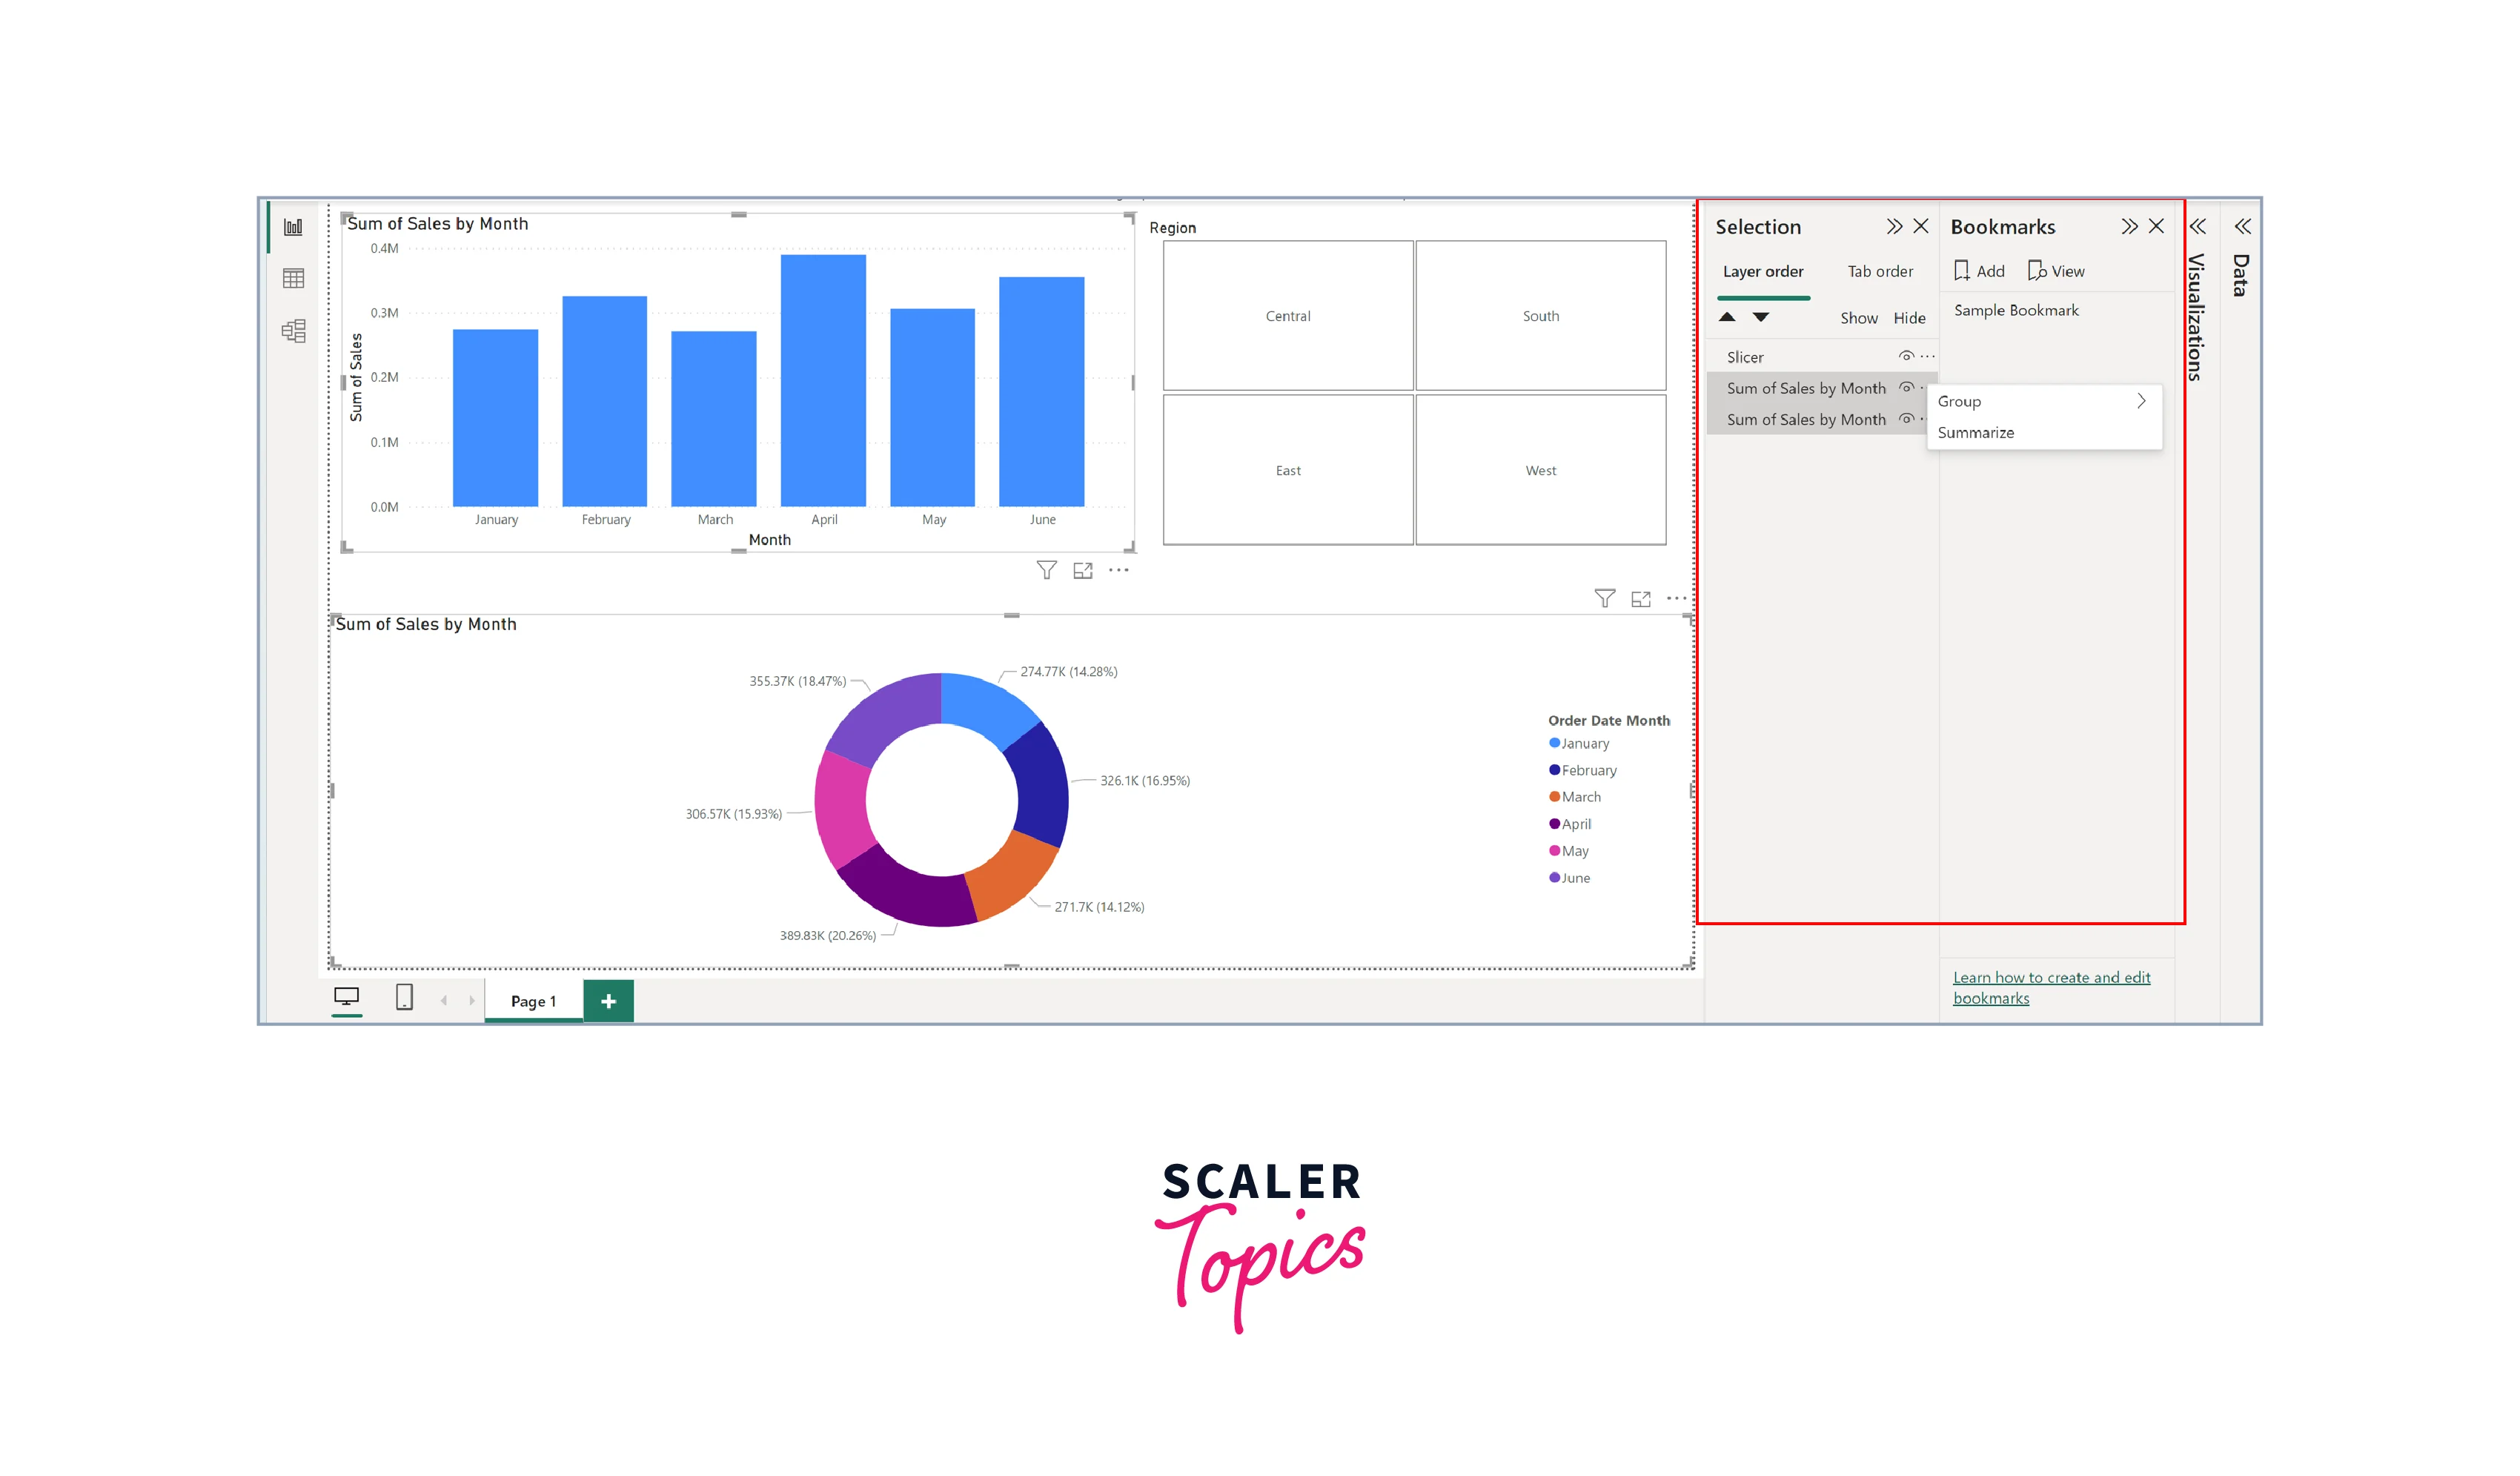
The Selection Pane
The Selection Pane in Power BI serves as a valuable companion to the Bookmark Pane, offering enhanced control over page elements and their organization.
- Hide/Show Visuals - The Selection Pane displays a list of visuals on the page, arranged based on their layering. Users can easily choose to hide or unhide visuals from this list. Hiding a visual preserves its characteristics and position but makes it invisible and unselectable on the page.
- Selection Groups - Grouping visuals in the Selection Pane function similarly to grouping in the Bookmark Pane. Users can conveniently hide or unhide the entire group by grouping visuals together. This organizational capability proves valuable when dealing with multiple bookmarks, as each bookmark can have its own group, simplifying the process of toggling specific visual elements on and off for different scenarios.
Navigation of Bookmarks
You can navigate through bookmarks in Power BI via two primary methods, as mentioned below -
- Power BI Bookmarks Pane - The Bookmarks Pane is the simplest and most direct way to interact with bookmarks. By clicking on a bookmark in this section, it will activate the selected bookmark's saved state. For instance, bookmarks can be saved for different date tracking in sales reports, such as Year-to-Date (YTD) or the entire sales period, enabling easy switching between various data perspectives.
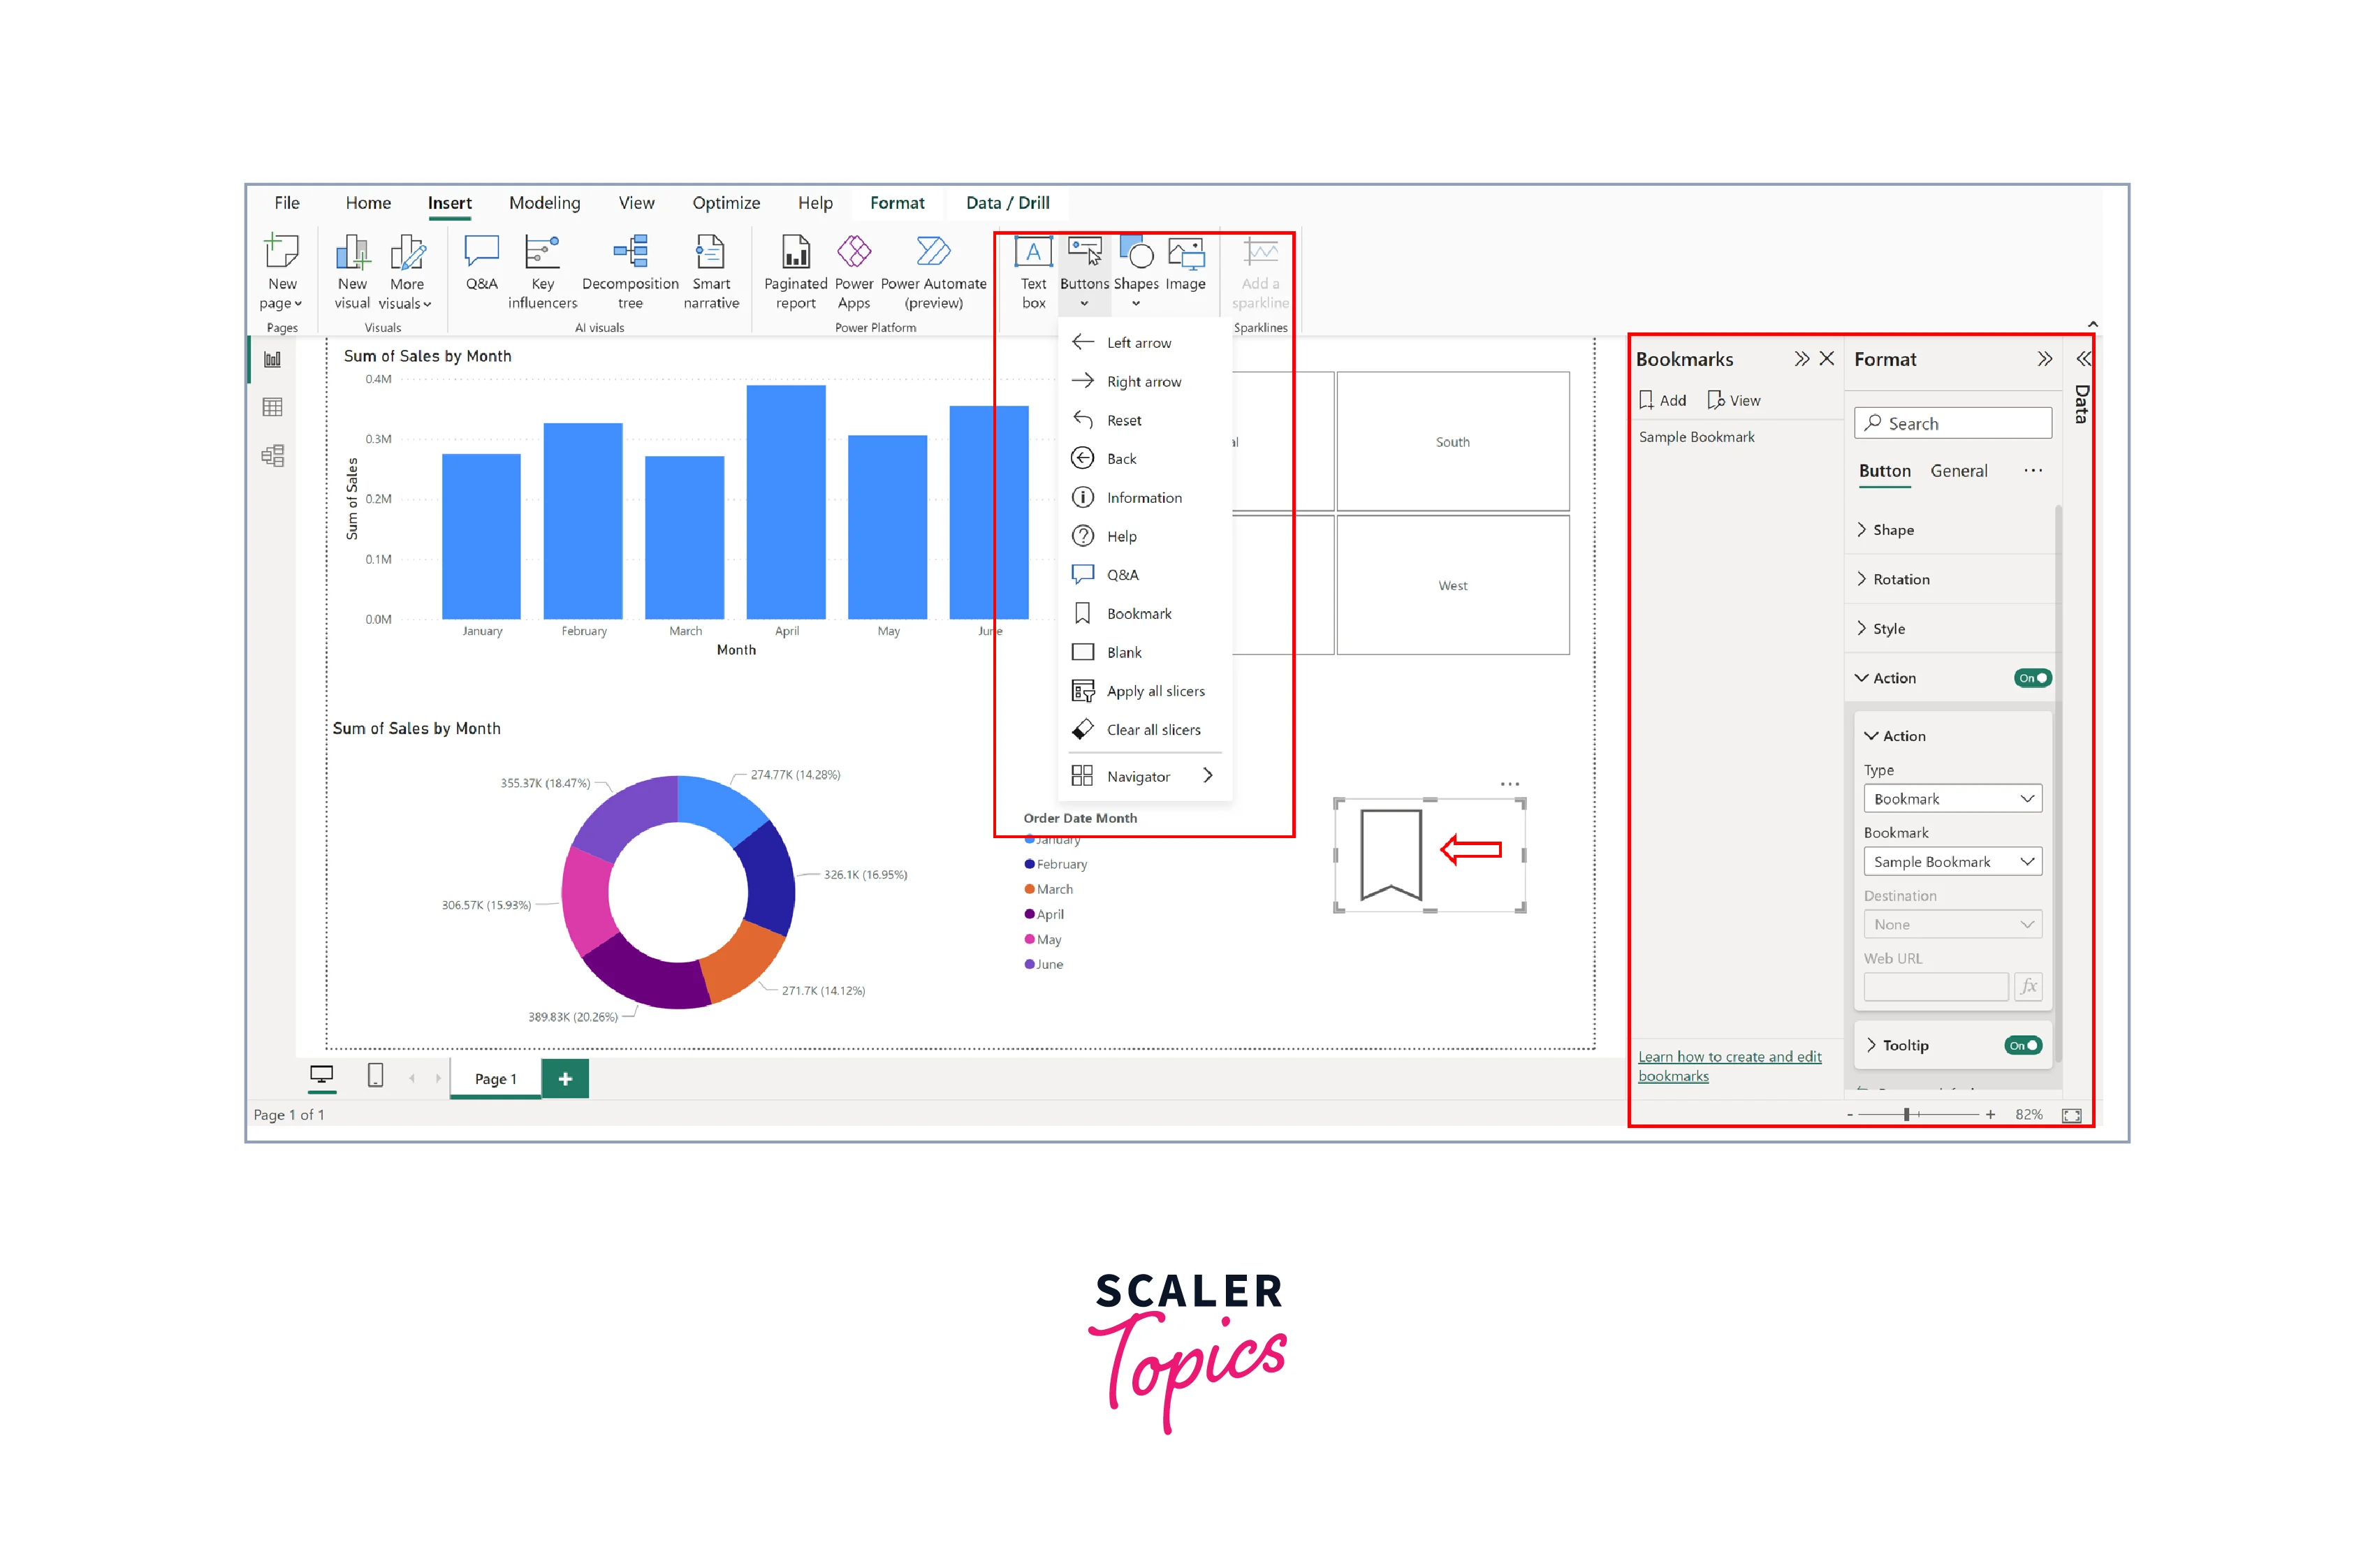
- Buttons - When creating reports for end-users or read-only purposes, bookmark buttons become essential for bookmark interaction. These buttons serve as triggers to activate specific bookmarks, allowing users to access different report states easily. To connect a button to a bookmark, the process is similar to any other action within Power BI. In the formatting options for the button, users can select the desired bookmark to link, as shown in the below figure.
Limitations
Bookmarks in Power BI also have certain limitations, which are outlined as follows -
- Managing Complexity - As the number of bookmarks increases, managing them can become cumbersome, leading to potential unintended interactions and complexities, especially when multiple bookmarks are applied on the same page.
- Manual Updates - When new visuals or changes are made to the report page, previously created bookmarks may need manual modification and updating to ensure they still work as intended. This can be time-consuming, especially when dealing with numerous bookmarks.
- Limited Object Characteristics - Bookmarks cannot change the characteristics of objects such as text, visuals, or buttons. For instance, the size of the text remains fixed between bookmarks, which may require workarounds for achieving specific visual changes.
- Limited To A Single Report - Bookmarks can only be used within a single report and cannot be applied across different reports or workspaces.
- No Bookmark Sharing - Power BI does not have native bookmark-sharing capabilities, so users cannot share bookmarks directly with others.
Conclusion
- Bookmarks in Power BI are a powerful feature that enhances reports' interactivity and storytelling capabilities, allowing users to create, save, and revisit custom data views effortlessly.
- By effectively utilizing bookmarks, users can streamline data exploration, compare various scenarios, and guide their audience through compelling narratives, making reports more engaging and impactful.
- While bookmarks offer numerous advantages, users should be mindful of their limitations, such as managing complexities with multiple bookmarks and the inability to change object characteristics directly.