What are the Key Components of Power BI?
Microsoft Power BI, a formidable business intelligence tool, effortlessly converts diverse data sources into interactive reports and dashboards. Offering swift data connections, versatile visualization, and secure sharing on websites, Power BI is a Gartner-recognized leader in analytics and business intelligence. It empowers organizations with data-driven insights, merging analytics, visualization, and best practices for informed decision-making.
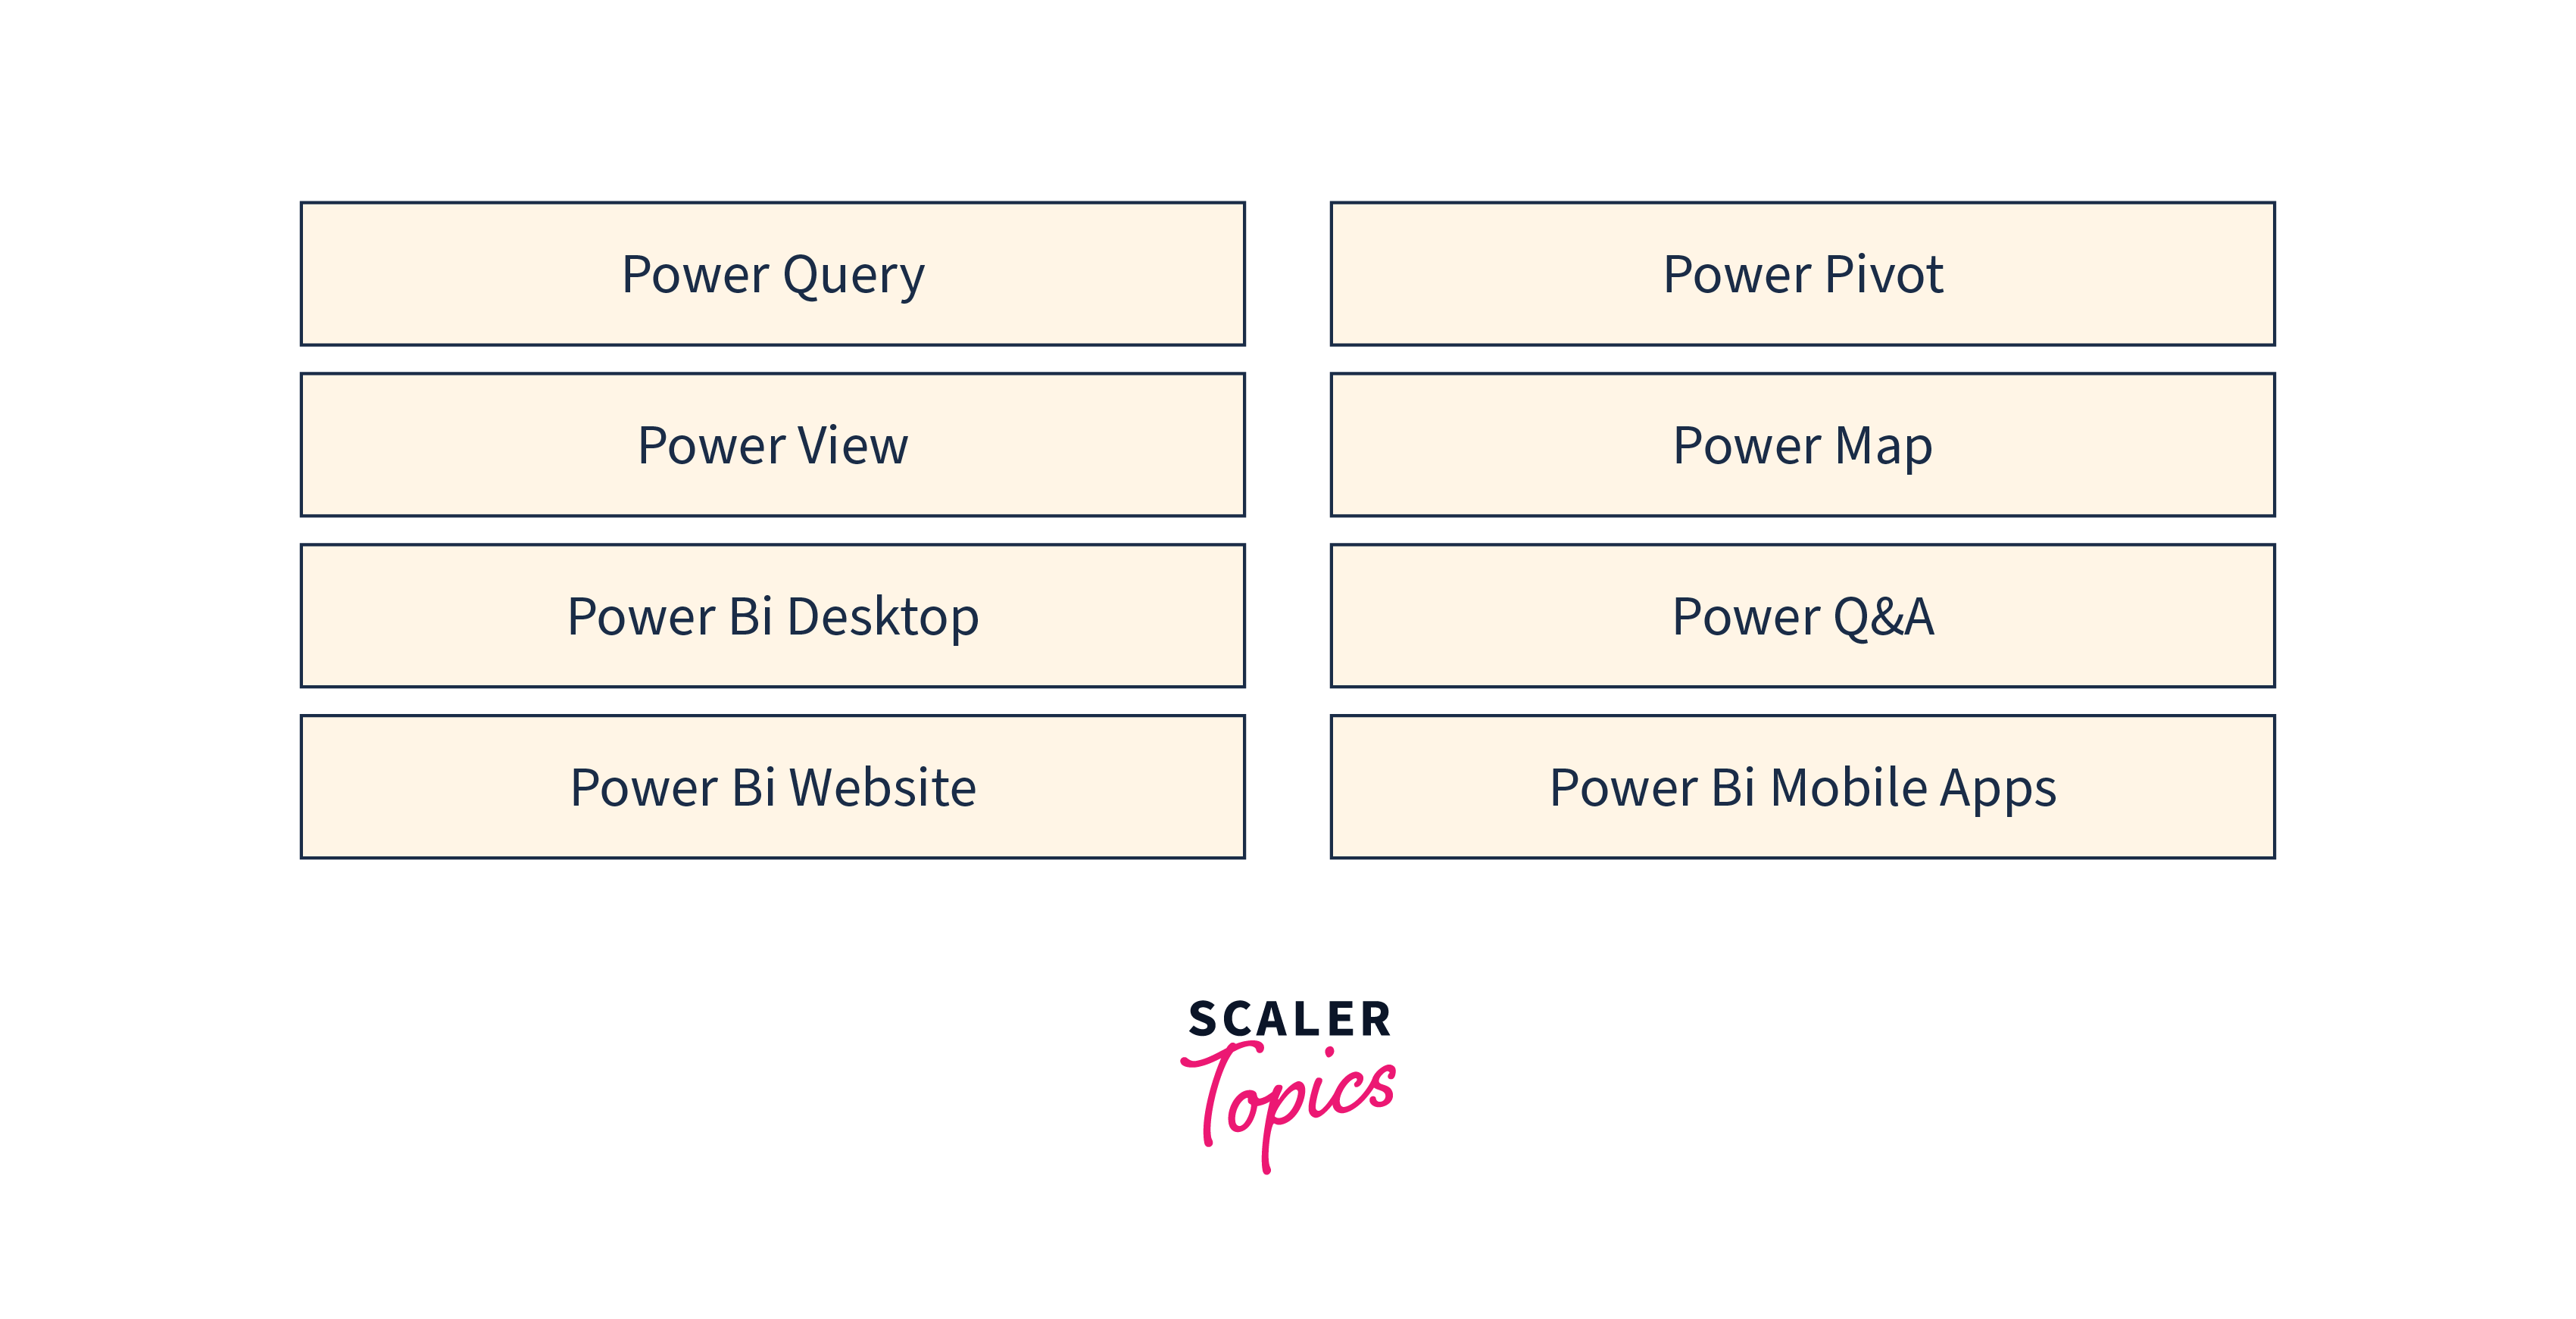
Power BI Components
Here are a few of the major components of Power BI, as mentioned below.
Power Query
- Power Query is a data extraction, preparation, and transformation engine within Power BI. It allows users to connect to different data sources, apply transformations, and shape the data for analysis. It has a graphical interface for extracting data from various sources and a Power Query Editor for applying transformations.
- Its advantages include an easy-to-use interface, extensive data manipulation capabilities, support for diverse data sources, and the ability to create reusable queries.
- Power Query simplifies data preparation, ensuring clean and structured data for analysis in Power BI. Its usage enables efficient data integration and enhances the overall data analysis process.
Power Pivot
- Power Pivot is a data modeling and analysis tool within Power BI. It allows users to create advanced data models by combining and relating multiple tables from various sources.
- Its advantages include the ability to handle large volumes of data, create complex calculations, and perform sophisticated data analysis.
- Power Pivot enables users to create powerful relationships between tables, define custom measures and calculations, and build interactive reports and dashboards. It is widely used for creating advanced and dynamic data models for in-depth analysis and reporting within Power BI.
- Power Pivot also introduces the concept of Data Analysis Expressions (DAX), a formula language that allows users to create calculated columns, measures, and sophisticated calculations. DAX provides various functions and operators to perform calculations, aggregations, and time intelligence operations.
Power View
- Power View is a data visualization component in Power BI. It enables users to create interactive and visually appealing reports and dashboards. Power View allows users to easily explore and analyze data through interactive charts, graphs, and maps. It is also available with other Microsoft products like Excel, SharePoint, and SQL Server.
- Its advantages include intuitive design capabilities, seamless integration with other components of Power BI, and the ability to create dynamic and interactive visualizations.
- Power View is used to communicate insights effectively, enabling data-driven decision-making. Its features include drag-and-drop functionality, interactive filtering, and support for a wide range of visual elements.
Power Map
- Power Map is a 3D data visualization tool available within Power BI. It allows users to plot data on an interactive globe or custom map, providing a unique perspective for data exploration and storytelling.
- With Power Map, users can map geographical and temporal data onto a 3D visualization, allowing for visual analysis of patterns, trends, and correlations across locations and time periods.
- It enables users to discover valuable insights that are not apparent in traditional 2D maps. Power Map adds a visually immersive experience to data analysis, making it easier to identify spatial relationships and gain insights from geospatial data.
Power BI Desktop
- Power BI Desktop is a comprehensive authoring tool within the Power BI ecosystem. It is an application that users can install on their local computers, allowing them to create interactive reports, data visualizations, and dashboards. With Power BI Desktop, users can connect to various data sources, perform data transformations, and build compelling visualizations using a drag-and-drop interface.
- It offers a wide range of powerful features, including data modeling, advanced calculations, custom visuals, and the ability to create relationships between different data tables.
- Power BI Desktop provides a robust environment for data exploration, analysis, and report creation, empowering users to derive meaningful insights from their data.
Power Q&A
- Power Q&A is a natural language query feature within Power BI that allows users to ask questions about their data using everyday language. It utilizes advanced natural language processing capabilities to understand the intent behind the questions and generates visualizations and insights based on the data available.
- With Power Q&A, users can type or speak queries in plain language and get instant answers through interactive charts, tables, and visualizations.
- It enables users to explore data intuitively without the need for complex queries or data modeling knowledge. Power Q&A enhances self-service analytics by providing a user-friendly way to quickly interact with data and uncover insights.
Power BI Website
- The Power BI website serves as the cloud-based hub for sharing, publishing, and collaborating on Power BI content. It is a central platform where users can access and interact with Power BI reports, dashboards, and datasets.
- The Power BI website offers a user-friendly interface for creating and organizing workspaces, managing data connections, and scheduling data refreshes.
- Additionally, the Power BI website provides a marketplace for discovering and downloading custom visuals and connecting to various data sources. It is a comprehensive online platform for managing, sharing, and exploring Power BI content across individuals and teams.
Power BI Mobile Apps
- Power BI Mobile Apps are companion applications that allow users to access and interact with Power BI reports and dashboards on mobile devices. Available for iOS and Android, these apps provide a seamless and responsive experience for mobile data analysis and visualization.
- With Power BI Mobile Apps, users can view, explore, and share reports on the go, enabling real-time access to critical business insights. The apps offer touch-optimized interactions, including pinch-to-zoom, swipe, and drill-through functionalities, making navigating and exploring data on smaller screens easy.
- Power BI Mobile Apps ensure that users stay connected to their data and make informed decisions anytime, anywhere.